A LinkedIn Ads report for B2B SaaS lead generation should include the following metrics and details:
1. Campaign Name and ID
2. Ad Name and ID
3. Ad Format
4. Objective
5. Date
6. Impressions
7. Reach
8. Frequency
9. Clicks
10. Click-Through Rate (CTR)
11. Cost Per Click (CPC)
12. Ad Spend
13. Leads
14. Cost Per Lead (CPL)
15. Conversion Rate
16. Cost Per Conversion
17. Engagement Rate
18. Video Views (if applicable)
These elements provide a comprehensive overview of the campaign’s performance and effectiveness in generating leads.
To analyze LinkedIn Ads data, focus on key metrics relevant to your campaign objectives, especially for B2B and SaaS lead generation. Here’s a structured approach:
1. **Impressions and Reach**: Evaluate how many people saw your ads and the unique reach to understand the potential audience size.
2. **Clicks and CTR (Click-Through Rate)**: Measure engagement by analyzing the number of clicks and the CTR. A higher CTR indicates effective ad content.
3. **Ad Spend and CPC (Cost Per Click)**: Monitor your budget and spending efficiency. CPC helps assess the cost-effectiveness of driving traffic.
4. **Leads and CPL (Cost Per Lead)**: Track the number of leads generated and calculate CPL to evaluate the cost efficiency of acquiring leads.
5. **Conversion Rate and Cost Per Conversion**: Determine how well your ads convert leads into customers and the associated costs.
6. **Engagement Rate**: Analyze how users interact with your ads beyond clicks, such as likes, shares, and comments.
7. **Frequency**: Check how often your ads are shown to the same users to avoid ad fatigue.
8. **Video Views**: If using video ads, assess the number of views to gauge content effectiveness.
9. **Campaign and Ad Performance**: Compare different campaigns and ad formats to identify what works best.
10. **Date and Time Analysis**: Look for patterns in performance over time to optimize scheduling.
Use these insights to refine targeting, messaging, and budget allocation for improved campaign performance.
To build a LinkedIn Ads dashboard, follow these steps:
1. **Define Objectives**: Determine the key metrics you want to track, such as impressions, clicks, ad spend, leads, CTR, CPC, CPL, conversion rate, and cost per conversion.
2. **Data Collection**: Use LinkedIn’s Campaign Manager to export data or integrate with a data visualization tool like Google Data Studio, Tableau, or Power BI.
3. **Select Metrics**: Include essential metrics like campaign name, date, campaign ID, ad ID, ad name, ad format, objective, reach, frequency, engagement rate, and video views.
4. **Design Layout**: Organize the dashboard to display metrics clearly. Use charts and graphs to visualize data trends and performance.
5. **Automate Updates**: Set up automated data refreshes to keep the dashboard up-to-date with the latest LinkedIn Ads data.
6. **Analyze and Optimize**: Regularly review the dashboard to identify trends and areas for improvement in your LinkedIn Ads strategy.
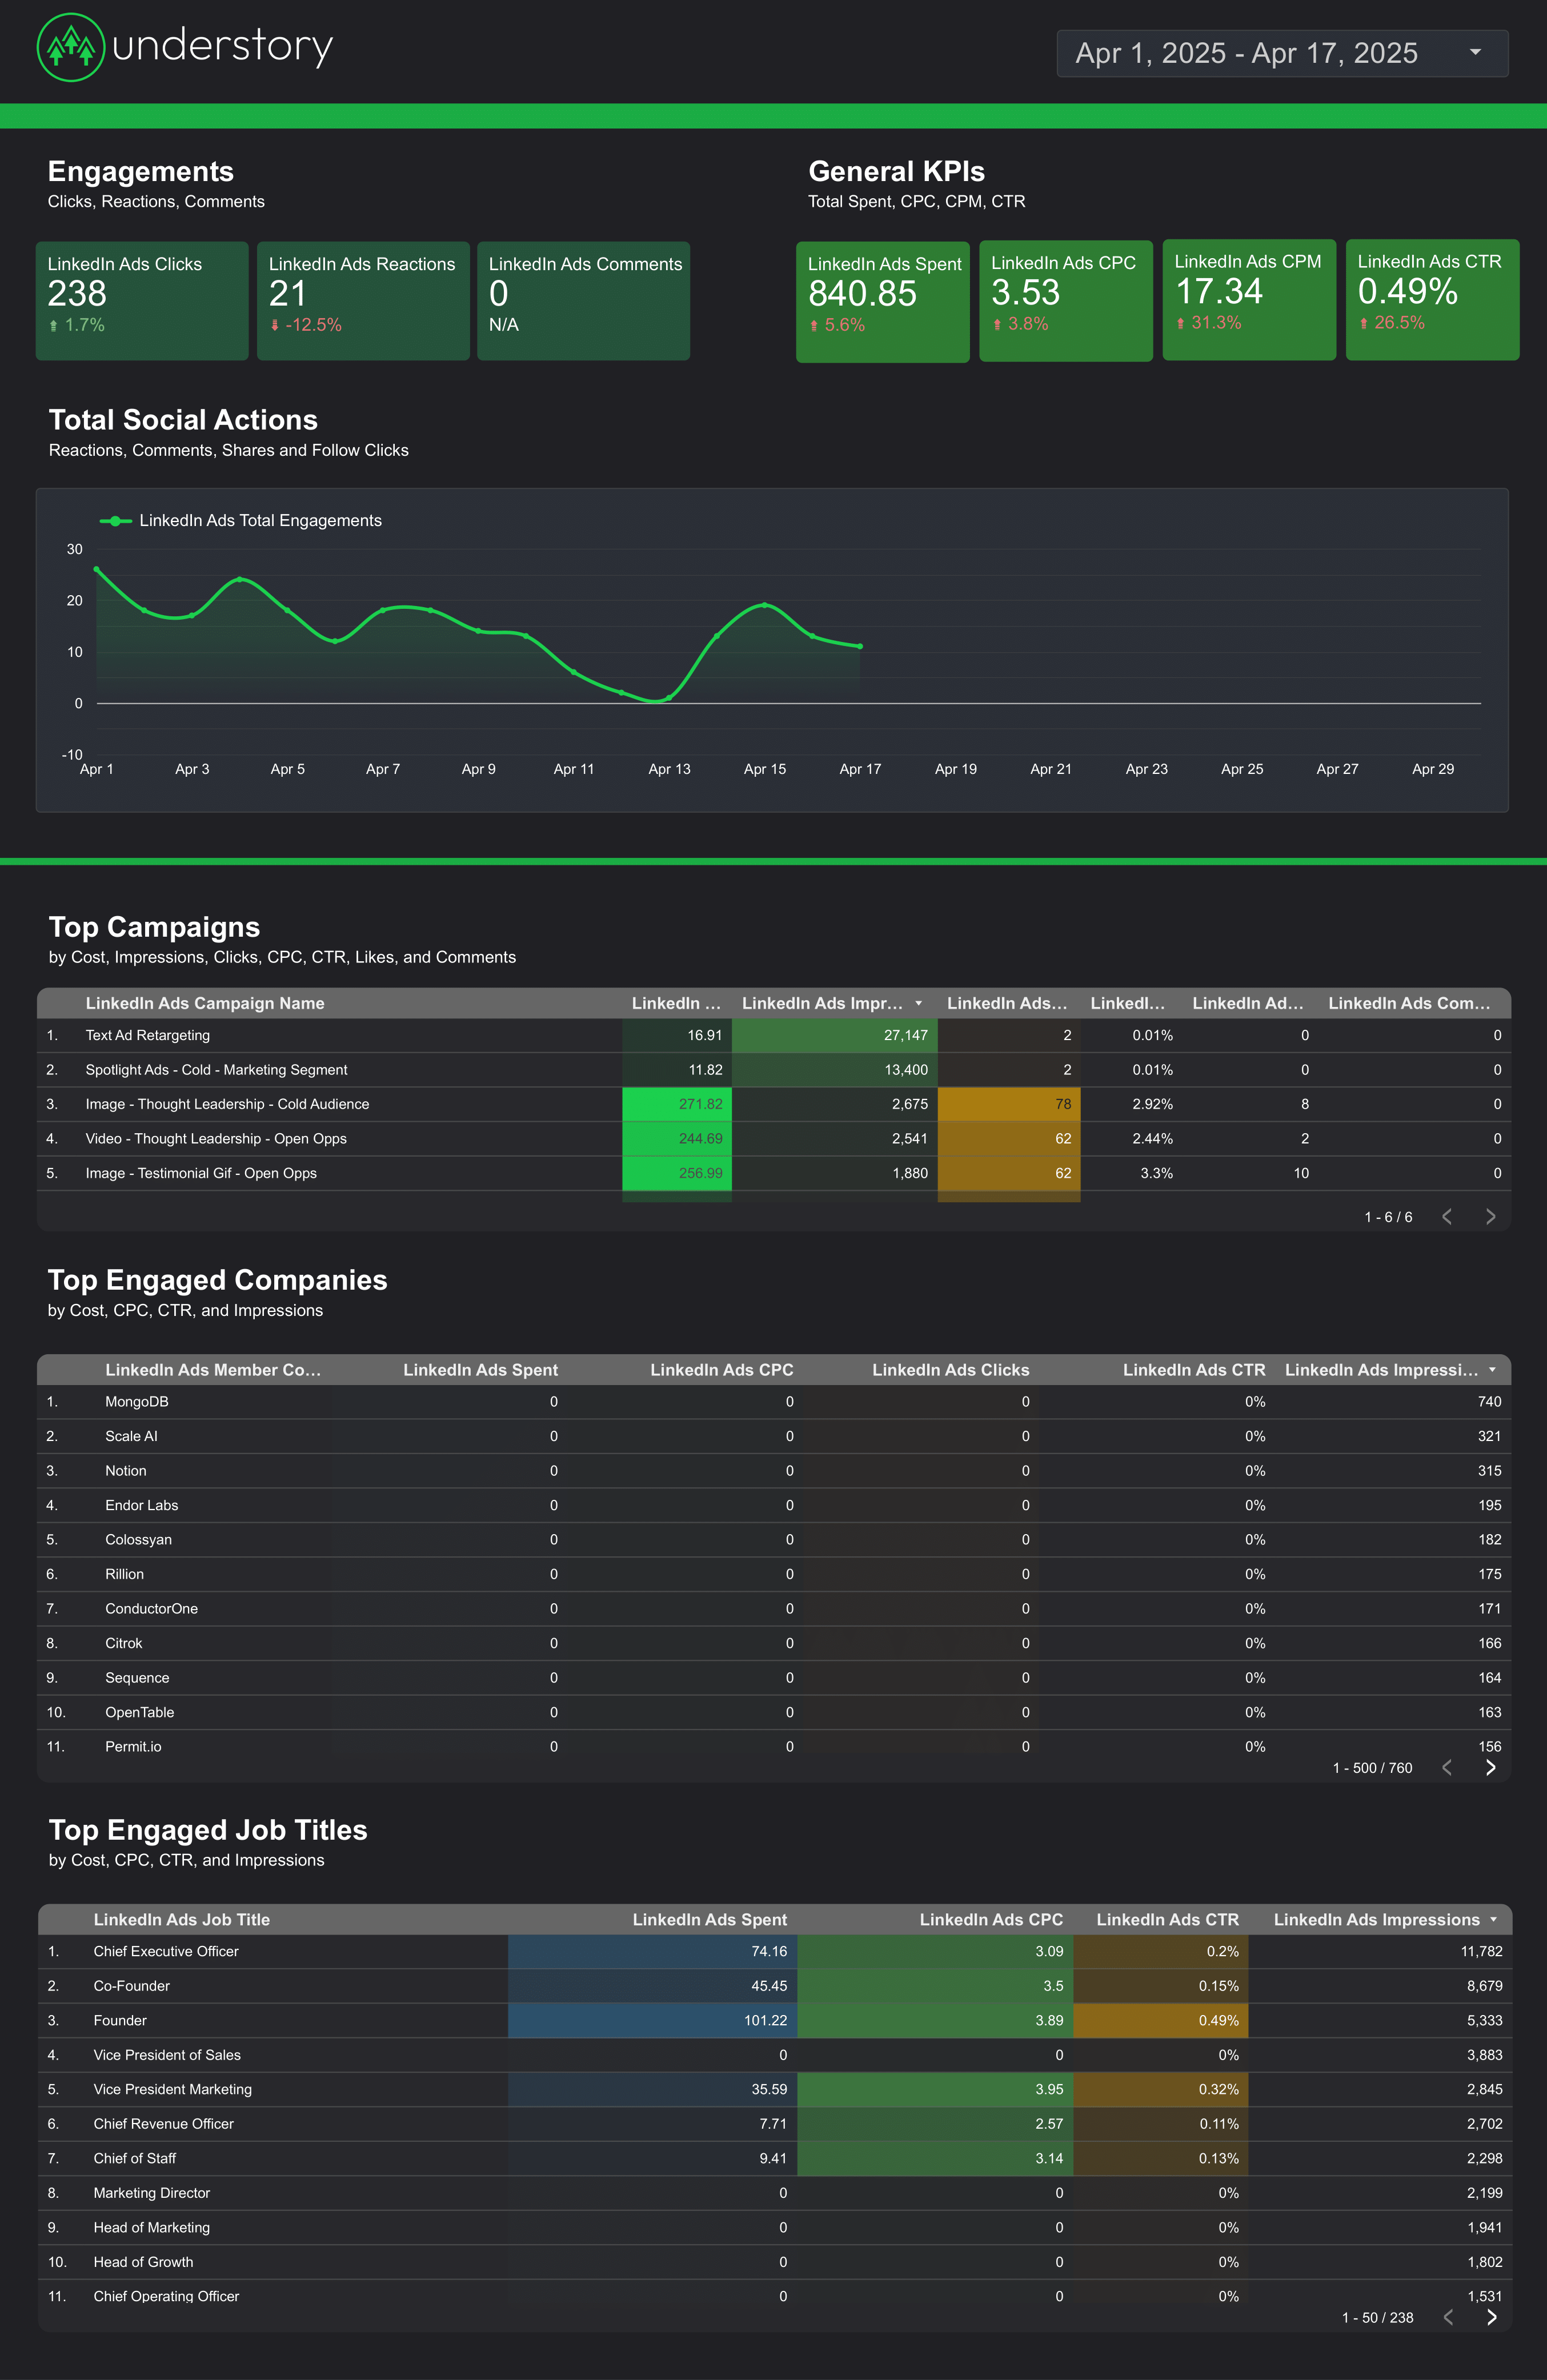
A LinkedIn Ads dashboard is a tool used to track and analyze the performance of advertising campaigns on LinkedIn. It provides metrics such as impressions, clicks, ad spend, leads, click-through rate (CTR), cost per click (CPC), cost per lead (CPL), conversion rate, and more. This dashboard is particularly useful for B2B and SaaS companies focused on lead generation, allowing them to monitor campaign effectiveness and optimize their advertising strategies.
Can I download this template in PDF?


 Impressions
 Ad Spend