A Reels report should include metrics related to visibility, engagement, and conversion. These metrics should be broken down by campaign, channel, audience, content, objective, and date. For visibility, include metrics like impressions, reach, and views. For engagement, include metrics like likes, comments, and shares. For conversion, include metrics like click-through rates and conversions. For example, the report could show how a specific Reels campaign performed across different channels, audiences, and objectives, providing insights into which content was most effective in terms of visibility, engagement, and conversions.
To analyze Reels data, 1) choose visibility metrics such as impressions, reach, and average view duration; engagement metrics like likes, comments, and shares; and conversion metrics such as click-through rate and conversion rate. 2) Compare these metrics against the cost of running the Reels campaign, date range (e.g., weekly or monthly), overall goals (e.g., increase brand awareness), industry rates, and benchmarks. For example, analyze how the number of impressions and reach compares to the budget spent and expected results. 3) Segment data by campaign, channel (Instagram), audience demographics, content type (e.g., DIY videos), objective (e.g., generate leads), and date to identify which factors drive the highest visibility, engagement, and conversion. For instance, compare Reels promoting a new product versus educational content to see which performs better in terms of engagement metrics.
To build an Instagram Reels dashboard, 1) connect your Instagram account and any related data sources. 2) Choose metrics such as views, likes, comments, shares, and reach to monitor performance. 3) Segment data by individual Reels, posting time, audience demographics, and content type. 4) Add filters for date ranges or specific content types to make your report interactive. 5) Share your dashboard via PDF, scheduled emails, or direct links.
An Instagram Reels dashboard is a visual representation of key metrics and data related to Instagram Reels performance. It is significant for businesses as it helps them track engagement, reach, and effectiveness of their Reels, aiding in data-driven decision making. Tools like Looker Studio are commonly used to create such dashboards, which typically include elements like views, likes, comments, shares, and saves. Real-time data monitoring is crucial as it allows businesses to react promptly to trends or issues. For learning how to create a marketing dashboard using Looker Studio, refer to our YouTube channel: https://www.youtube.com/@porter.metrics.
Can I download this template in PDF?


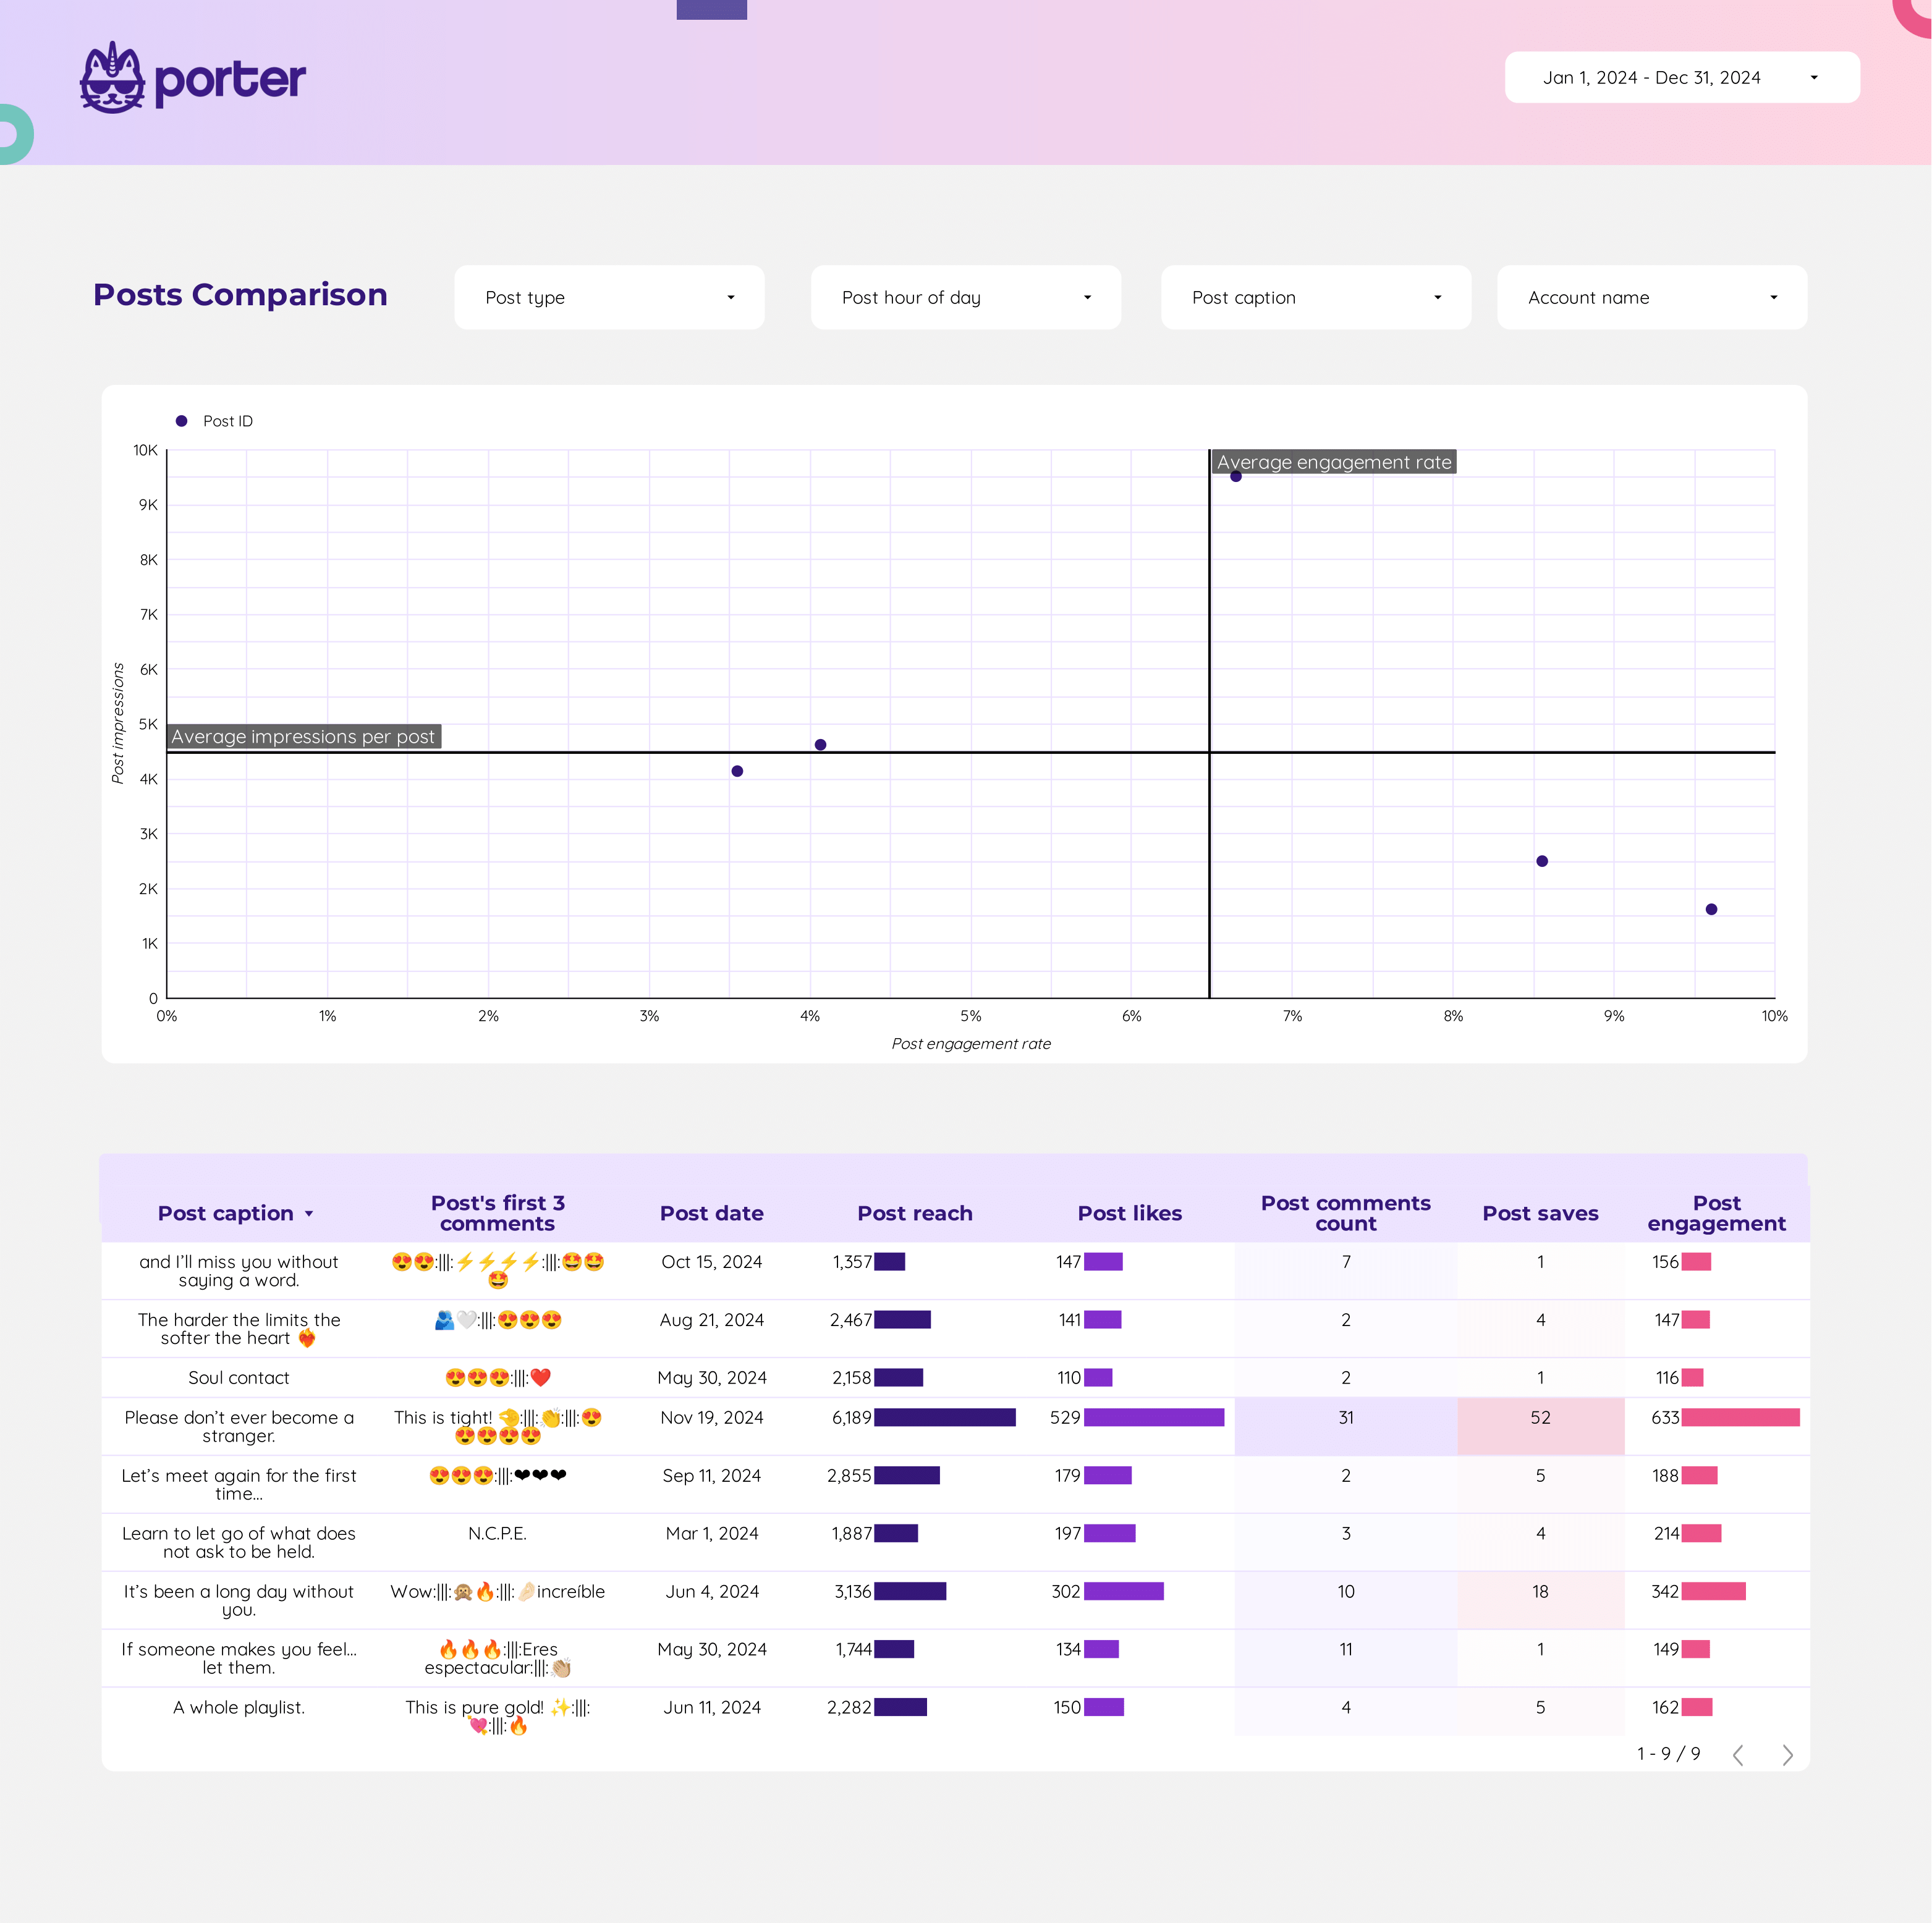
 Impressions
 Engagement Rate