An Instagram Insights Audience report should include the following elements:
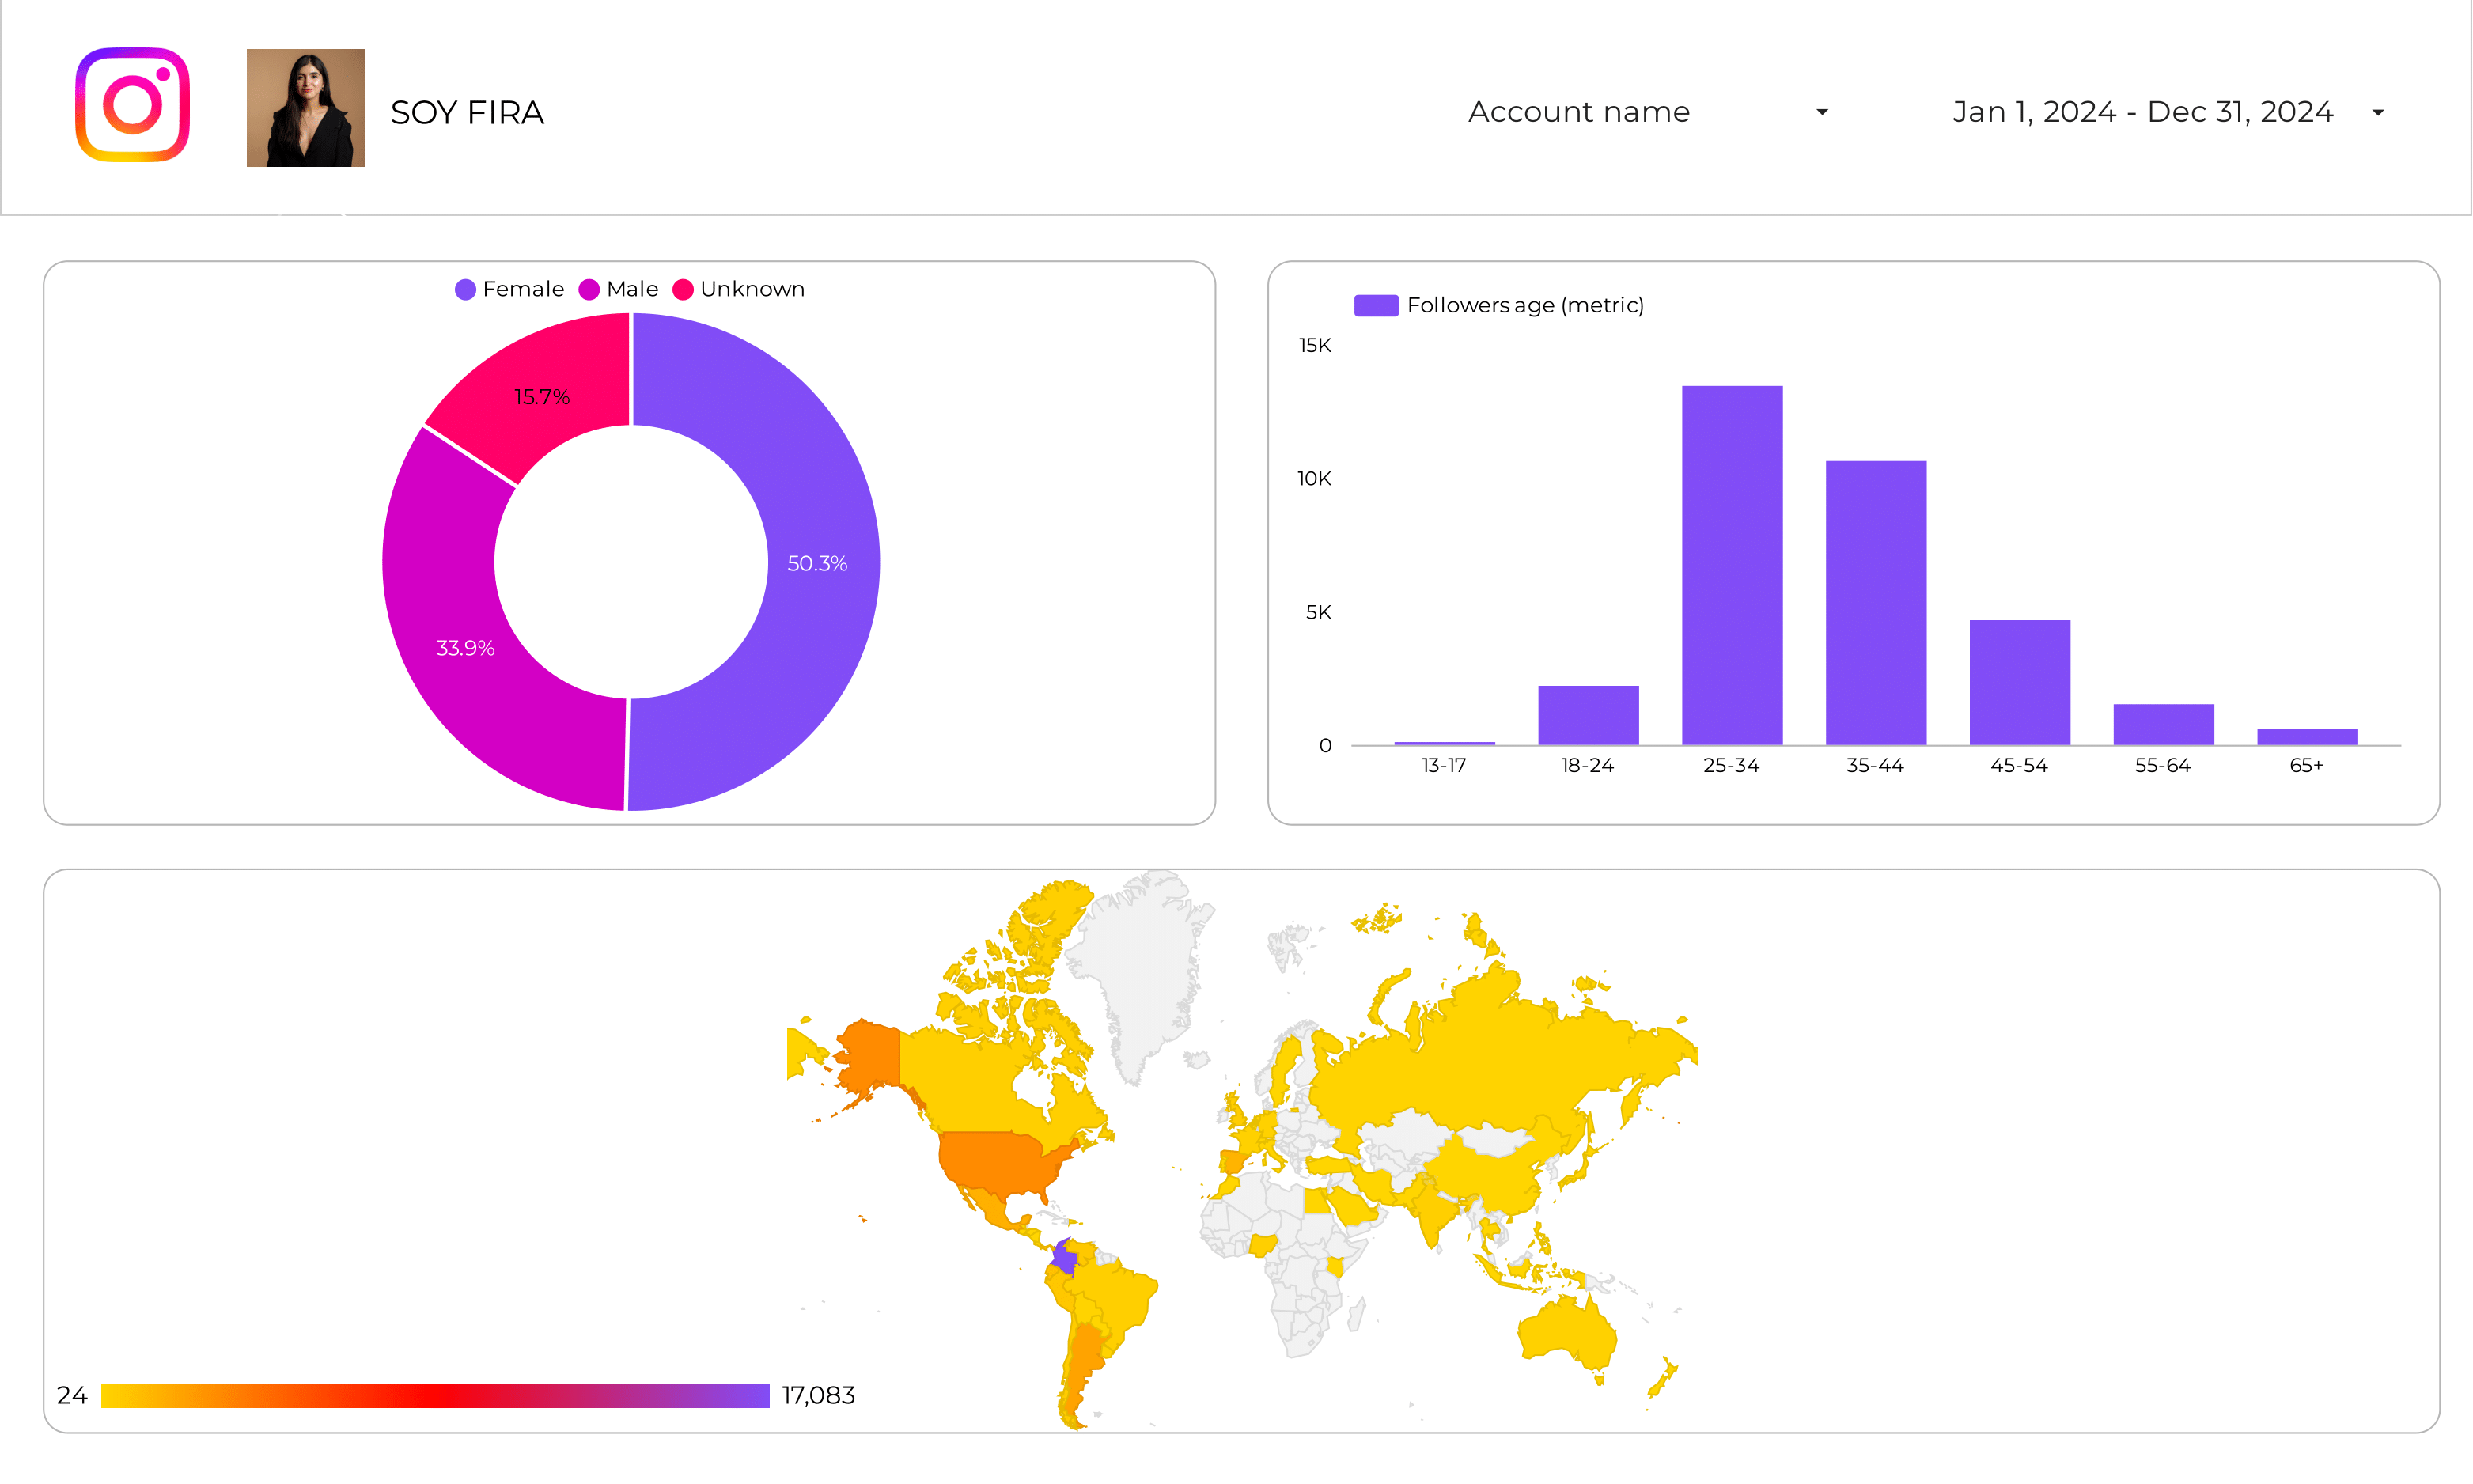
1. Audience Location: Geographic distribution of your followers.
2. Audience Age: Age demographics of your audience.
3. Audience Gender: Gender breakdown of your followers.
4. Followers: Total number of followers and growth over time.
5. Engagement Rate: Interaction level of your audience with your content.
6. Impressions: Total number of times your content was displayed.
7. Reach: Number of unique accounts that have seen your content.
8. Profile Views: Number of times your profile was viewed.
9. Likes, Comments, Shares, Saves: Engagement metrics for your posts.
10. Post Type and Post Time: Types of posts and the timing of their publication.
To analyze Instagram Insights Audience data, focus on the following key metrics:
1. **Audience Demographics**: Examine the age, gender, and location of your audience to understand who is engaging with your content. This helps tailor content to your audience’s preferences.
2. **Followers Growth**: Track changes in your follower count over time to assess the effectiveness of your content and campaigns.
3. **Engagement Rate**: Calculate the engagement rate by dividing the total engagement (likes, comments, shares) by the number of followers. This indicates how well your content resonates with your audience.
4. **Reach and Impressions**: Analyze reach (unique views) and impressions (total views) to understand the visibility of your posts. High reach with low engagement may suggest a need for more engaging content.
5. **Profile Views and Clicks**: Monitor profile views and link clicks to gauge interest in your profile and external links.
6. **Content Performance**: Evaluate which types of posts (images, videos, stories) perform best in terms of engagement and reach.
By regularly reviewing these metrics, you can refine your content strategy to better meet the needs and interests of your audience.
To build an Instagram Insights Audience dashboard, follow these steps:
1. **Data Collection**: Gather data from Instagram Insights, focusing on metrics such as Impressions, Clicks, Followers, Engagement Rate, Reach, Profile Views, Likes, Comments, Shares, Saves, Post Type, Post Time, Audience Location, Audience Age, and Audience Gender.
2. **Data Organization**: Use a tool like Airtable to create a base where you can input and organize this data. Create fields for each metric and ensure data is consistently updated.
3. **Visualization**: Use a dashboard tool like Google Data Studio or Tableau to visualize the data. Connect your Airtable base to the dashboard tool.
4. **Dashboard Design**: Design the dashboard to display key metrics prominently. Use charts and graphs to represent data trends over time. Include filters for different audience segments like location, age, and gender.
5. **Analysis and Insights**: Regularly analyze the dashboard to gain insights into audience behavior and engagement. Use these insights to inform your social media strategy.
6. **Updates and Maintenance**: Keep the dashboard updated with the latest data to ensure accuracy and relevance. Regularly review and refine the dashboard layout and metrics as needed.
The Instagram Insights Audience dashboard provides detailed analytics about your followers and audience on Instagram. It includes data on audience demographics such as location, age, and gender, as well as metrics like impressions, reach, engagement rate, and follower growth. This dashboard helps users understand their audience better and tailor their content strategy accordingly.
Can I download this template in PDF?


 Impressions
 Followers