A Google Search Console report should include broken down metrics by visibility (i.e., impressions, clicks), engagement (i.e., average position, click-through rate), and conversion metrics (i.e., conversions, conversion rate). The data should be segmented by campaign, channel, audience, content, objective, and date. For example, you might want to analyze the performance of a specific campaign, across different channels, targeting different audience segments, with varying content types, to achieve different objectives, over a defined time period.
To analyze Google Search Console data, follow these steps:
1) Choose metrics like impressions and clicks for visibility, bounce rate and time on page for engagement, and goal completions and conversion rate for conversion metrics.
2) Add context by comparing metrics against previous date ranges, cost per click, and goals. Benchmark the data against industry standards to identify areas for improvement.
3) Segment the data by campaign, channel (organic search, paid search), audience demographics, content type (blog posts, landing pages), objectives (lead generation, e-commerce), and specific date ranges. For example, compare the bounce rates of different landing pages or analyze conversion rates by age groups.
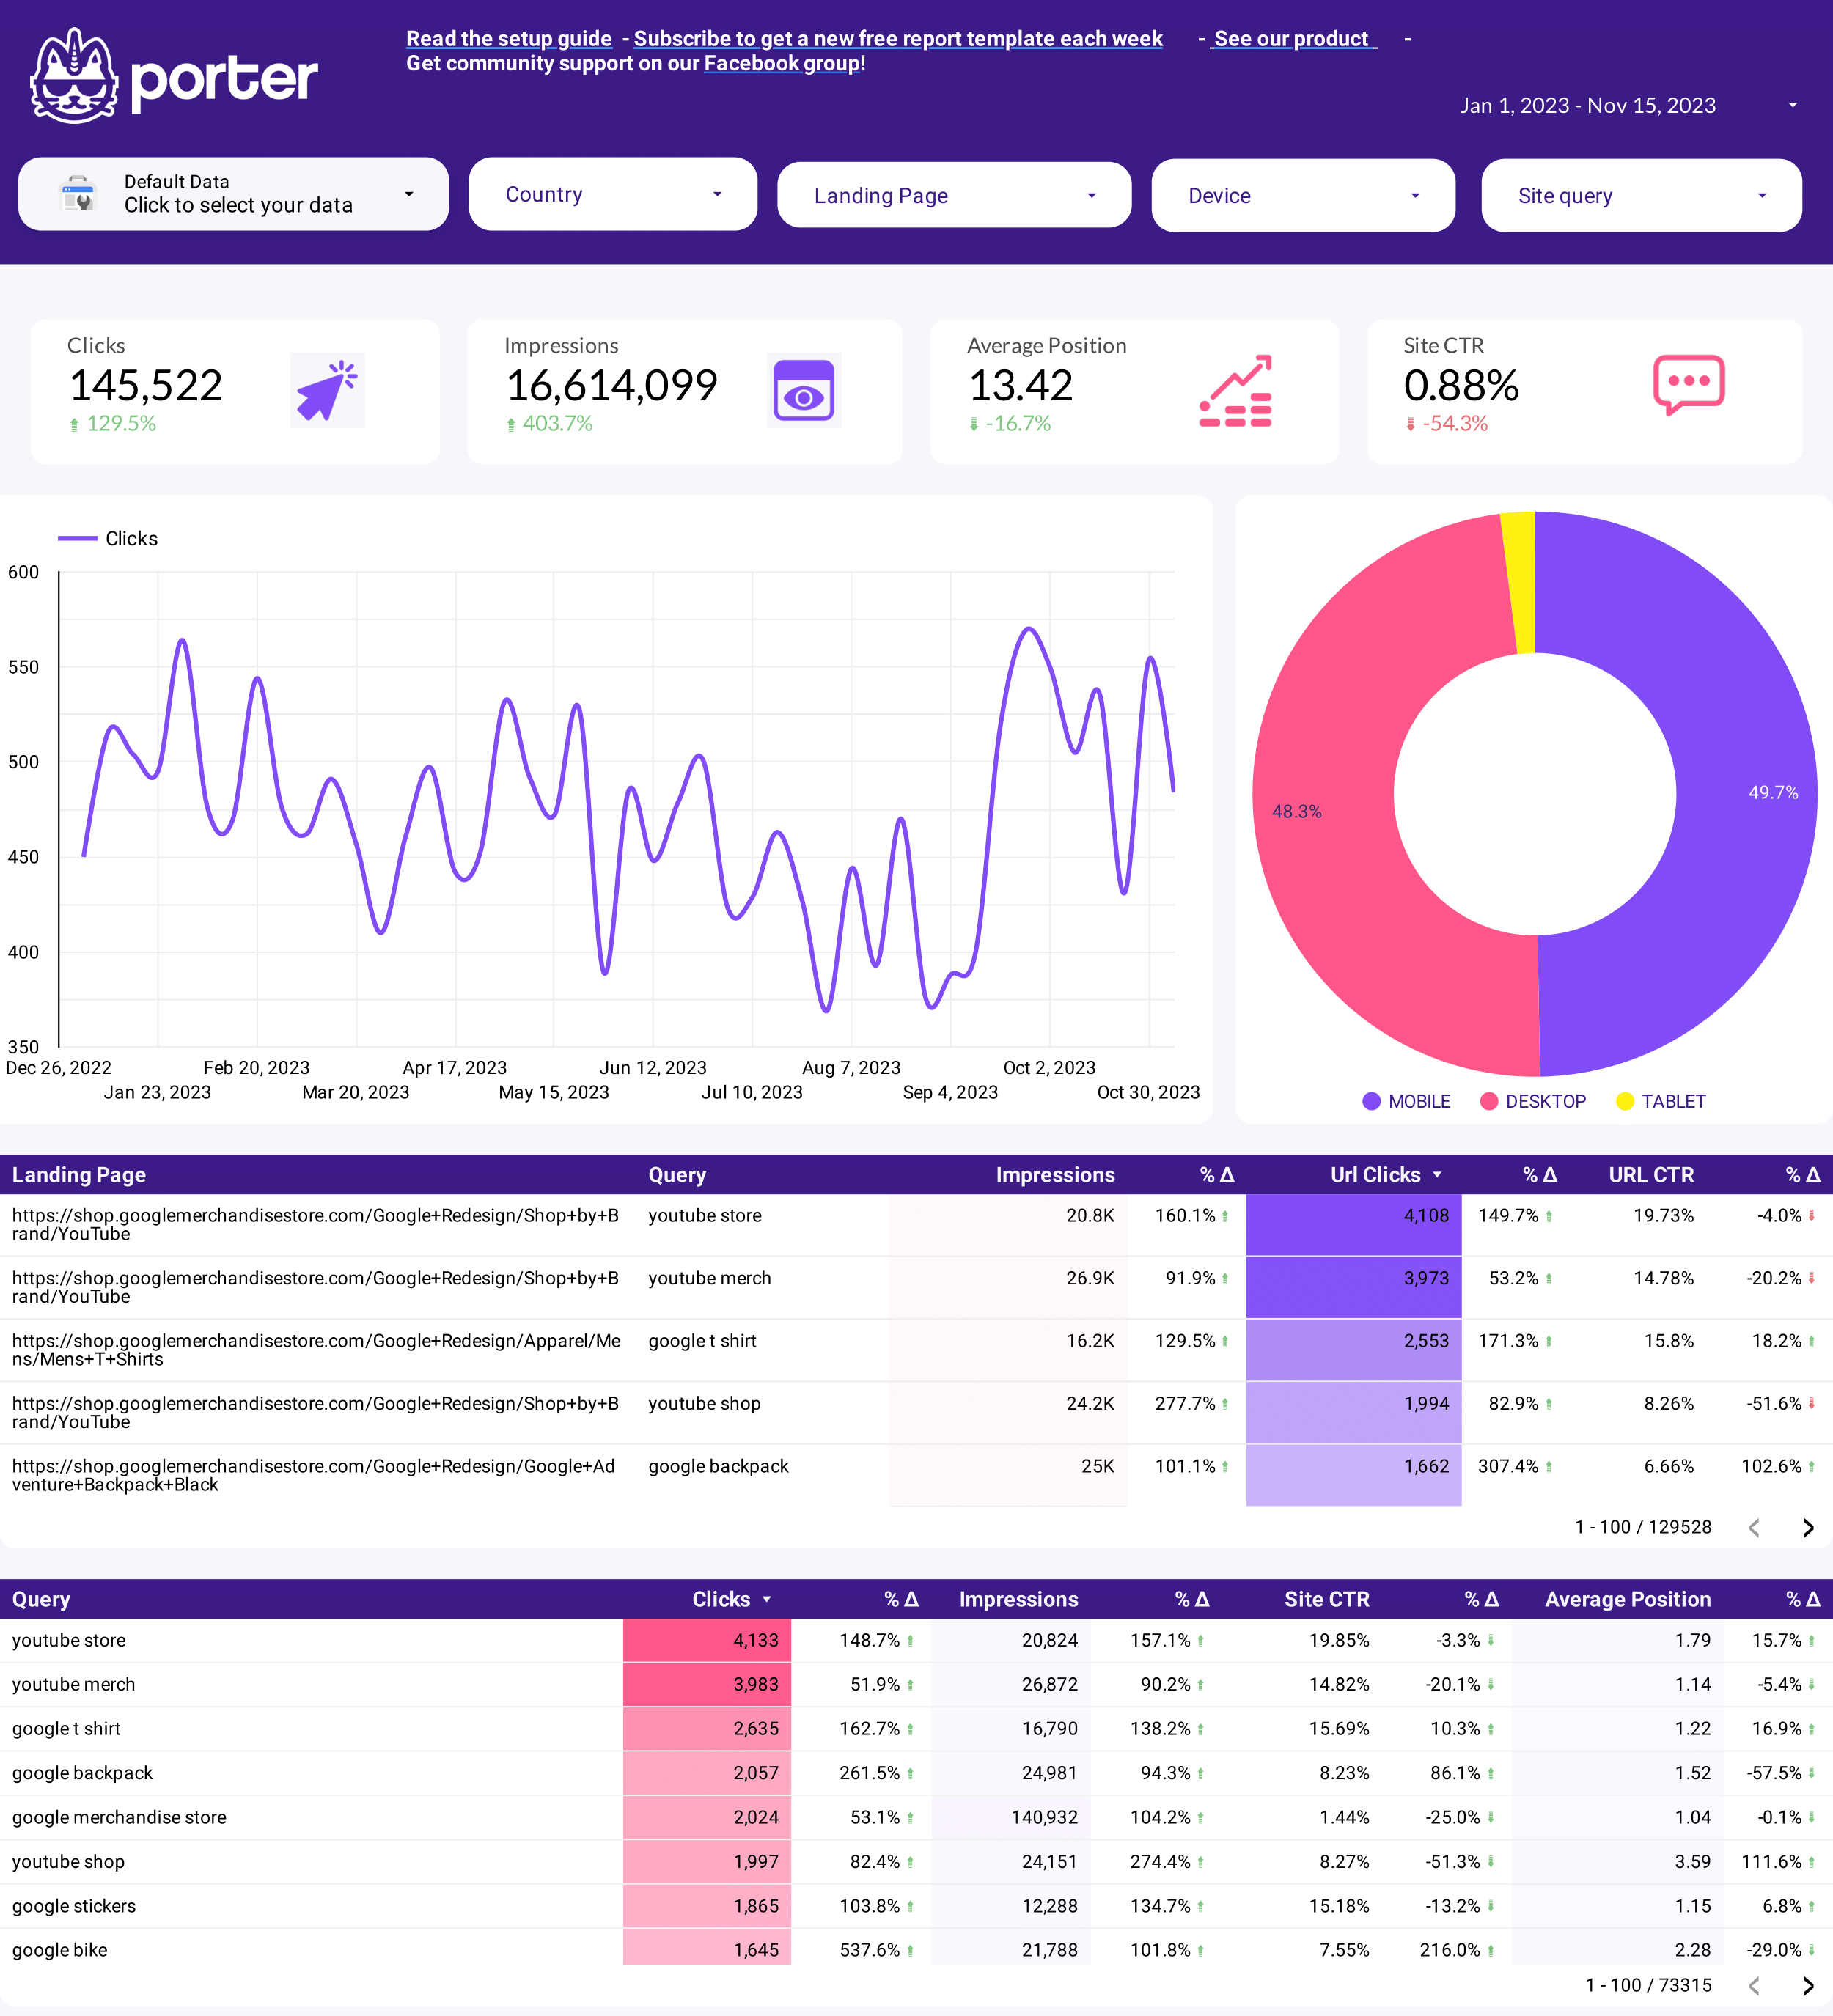
To build a Google Search Console dashboard, 1) connect your Google Search Console account and import your data. 2) Select metrics such as click-through rate, impressions, and position to monitor performance. 3) Segment your data by queries, pages, countries, devices, search appearance, and dates. 4) Add filters to view specific data ranges or compare data sets, making your report interactive. 5) Share your dashboard via PDF, scheduled emails, or links for easy access and review.
A Google Search Console dashboard is a tool that visualizes and organizes data from Google Search Console, providing insights into a website’s search engine performance. It is significant for businesses as it helps in tracking key metrics like organic search traffic, click-through rates, and keyword rankings, aiding in SEO strategy. Tools like Looker Studio are commonly used to create these dashboards, which typically include elements like total clicks, impressions, average CTR, and position. Real-time data monitoring is crucial as it allows businesses to react quickly to changes and optimize their strategies. For learning how to create a marketing dashboard using Looker Studio, refer to our YouTube channel: https://www.youtube.com/@porter.metrics.
Yes, Looker Studio allows you to download your report as a PDF. To do it, follow these steps:
Before downloading your report choose the date range you want to visualize on your report.
Click on the “File” menu at the top left corner of the screen.
Select “Download as” from the drop-down menu and choose “PDF.”
You can choose which pages you want to download, and also you can add a password to protect the report and add a link back to the online report.
Click on “Download” to save the report on your device.
 Google Search Console
 Impressions

