A Google Ads report should include metrics such as conversion metrics like Conversion Rate, Cost Per Conversion, and Conversion Value; engagement metrics like Click-Through Rate (CTR), Engagement Rate, and Bounce Rate; and visibility metrics. Such data should be segmented and filtered by campaign dimensions like Campaign Type, Audience Segments, and Ad Content; audience details like Audience Type, Campaign Name, and Ad Group Name; and time periods like by hour, day, week, month, quarter, or year. Once the data is ready, make sure to add buttons and filters to make your reports interactive, use custom colors and logos to make it white-label, and share via link, PDF, or email so your teams or clients can access it.
To analyze Google Ads data, start by measuring the cost and revenue metrics attributed to Google Ads in PPC. This involves examining the cost-per-click (CPC), total ad spend, and the revenue generated from these ads. By comparing these metrics, you can determine the return on ad spend (ROAS) and assess the overall profitability of your campaigns. This initial step provides a clear picture of the financial performance of your Google Ads efforts.
Then, move backwards down the funnel by measuring the conversion metrics. Analyze the conversion rate, which is the percentage of users who take a desired action after clicking on your ad, such as making a purchase or signing up for a newsletter. Additionally, evaluate the cost per conversion to understand how much you are spending to acquire each customer. These metrics help in understanding the effectiveness of your ads in driving valuable actions from users.
Next, delve into the engagement metrics to gain insights into user interactions with your ads. Look at metrics such as click-through rate (CTR), which indicates how often people click on your ad after seeing it. A high CTR suggests that your ad is relevant and engaging to your audience. Also, consider the bounce rate and average session duration on your landing pages to assess the quality of traffic being driven by your ads.
Finally, analyze audience and targeting data to refine your ad strategy. Examine demographic and geographic data to understand who is interacting with your ads and where they are located. Use this information to adjust your targeting settings and ensure your ads are reaching the most relevant audience. Additionally, review keyword performance to identify which search terms are driving the most traffic and conversions, allowing you to optimize your keyword strategy for better results.
To build a Google Ads report, start by connecting your PPC accounts, such as Google Ads, to platforms like Google Sheets or Google Looker Studio. These tools allow you to import and organize your advertising data efficiently, providing a solid foundation for your report.
Next, select the key metrics you want to monitor to assess performance. Important metrics include Conversion Rate, Cost Per Conversion, Conversion Value, Click-Through Rate (CTR), Engagement Rate, and Bounce Rate. These metrics will help you understand how well your campaigns are performing and where improvements can be made.
Once you have your metrics, segment or break down the data by various dimensions such as campaign, channel, audience, product, customer content, objective, and date. For example, you can segment data by Campaign Type, Audience Segments, Ad Content, Audience Type, Campaign Name, Ad Group Name, or by time periods like hour, day, week, month, quarter, or year. This segmentation allows for a more detailed analysis and helps identify trends and patterns.
To enhance the usability of your report, add filters or interactive buttons. These can include options to filter by date range or user demographics, making it easier for stakeholders to focus on specific data points relevant to their interests or responsibilities.
Finally, share your dashboard with relevant stakeholders. You can do this by exporting the report as a PDF, scheduling regular email updates, or providing direct links to the dashboard. This ensures that everyone involved has access to the latest insights and can make informed decisions based on the data presented.
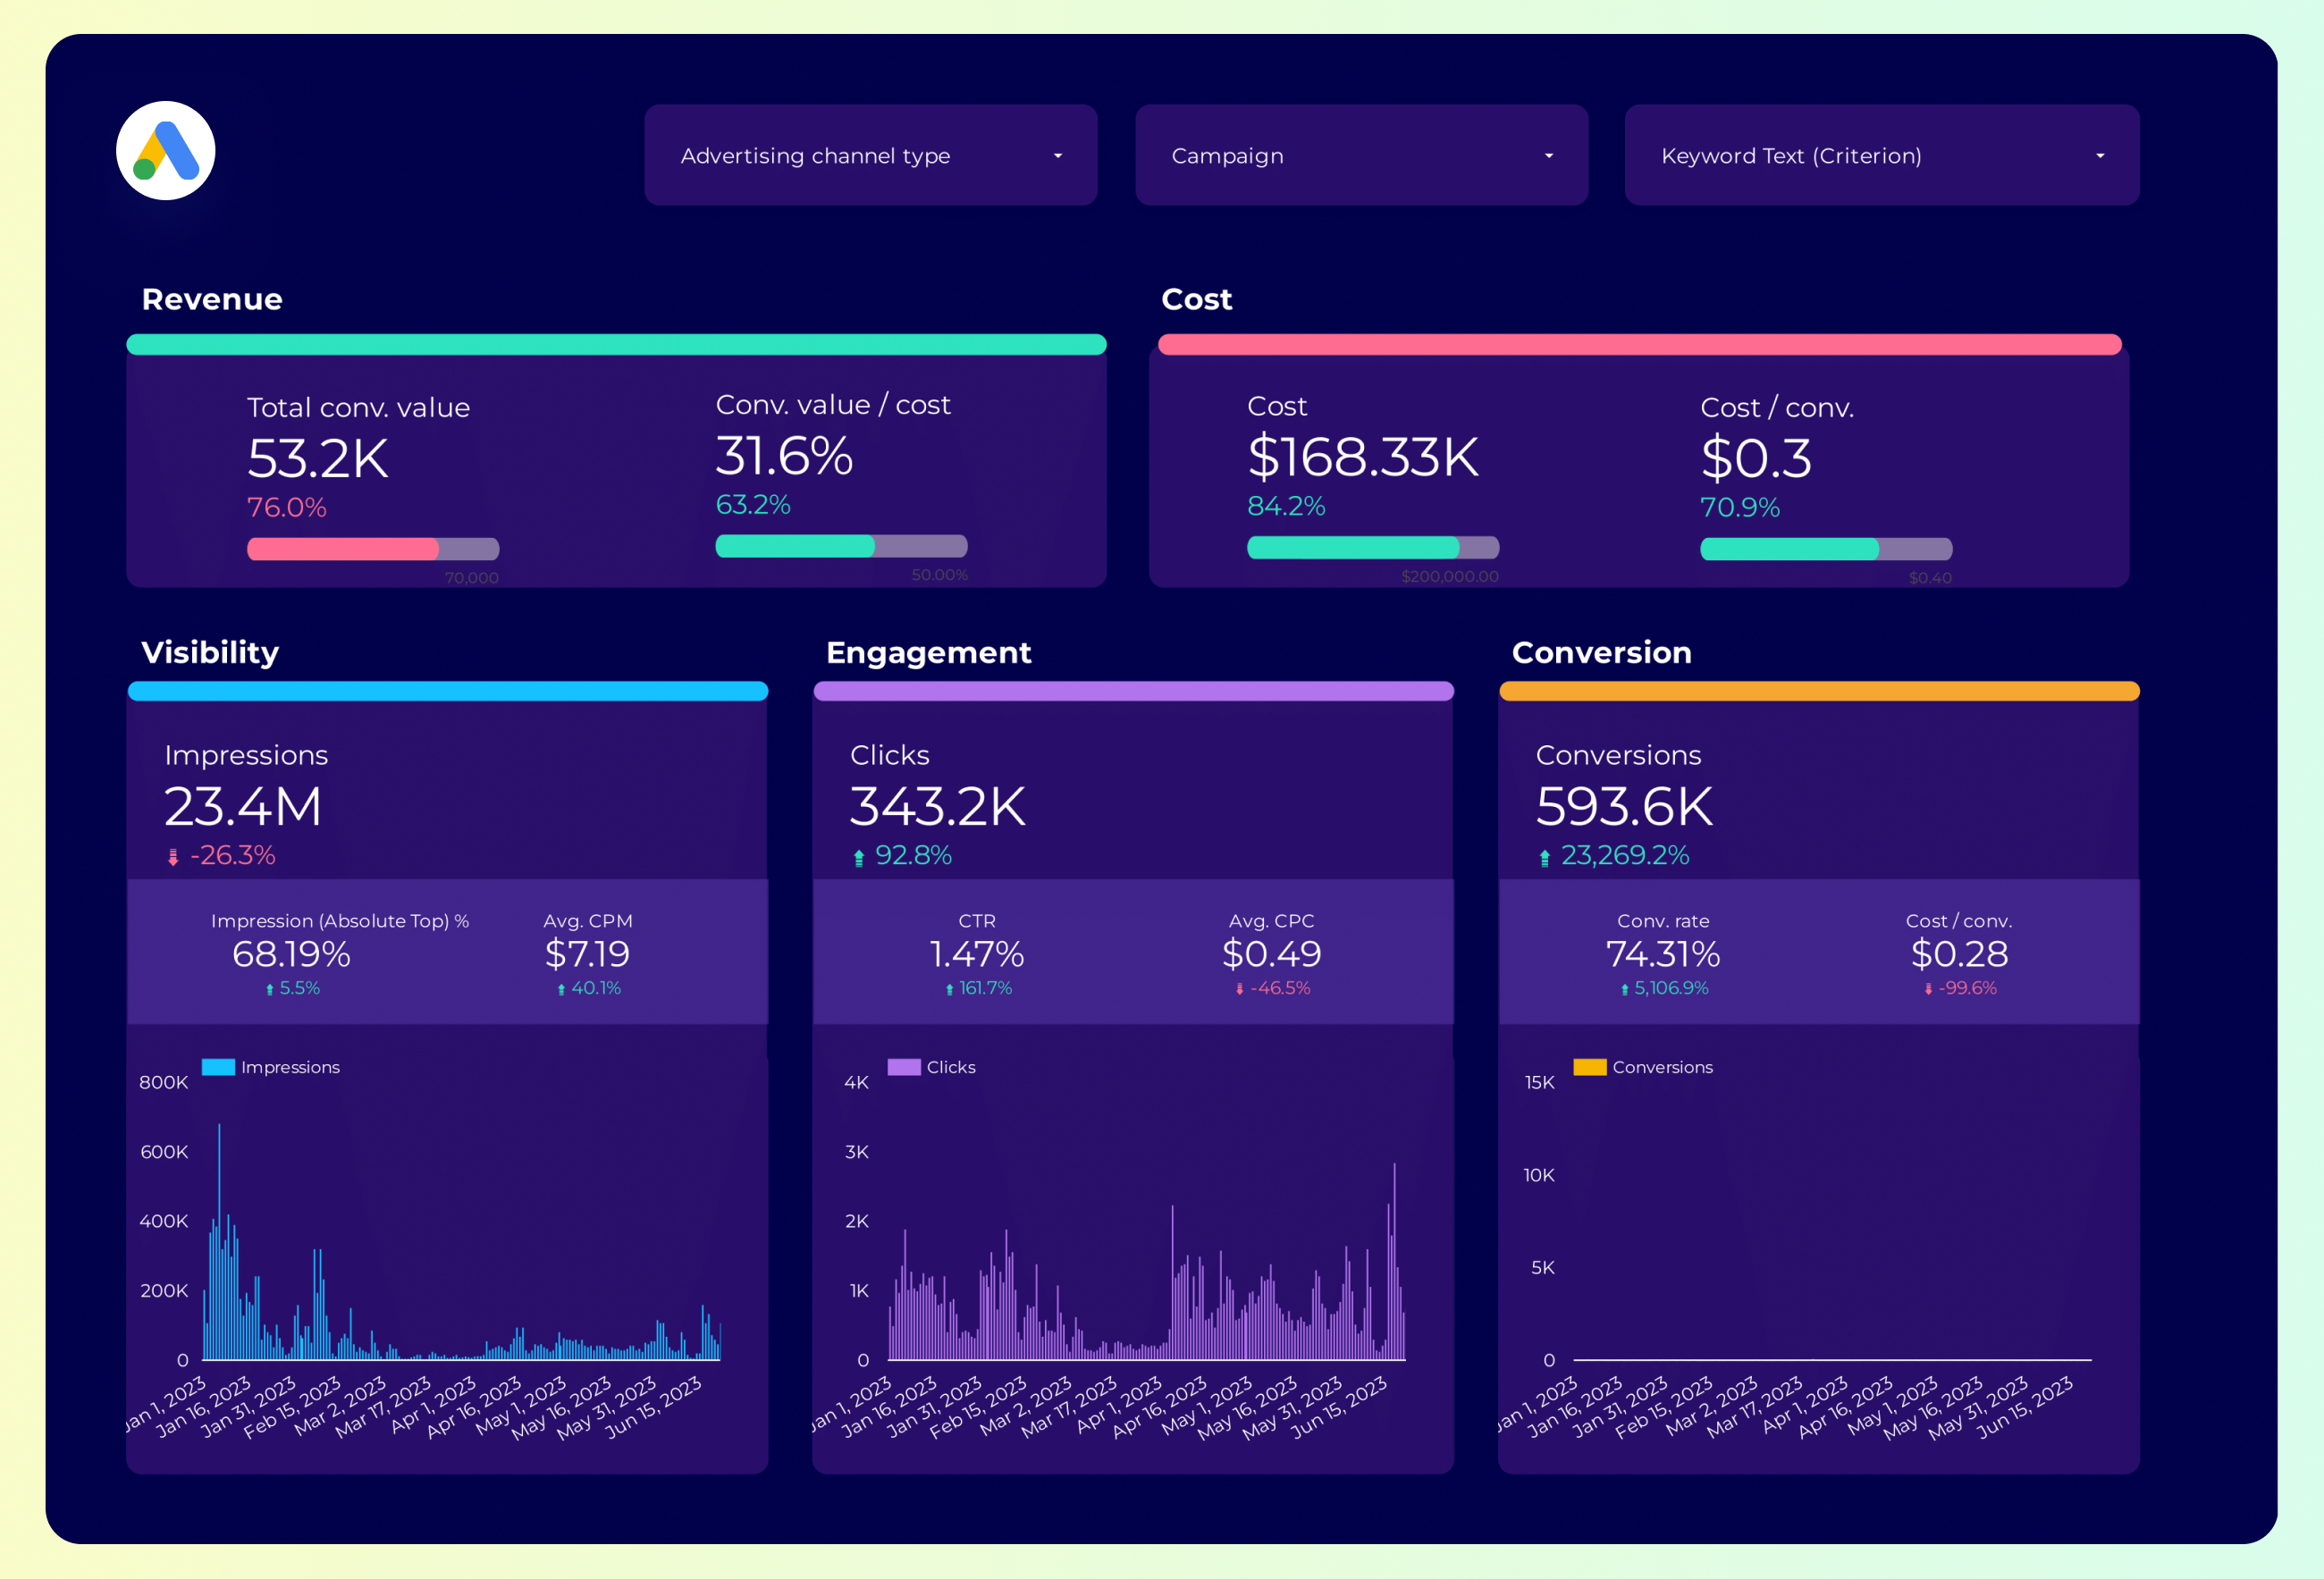
A Google Ads dashboard is a visual tool that organizes and displays key advertising metrics from Google Ads. It helps users track and analyze campaign performance by presenting data such as conversion rates, cost per conversion, click-through rates, and more. Dashboards can be customized with filters and interactive elements to focus on specific data points, making it easier for stakeholders to access insights and make informed decisions.
Can I download this template in PDF?


 Impressions
 Ad Spend