A Google Ads pMax campaigns report should include metrics such as conversion metrics like Conversion Value, Conversion Rate, and Cost per Conversion; engagement metrics like Click-Through Rate (CTR), Engagement Rate, and Interaction Rate; and visibility metrics. Such data should be segmented and filtered by campaign dimensions like Campaign ID, Audience Segment, and Asset Group; audience dimensions like Audience Segment, Campaign Type, and Content Label; and time dimensions like by hour, day, week, month, quarter, or year. Once the data is ready, make sure to add buttons and filters to make your reports interactive, use custom colors and logos to make it white-label, and share via link, PDF, or email so your teams or clients can access it.
To analyze Google Ads pMax campaigns data, start by measuring the cost and revenue metrics attributed to Google Ads pMax campaigns in PPC. This involves examining the total spend on these campaigns and comparing it to the revenue generated. Key metrics to focus on include Cost Per Acquisition (CPA), Return on Ad Spend (ROAS), and overall profitability. By understanding these financial metrics, you can assess the efficiency and effectiveness of your pMax campaigns in driving revenue.
Then, move backwards down the funnel by measuring the conversion metrics. This includes analyzing the number of conversions, conversion rate, and the types of conversions (e.g., sales, leads, sign-ups) that are being driven by the pMax campaigns. Understanding these metrics helps in identifying which aspects of the campaign are performing well and which may need optimization. It also provides insights into the customer journey and how effectively the campaigns are converting interest into action.
Next, evaluate the engagement metrics such as click-through rate (CTR), impressions, and clicks. These metrics provide insights into how well the ads are capturing the audience’s attention and driving traffic to your site. A high CTR indicates that the ads are relevant and appealing to the target audience, while a low CTR might suggest the need for adjustments in ad copy or targeting.
Finally, assess the audience and targeting data. Analyze the demographics, locations, and devices of the users interacting with your ads. This information can help refine your targeting strategy to ensure that your ads are reaching the most relevant audience. Additionally, consider using A/B testing to experiment with different ad creatives and targeting options to further optimize performance. By systematically analyzing these aspects, you can gain a comprehensive understanding of your Google Ads pMax campaigns and make informed decisions to enhance their effectiveness.
To build a Google Ads Performance Max (pMax) campaigns report, start by connecting your PPC accounts, such as Google Ads, to platforms like Google Sheets or Google Looker Studio. These tools allow you to import and organize your advertising data efficiently, providing a solid foundation for your report.
Next, select the key metrics you want to monitor to evaluate the performance of your campaigns. Important metrics to consider include Conversion Value, Conversion Rate, Cost per Conversion, Click-Through Rate (CTR), Engagement Rate, and Interaction Rate. These metrics will help you understand how well your campaigns are performing and where improvements might be needed.
Once you have your metrics, segment or break down the data to gain deeper insights. You can segment the data by various dimensions such as Campaign ID, Audience Segment, Asset Group, Campaign Type, and Content Label. Additionally, consider segmenting by time periods like hour, day, week, month, quarter, or year to identify trends and patterns over time.
To enhance the usability of your report, add filters or interactive buttons. This could include options to filter by date range or user demographics, allowing stakeholders to customize the view according to their specific needs and interests.
Finally, share your dashboard with relevant stakeholders. You can do this by exporting the report as a PDF, scheduling regular email updates, or providing direct links to the dashboard. This ensures that everyone involved has access to the latest data and insights, facilitating informed decision-making.
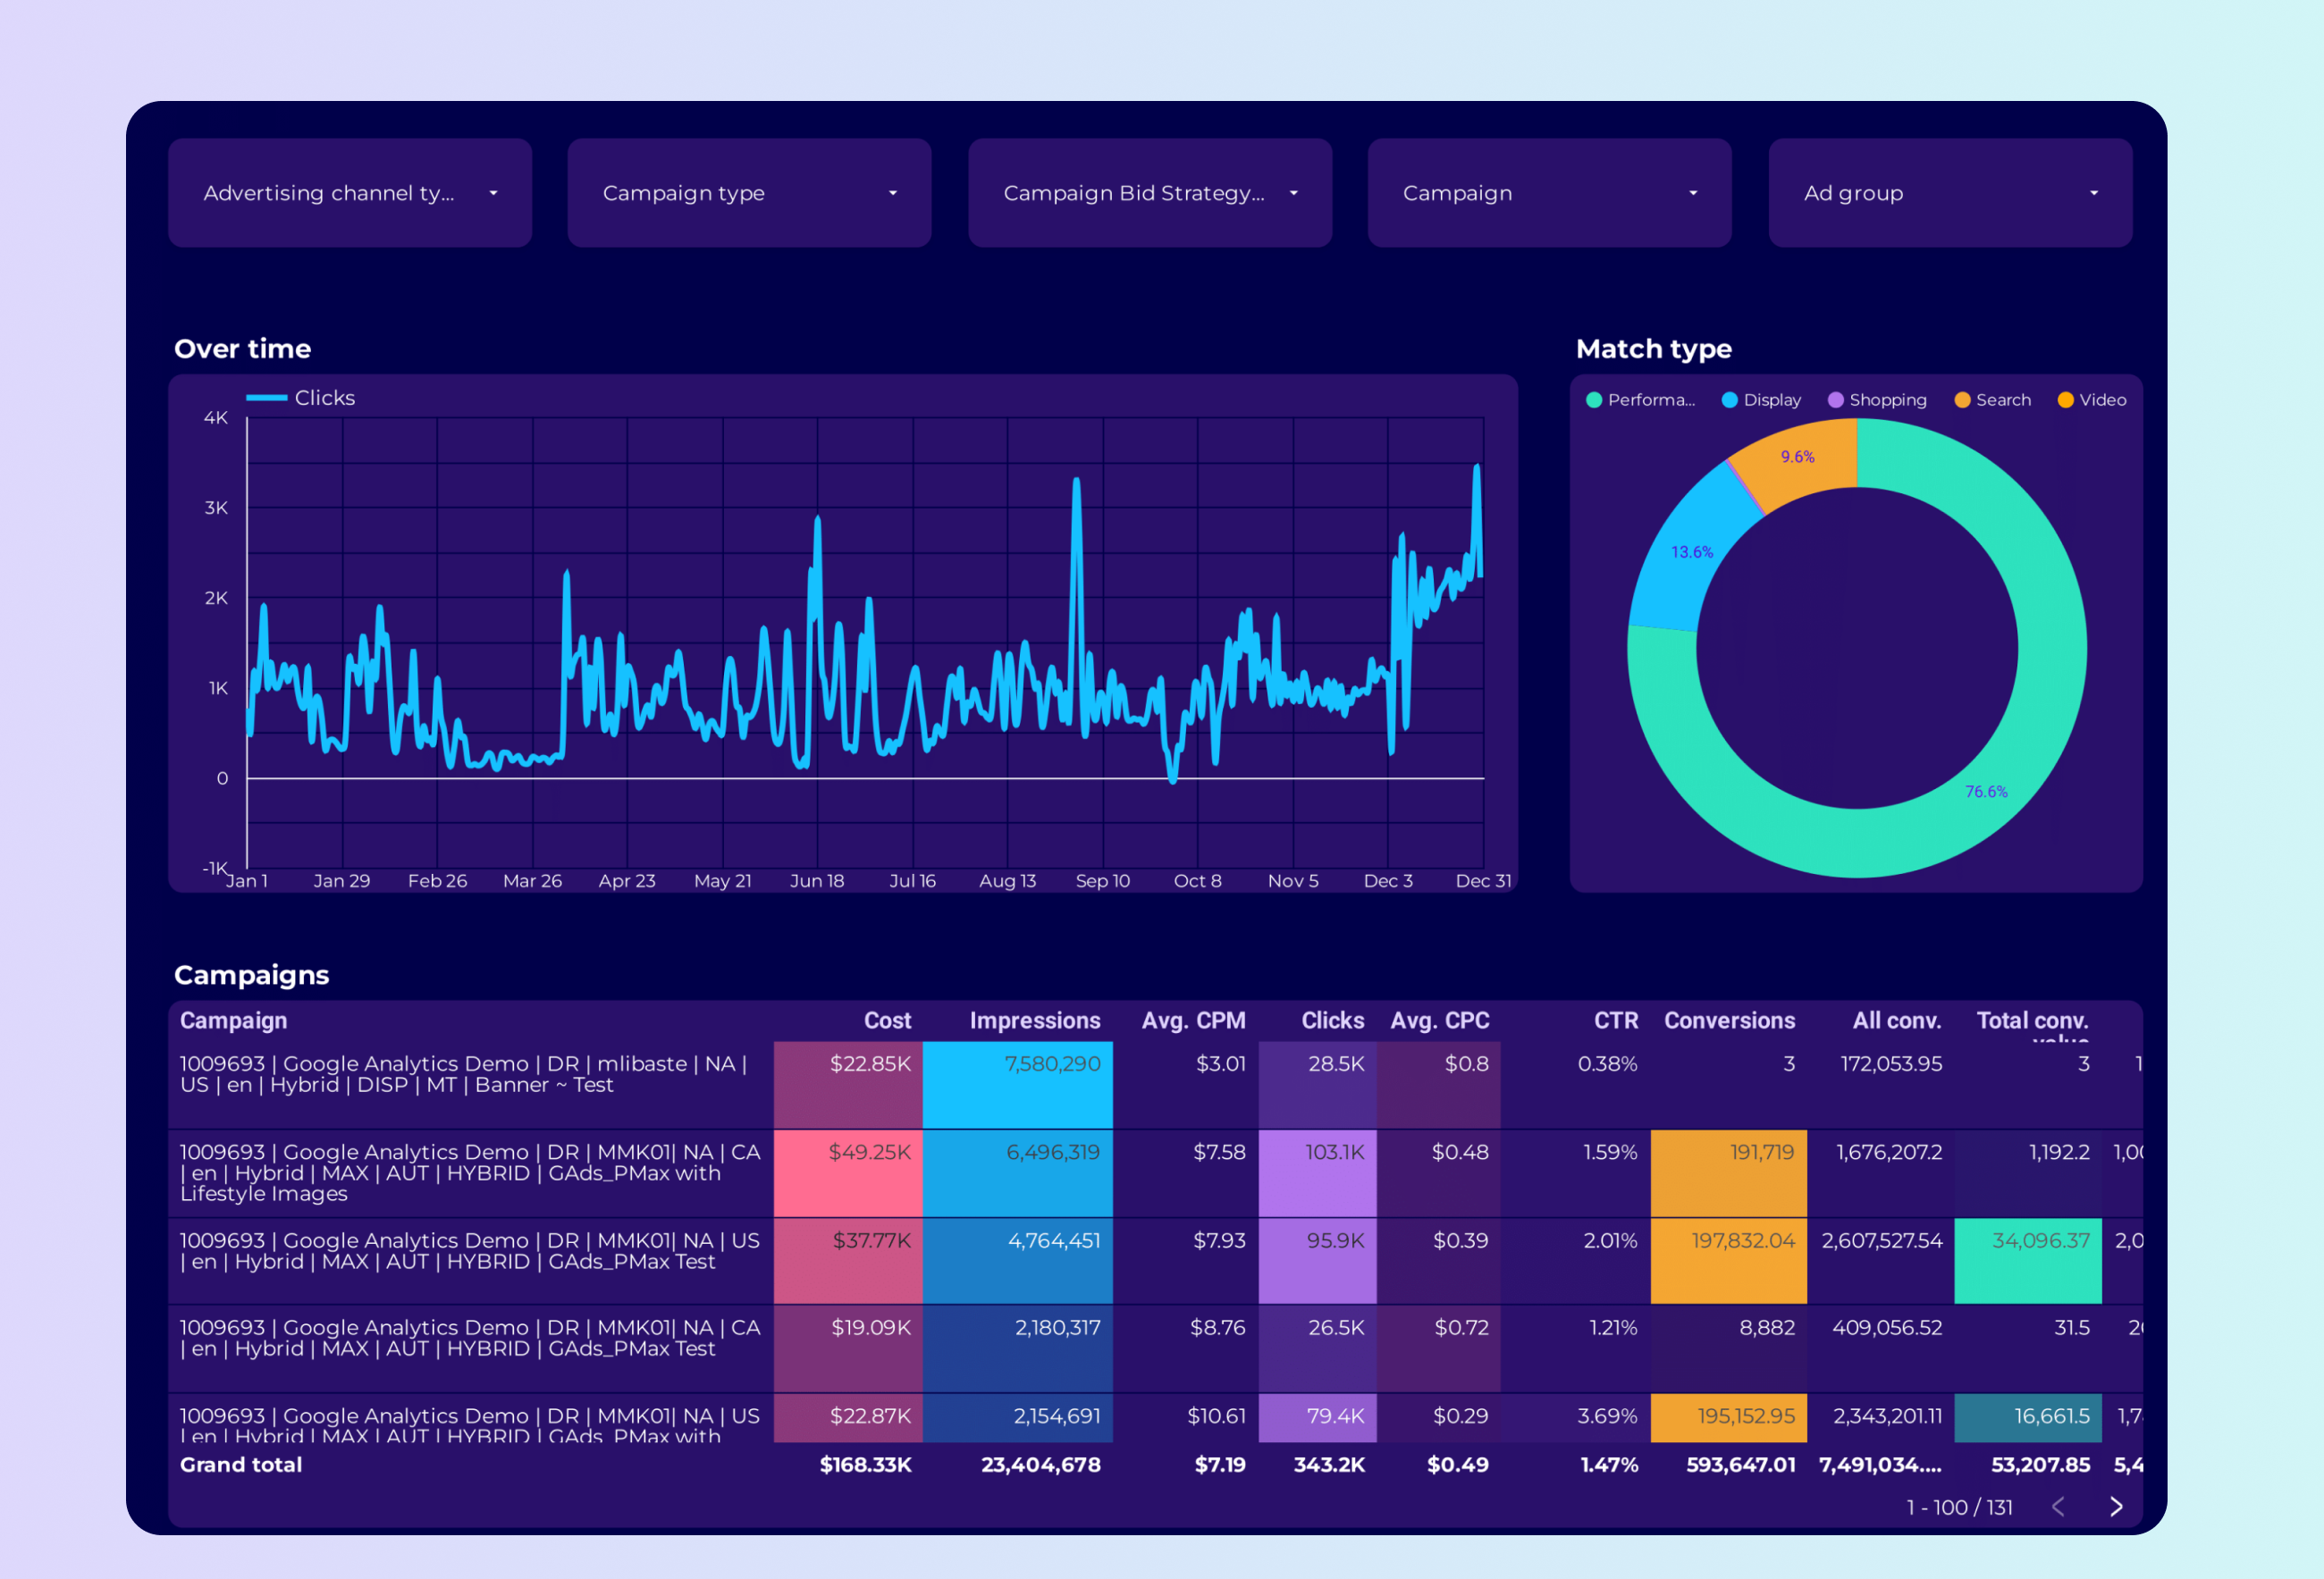
A Google Ads PMax dashboard is a visual tool used to track and analyze the performance of Google Ads Performance Max campaigns. It displays key metrics such as conversion value, conversion rate, cost per conversion, click-through rate, and engagement rate. The dashboard can be customized with filters and interactive elements to segment data by campaign dimensions, audience segments, and time periods, providing insights into campaign effectiveness and areas for improvement.
Can I download this template in PDF?


 Impressions
 Ad Spend