A Email marketing report should include metrics such as Conversion metrics like Conversion rate, Bounce rate, Unsubscribe rate, Engagement metrics like Open rate, Click-to-open rate, Forwarding rate, and Visibility metrics like Impressions, Reach, Viewability.
Then, segment and filter this data by dimensions like Campaign name, campaign type, campaign duration, Subscriber demographics, engagement level, email preferences, By hour, day, week, month, quarter, or year.
Once the data is ready, make sure to add buttons and filters to make your reports interactive, use custom colors and logos to make it white-label, and share via link, PDF, or email so your teams or clients can access it.
To analyze email marketing data, follow these steps:
1) Define your use case: Determine if the analysis is for a client presentation, performance monitoring, or an ad hoc analysis.
2) Define your metrics: Choose relevant metrics such as revenue generated from email campaigns, costs associated with email marketing, and funnel metrics like visibility (open rates), engagement (click-through rates), and conversion metrics (conversion rates).
3) Add context: Compare these metrics over time, against set objectives, or against costs to assess efficiency. For example, analyze how open rates have changed over the past quarter or compare click-through rates to industry benchmarks to evaluate effectiveness.
4) Segment your data: Break down the data by channel (e.g., Mailchimp, Klaviyo, ActiveCampaign, HubSpot), objective (e.g., lead generation, customer retention), campaign (e.g., seasonal promotions), product, and time (e.g., monthly, quarterly).
For instance, if using Mailchimp, you might analyze the performance of a holiday email campaign by comparing its open and click-through rates to previous campaigns, segmenting the data by different customer demographics, and evaluating the cost-effectiveness of the campaign in terms of revenue generated versus the cost of the email service.
To build an Email marketing dashboard, start by connecting your Email marketing data such as Mailchimp to platforms like Google Sheets or Google Looker Studio. Choose metrics such as Conversion rate, Bounce rate, Unsubscribe rate, Open rate, Click-to-open rate, Forwarding rate, Impressions, Reach, and Viewability to fully map your funnel. Segment and break down your data by channel, campaign, audience, product, or objective, with dimensions such as Campaign name, campaign type, campaign duration, Subscriber demographics, engagement level, and email preferences. The combination of these metrics and segmentation will help you spot trends and identify areas for optimization. Share your dashboard via PDF, scheduled emails, or links for easy access.
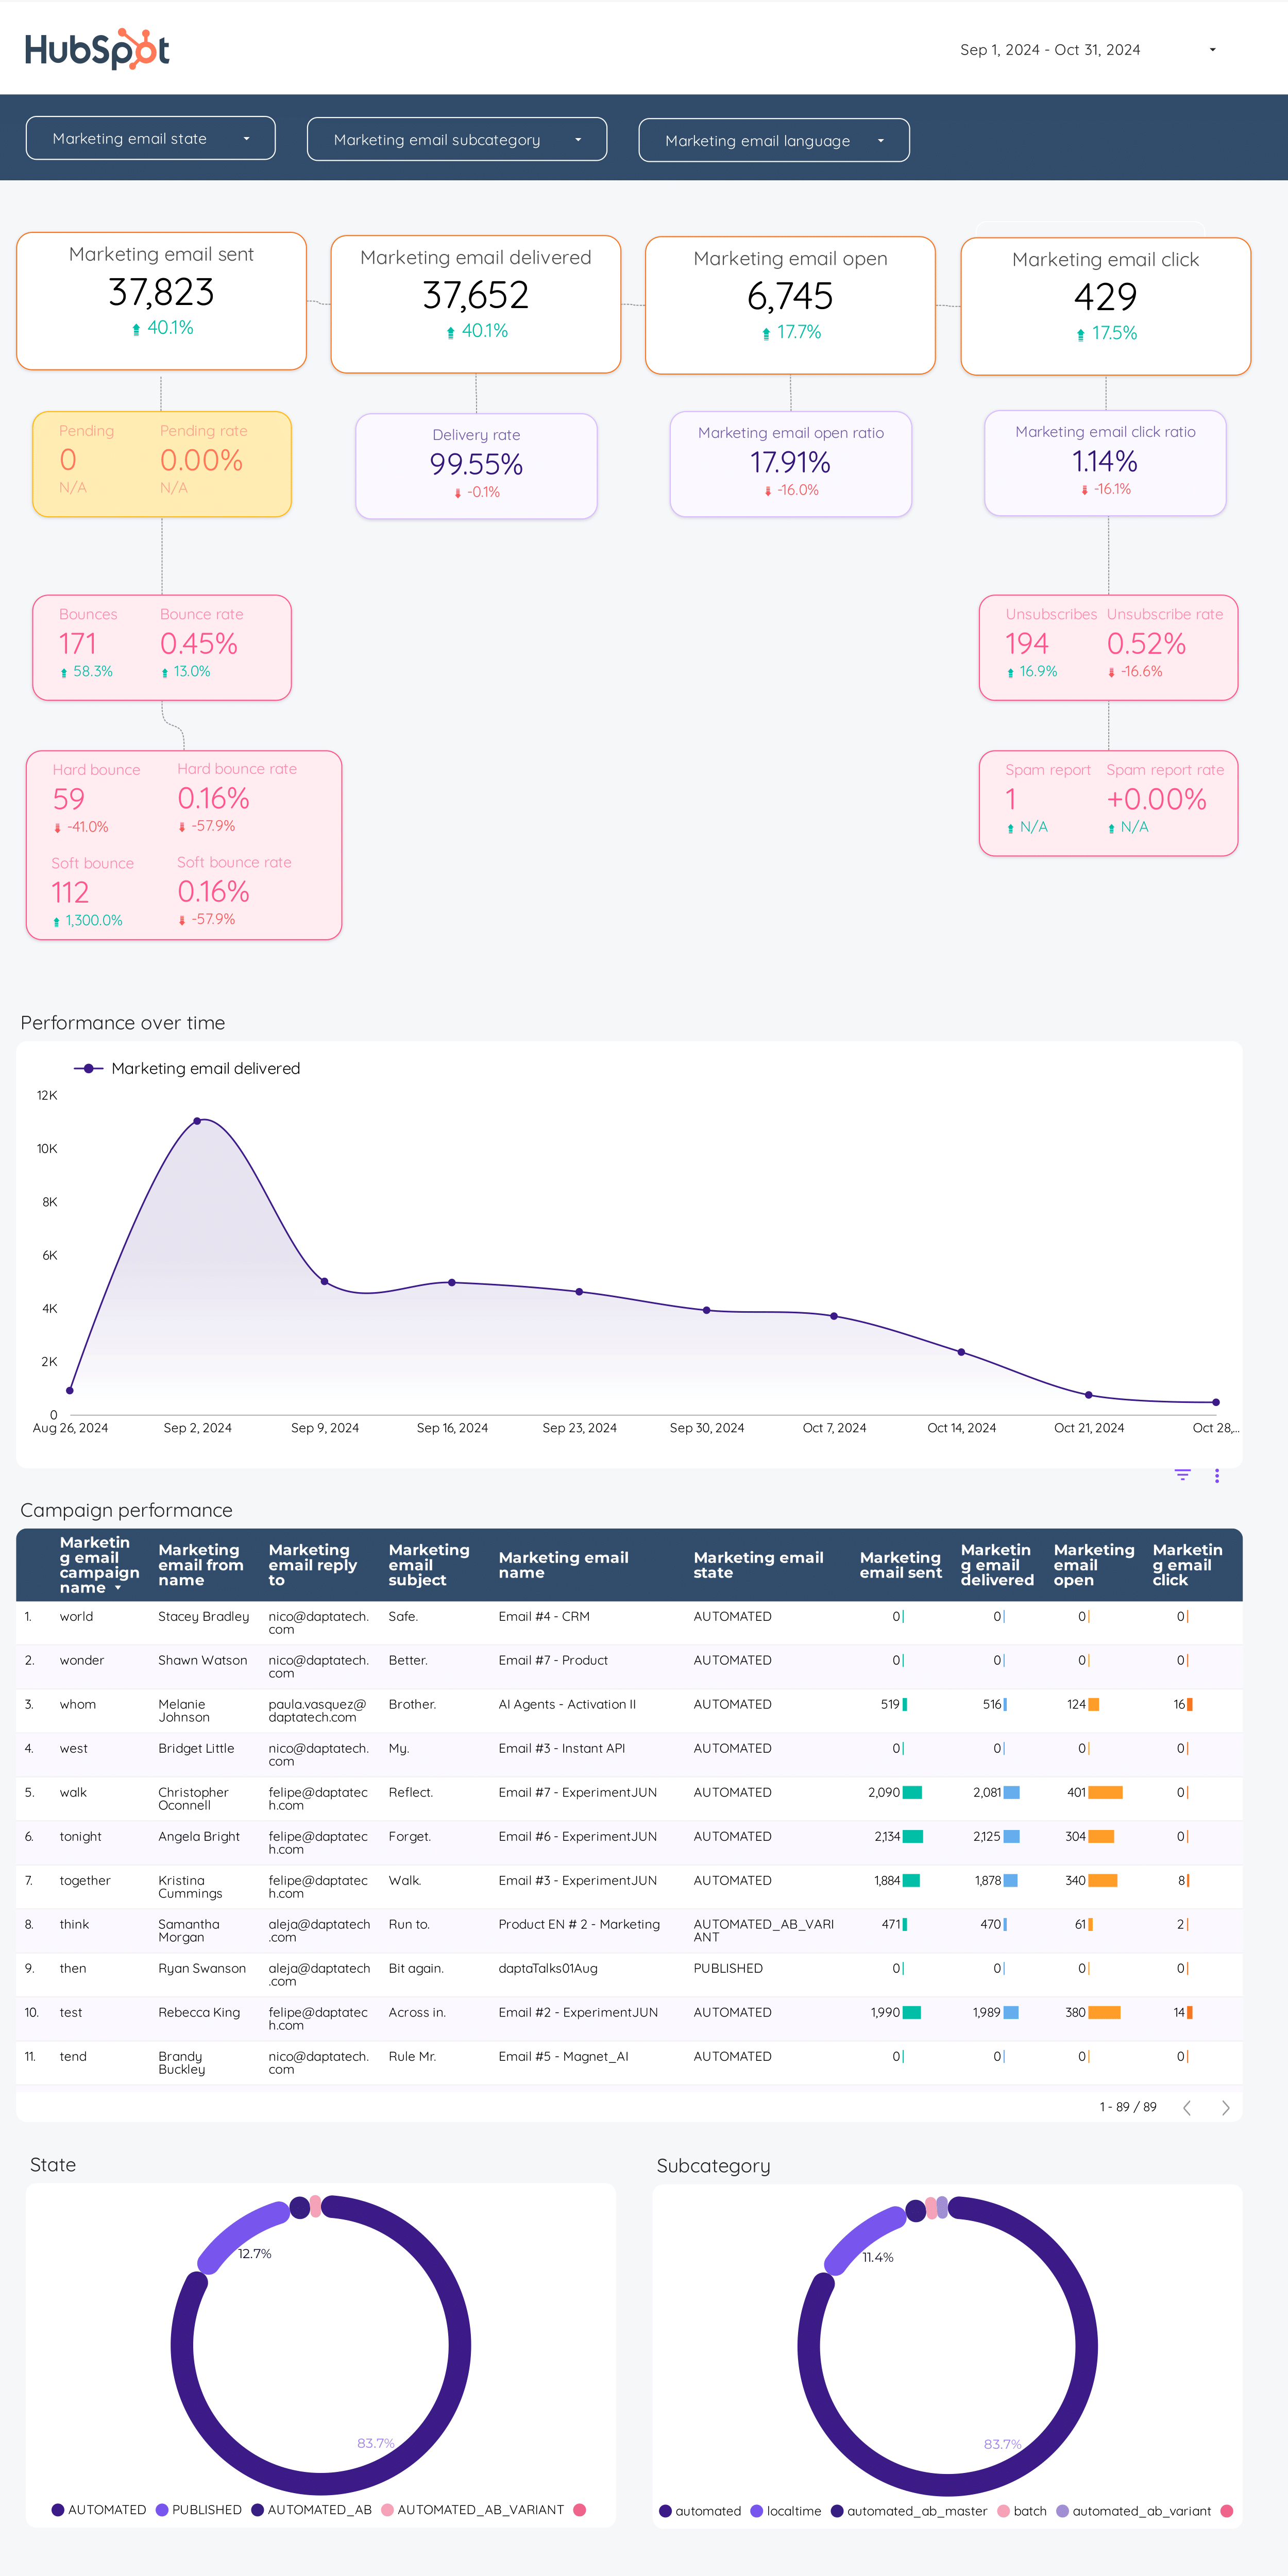
An email marketing dashboard is a visual tool that tracks and displays key metrics related to email marketing campaigns. It helps analyze performance by connecting data from platforms like Mailchimp to tools such as Google Sheets or Looker Studio. Key metrics include conversion rate, bounce rate, unsubscribe rate, open rate, and click-to-open rate. The dashboard allows segmentation by campaign, audience, and other dimensions, enabling trend spotting and optimization.
Yes, Looker Studio allows you to download your report as a PDF. To do it, follow these steps:
Before downloading your report choose the date range you want to visualize on your report.
Click on the “File” menu at the top left corner of the screen.
Select “Download as” from the drop-down menu and choose “PDF.”
You can choose which pages you want to download, and also you can add a password to protect the report and add a link back to the online report.
Click on “Download” to save the report on your device.
 HubSpot
 Impressions
 Bounce Rate
 Unsubscribe Rate
 Conversion Rate

