A B2B Funnel report should include the following elements:
1. Impressions
2. Clicks
3. Ad Spend
4. Campaign Name
5. Date
6. Leads
7. Conversion Rate
8. Customer Acquisition Cost
9. Return on Investment
10. Bounce Rate
11. Sessions
12. Page Views
13. Average Session Duration
14. New Users
15. Traffic Source
16. Device Category
17. Country
18. City
19. User Type
These metrics help in analyzing the effectiveness of marketing efforts and understanding the customer journey through the sales funnel.
To analyze B2B funnel data, follow these steps:
1. **Define Funnel Stages**: Identify key stages in your B2B funnel, such as awareness, consideration, decision, and retention.
2. **Collect Data**: Use tools like HubSpot to gather data on metrics such as impressions, clicks, ad spend, leads, conversion rates, and customer acquisition costs.
3. **Evaluate Performance**: Analyze each stage’s performance by examining conversion rates and identifying drop-off points. Look at metrics like bounce rate, sessions, and page views to understand user engagement.
4. **Identify Traffic Sources**: Determine which traffic sources (e.g., organic, paid, referral) are most effective in driving leads and conversions.
5. **Segment Data**: Break down data by campaign name, date, device category, country, and user type to identify trends and patterns.
6. **Calculate ROI**: Assess the return on investment by comparing revenue generated against ad spend and customer acquisition costs.
7. **Optimize**: Use insights to optimize campaigns, targeting, and content to improve conversion rates and reduce costs.
8. **Monitor and Adjust**: Continuously monitor performance and make data-driven adjustments to improve funnel efficiency.
To build a B2B Funnel dashboard using HubSpot, follow these steps:
1. **Define Key Metrics**: Identify the key metrics you want to track, such as Impressions, Clicks, Ad Spend, Leads, Conversion Rate, Customer Acquisition Cost, Return on Investment, Bounce Rate, Sessions, Page Views, Average Session Duration, New Users, Traffic Source, Device Category, Country, City, and User Type.
2. **Data Collection**: Ensure that your HubSpot account is set up to collect data on these metrics. This may involve integrating with other tools or platforms to gather comprehensive data.
3. **Dashboard Setup**: In HubSpot, navigate to the Reports section and create a new dashboard. Choose a layout that suits your needs.
4. **Add Reports**: For each key metric, add a report to the dashboard. Use HubSpot’s reporting tools to customize each report, ensuring it displays the data in a clear and actionable way.
5. **Visualization**: Use charts and graphs to visualize data trends and patterns. This helps in quickly understanding the performance of each stage in the funnel.
6. **Segmentation**: Segment data by different dimensions such as Traffic Source, Device Category, Country, and User Type to gain deeper insights.
7. **Regular Updates**: Set up automated updates to keep the dashboard current with the latest data.
8. **Review and Optimize**: Regularly review the dashboard to identify areas for improvement in your B2B funnel and make data-driven decisions to optimize performance.
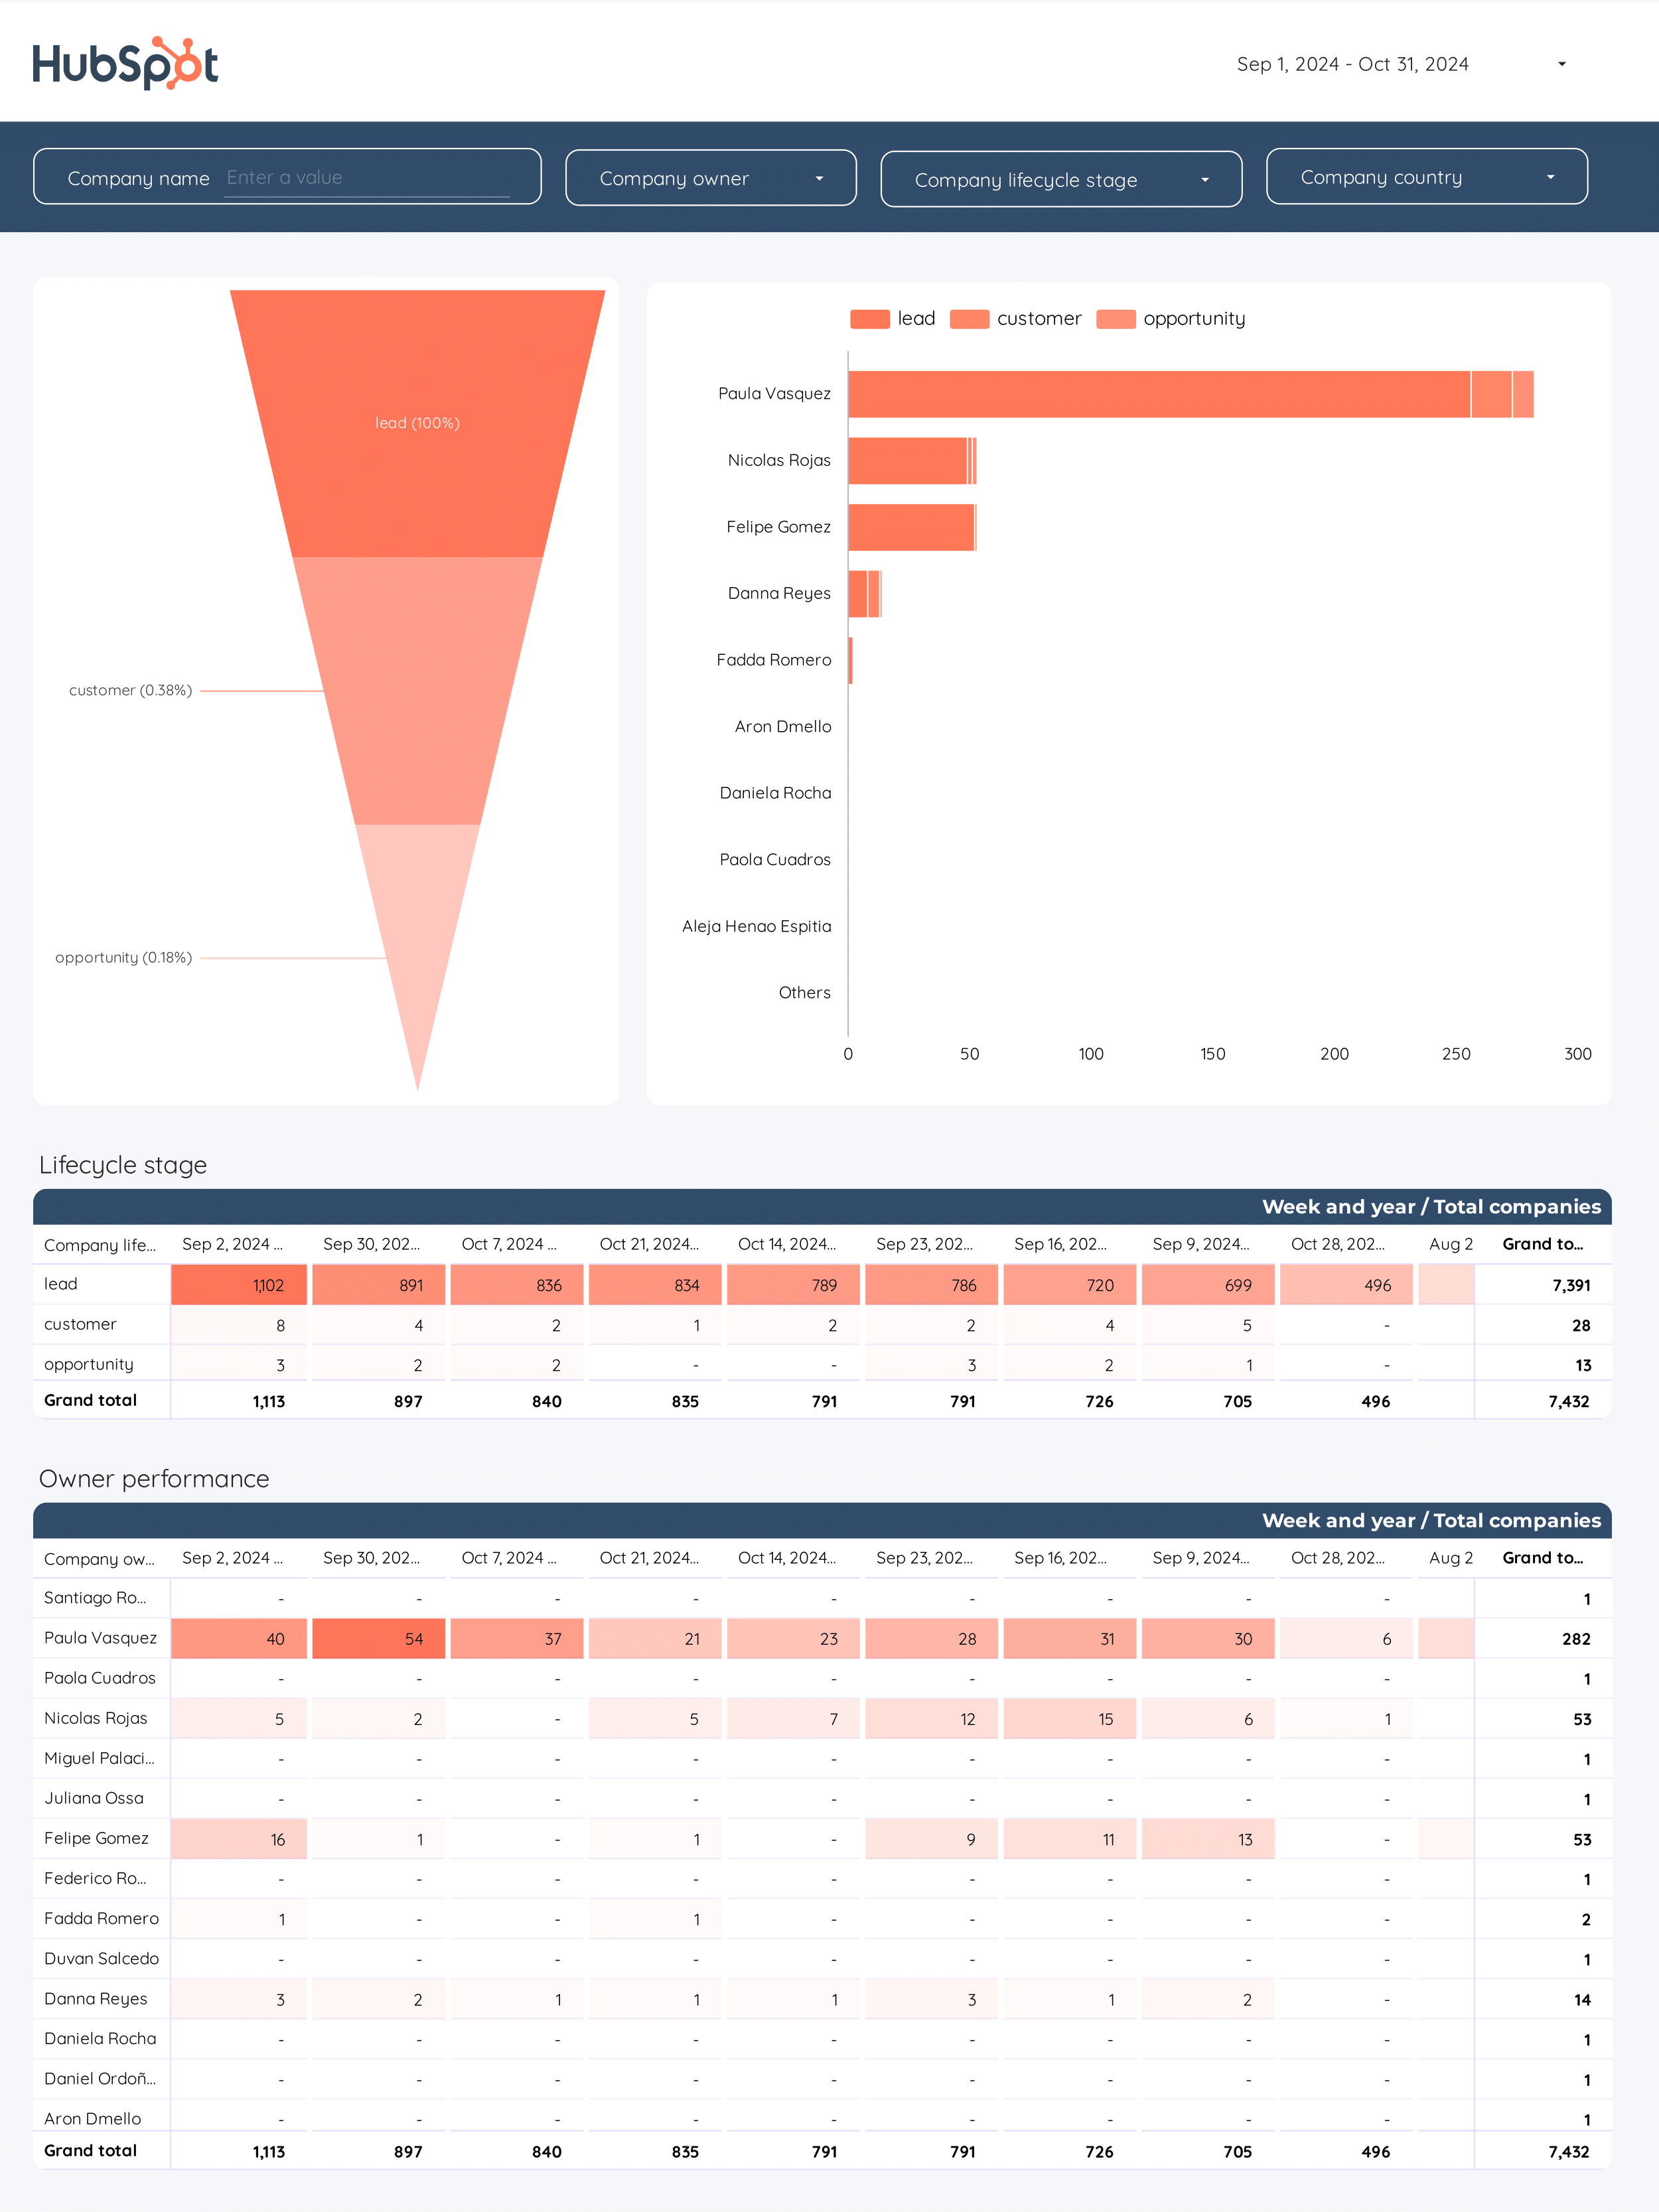
A B2B Funnel dashboard is a tool used to visualize and track the stages of a business-to-business sales funnel. It typically includes metrics such as impressions, clicks, ad spend, leads, conversion rates, customer acquisition cost, return on investment, bounce rate, sessions, page views, average session duration, new users, and traffic sources. This dashboard helps businesses analyze their marketing and sales efforts, optimize their strategies, and improve their overall performance. HubSpot is a popular platform that can be used to create and manage such dashboards.
Can I download this template in PDF?


 Impressions
 Ad Spend