An Amazon Seller Central report should include visibility metrics such as impressions and reach, engagement metrics like clicks and click-through rate, and conversion metrics such as orders and conversion rate. The data should be segmented by campaign, channel (e.g., Sponsored Products, Sponsored Brands), audience (e.g., age or gender), content (e.g., product images or video), objective (e.g., brand awareness or sales), and date. For example, a report could provide insights on impressions and clicks for a specific Sponsored Products campaign targeting a certain audience demographic during a specific time period.
To analyze the data in an Amazon Seller Central report, follow these steps:
1) Choose metrics such as visibility (impressions, page views), engagement (click-through rate, bounce rate), and conversion (conversion rate, sales).
2) Add context by comparing against cost (ad spend), date range (month, quarter), goals (target ROAS, sales revenue), rates (CTR, conversion rate), and benchmarks (industry standards, competitor performance).
3) Segment data by campaign (specific ad campaigns), channel (Amazon Sponsored Products, Sponsored Brands), audience (new vs returning customers), content (different product listings), objective (sales vs brand awareness), and date (daily, weekly). For example, analyze the click-through rate of a specific ad campaign on Amazon Sponsored Products compared to the industry benchmark CTR for that product category.
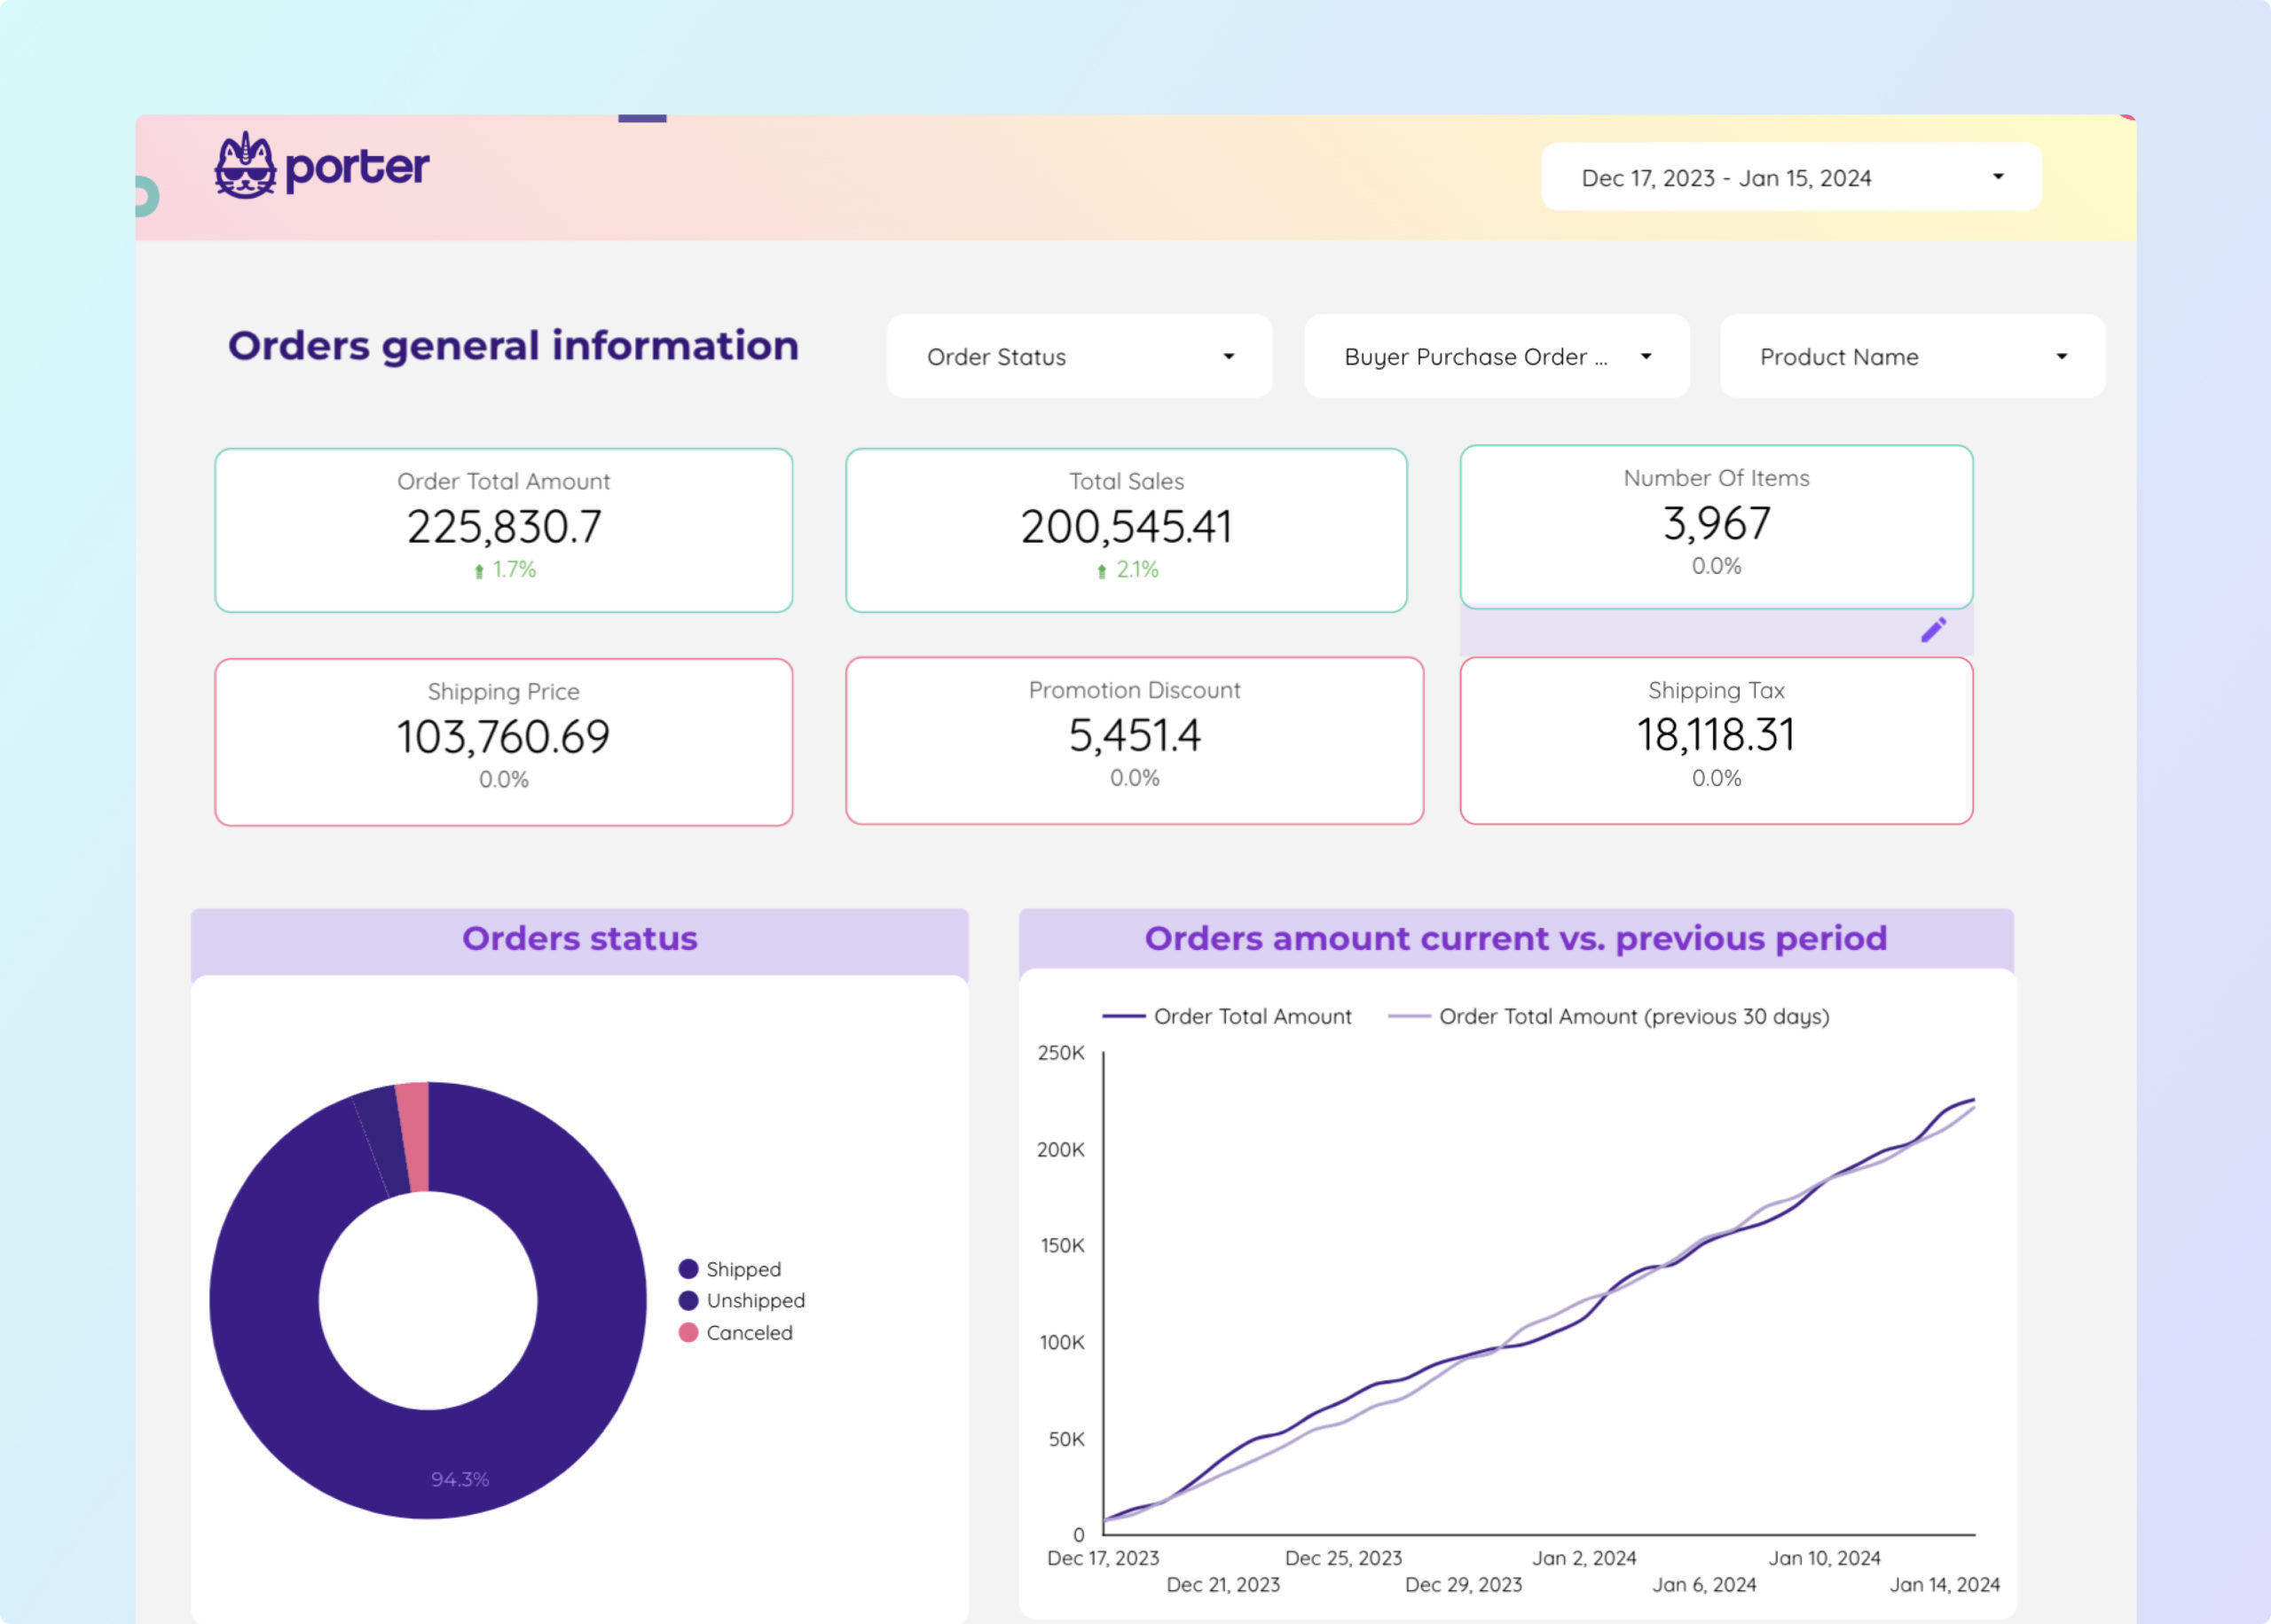
To build an Amazon Seller Central dashboard, 1) connect your Amazon Seller Central account and other relevant data sources. 2) Choose metrics such as sales, orders, and conversion rates to monitor performance. 3) Segment data by campaign, product, customer content, objective, and date for a detailed analysis. 4) Incorporate filters or buttons for categories like product type or region to make your report interactive. 5) Share your dashboard via PDF, scheduled emails, or links for easy access and review.
The Amazon Seller Central dashboard is an online interface for sellers on Amazon to manage their e-commerce business. It provides tools and data for tracking sales, managing inventory, advertising, and analyzing performance metrics such as impressions, clicks, ad spend, sales, and orders. The dashboard also allows sellers to view and manage product details, including ASINs, SKUs, and product names.
Yes, Looker Studio allows you to download your report as a PDF. To do it, follow these steps:
Before downloading your report choose the date range you want to visualize on your report.
Click on the “File” menu at the top left corner of the screen.
Select “Download as” from the drop-down menu and choose “PDF.”
You can choose which pages you want to download, and also you can add a password to protect the report and add a link back to the online report.
Click on “Download” to save the report on your device.
 Amazon Seller Central
 Impressions

