TikTok Ads creative analysis dashboard template for Google Sheets

Identify your most effective TikTok Ads and creative assets by analyzing their engagement and conversion rates. Compare ad performance against your targets, examining key metrics such as ad names, Return on Ad Spend (ROAS), and hook rate to determine which creatives are driving the best results.

By Porter

This template is built by the same marketers behind all our tutorials, support, and our template gallery.

Data sources included

+40,000 marketers have downloaded our dashboards

Questions you can answer using this TikTok Ads dashboard template

  • Which ads have the highest or lowest engagement?
  • Which ads have the best CTR (Click-Through Rate)?
  • What is the overall Return on Ad Spend (ROAS) for each ad?
  • Which ads are performing well in terms of visibility?
  • What is the best-performing hook rate?
  • How do different creatives compare in terms of likes, shares, and comments?
  • Are there clear losers or winners in the general results?
  • What is the cost per acquisition (CPA) for each ad?
  • Are there any trends in the top-performing ads?
  • Which videos are failing to convert views into actions?
  • How do our best-performing ads compare to our target metrics?

How to set up this Google Sheets template?

Copy the TikTok Ads creative analysis dashboard template for Google Sheets in one click and automate your reporting

Follow these steps:


  • Step 1: Make a copy of the template.

  • Step 2: Download the extension and authorize your profile.

  • Step 3: Choose the accounts you want to pull data from.

  • Step 4: Use our prebuilt queries or build one from scratch to automate your data collection. Alternatively, you can input data manually.

  • Step 5: Set up automatic refresh to keep your dashboard updated.


Metrics and dimensions included

Customize the template’s metrics and dimensions as you like. See all available TikTok Ads fields.

Metrics

  • Engagement metrics

    • Link clicks
    • CTR (Click-through rate)
    • Landing page views
    • Hook rate

  • Customizable charts

    • Purchases
    • Purchase conversion value
    • Purchase ROAS (Return on Ad Spend)
    • CPA (Cost Per Acquisition)
    • ROAS score (Winner/Loser)

Dimensions

    • Time progress: hours, days, weeks, month, quarter, and year.
    • Status: overspending or underspending
    • By day, week, month, quarter, or year.

Features

You can customize your marketing reports directly in Google Sheets with your logo, colors, and branding.
Set up email alerts using conditional notifications when a cell value changes.
Edit all charts and change style values, and then paste them on your Google Slides so they can auto sync.

Utilize functions like SUMIF, VLOOKUP, IF, and ARRAYFORMULA to calculate key metrics like CPA, ROAS, and CTR, automating calculations and combining data fields.

Pull your historical marketing data automatically using our Google Sheets marketing extension.

Filter by date, campaign, channel, and more to get the insights you need.
Set, track, and achieve marketing goals with real-time updates.
Set sync intervals to match your reporting needs, whether daily, weekly, or monthly.
Connect Google Analytics, Facebook Ads, Instagram, LinkedIn, and more to create a unified view of your marketing performance.

FAQs

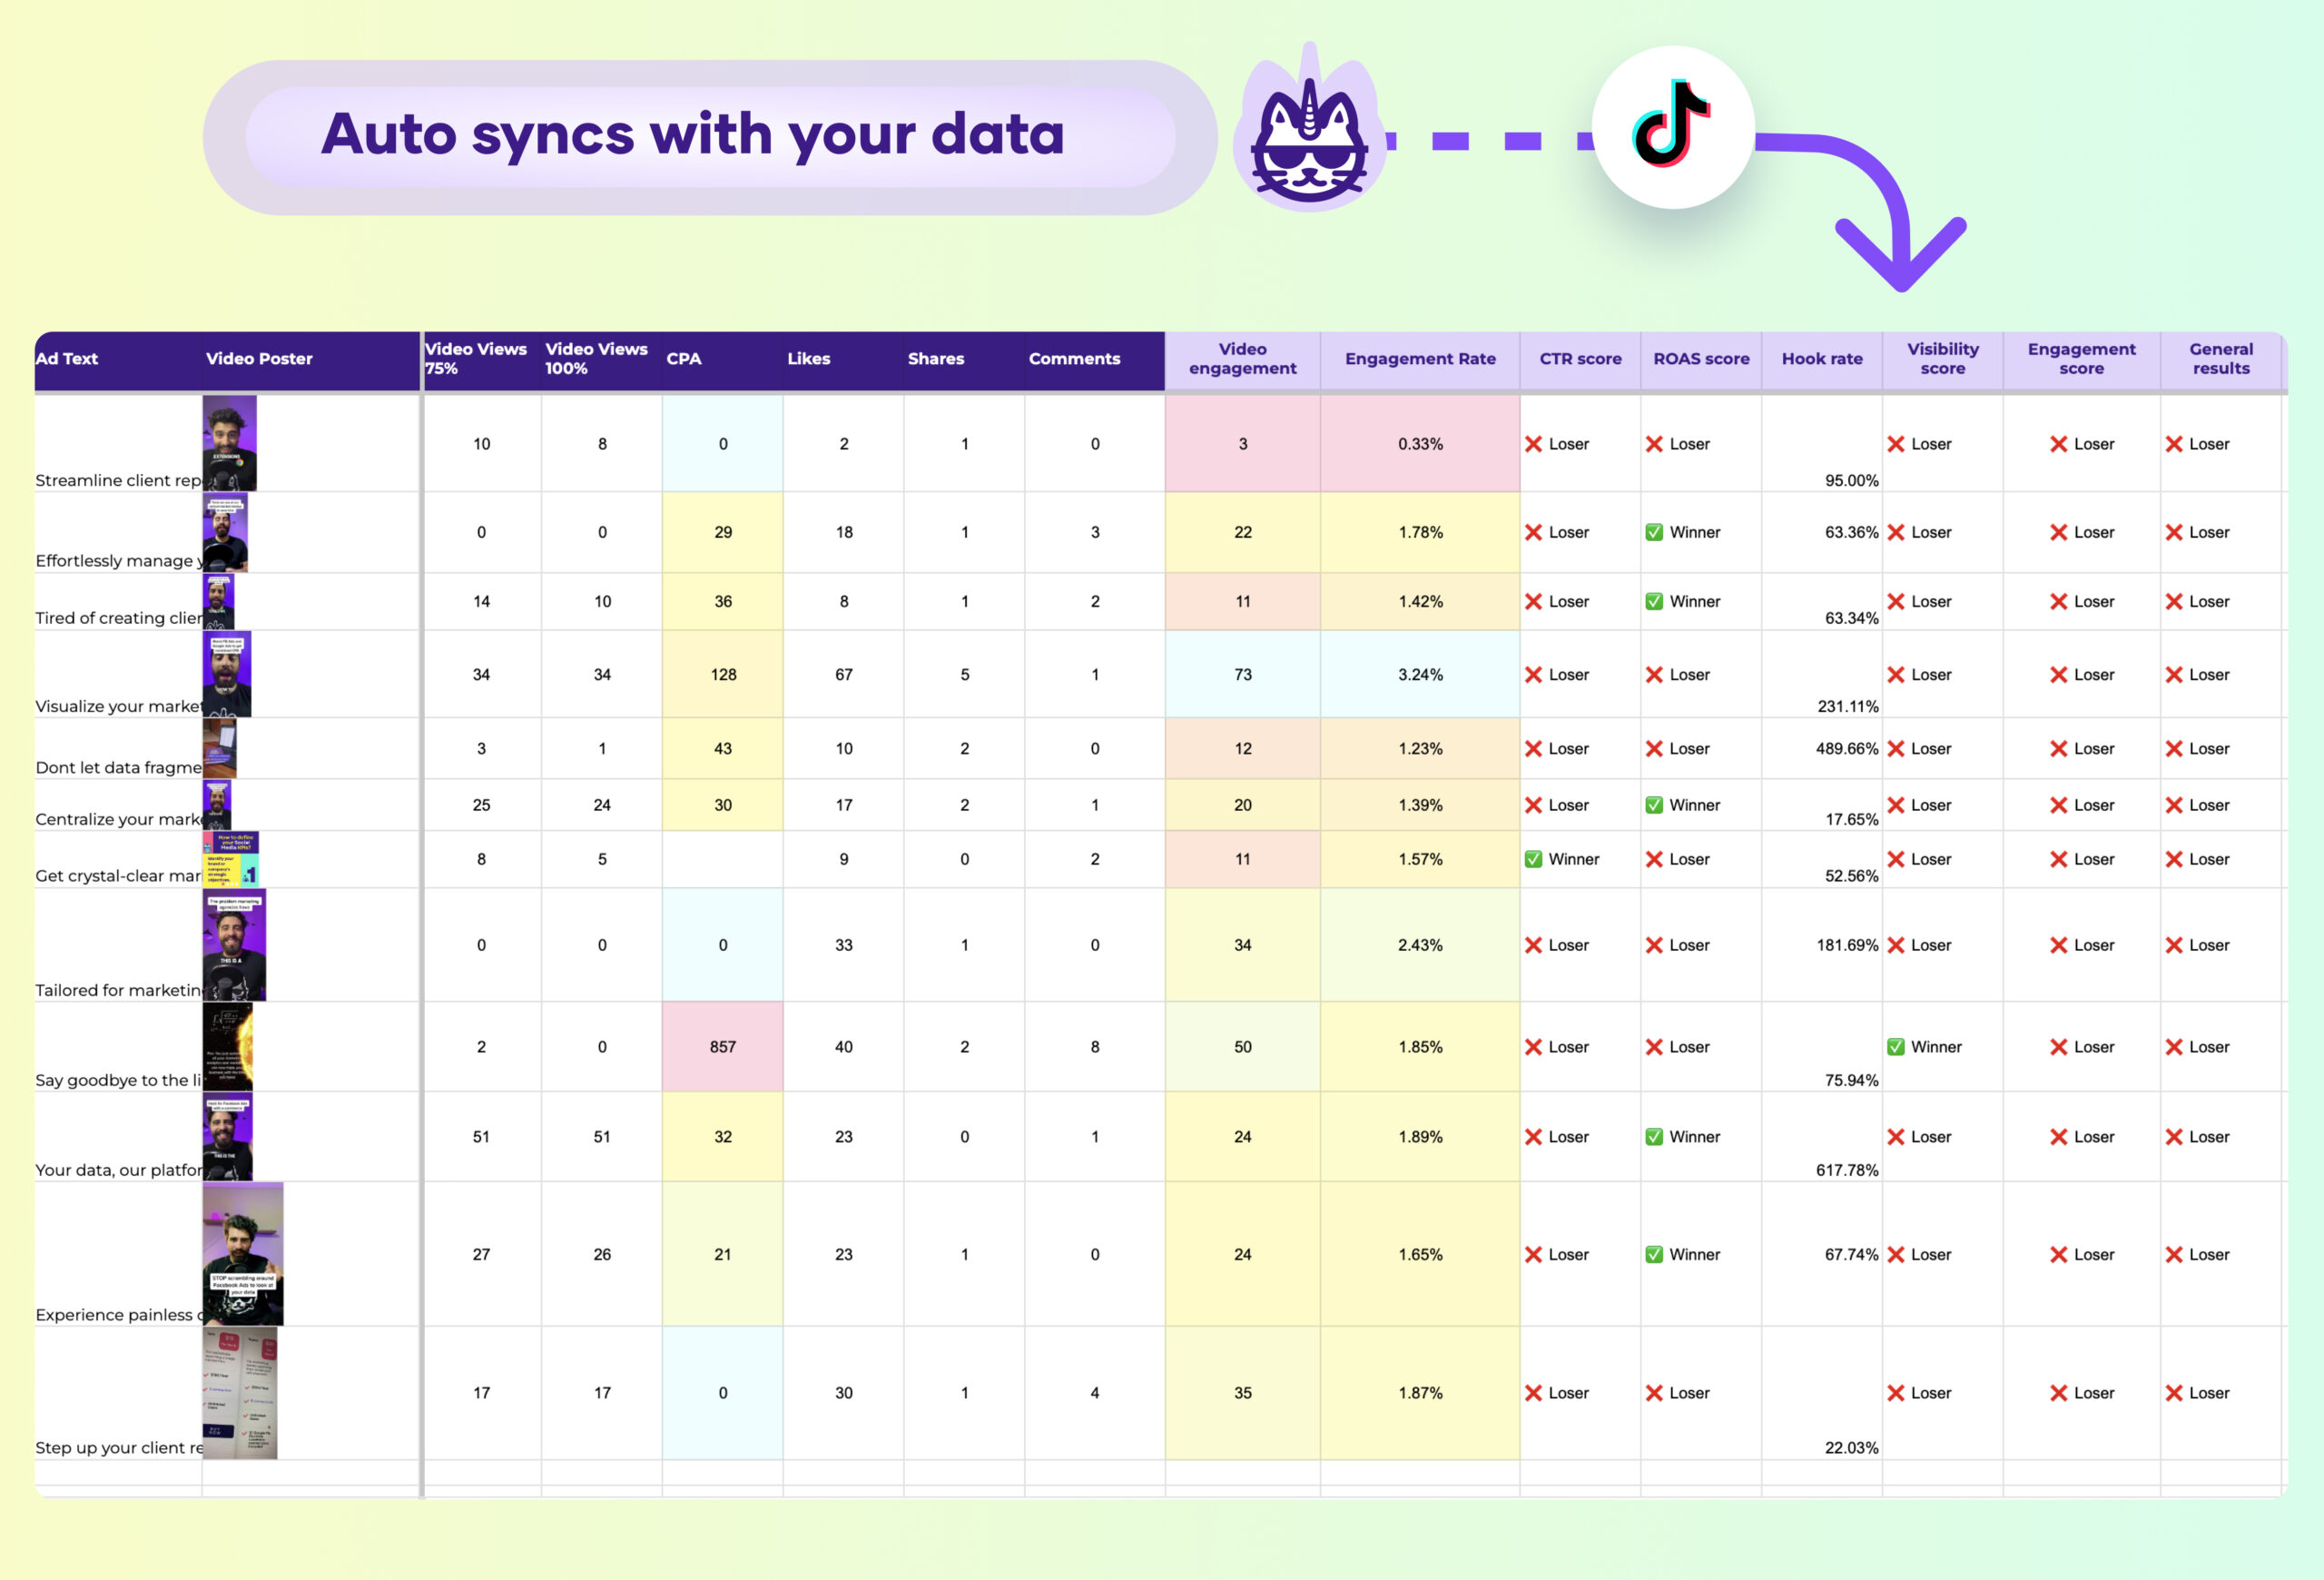
A TikTok Ads creative analysis dashboard report should include key metrics such as Total Impressions, Click-Through Rate (CTR), and Engagement Rate to evaluate the overall performance of each ad creative. Metrics like Video Views (25%, 50%, 75%, and 100%) and Hook Rate are crucial for understanding how well each ad captures and retains viewer attention.
Additionally, Conversion Rate and Cost per Conversion help assess how effectively the creative is driving sales or other desired actions.
The dashboard should also feature Return on Ad Spend (ROAS), Average Watch Time, and Cost per Click (CPC) for each creative to provide insights into the financial efficiency and engagement impact of the ads. Including a breakdown of Engagement (likes, shares, and comments) for each creative will further highlight audience interaction levels.
Visualizations such as a performance comparison of different creatives, trend lines for ROAS, and engagement heatmaps can offer clear insights into which ads perform best.
Also ensure the dashboard auto-syncs with your TikTok Ads data for real-time updates and actionable information.

While this template is designed specifically for TikTok Ads, you can use Google Sheets’ multichannel connectors such as LinkedIn Ads, GA4, Shopify to integrate data from other marketing platforms. By combining insights from different sources, you can create a unified view of your overall marketing performance.

To set up email alerts, use the built-in notifications feature in Google Sheets. You can create custom rules to trigger email alerts based on specific conditions, such as when your actual spend exceeds the budget or when pacing percentages hit certain thresholds.

Yes, you can fully customize the charts in the dashboard. You can choose different chart types, adjust colors, fonts, and styles, add data labels, legends, and trendlines, and customize axes and gridlines to match your reporting needs.