Instagram Insights follower tracker dashboard template for Google Sheets

Track your Instagram profile visibility metrics, engagement rate, and compare follower growth against your targets with daily and weekly breakdowns.

By Porter

This template is built by the same marketers behind all our tutorials, support, and our template gallery.

Data sources included

+40,000 marketers have downloaded our dashboards

Questions you can answer using this Instagram Insights dashboard template

  • How is my total follower count trending over the tracked period?
  • How has the total number of followers changed over the given period?
  • Are there any patterns in the rate of new follower acquisition?
  • Which days saw spikes in profile impressions, and do these align with increases in new followers?
  • How effective is my website link in driving clicks compared to other actionable links (phone, text message, directions)?
  • Is there a correlation between high-impression days and increased interaction with contact options (website, phone, text links)?
  • Is there a trend in the ratio of profile impressions to new followers over time?

How to set up this Google Sheets template?

Copy the Instagram Insights follower tracker dashboard template for Google Sheets in one click and automate your reporting

Follow these steps:


  • Step 1: Make a copy of the template.

  • Step 2: Download the extension and authorize your profile.

  • Step 3: Choose the accounts you want to pull data from.

  • Step 4: Use our prebuilt queries or build one from scratch to automate your data collection. Alternatively, you can input data manually.

  • Step 5: Set up automatic refresh to keep your dashboard updated.


Metrics and dimensions included

Customize the template’s metrics and dimensions as you like. See all available Instagram fields.

Metrics

  • Visibility

    • Profile Impressions
    • Profile views

  • Customizable charts

    • Total followers
    • Account follows

  • Conversion metrics

    • Taps on website link
    • Taps on text message link
    • Taps on phone link
    • Taps on directions link
    • Taps on email link"

Dimensions

  • Date

    • Time progress: hours, days, weeks, month, quarter, and year.

  • Account performance

    • Account performance: overperforming or underperforming based on the number of followers obtained

Features

You can customize your marketing reports directly in Google Sheets with your logo, colors, and branding.
Set up email alerts using conditional notifications when a cell value changes.
Edit all charts and change style values, and then paste them on your Google Slides so they can auto sync.

Utilize functions like SUMIF, VLOOKUP, IF, and ARRAYFORMULA to calculate key metrics like CPA, ROAS, and CTR, automating calculations and combining data fields.

Pull your historical marketing data automatically using our Google Sheets marketing extension.

Filter by date, campaign, channel, and more to get the insights you need.
Set, track, and achieve marketing goals with real-time updates.
Set sync intervals to match your reporting needs, whether daily, weekly, or monthly.
Connect Google Analytics, Facebook Ads, Instagram, LinkedIn, and more to create a unified view of your marketing performance.

FAQs

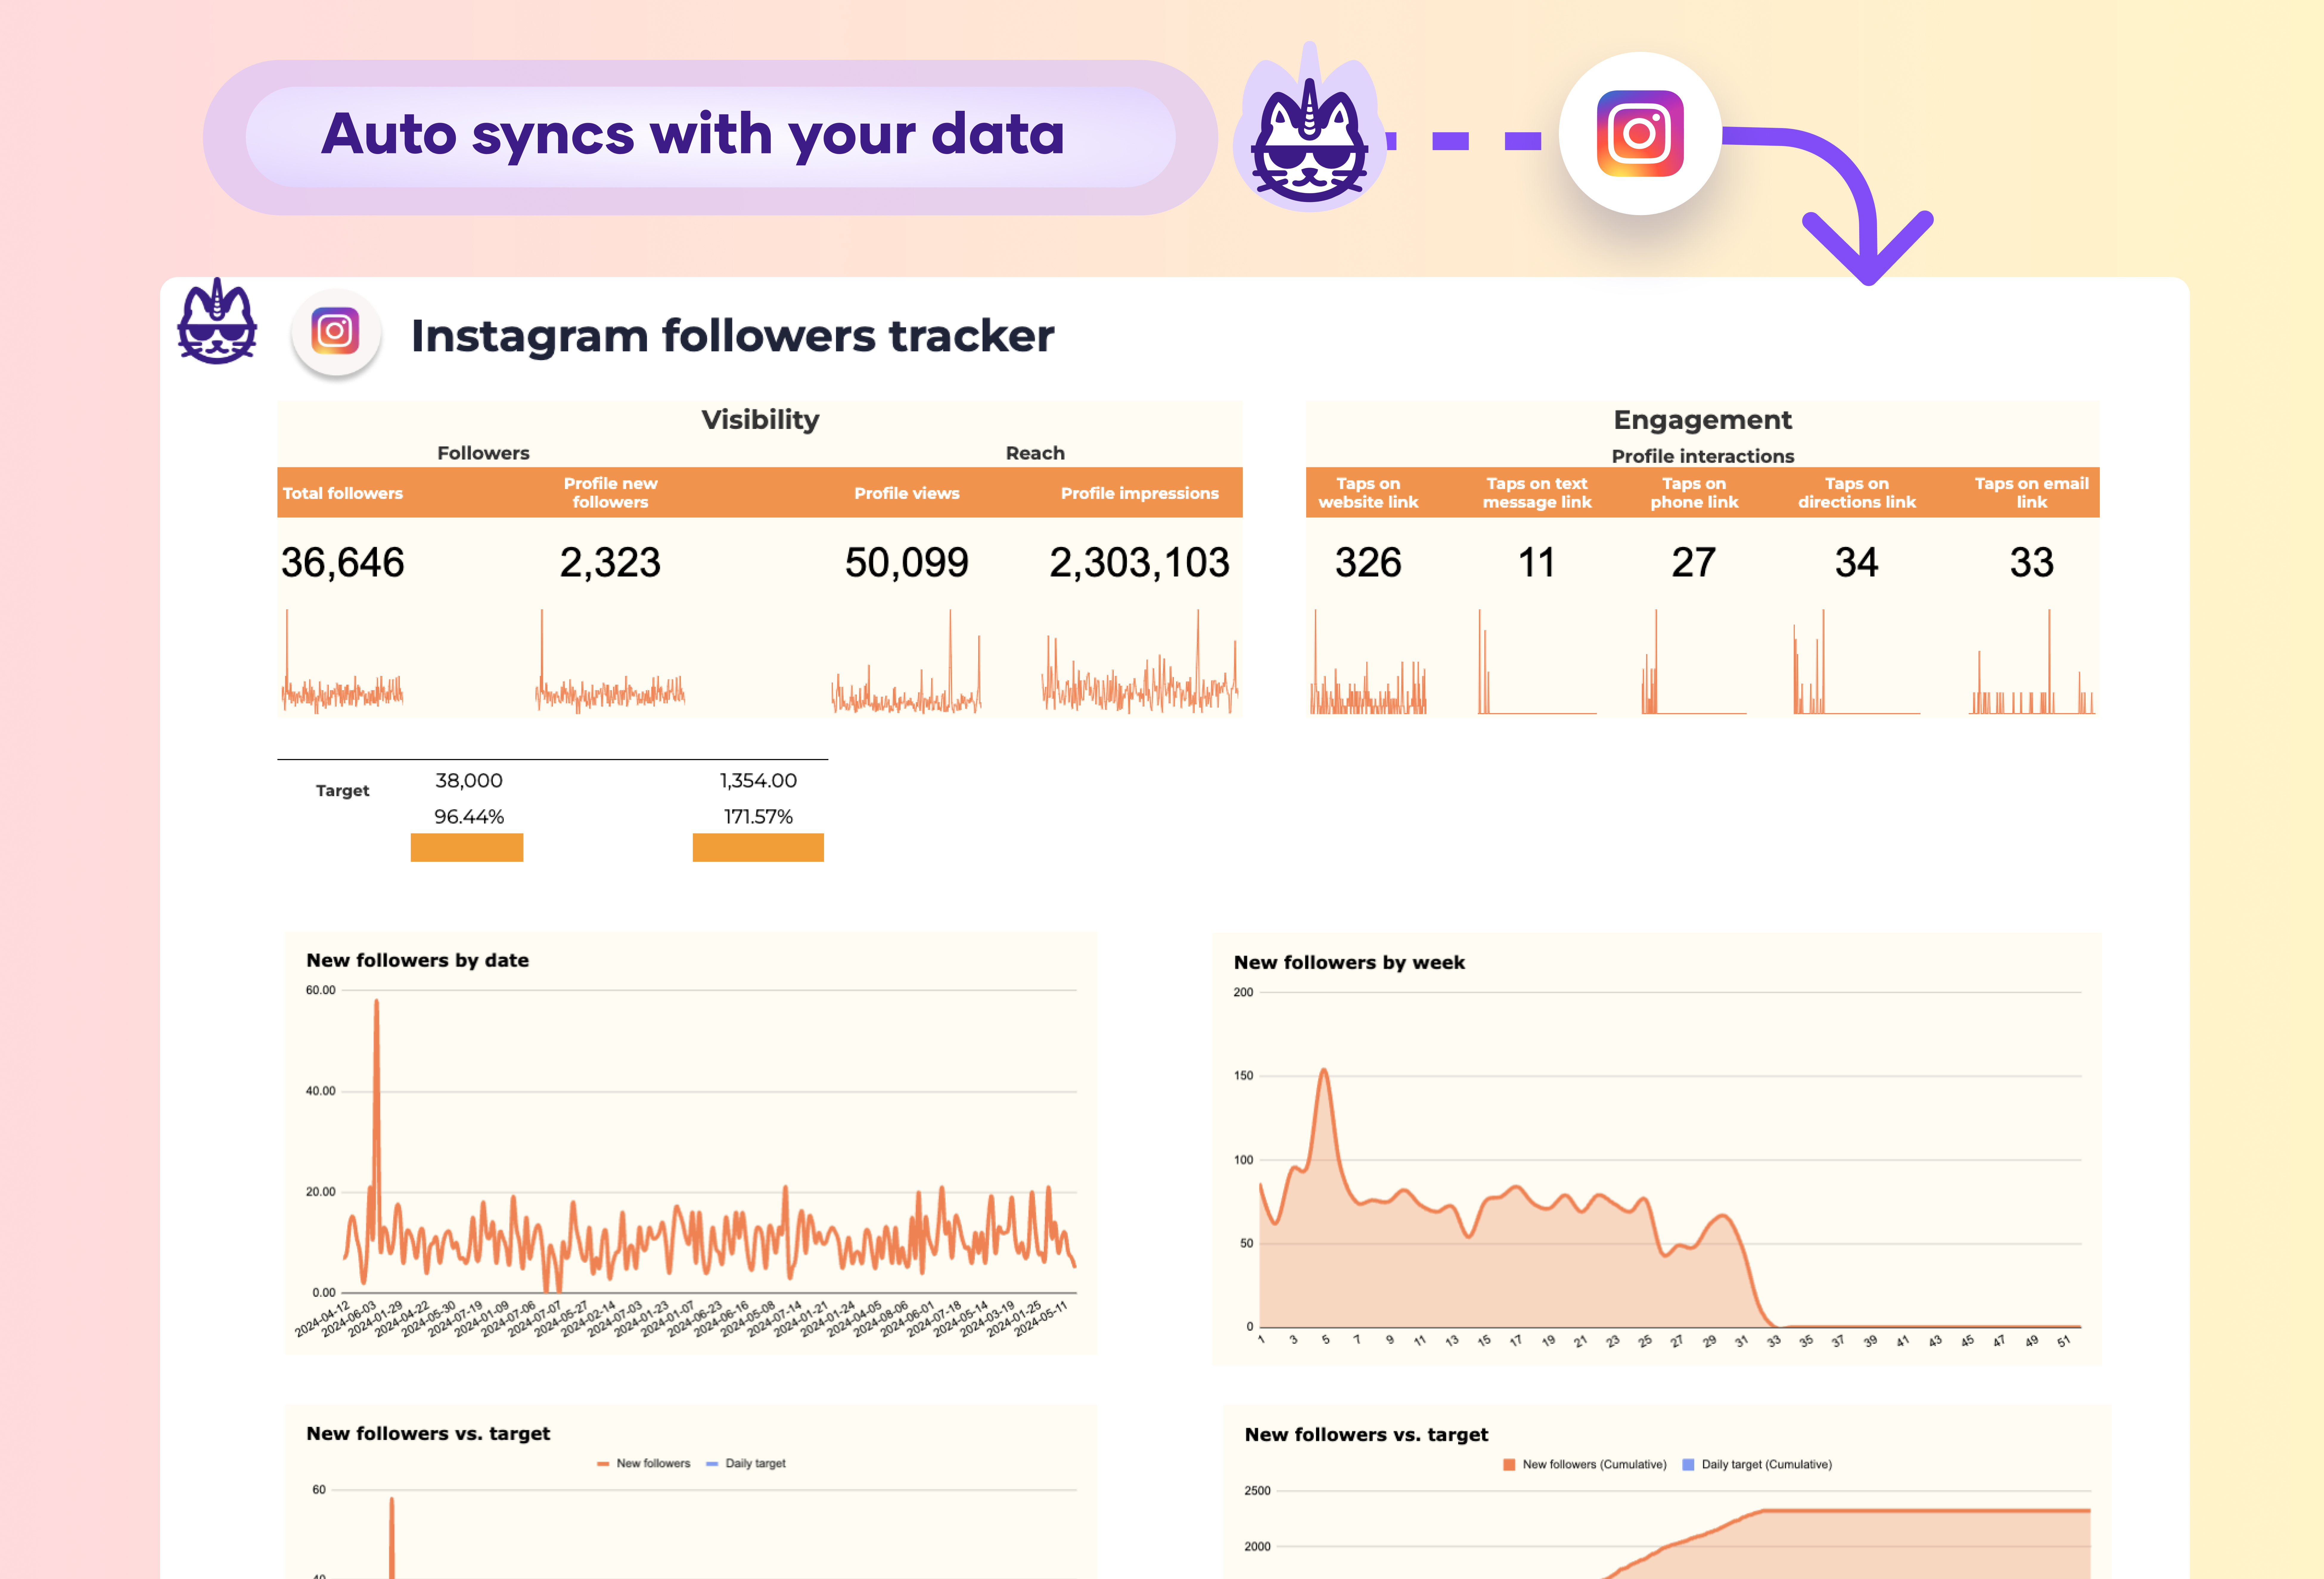
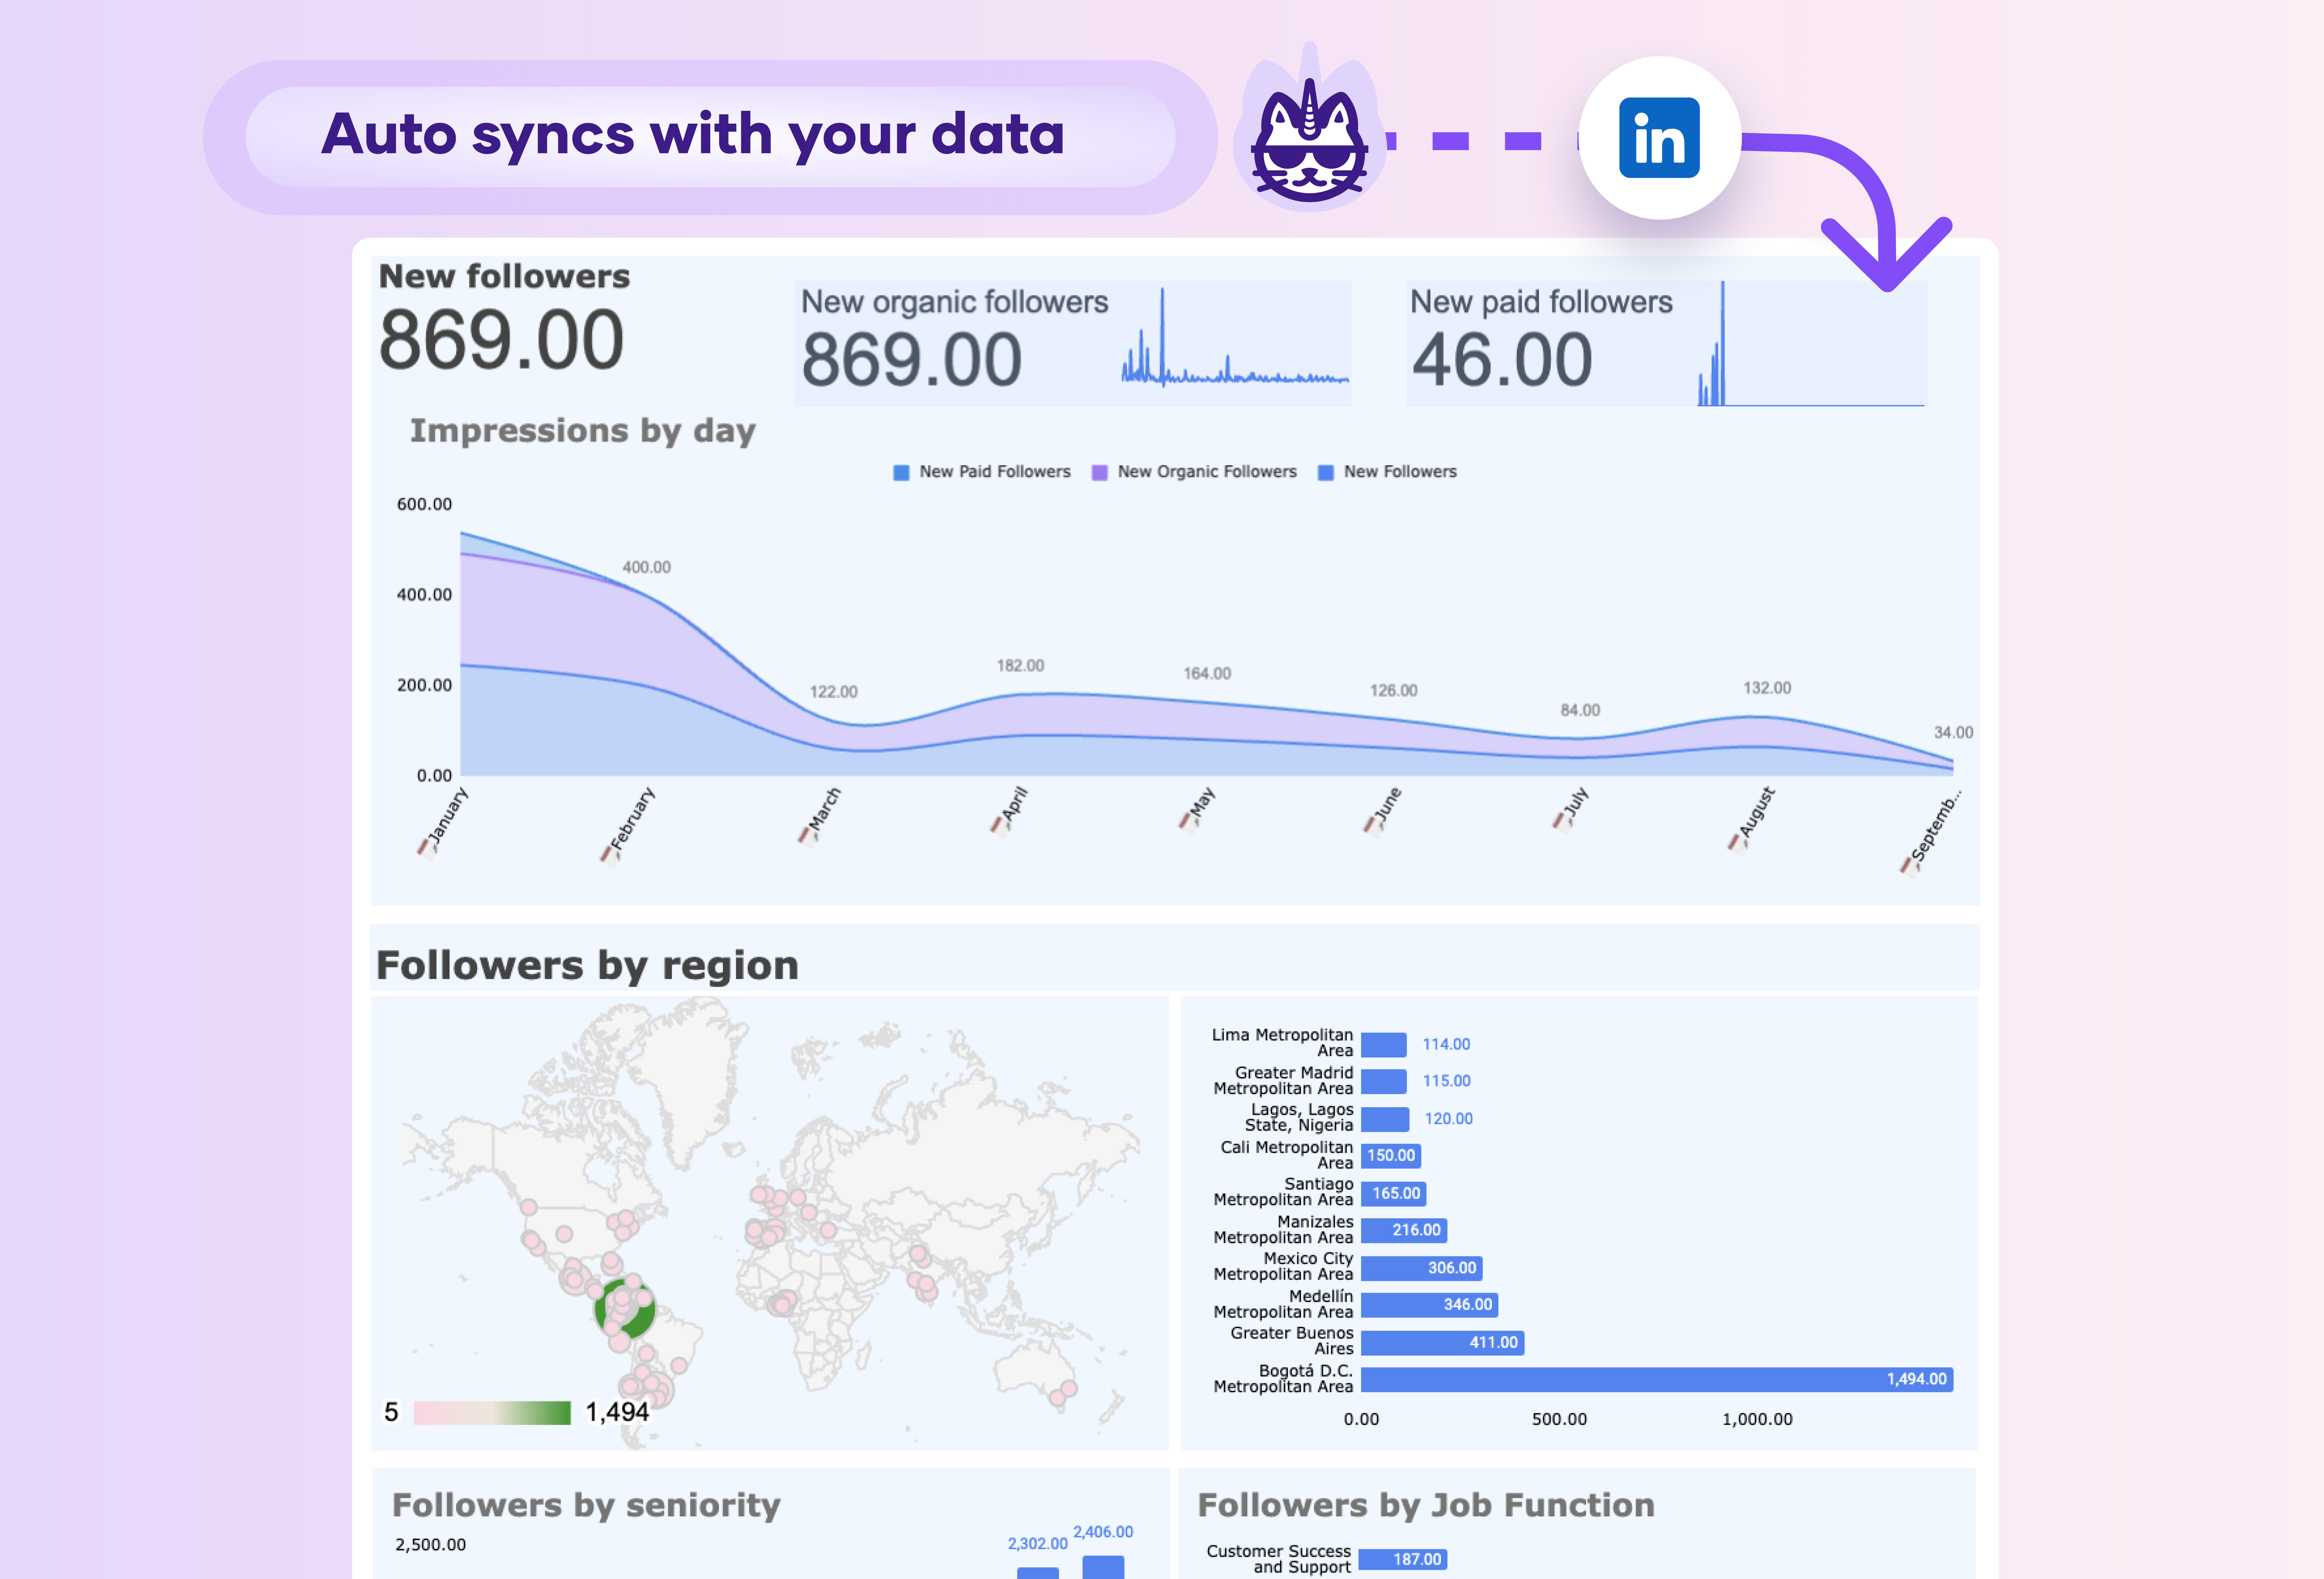
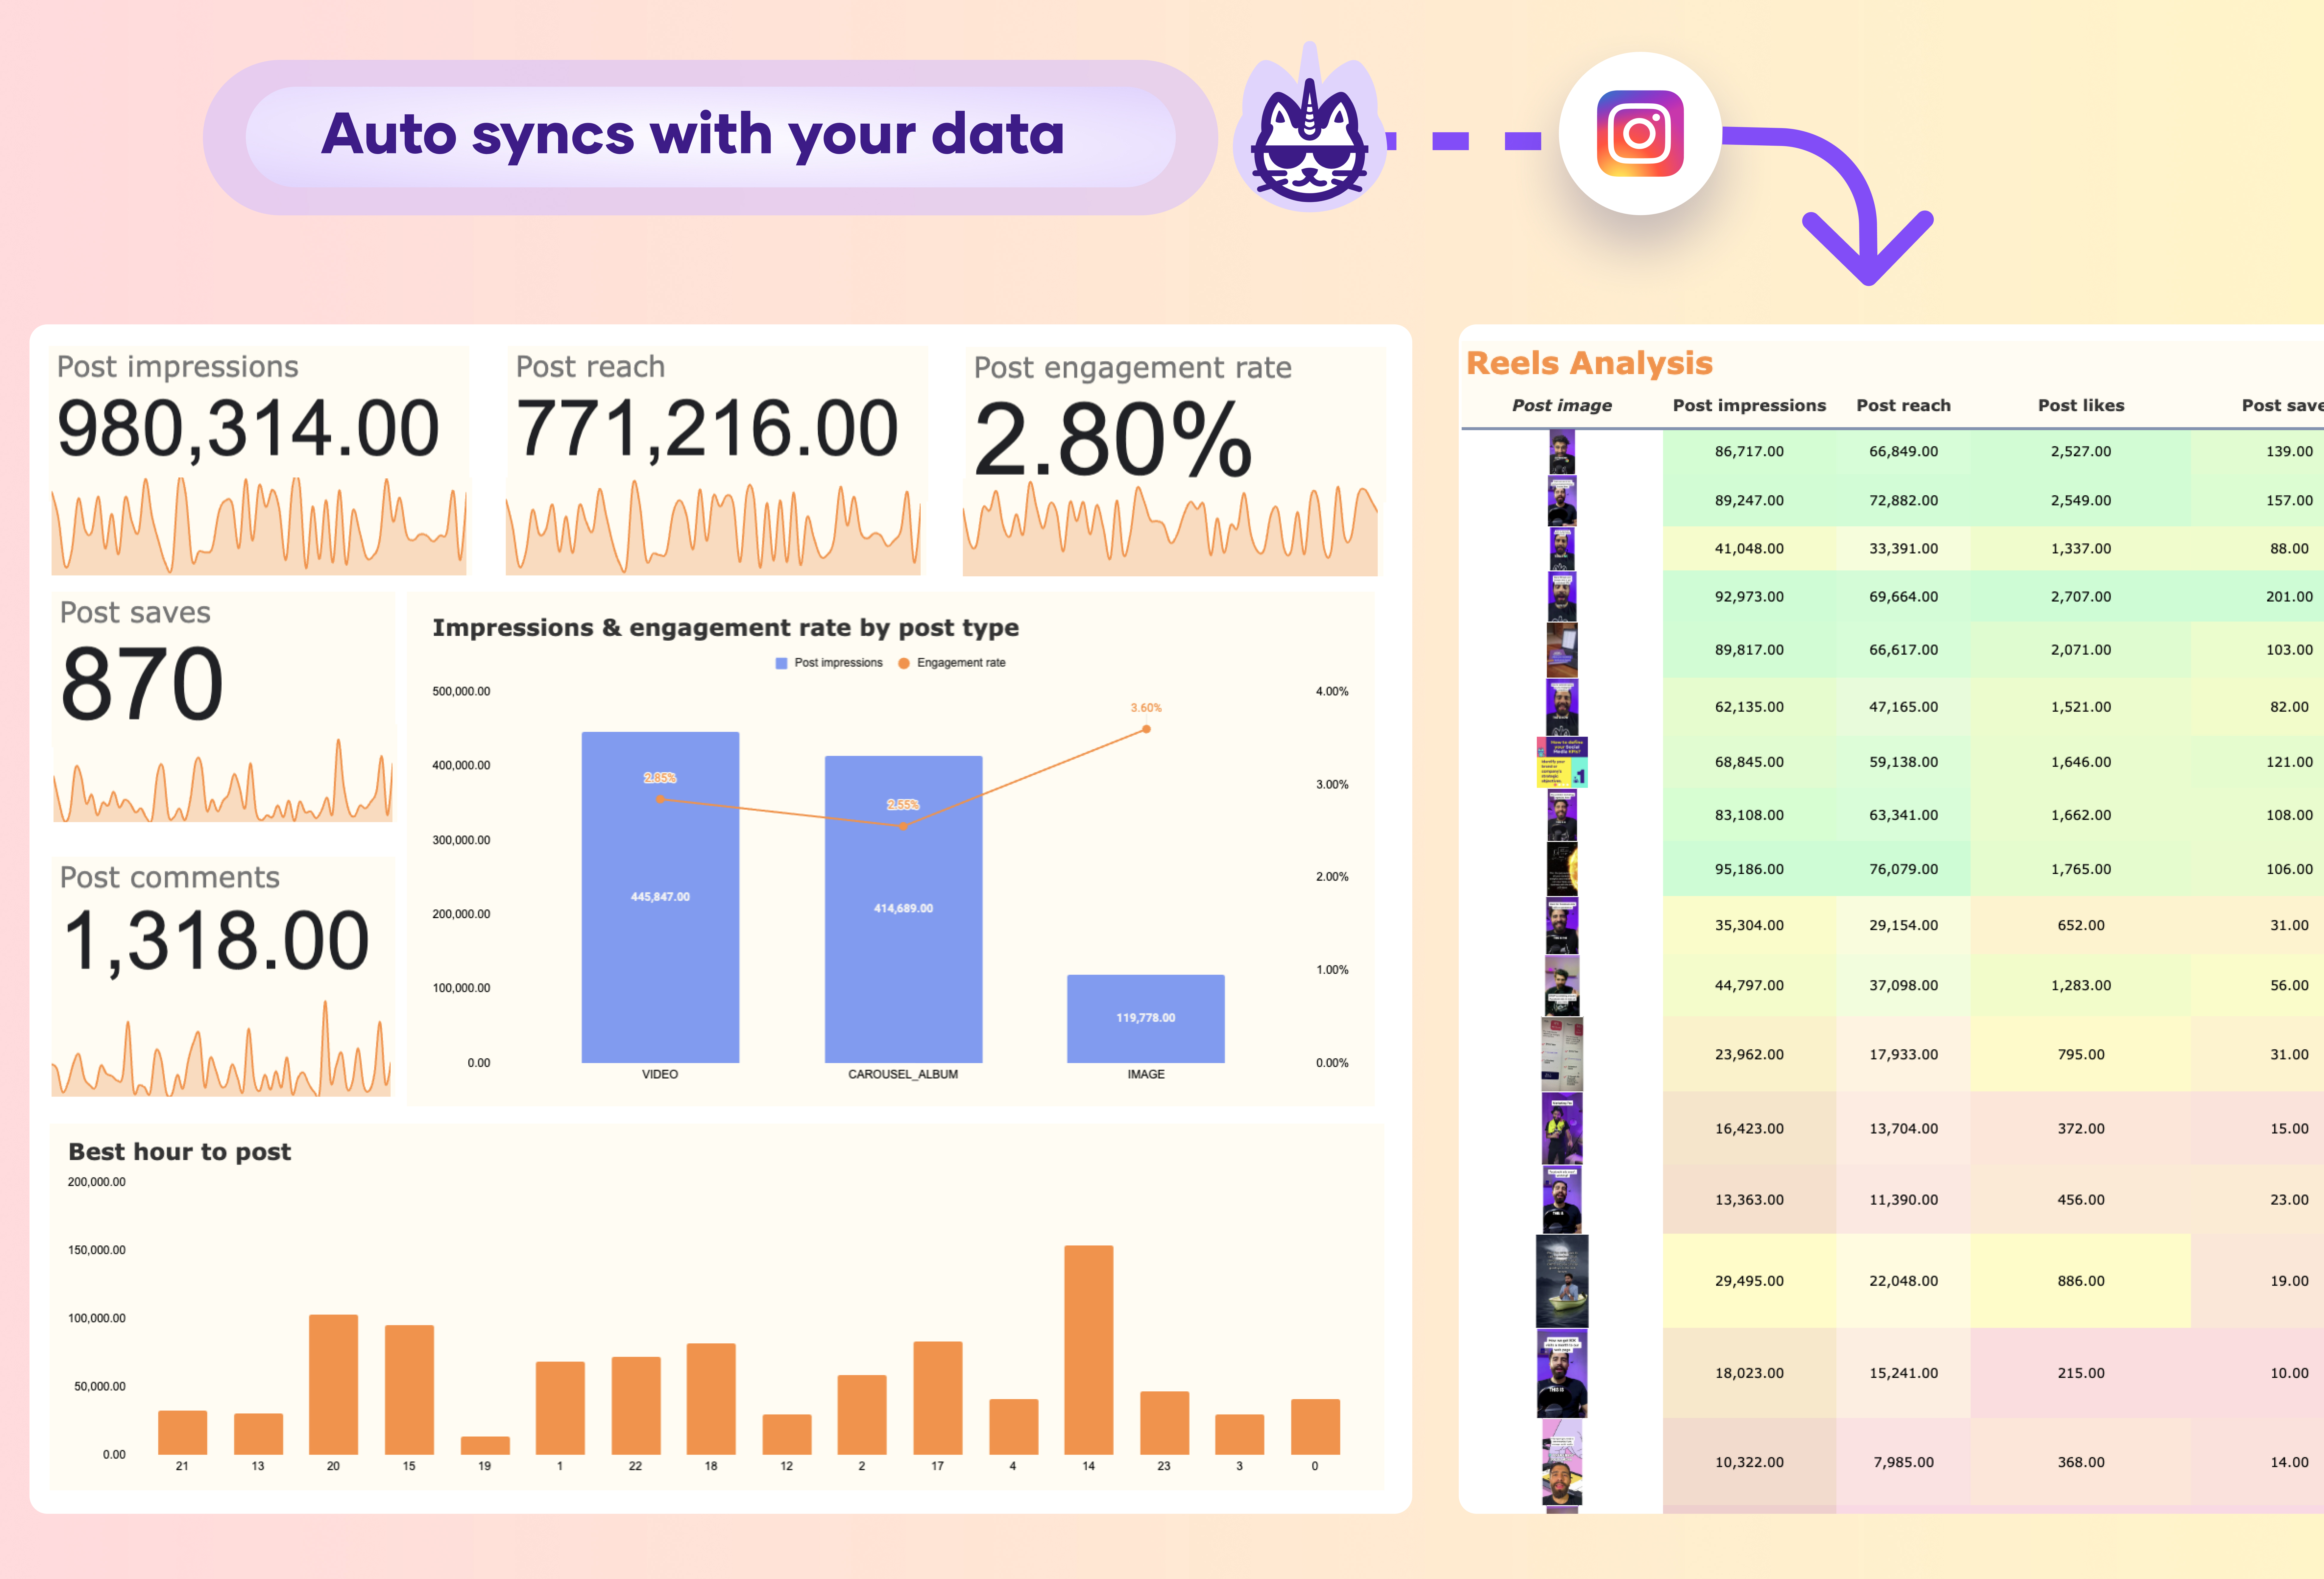
An Instagram Insights follower tracker dashboard should include total follower count, and new followers gained.

Track engagement metrics reach, impressions, profile visits, and website clicks to understand if your audience is showing intent signals.

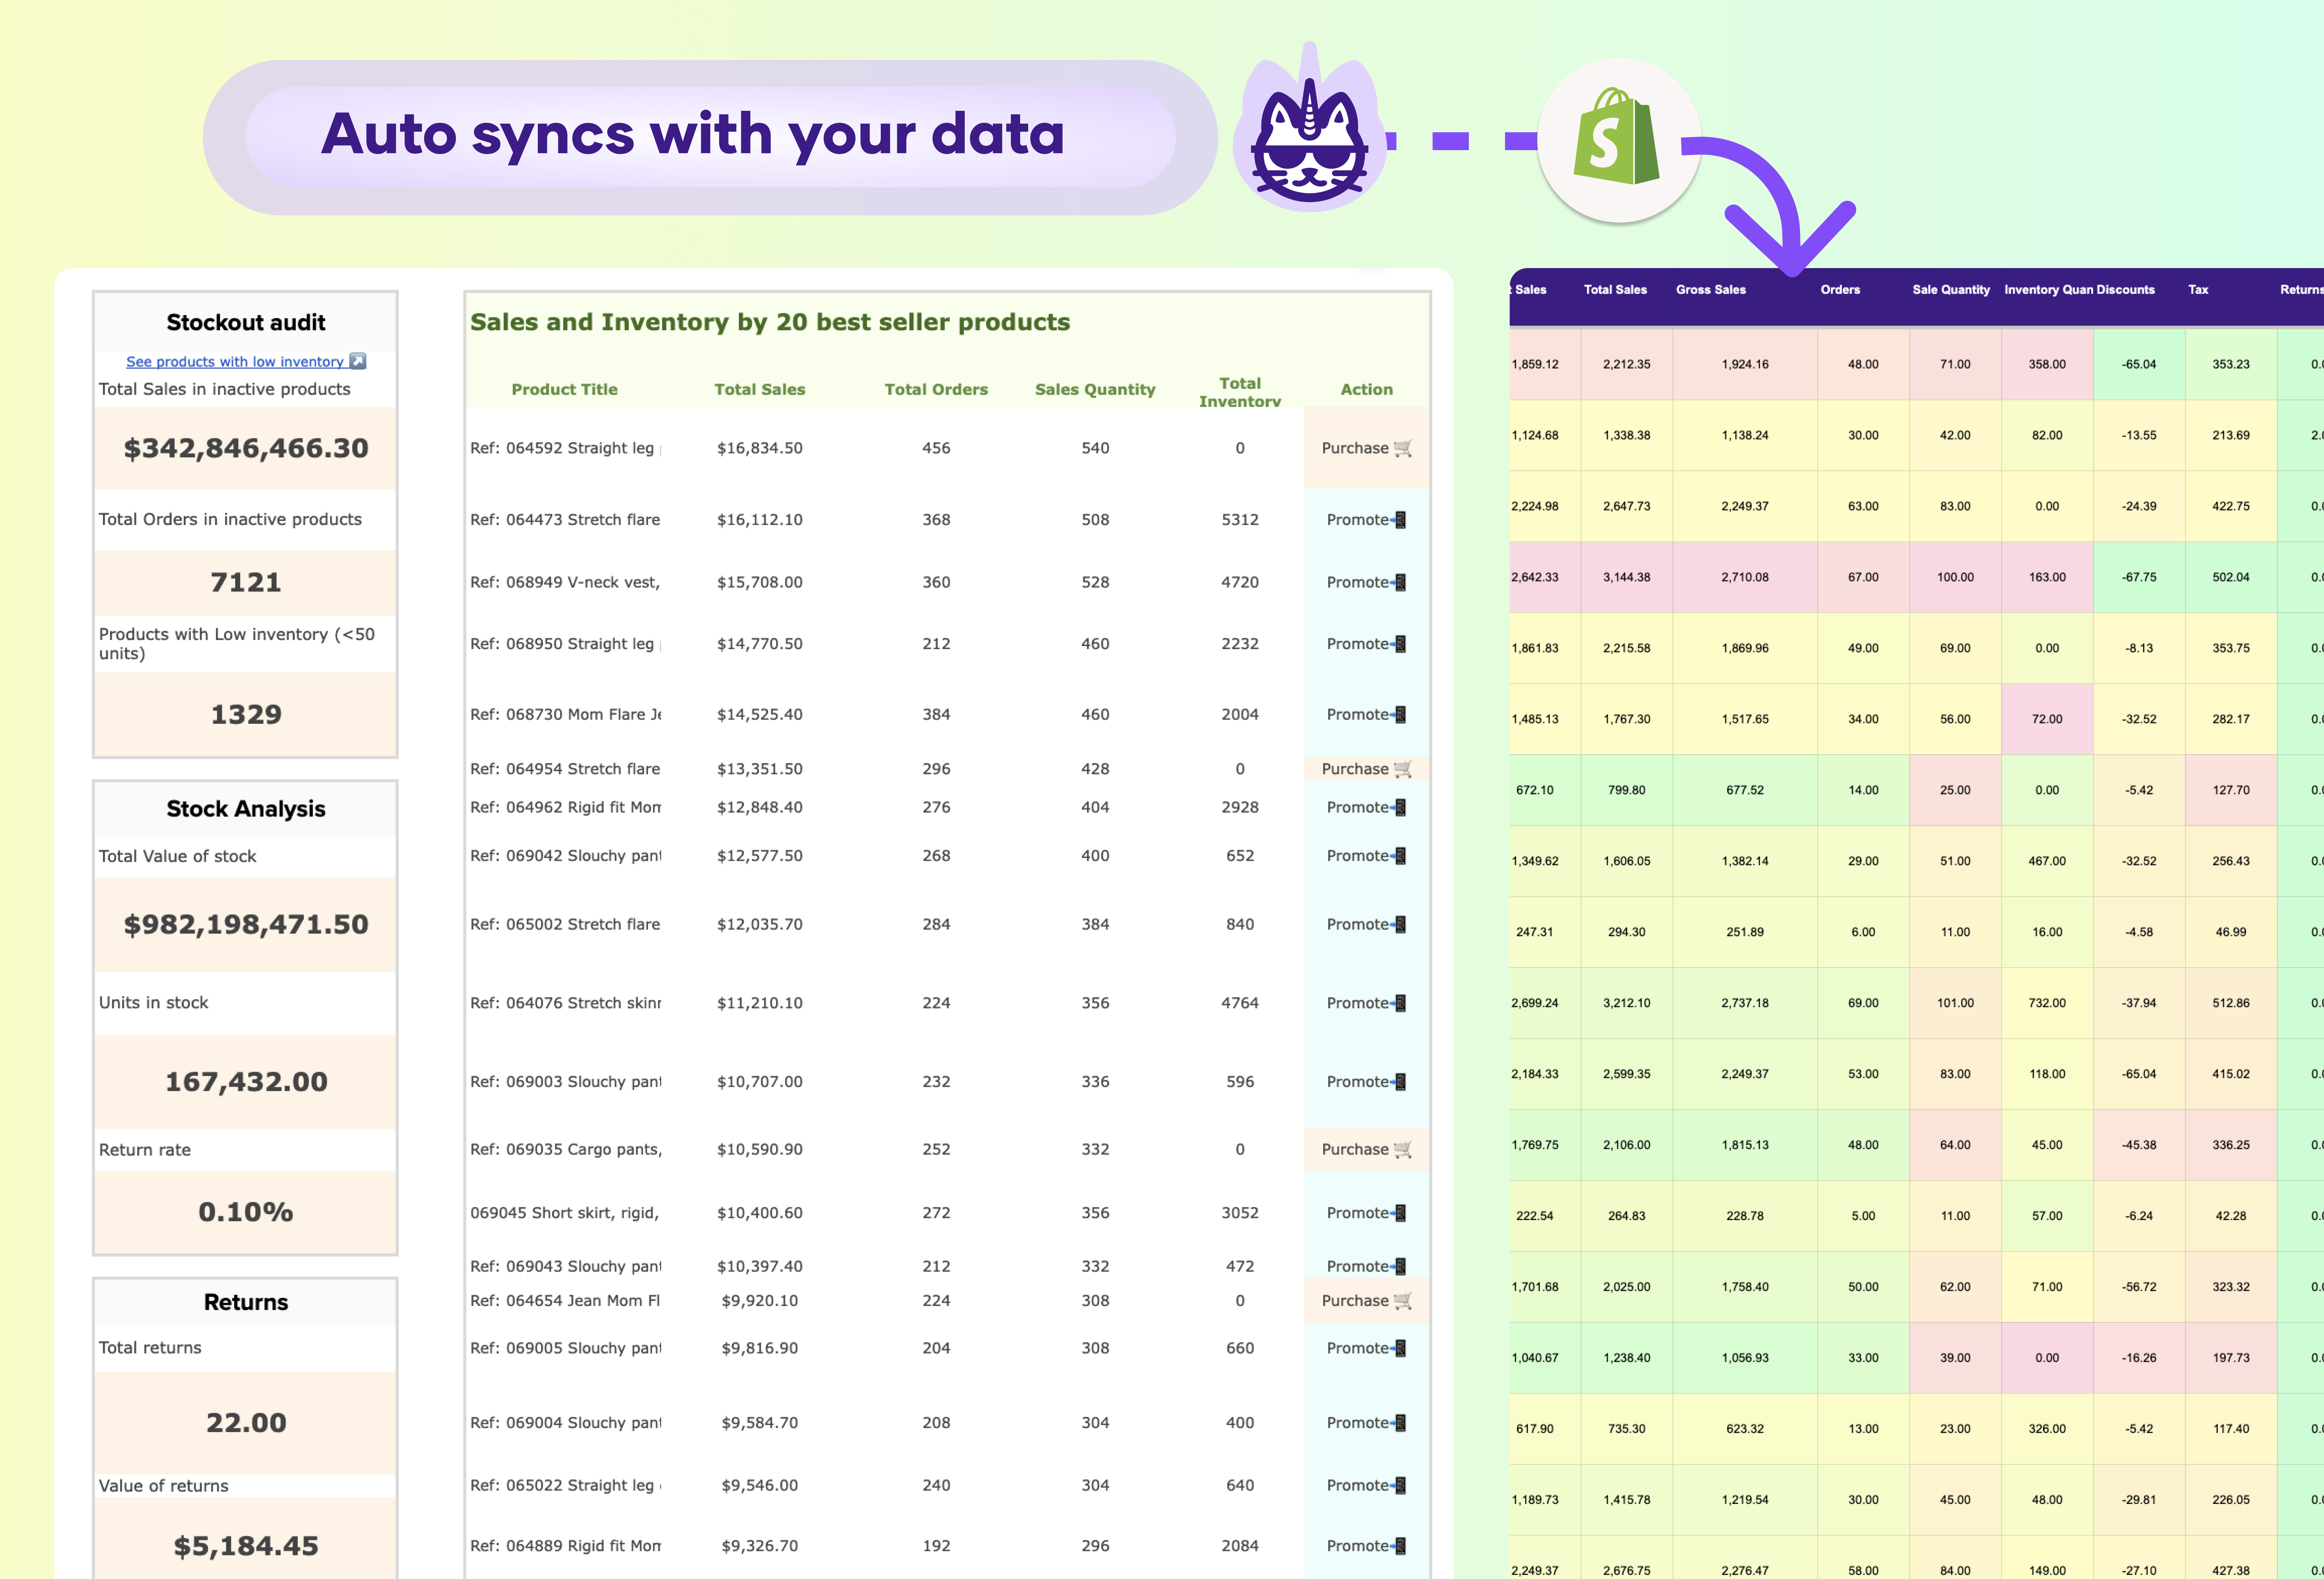
Include an auto-sync feature for real-time data updates from Instagram Insights. Optional additions: hashtag performance, post type comparisons, and engagement rate calculations.

While this template is designed specifically for Instagram Insights, you can use Google Sheets’ multichannel connectors such as LinkedIn Ads, GA4, Shopify to integrate data from other marketing platforms. By combining insights from different sources, you can create a unified view of your overall marketing performance.

To set up email alerts, use the built-in notifications feature in Google Sheets. You can create custom rules to trigger email alerts based on specific conditions, such as when your actual spend exceeds the budget or when pacing percentages hit certain thresholds.

Yes, you can fully customize the charts in the dashboard. You can choose different chart types, adjust colors, fonts, and styles, add data labels, legends, and trendlines, and customize axes and gridlines to match your reporting needs.