A website performance report should include visibility metrics such as organic search traffic, engagement metrics like average time on page, and conversion metrics such as conversion rate. The data should be segmented by campaign (e.g., email marketing), channel (e.g., social media), audience (e.g., age groups), content type (e.g., blog posts), objective (e.g., lead generation), and date. Examples of specific metrics could be organic search traffic as a visibility metric, average time on page as an engagement metric, and conversion rate as a conversion metric.
To analyze website performance data, we should focus on the following metrics:
1) Visibility metrics: Track metrics like organic search traffic, referral traffic, and keyword rankings to understand the website’s visibility in search engines and its exposure across different channels. For example, analyze the percentage of organic traffic compared to paid traffic.
2) Engagement metrics: Consider metrics like bounce rate, time on page, and page views per session to measure user engagement. For instance, compare the bounce rates of different landing pages to understand which pages need optimization.
3) Conversion metrics: Evaluate metrics such as conversion rate, goal completions, and revenue generated to measure the website’s effectiveness in driving conversions. For example, assess the conversion rates for different marketing campaigns or segments to identify the most successful ones.
To add context to the data, compare it against cost metrics, date ranges, goals, rates, and benchmarks. For example, compare the cost per conversion of different marketing campaigns or set goals based on industry benchmarks.
Segment the data by campaign, channel, audience, content, objective, and date to gain insights into specific areas. For example, analyze data by different advertising campaigns to identify which campaigns are driving the most conversions. Additionally, segment data by date to track any changes in performance over time.
Overall, the focus should be on selecting suitable metrics, adding context through comparisons, and segmenting data to gain actionable insights into website performance.
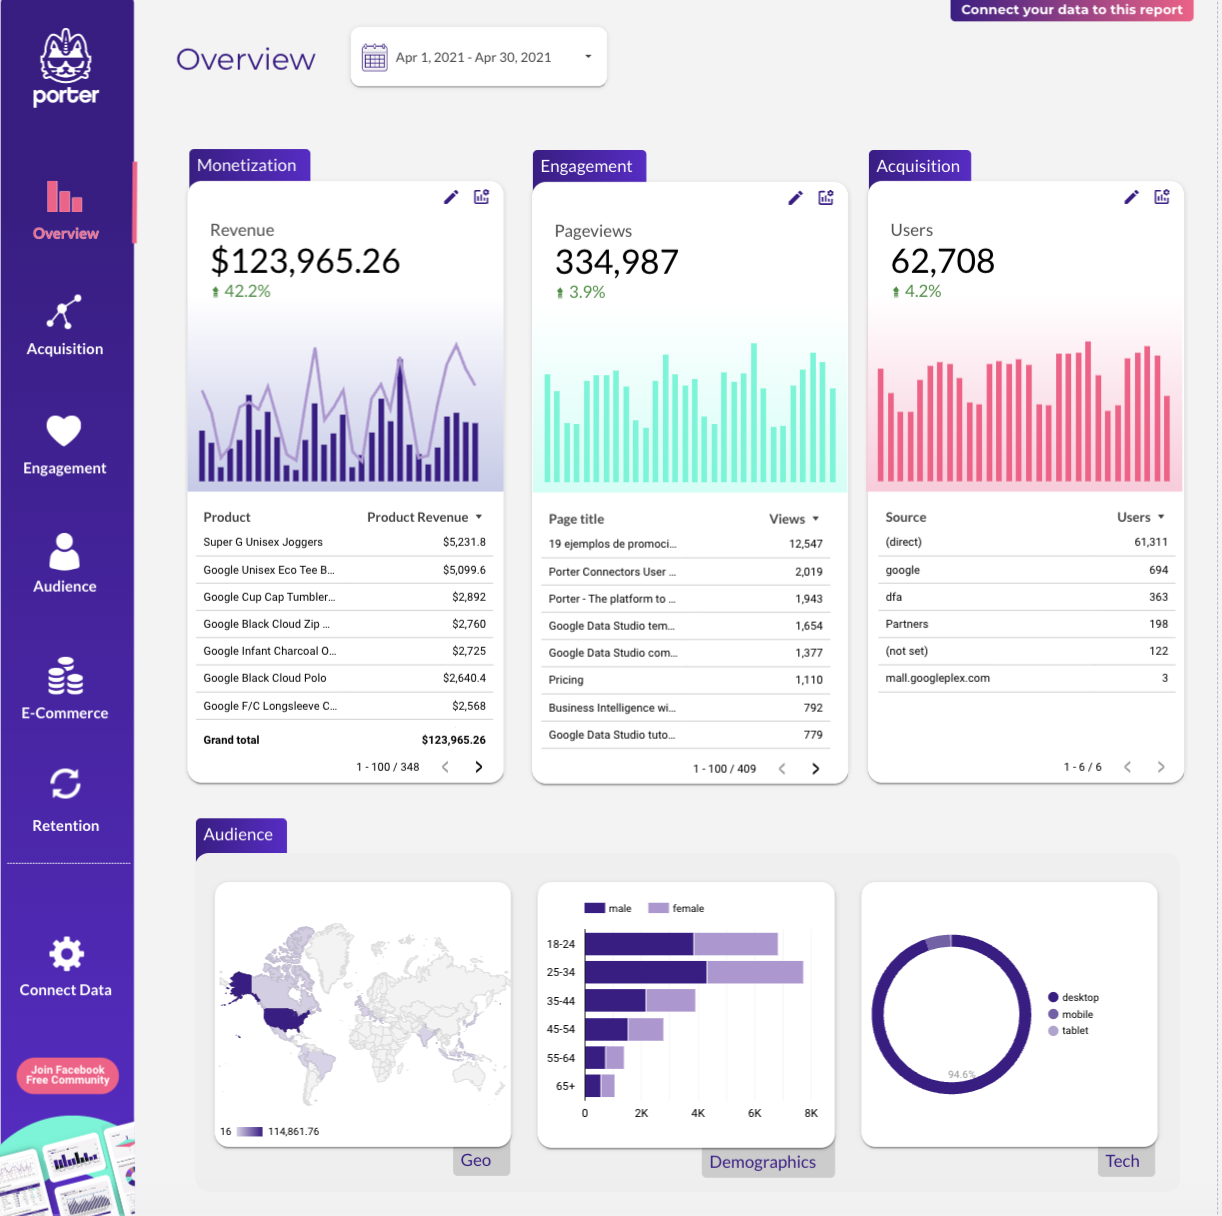
To build a website performance dashboard, 1) connect your data and accounts such as Google Analytics, Google Ads, and social media platforms. 2) Select the metrics to monitor performance like bounce rate, page views, and conversion rate. 3) Segment or break down data by campaign, channel, audience, product, customer content, objective, date. For example, you can segment data by the source of traffic (organic, paid, social, etc.) or by the type of content viewed (blog posts, product pages, etc.). 4) Add filters or buttons to make your report interactive, such as date range selectors or dropdown menus for different metrics. 5) Share your dashboard via PDF, scheduled emails, or links to keep your team updated.
A website performance dashboard is a visual tool that displays key metrics and data related to a website’s performance, such as traffic, bounce rate, conversion rate, and user behavior. It is significant for businesses as it helps them monitor and improve their website’s performance, thereby enhancing user experience and increasing conversions. Tools commonly used to create such a dashboard include Google Analytics, Looker Studio, and Tableau, and it typically includes elements like traffic sources, page views, session duration, and user demographics. Real-time data monitoring is crucial as it allows businesses to respond quickly to changes and optimize their strategies. For learning how to create a marketing dashboard using Looker Studio, you can refer to our YouTube channel: https://www.youtube.com/@porter.metrics.
 Google Analytics 4
 Impressions

