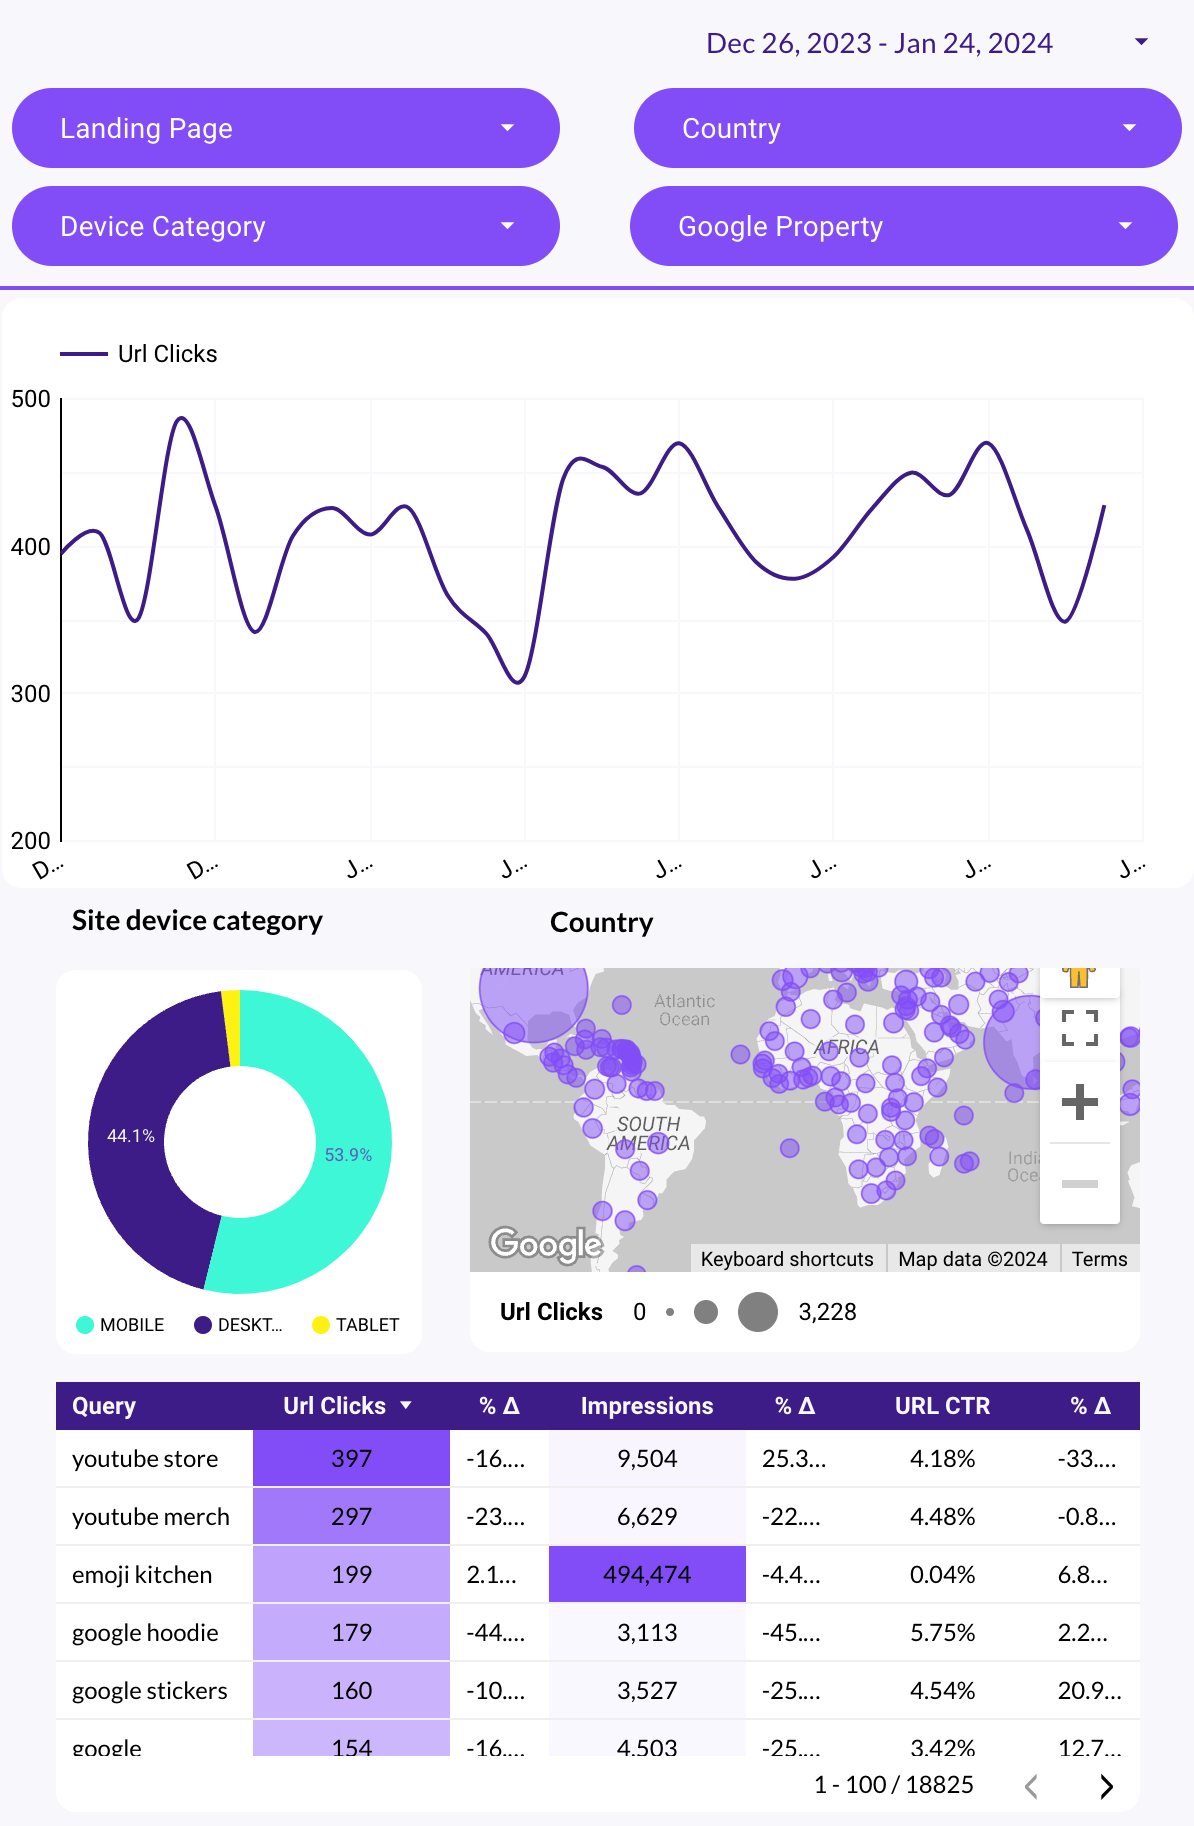
A One page SEO for Mobile report should include metrics such as conversion metrics like conversion rate, cost per conversion, and return on investment (ROI); engagement metrics like click-through rate, impressions, and shares; and visibility metrics. Such data should be segmented and filtered by campaign dimensions like organic keyword rankings, paid keyword rankings, and keyword rank changes over time; audience dimensions like campaign, audience, and time; and time dimensions like by hour, day, week, month, quarter, or year. Once the data is ready, make sure to add buttons and filters to make your reports interactive, custom colors and logos to make it white-label, and share via link, PDF, or email so your teams or clients can access it.
To build a one-page SEO for Mobile dashboard, 1) connect your Google Analytics and Search Console accounts to gather data. 2) Select metrics such as organic traffic, bounce rate, and page load time to monitor performance. 3) Segment data by campaign, channel, audience, product, customer content, objective, and date. For example, you can break down data by mobile organic traffic campaign, organic search channel, and target audience. 4) Add filters or buttons for metrics like bounce rate and page load time to make your report interactive. 5) Share your dashboard via PDF, scheduled emails, or links.
Yes, Looker Studio allows you to download your report as a PDF. To do it, follow these steps:
Before downloading your report choose the date range you want to visualize on your report.
Click on the “File” menu at the top left corner of the screen.
Select “Download as” from the drop-down menu and choose “PDF.”
You can choose which pages you want to download, and also you can add a password to protect the report and add a link back to the online report.
Click on “Download” to save the report on your device.