
Trusted by 1,600+ marketing teams and agencies


Facebook Ads report templates
Porter’s 32 Facebook Ads report templates are grouped by what each one reports on. Filter by tool or use case and open a card for its preview and setup.
32 templates
Facebook Ads overview reports
 Claude

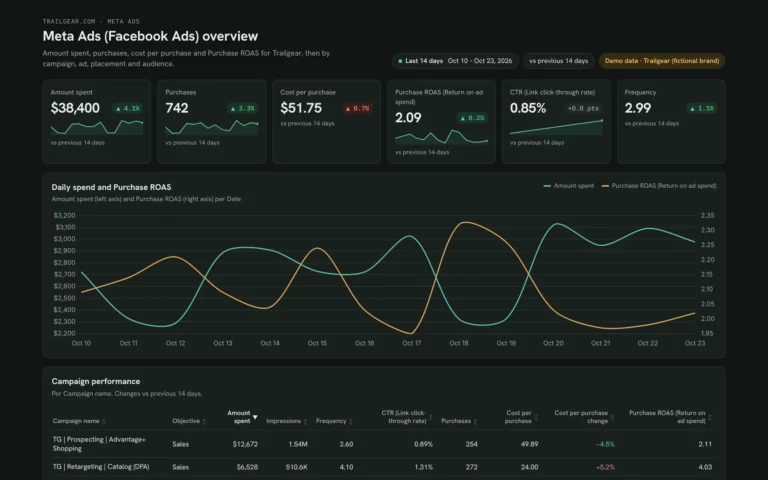
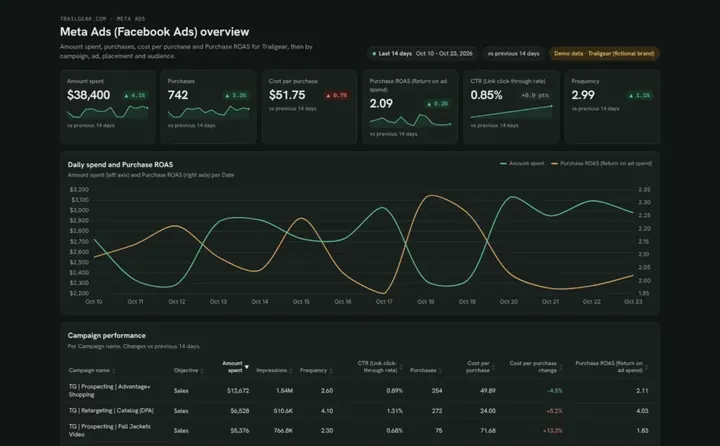
Meta Ads dashboard template
Track Meta Ads spend, ROAS and cost per purchase, and catch ad fatigue early.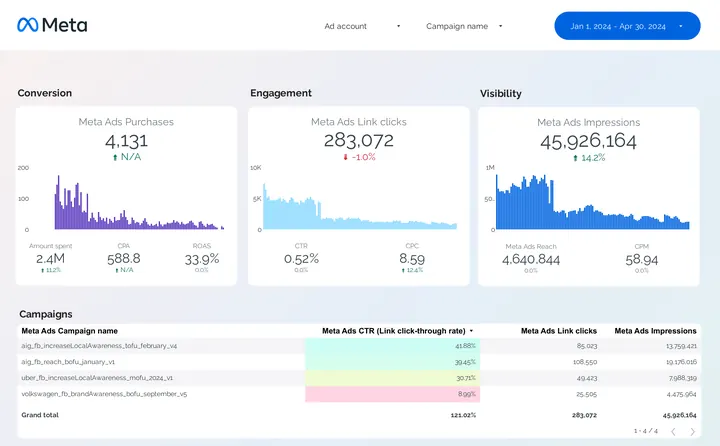
 Porter dashboard
Facebook Ads dashboard
Give clients one live link to each campaign and ad's results.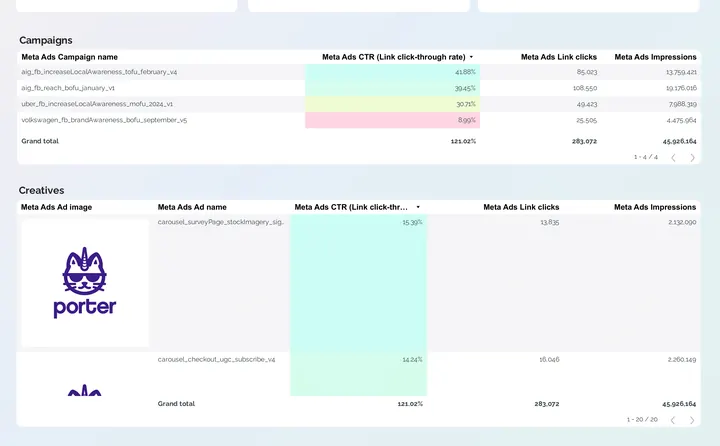
 Data Studio
Facebook Ads report template
See which campaigns, ad sets and ads earn their spend.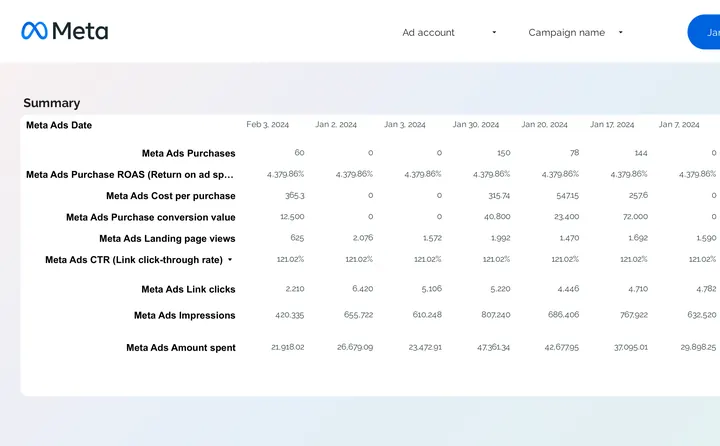 Porter dashboard
Facebook Ads KPI tracker
Check every KPI day by day against the previous period.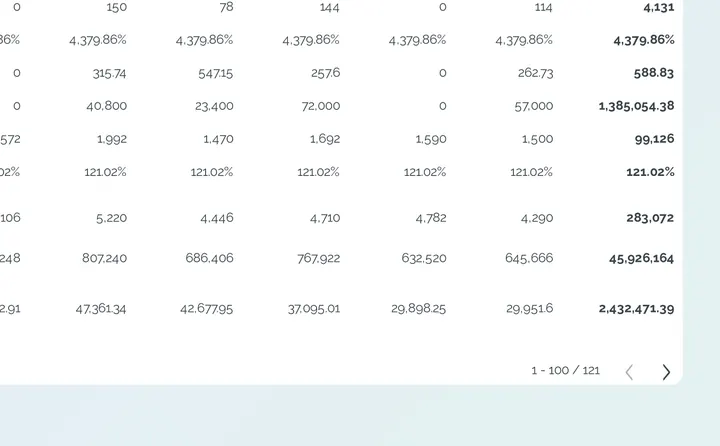 Data Studio
Facebook Ads KPI tracker
Follow your Facebook Ads KPIs over time and spot the day a number turned.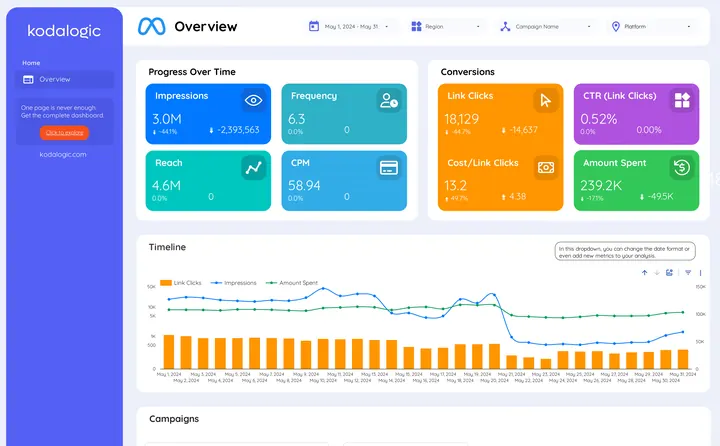 Porter dashboard
Meta Ads dashboard by Kodalogic
See impressions, link clicks and spend by campaign, device and state on one page.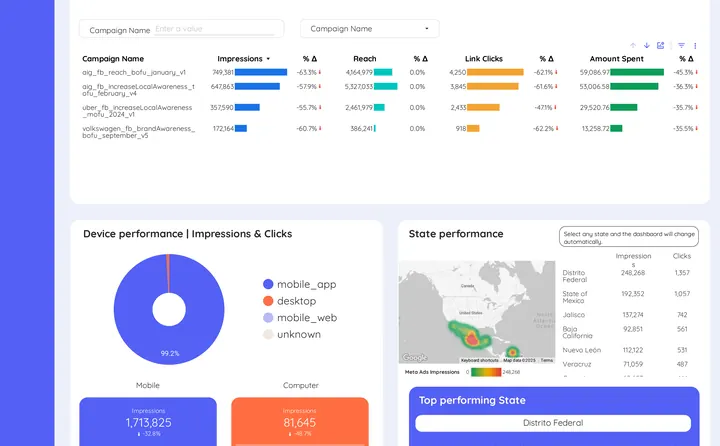 Data Studio
Meta Ads report by Kodalogic
Compare campaigns, ad sets and placements on one page.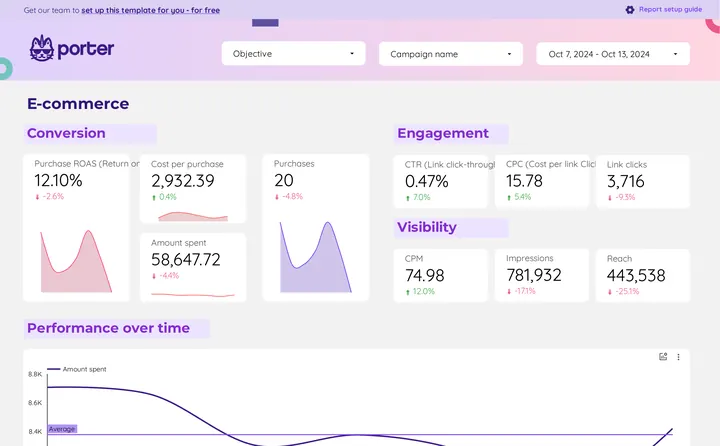 Data Studio
Facebook Ads monthly client report
Send clients a month-by-month view of spend, results and cost per result.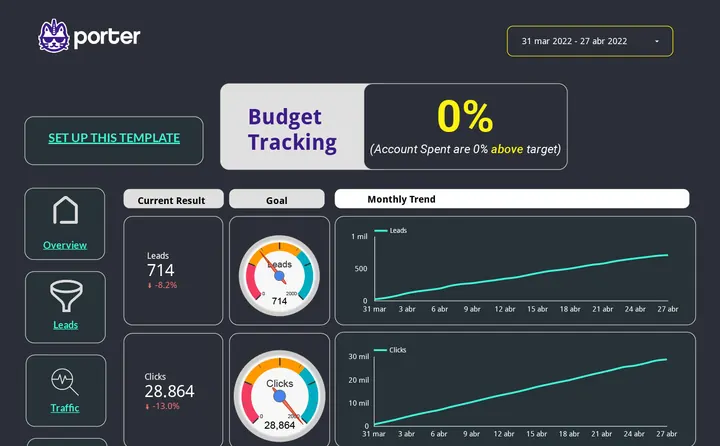 Data Studio
Facebook Ads goal tracker
Compare leads, clicks and conversions with your goals on gauges and monthly trend lines.Campaign and audience reports
 Porter dashboard
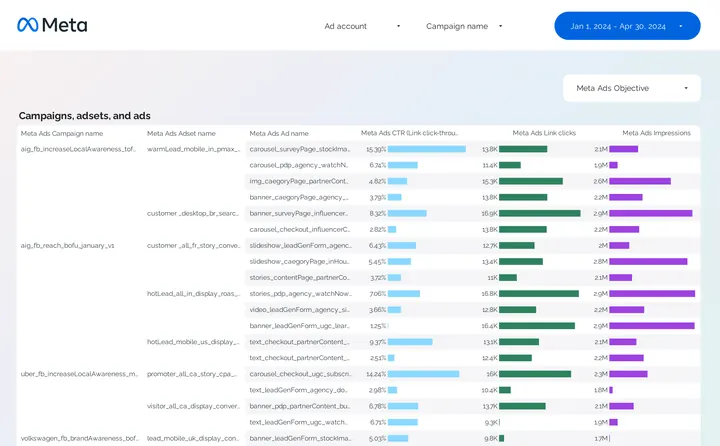
Facebook Ads campaign performance
Find the campaign whose cost per purchase is climbing before it eats the budget.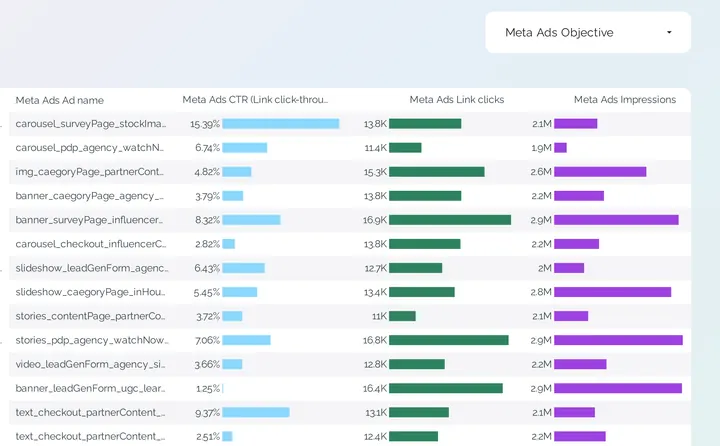 Data Studio
Facebook Ads campaign performance
Compare campaigns by objective, placement and audience.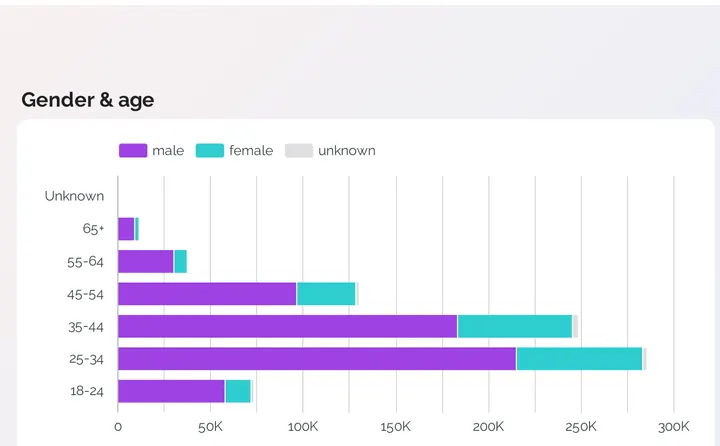 Porter dashboard
Facebook Ads audience
Learn which ages, genders, countries and placements bring results.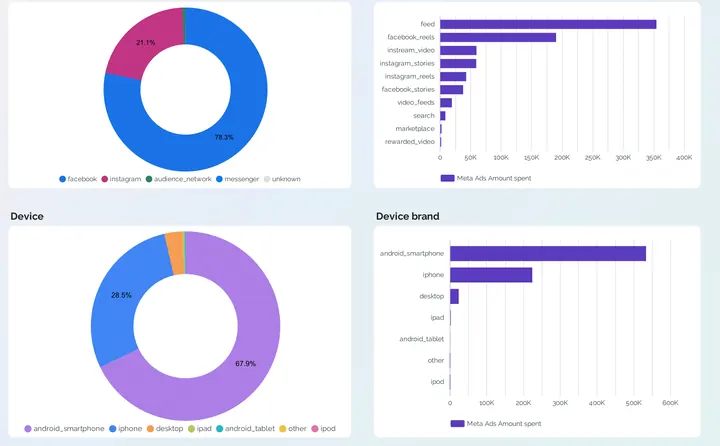 Data Studio
Facebook Ads audience
Break down results by age, gender and location to target better.Funnel and attribution reports
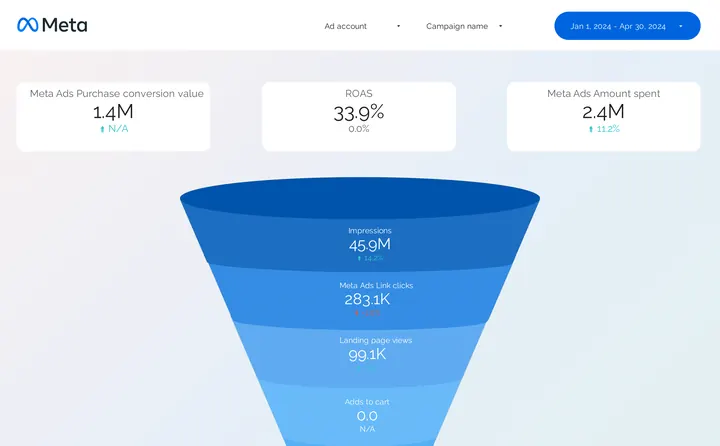 Porter dashboard
Facebook Ads funnel
See where people drop between impression, click and purchase.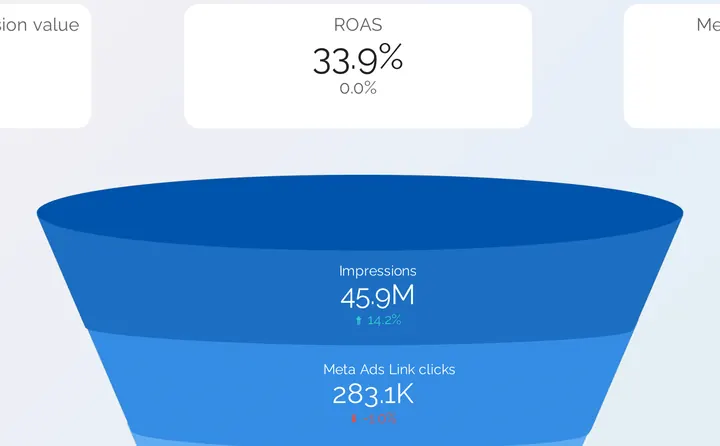 Data Studio
Facebook Ads funnel
Follow each campaign from impressions to conversions and find the leak.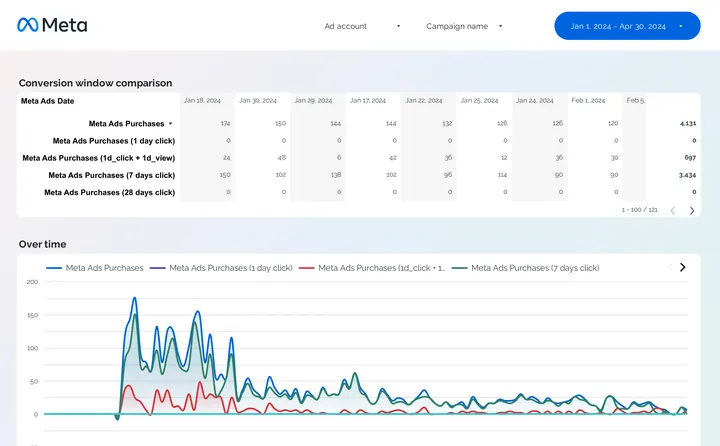 Porter dashboard
Facebook Ads attribution
Compare purchases across conversion windows before you judge a campaign.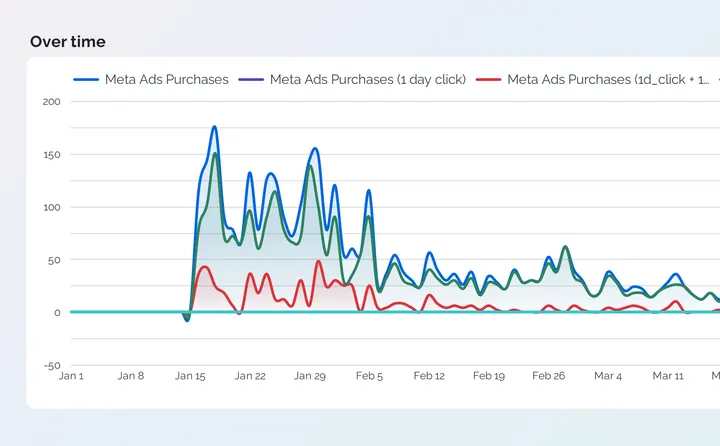 Data Studio
Facebook Ads attribution
See how the attribution window changes each campaign's purchases.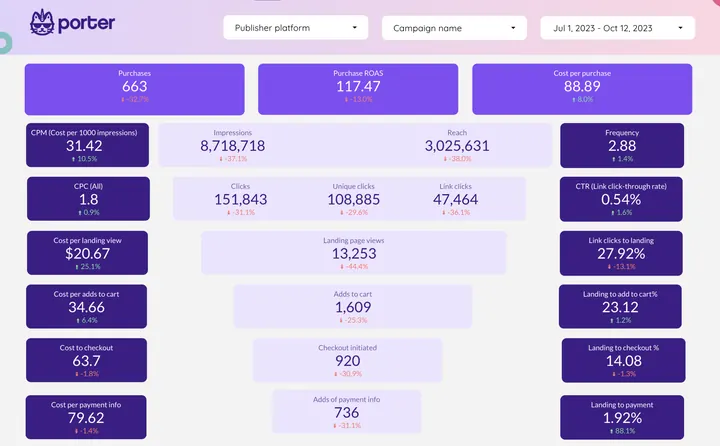 Data Studio
Facebook Ads e-commerce funnel
Follow purchases from impression to landing page, cart, checkout and payment.Budget tracking and pacing reports
 Porter dashboard
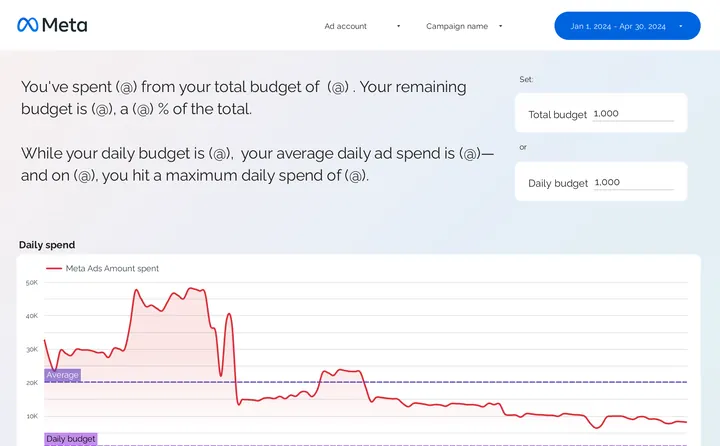
Facebook Ads budget tracking and pacing
Know if you are over or under budget and what to spend per day.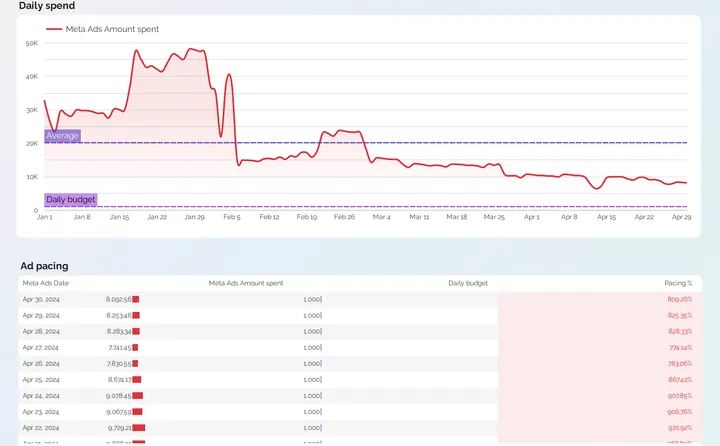 Data Studio
Facebook Ads budget tracking and pacing
Compare daily and cumulative spend with your budget for the month.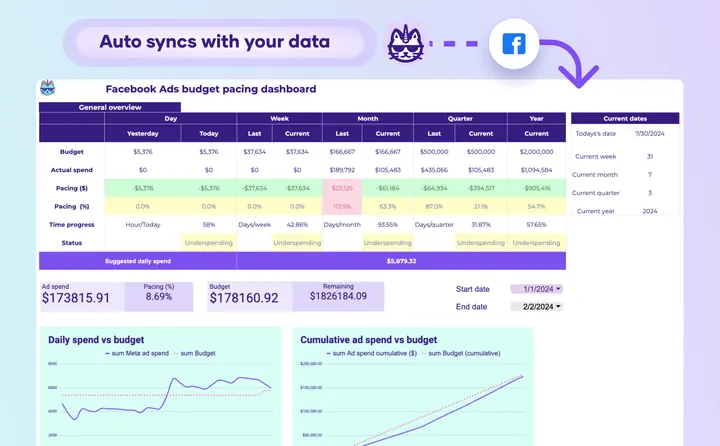
 Google Sheets
Facebook Ads budget tracking and pacing
Get the daily spend that finishes the month on budget.Facebook Ads with other channels
 Claude


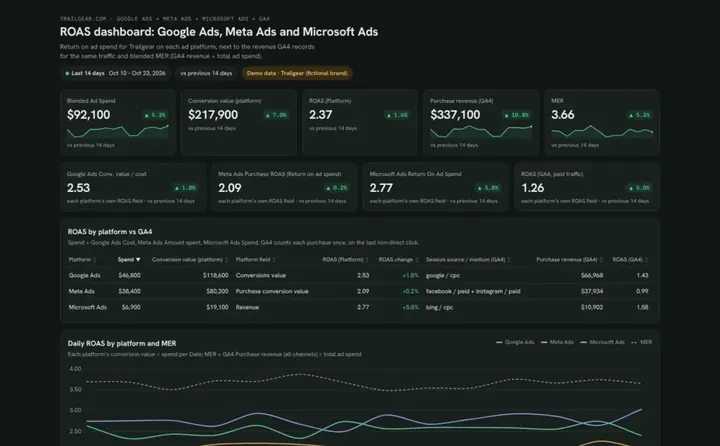
ROAS dashboard template
Check each ad platform's ROAS against GA4 revenue and find campaigns below break-even.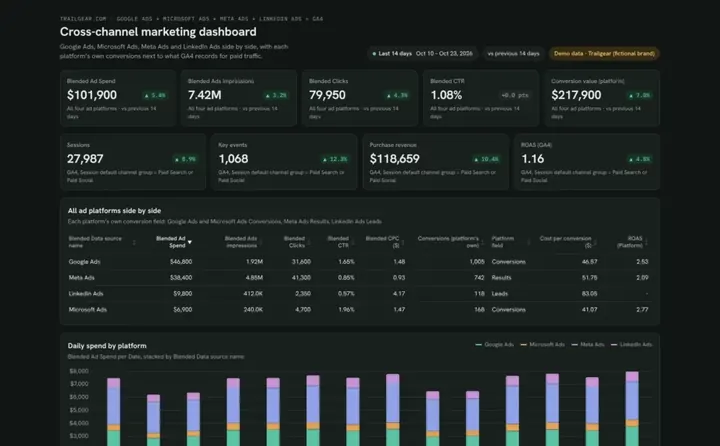 Claude

Cross-channel marketing dashboard template
Compare spend, CPA and ROAS across your ad platforms next to GA4.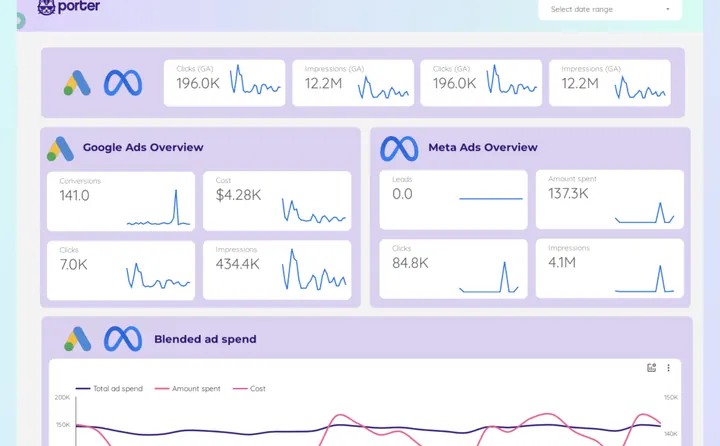 Porter dashboard
Facebook Ads + Google Ads
Put Facebook Ads next to Google Ads to see which one brings cheaper conversions.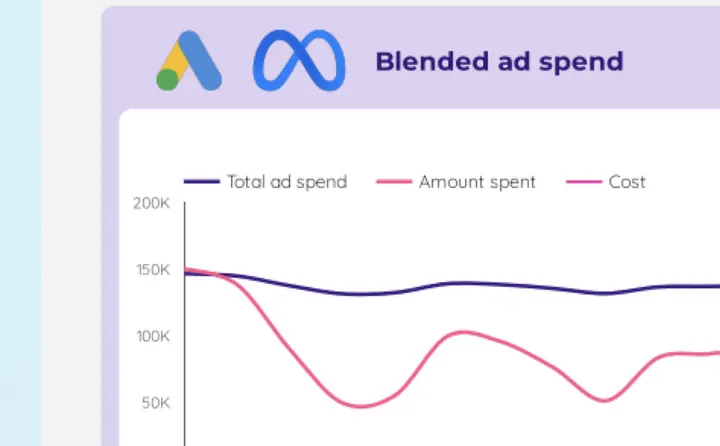 Data Studio
Facebook Ads + Google Ads
Compare Facebook Ads and Google Ads spend in one blended chart.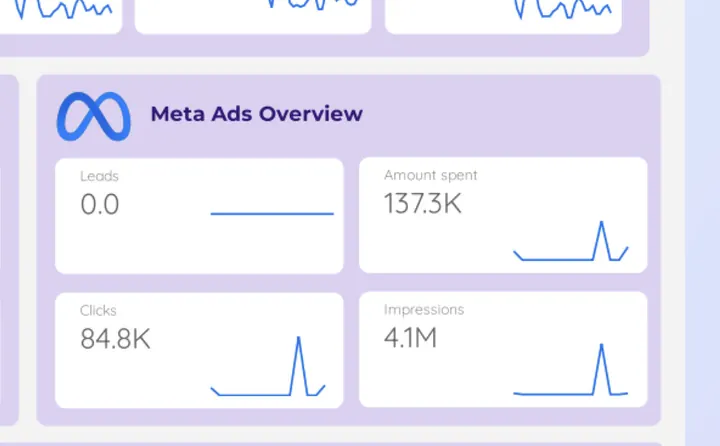 Data Studio
Facebook Ads and Google Ads overview
Put Google Ads and Meta Ads clicks, cost and conversions side by side with blended spend.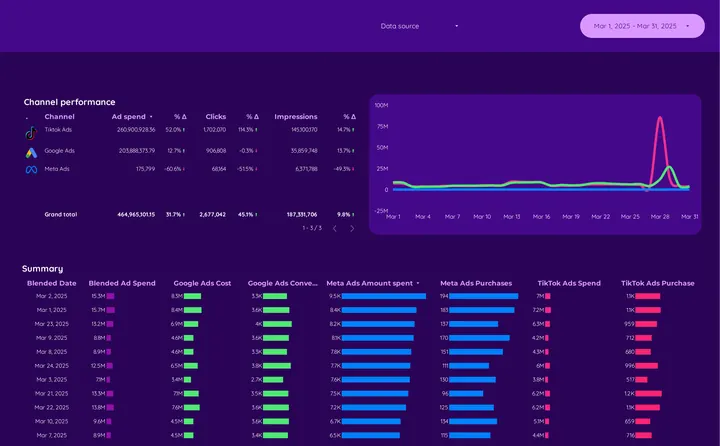 Porter dashboard

Paid media e-commerce
Put Google Ads, Meta Ads and TikTok Ads spend next to purchases, day by day.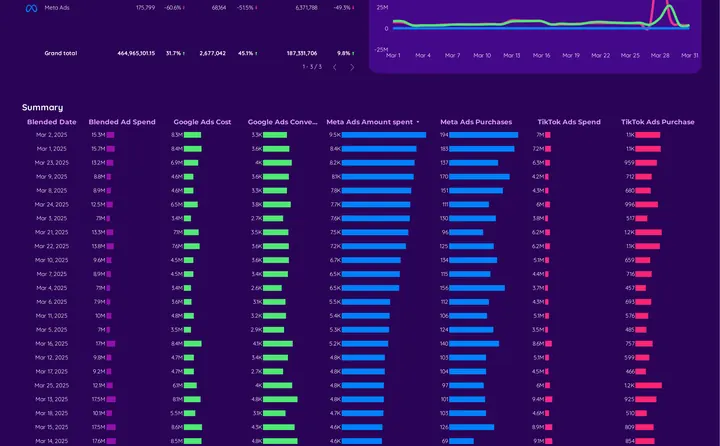 Data Studio
Paid media e-commerce
Compare TikTok Ads, Google Ads and Meta Ads spend and purchases day by day in one table.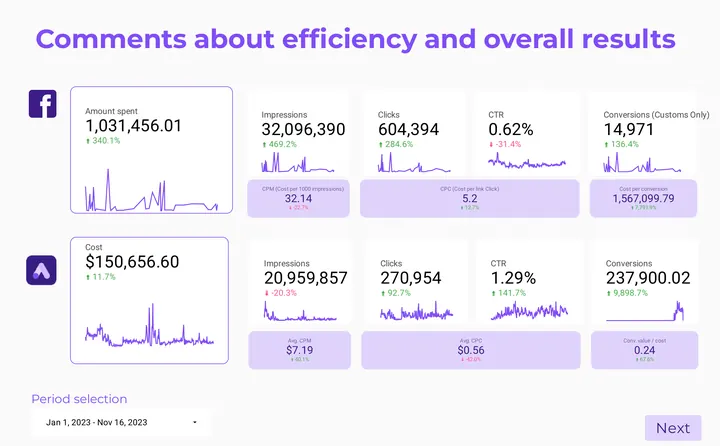 Porter dashboard
Paid media client presentation
Walk clients through Facebook Ads and Google Ads results, slide by slide.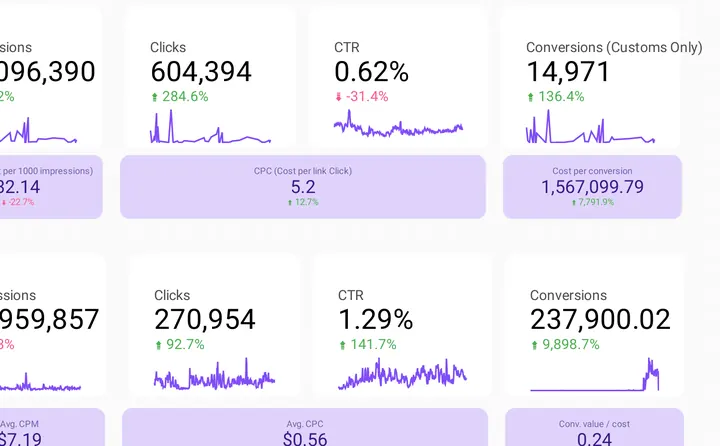 Data Studio
Paid media client presentation
Show a client Facebook Ads and Google Ads spend, clicks and conversions with your comments.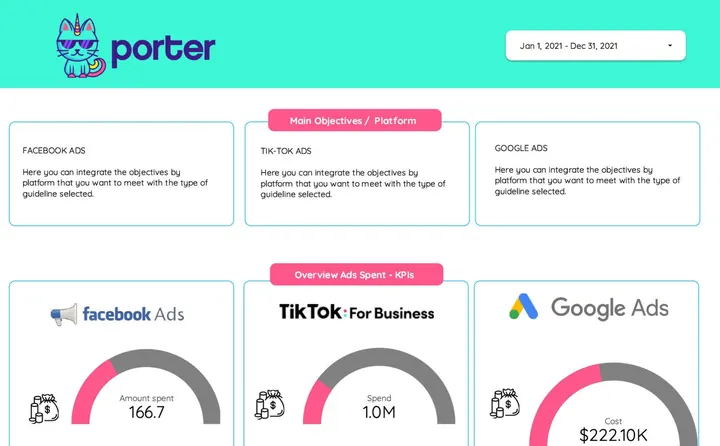 Porter dashboard
Ad frequency dashboard
Compare reach, CPM and spend for Facebook Ads, TikTok Ads and Google Ads against your goals.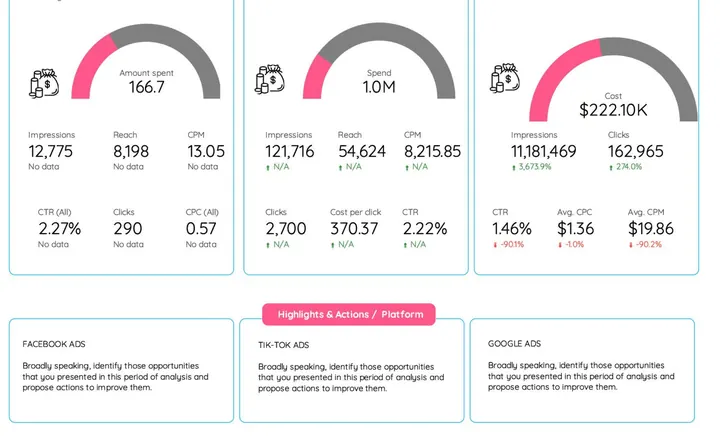 Data Studio
Ad frequency report template
Set objectives per platform and review reach, impressions and CTR for each one.Facebook Ads report example
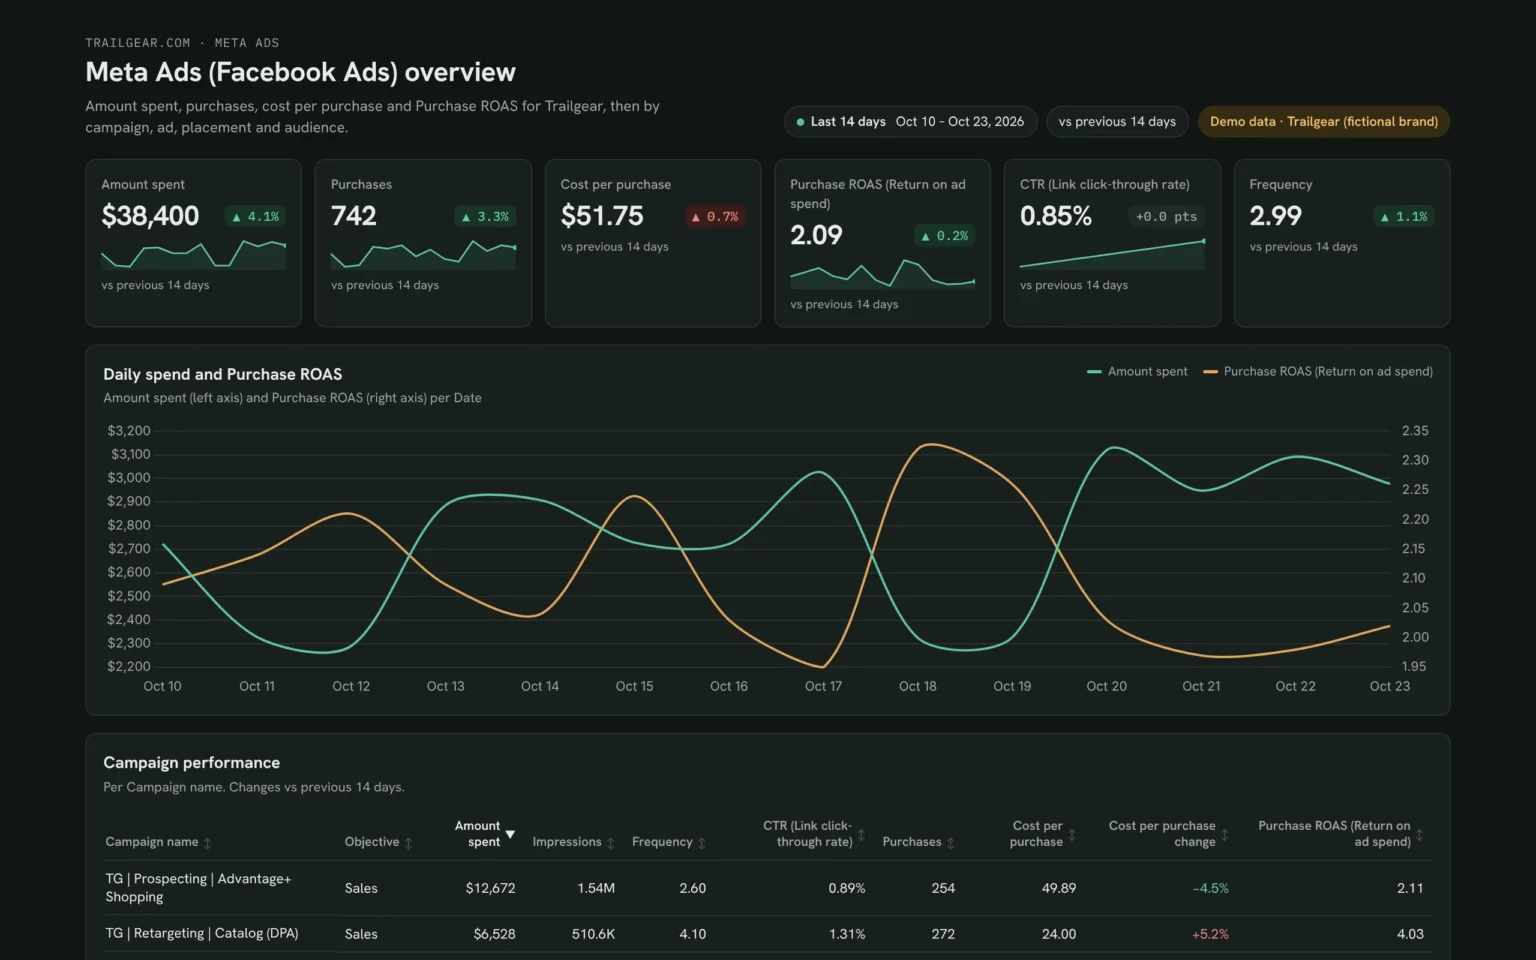
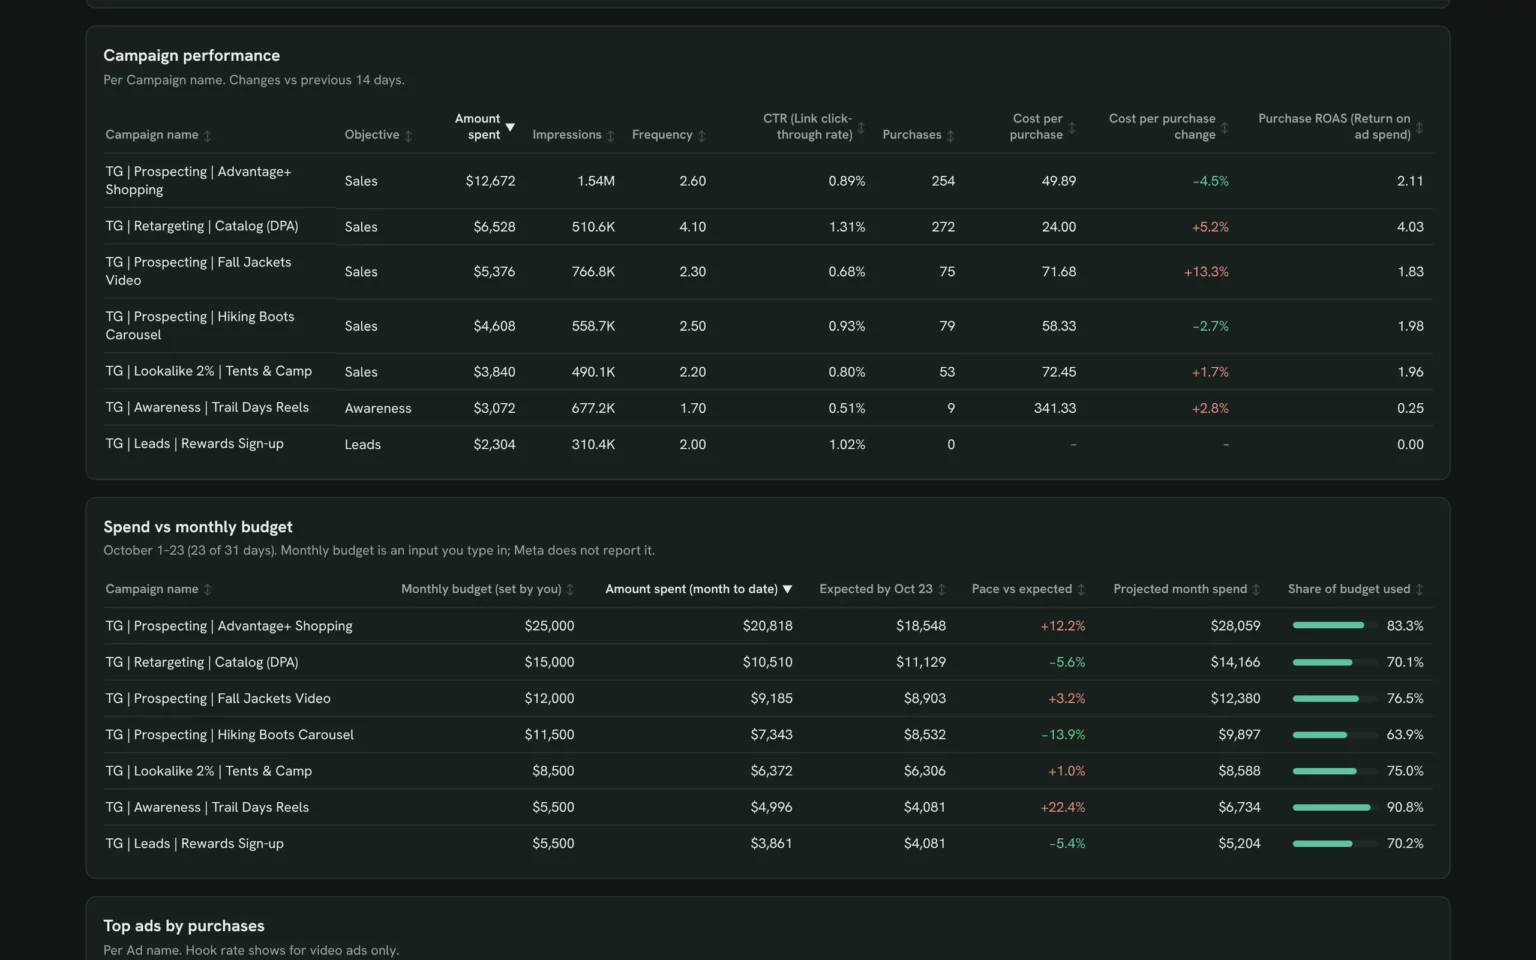
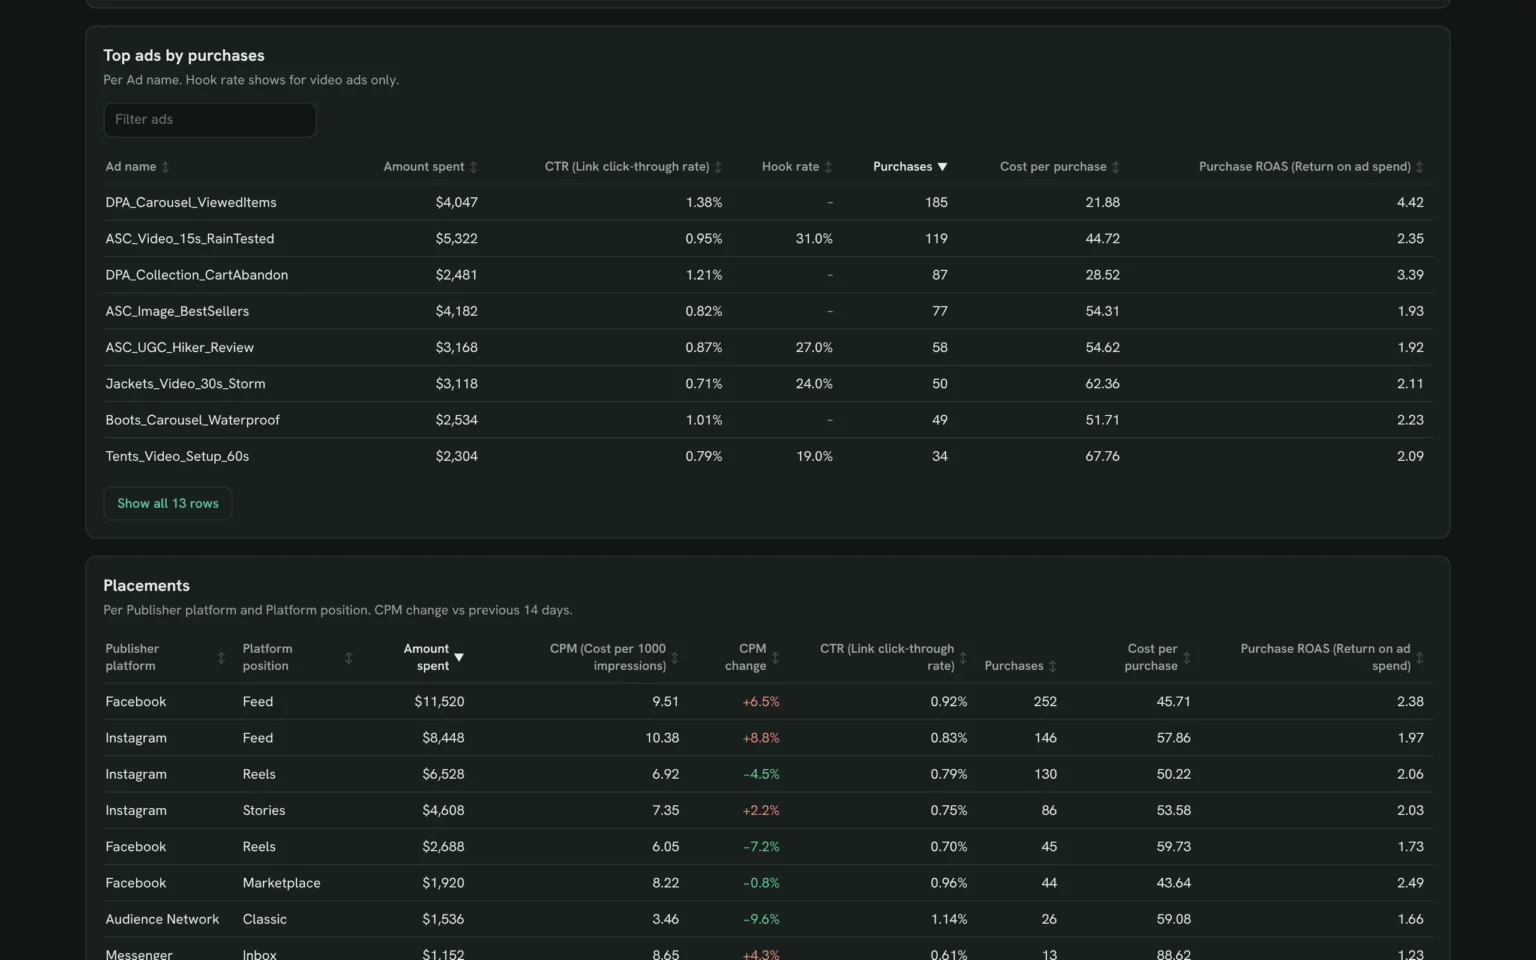
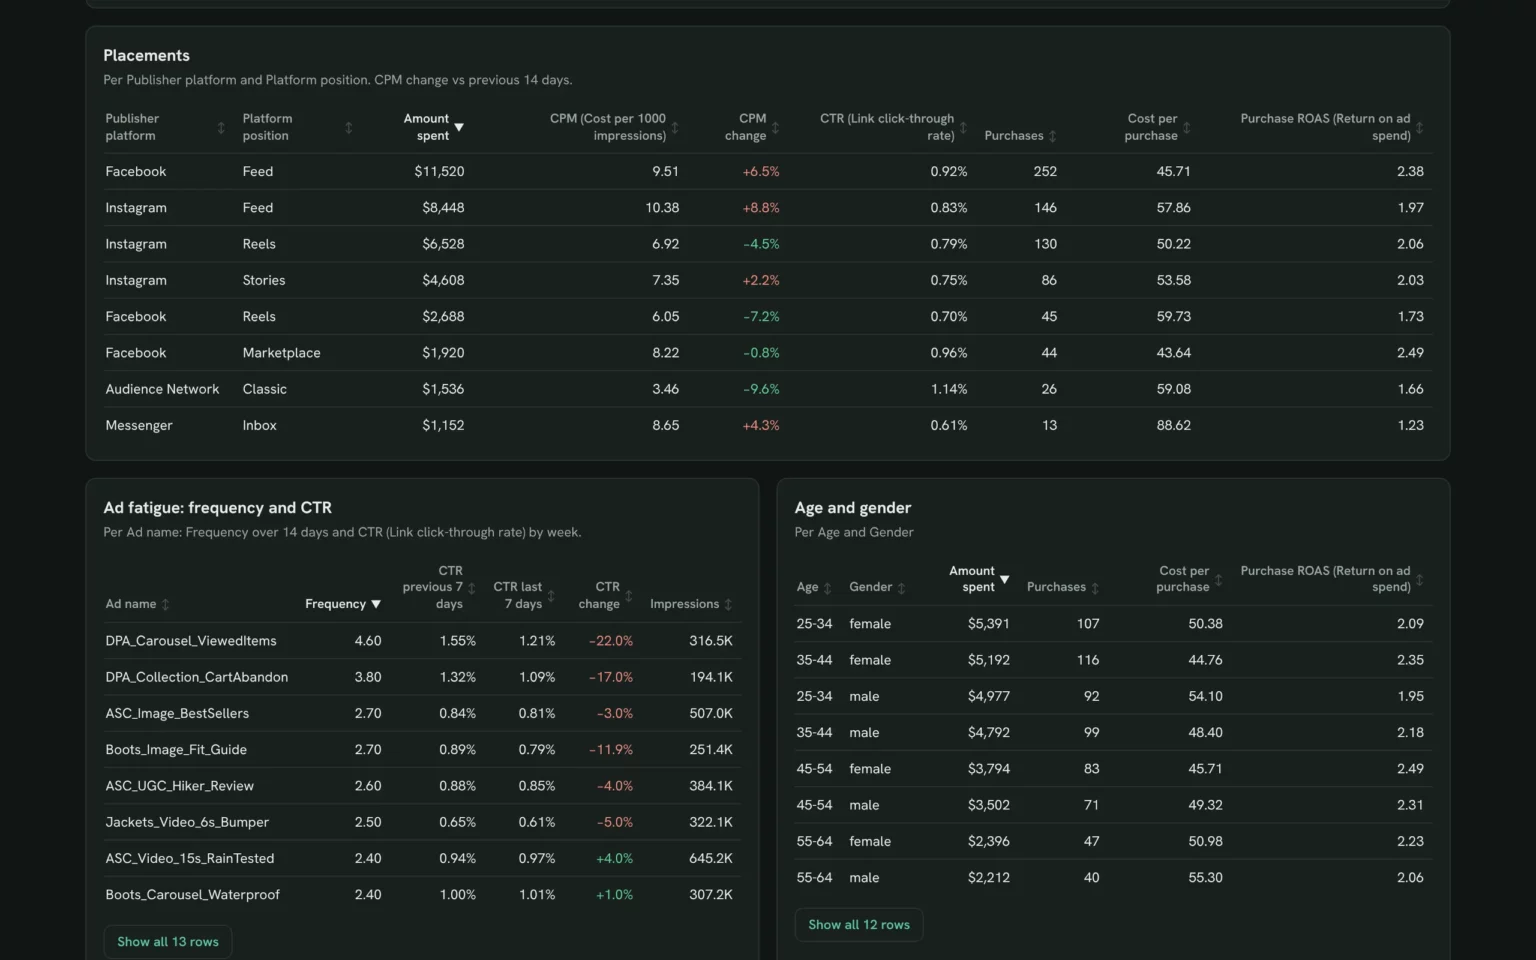
Porter’s Facebook Ads report example is a Claude report on Trailgear demo data. Click through its four views before connecting anything.
What to include in a Facebook Ads report
A Facebook Ads report built on Porter’s templates has six parts, in the order a client or manager reads them.
Spend and results
Spend, purchases or leads, ROAS and cost per result against the previous period: Meta Ads dashboard template.
Campaigns and ads
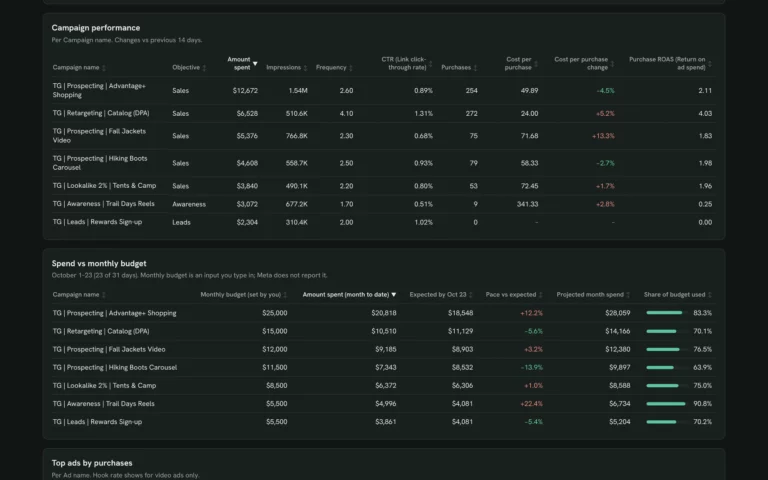
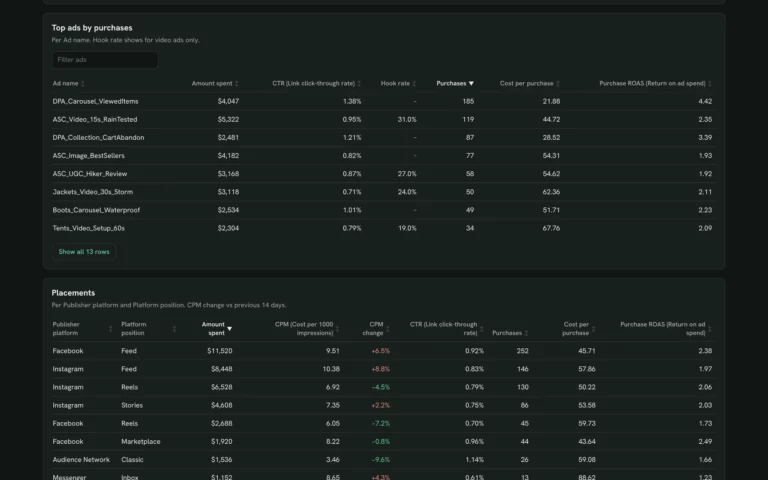
Which campaigns and ads earn their spend: Facebook Ads campaign performance template.
Audiences and placements
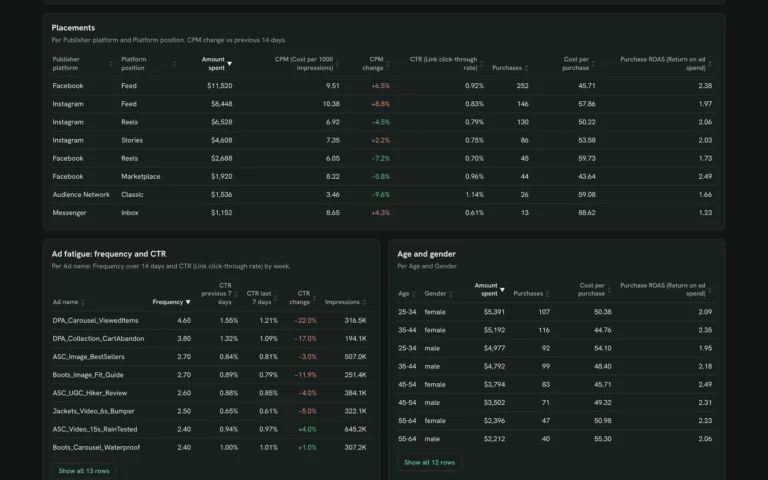
Results by age, gender, country and placement: Facebook Ads audience template.
Funnel
Where people drop between impression, click, cart and purchase: Facebook Ads funnel template.
Next steps
Two or three actions for the next period, such as the ads to pause or the audience to scale.
Match the detail to the reader: clients need spend, results and ROAS; media buyers need ads, audiences and frequency. For every ad platform together, use the PPC report templates.
How to set up a Facebook Ads report template
Every Porter Facebook Ads report template starts with one free step: connect your accounts in Porter. Then set it up in your reporting tool.
On Porter’s Free plan, Claude reads the last 15 days and Data Studio and Google Sheets up to 30 days. The 14-day trial has full access and needs no card (Porter pricing).
In Claude
Sign up free at Porter, open Data sources and connect the accounts your report needs, for example your Meta Ads account for the Meta Ads report.
In Claude, go to Customize → Connectors → Add custom connector, paste
https://mcp.portermetrics.com/mcpand name it Porter Metrics. Click Continue, sign in to Porter and allow access.Open a new chat, paste the install prompt and put your ad account in place of the one in brackets (Meta Ads to Claude tutorial). Claude reads your data through Porter’s MCP (Model Context Protocol), an open standard that lets Claude read data from other tools.
Duplicate this Claude dashboard template and keep its layout, views and styling: https://claude.ai/artifact/9zHfXBvgBfUYR9YrgCuL7L
Then rebuild it with my own data through Porter: a Meta Ads dashboard for [ad account] for the last 14 days: KPI cards for Amount spent, Purchases, Cost per purchase, Purchase ROAS, CTR (Link click-through rate) and Frequency; daily Amount spent and Purchase ROAS; Campaign name and Ad name tables with spend, CTR, Hook rate, Purchases, Cost per purchase and ROAS; month-to-date spend vs a Monthly budget column I fill in; Frequency and weekly CTR per ad; results by Platform position, Age and Gender; a funnel from Link clicks to Purchases; and the video play curve.
Claude Dashboards is in beta on Pro, Max, Team and Enterprise (Anthropic’s guide to Claude Dashboards).
As a Porter dashboard
Open a Porter dashboard card and click Download template.
Sign in to Porter and pick your accounts.
Share it with viewer or editor access, or schedule it by email.
In Data Studio
Open a Data Studio card and click Download template.
Click the three-dot menu (⋮) in the top-right corner and select Make a copy.
Choose your Porter data sources, click Copy Report and set the date range you report on, for example last month compared with the previous period.
In Google Sheets
Open a Google Sheets card and make a copy.
Install the Porter extension, authorize it and choose your accounts.
Run the prebuilt queries and set the refresh to daily or weekly.
Need Excel? In Google Sheets, choose File → Download → Microsoft Excel (.xlsx).
What makes these Facebook Ads report templates different
Ads Manager exports take time every month. Porter’s templates pull your Meta Ads data into a report that updates itself.
See a live example first
Click through the Claude Facebook Ads report example on demo data without an account.
Catch ad fatigue early
See frequency and CTR by ad so you refresh creatives before results drop.
Meta next to Google Ads
Put Facebook Ads beside Google Ads in the Facebook Ads + Google Ads template.
One report, four tools
Explore it in Claude, send it as a Porter link, or keep it in Data Studio or Google Sheets.
More report template galleries
Porter has a gallery for each channel, data source and tool.


Facebook Ads report template FAQ
Are these Facebook Ads report templates free?
Yes. All 32 Porter Facebook Ads report templates and prompts are free to download, and the Free plan never expires. Longer date ranges need the 14-day trial or a paid plan from $12.50 per account a month, billed annually (Porter pricing).
What should a Facebook Ads report include?
Spend, results and cost per result, ROAS, the campaigns and ads behind them, audiences and placements, budget pacing and next steps for the coming period.
Is there a Facebook Ads report template for Google Sheets or Excel?
Yes. Copy the Facebook Ads budget pacing Sheets template, refresh it with your account, then choose File, Download, Microsoft Excel (.xlsx).
Can I report on several accounts or clients?
Yes. Porter connects unlimited accounts, even on the free-forever plan. Connect every account you manage and switch between them with the account filter.
Can I send the report automatically?
Yes. A Porter dashboard shares by link and PDF and can be scheduled by email every week or month. In Data Studio, use Share, Schedule delivery.
Claude, Porter dashboard, Data Studio or Google Sheets: which should I use?
Use Claude to build the report and ask follow-up questions, but anyone opening a shared Claude dashboard needs their own Claude access (Anthropic’s guide to sharing artifacts). Use a Porter dashboard for client links and scheduled email, Data Studio if your reports live there, and Google Sheets for formulas or Excel.
Get your free Facebook Ads report template
Pick a template, connect your Meta Ads account for free and send your first Facebook Ads report today.
Free plan · 14-day trial · No card needed