Learn how to copy any Looker Studio template with this complete step-by-step guide.
We made a ‘how to video’ in case you prefer to see how we do it!
Now, here’s the step-by-step guide.
1. Choose a Looker Studio Template
Go to the main menu in Porter Metrics and open the Template Gallery
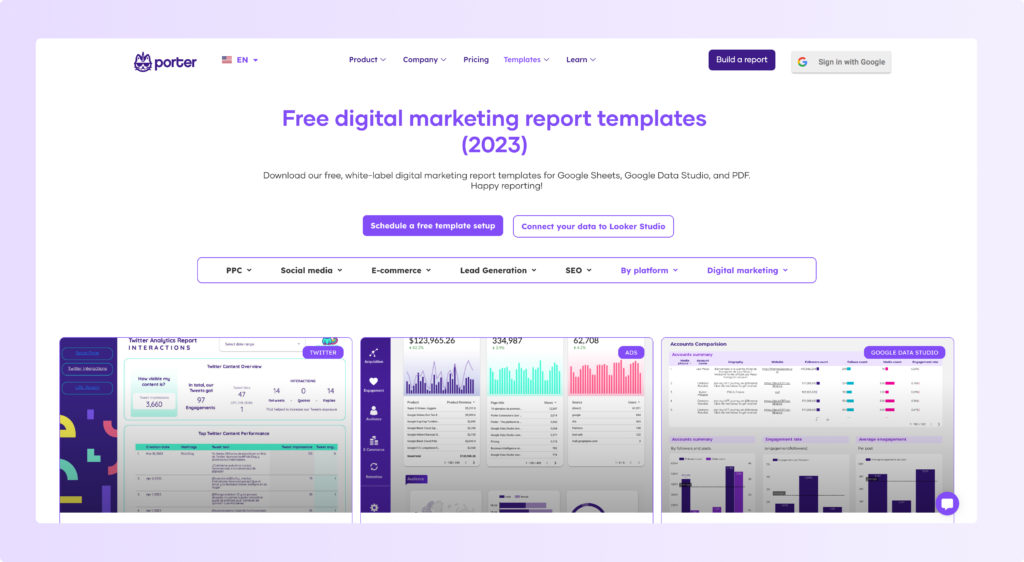
Browse through the over 80 templates made with different data source connectors such as Facebook Ads, LinkedIn Pages, Instagram Insights, and Google My Business.
Or you can browse the Looker Studio official template gallery, but it only includes connections with Google connectors.
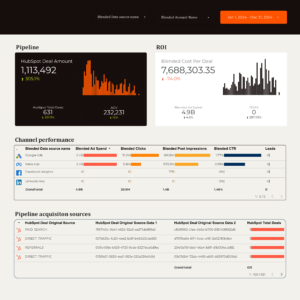
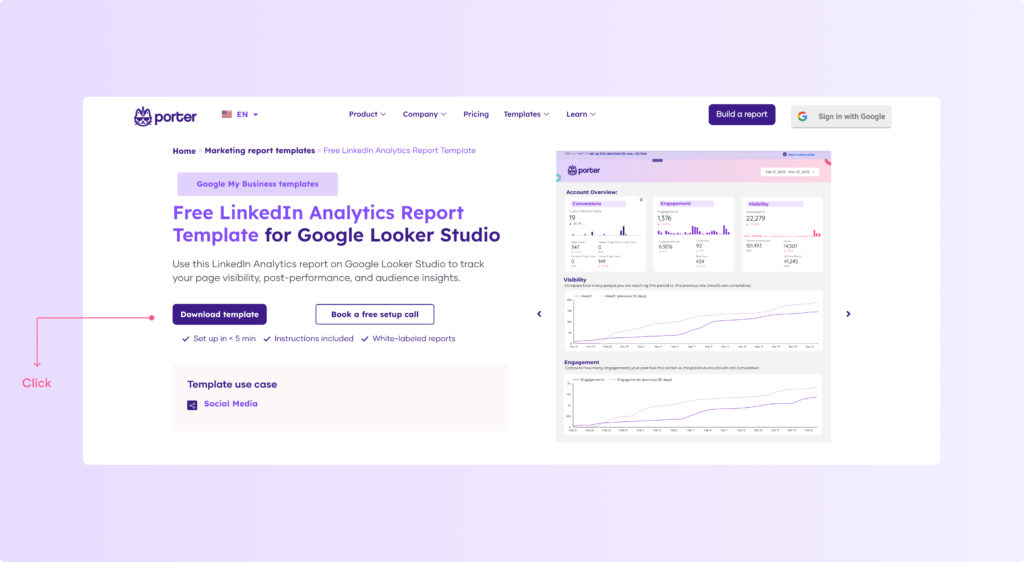
For this example, I will select the LinkedIn Pages template under the Social Media templates section.
2. How to copy a Looker Studio Template
Access the downloaded template and click “Edit and Share”
Then, a message will appear: click “Add to Report” to create your own copy version of the template as a new report.
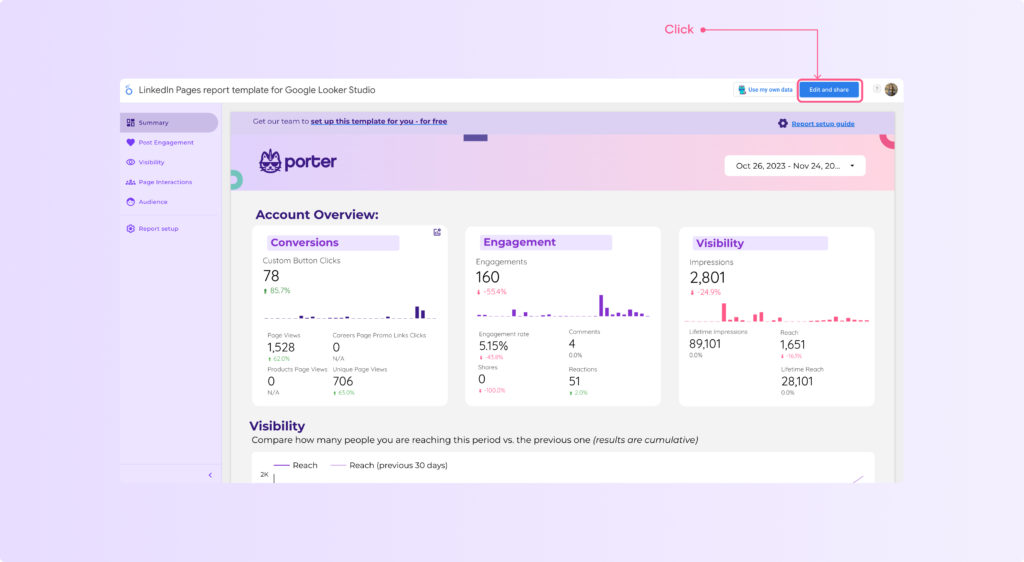
If you don’t see the “Edit and Share” option, click on the upper right corner the three dots and click on ‘Make a copy’.
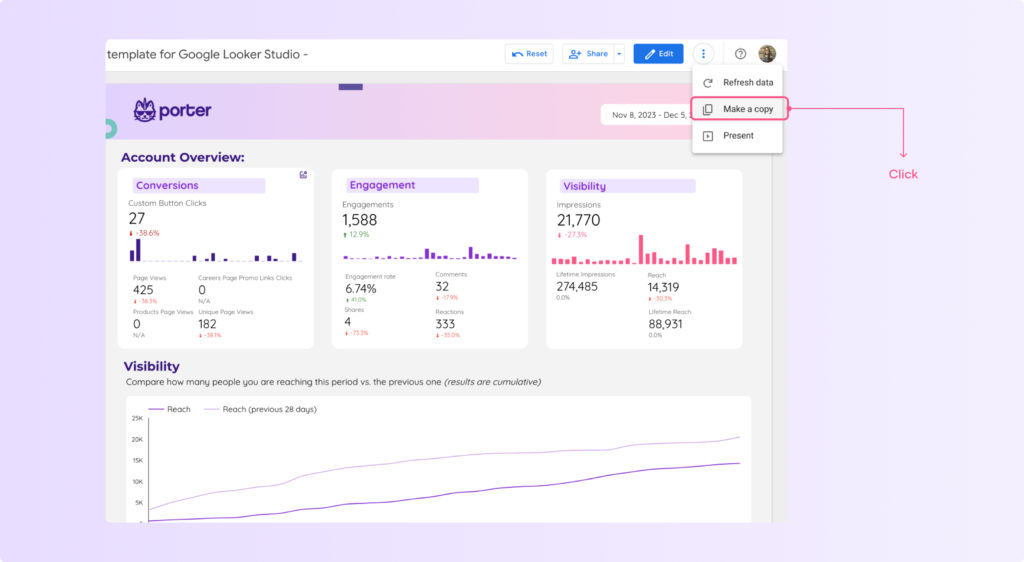
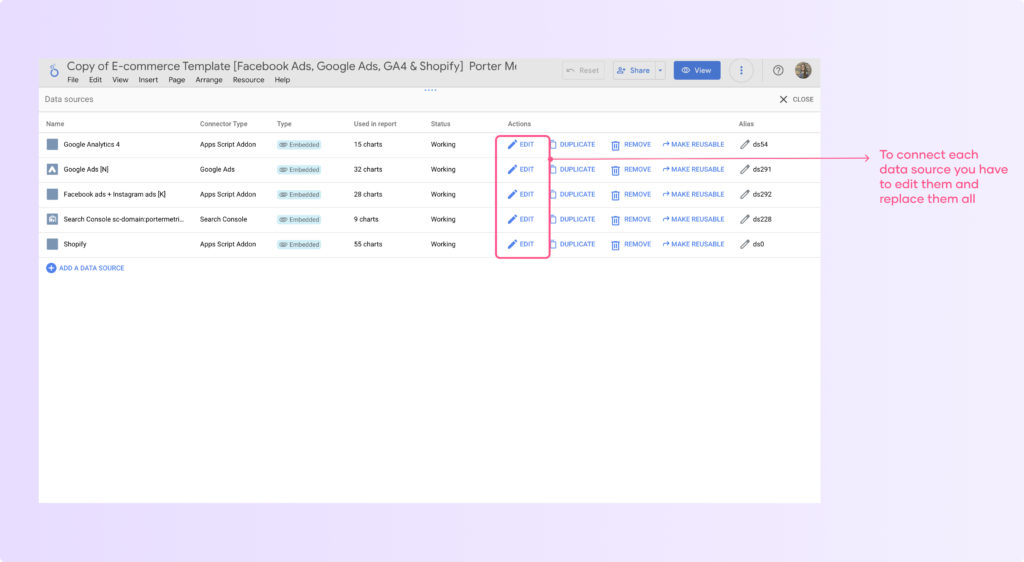
You will see a preview of all the data sources included in the report you are copying
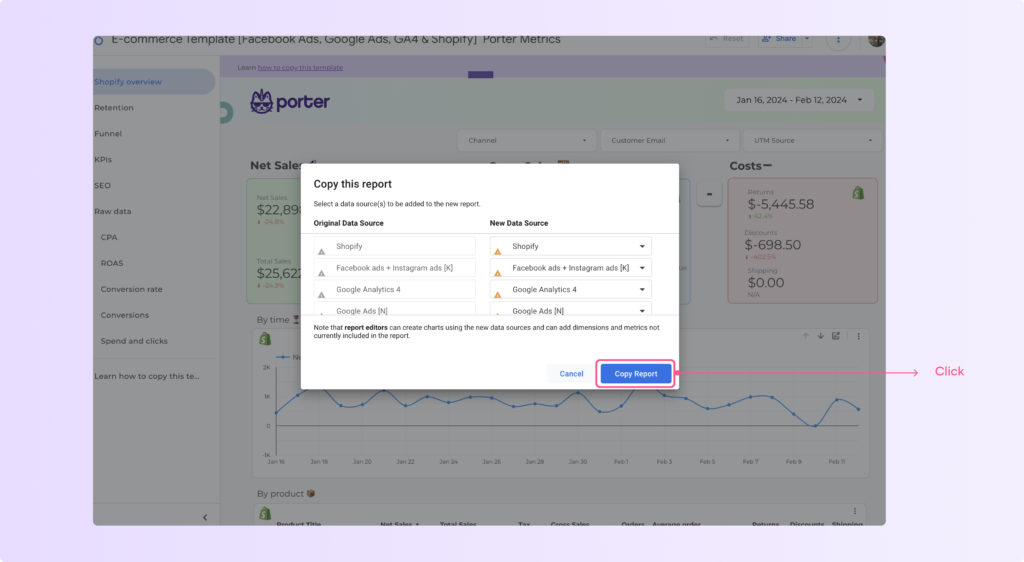
The copied report will show up broken because it is not yet connected to your data.
To fix it, go to ‘Resources’ and then click ‘Manage Data Sources‘
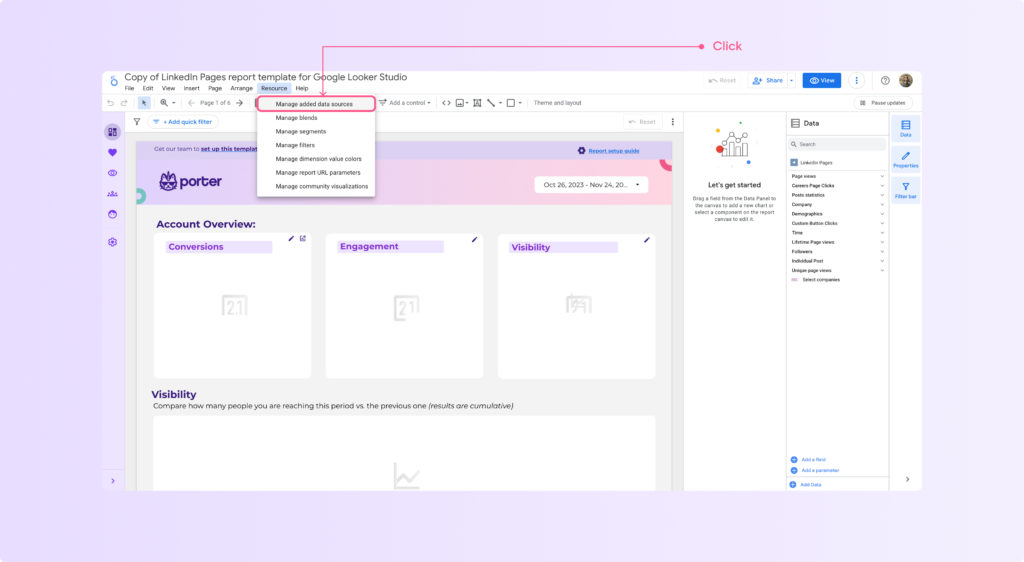
Edit the connection for your data source -like LinkedIn Pages- and authenticate/select an account to connect your data by following the next steps:
- Click edit to the name of the data source
- On the new screen, click on ‘Edit connection’
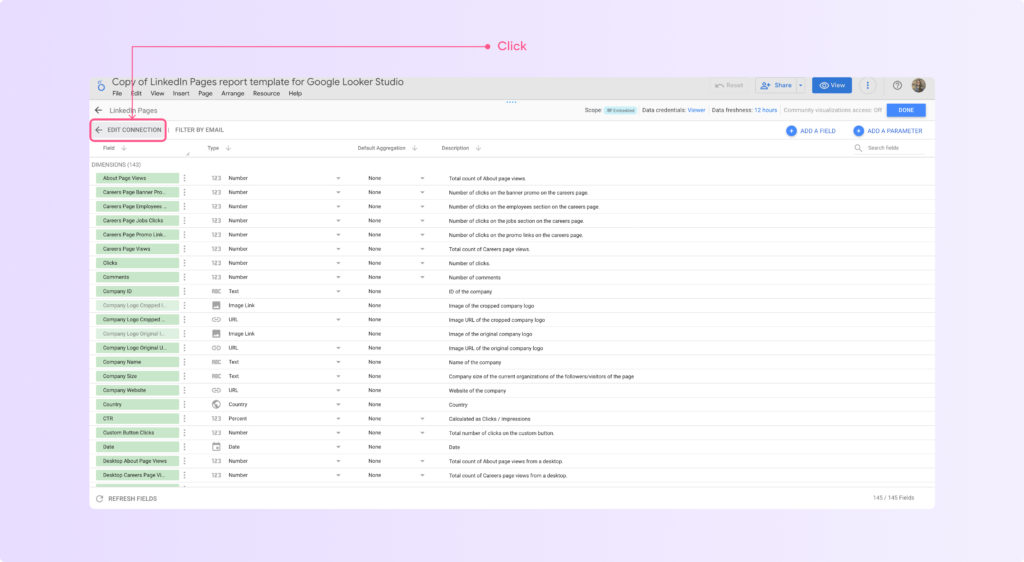
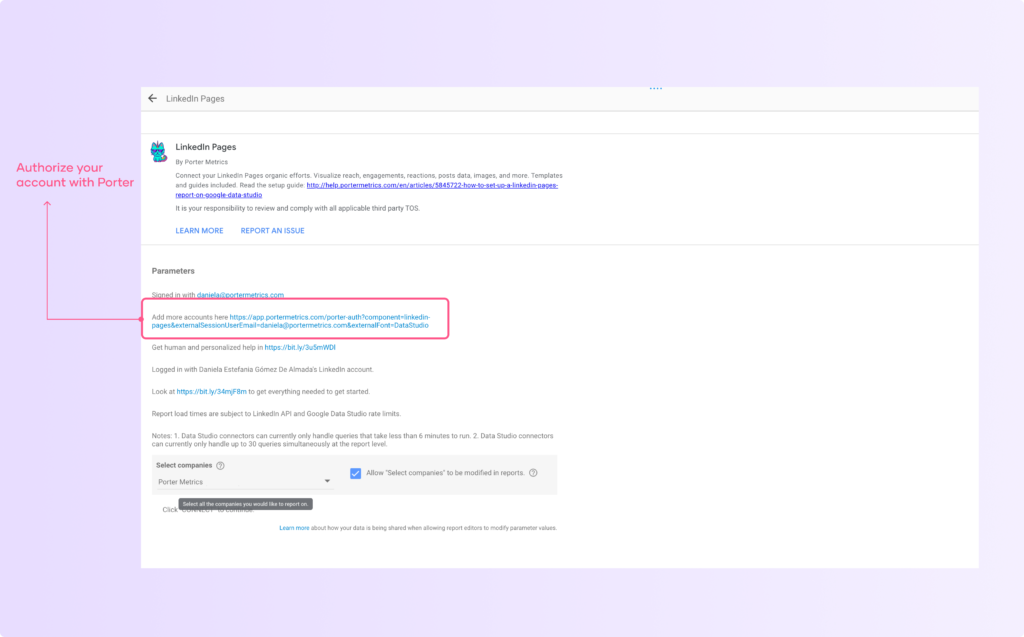
Now it’s time to authorize your account so you can see the report with your own data.
3. Adding a data source
You can add or replace a data source in order to use your new report. Let’s see how to do it according to each use case:
How to connect your data if it’s the first time you use a Looker Studio connector
You will have to authorize your account with Porter Metrics and Looker Studio, no matter what data source you are using.
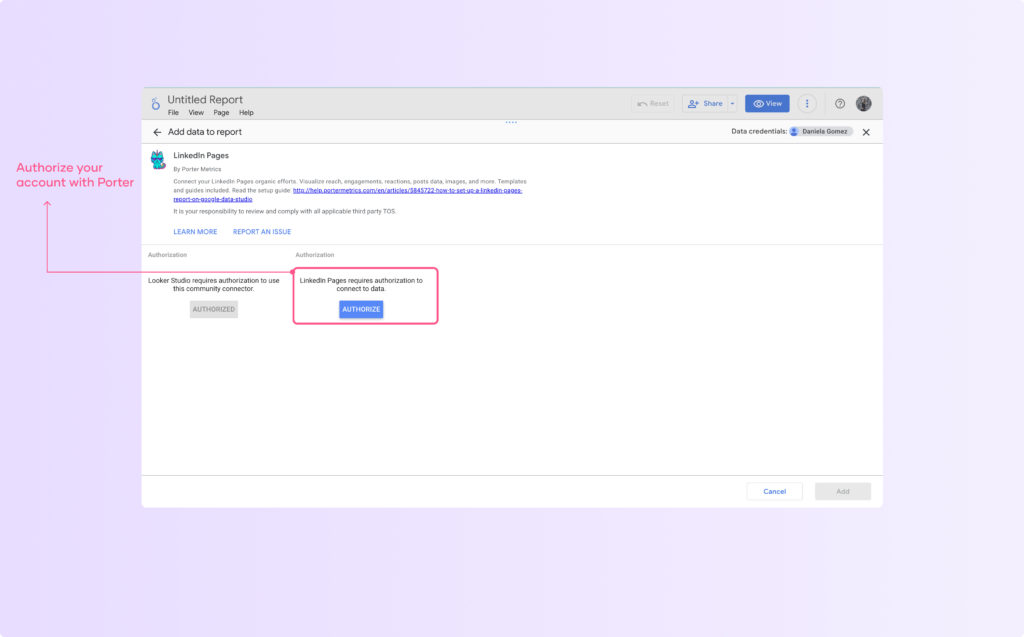
We will request you to give us permissions like managing your page and Ads.
We won’t manage them, actually, but this kind of permission is necessary to retrieve your data correctly.
A recommendation to avoid problems using the connector is to select all pages or ad accounts and all permissions. Then, you can select the ones you want to connect.
PS: if the template you are duplicating has multiple data sources, you have to authorize each one
How to connect your data if you want to add a new account
Some users need to connect different profiles from the same data source, so you will have a different step here
Click the link where it says ‘add more accounts here’, this will help you authorize for the first time but also change your accounts in case you need it
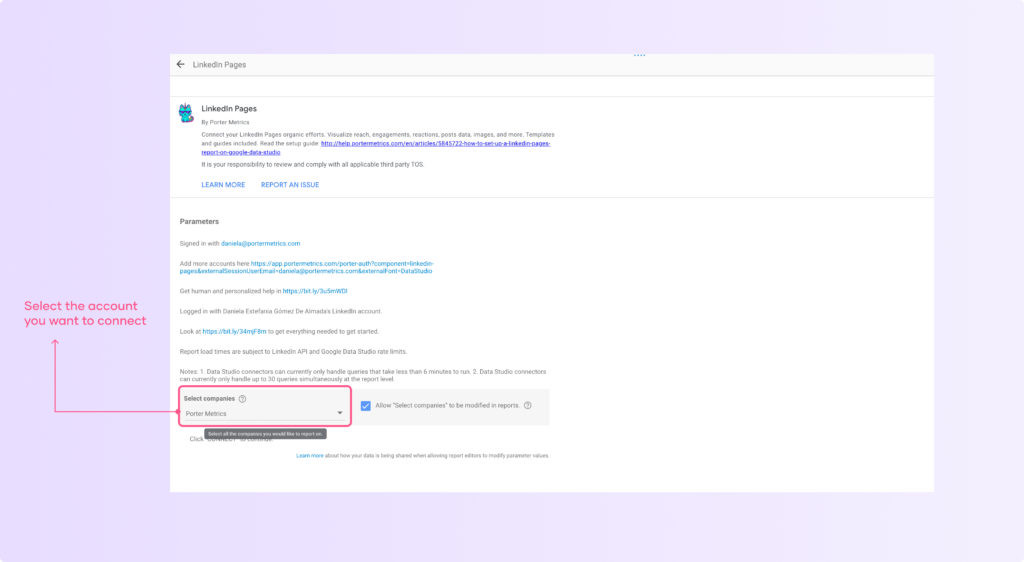
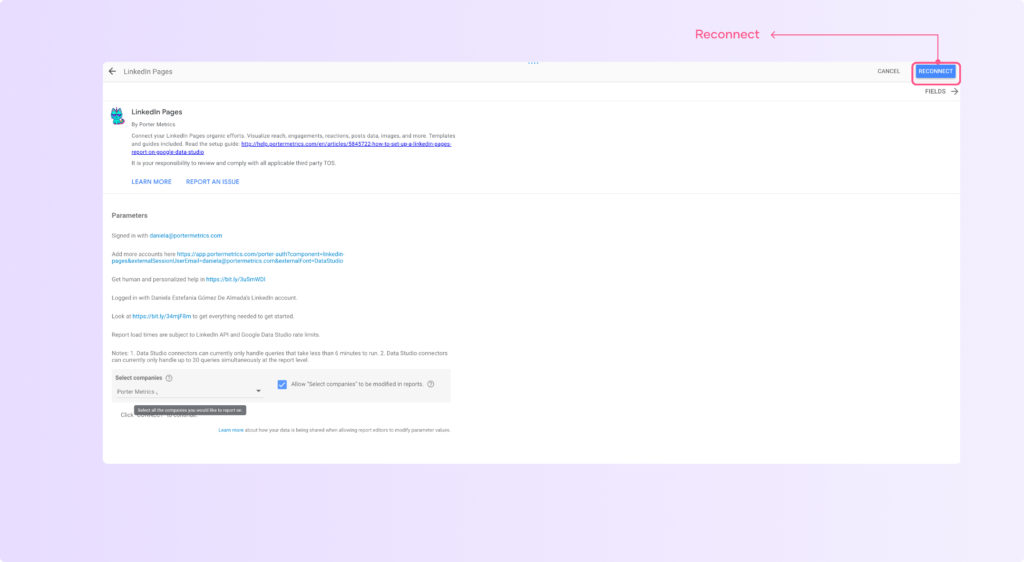
After authorizing your account, select the account(s) you want to include in the report by clicking the dropdown.
A tip for you: if you are using platforms such as Facebook and Instagram Ads, you will have additional configurations. My recommendation is to check all the boxes like this:
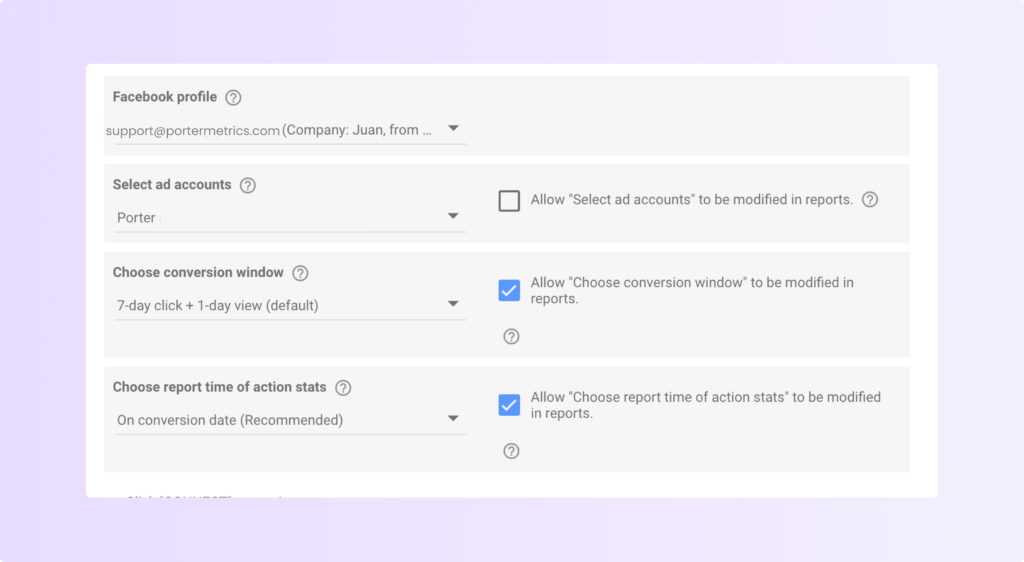
Now click on ‘Reconnect’, and this will take you to the list of fields included in the data source.
Tip when connecting paid media platforms, e-commerce platforms, and social media platforms
Looker Studio automatically automatically disables the images, which means that if you have a table on the report with an image that is not enabled, your chart will break.
To avoid that, follow these steps:
- Search for the field image at the upper right corner
- Now click on the three dots next to the field name and select ‘Show’
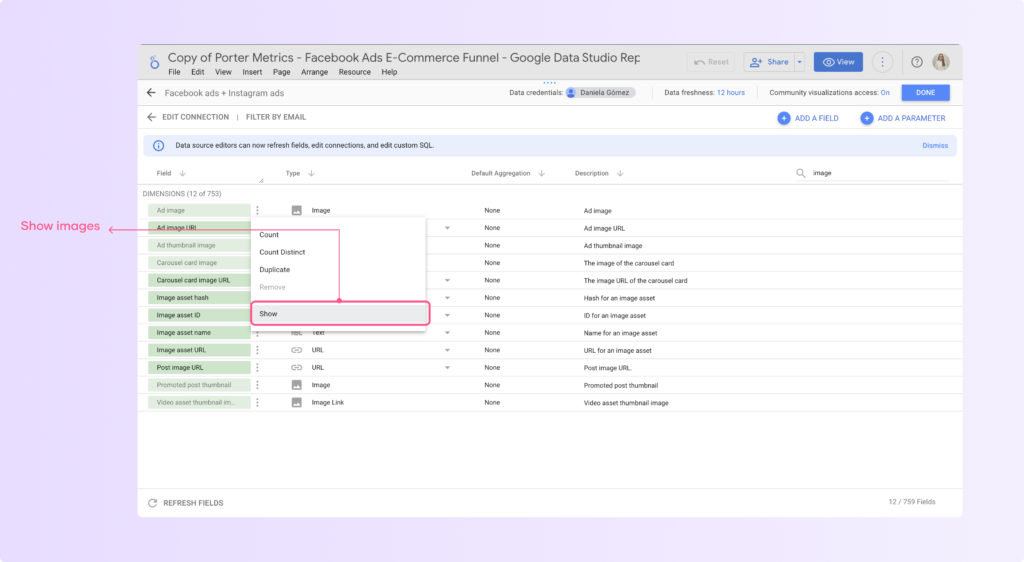
Now click on ‘Done’ in the right corner and apply changes.
You should see your new Looker Studio report and now you can edit it and add new charts and data sources.
4. Connect other data sources
Now you should connect the other data sources, if any. Some of our templates also connect to data sources like Google Ads, Analytics, Search Console, and more.
Their setup process is pretty similar. Remember that connections to Google products like Analytics, Google Ads, Search Console, and YouTube are free.
We made a short-form video teaching you how to add more than one data source to your Looker Studio report
5. Manage your blended data sources and charts
We blend data sources in some Looker Studio reports to create custom calculations such as total spend, CAC, CPA, and more.
If you connected your accounts by editing the original connections, everything should look fine, and the blends that were created on your original template should work.
But sometimes, because of different naming conventions or because you have a different custom metric, the blending can break.
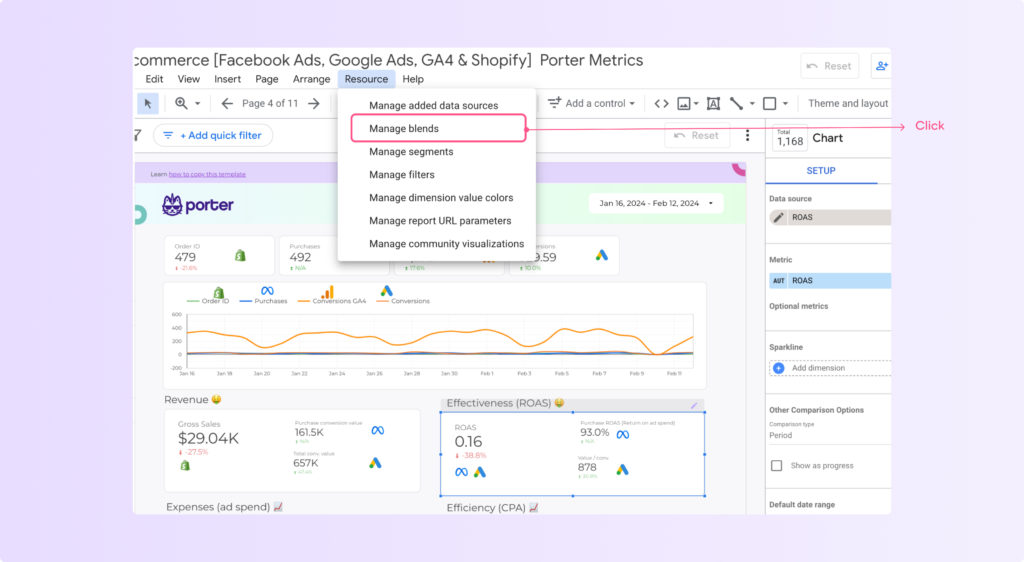
To check the data blending on your report, go to ‘Resource’ and then click ‘Manage blends’
If you have any data blending on your report you should see a list with the name of your blends, the number of charts related to your blended data sources and the possibility to edit, duplicate, and remove.
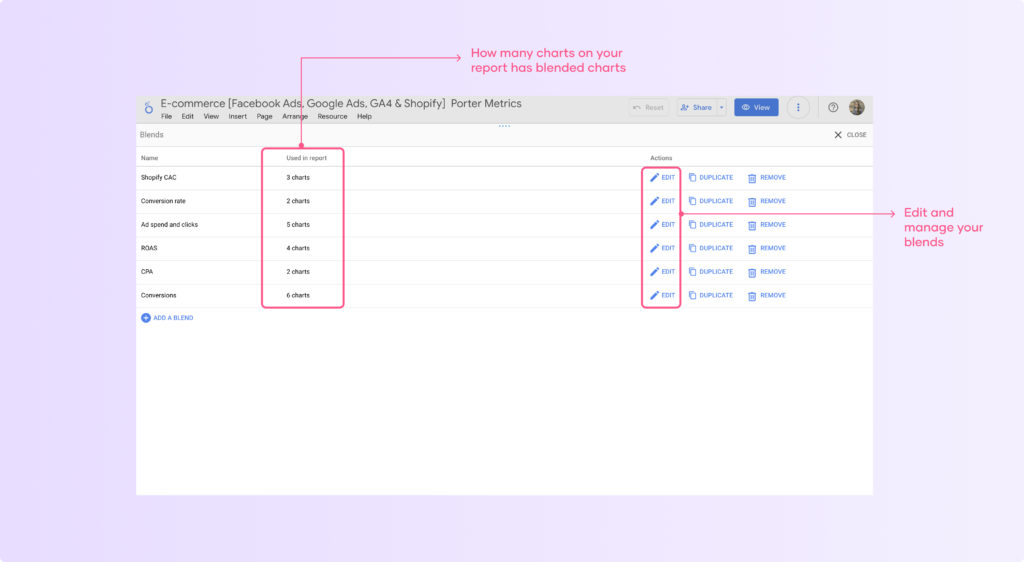
To check that your blending is working properly, click on ‘Edit’ and then you should see:
- The Join conditions configured
- The dimensions in green
- The metrics in blue
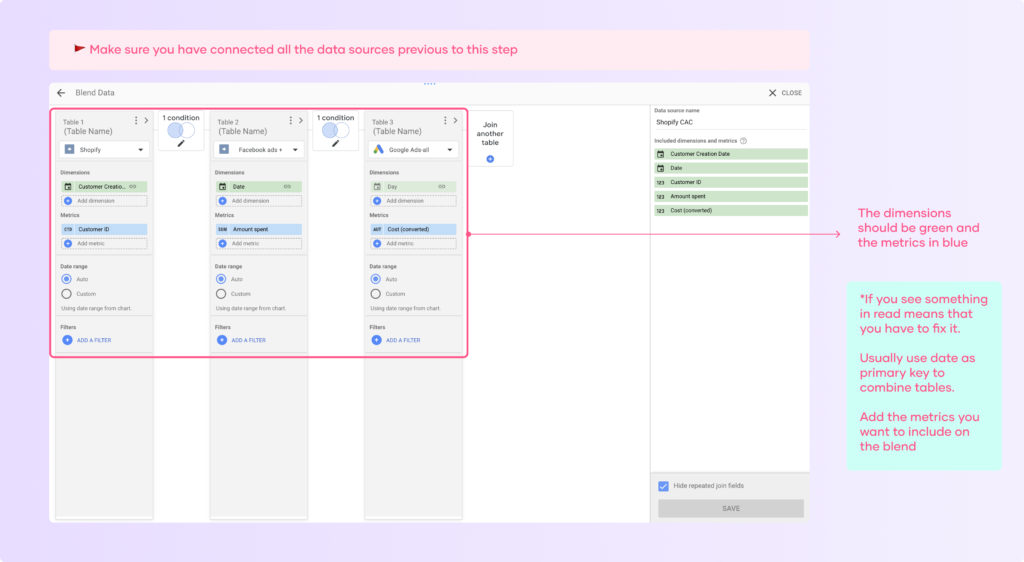
If you see something in read, it means that you have to fix it by changing the join key, dimensions, or metrics. If you want to learn more about data blending, you can watch this step-by-step data blending tutorial.
6. Final recommendations when copying a Looker Studio template
Your data should appear on your report, but sometimes, after connecting your data source, some of the copied charts may show errors or broken visualizations because they are referencing invalid metrics or dimensions.
To fix the broken charts:
- Inspect each chart that shows an error indicator. The error message will indicate it cannot find a specified metric/dimension.
- Edit the chart by selecting a new valid metric or dimension from your connected data source. For example, replace an invalid “engagement_rate” metric with the actual “engagement_rate” metric from your LinkedIn Pages data.
- Sometimes, changes do not visually show up right away after replacing an invalid metric. Refresh the entire report page by clicking the refresh icon at the top to force charts to redraw with the updated data.
Also, remember you can create your own custom template; you can learn how to do it in less than five minutes. We made a short video teaching how to steal charts from other Looker Studio reports
How to copy a Looker Studio template in four steps
To quickly copy a Looker Studio template, follow these steps:
- On the right corner of the report, click ‘Edit and Share’ or ‘Make a copy’ on the three dots
- Click on ‘Resources’ > ‘Manage data sources’ and replace the original account.
- Authorize permissions for the data source you want to connect.
- Load your new Looker Studio report.