A Paid Ads E-commerce report should include breaking down metrics by visibility (impressions, reach), engagement (click-through rate, engagement rate), and conversion (conversion rate, cost per conversion) metrics. The data should be segmented by campaign, channel (Google Ads, Facebook Ads), audience (age, gender), content (creative A, creative B), objective (traffic, sales), and date (daily, weekly). For example, a report could include the impressions and click-through rates for a specific campaign on Facebook Ads targeted towards women aged 25-34 with creative A and an objective of sales.
To analyze paid ads e-commerce data, follow these steps:
1) Choose metrics: Break down visibility metrics like impressions and reach, engagement metrics like click-through rate (CTR) and average session duration, and conversion metrics like conversion rate and return on ad spend (ROAS).
2) Add context: Compare metrics against cost metrics like cost per click (CPC) and cost per conversion (CPC), date range to identify trends and shifts in performance, goals to assess whether they are being met, industry rates to determine performance relative to benchmarks.
3) Segment data: Analyze data by campaign to understand performance of individual campaigns, channel to compare performance across various advertising platforms, audience to identify which audience segments are more responsive, content to evaluate the effectiveness of different creatives, objective to measure the success of specific ad objectives, and date to identify trends over time (e.g., holiday sales spike). For example, compare the CTR of Campaign A on Google Ads versus Facebook Ads, analyze the ROAS of the audience segment aged 18-24, and assess the conversion rate of ads with video content compared to static images.
To build a Paid Ads E-commerce dashboard, 1) connect your data and accounts from Google Ads, Facebook Ads, and your e-commerce platform. 2) Select metrics such as click-through rates, conversion rates, and return on ad spend to monitor performance. 3) Segment data by campaign, channel (Google, Facebook), audience demographics, product sold, customer content viewed, objective (brand awareness, conversions), and date. 4) Add filters or buttons for metrics, channels, and date ranges to make your report interactive. 5) Share your dashboard via PDF, scheduled emails, or links.
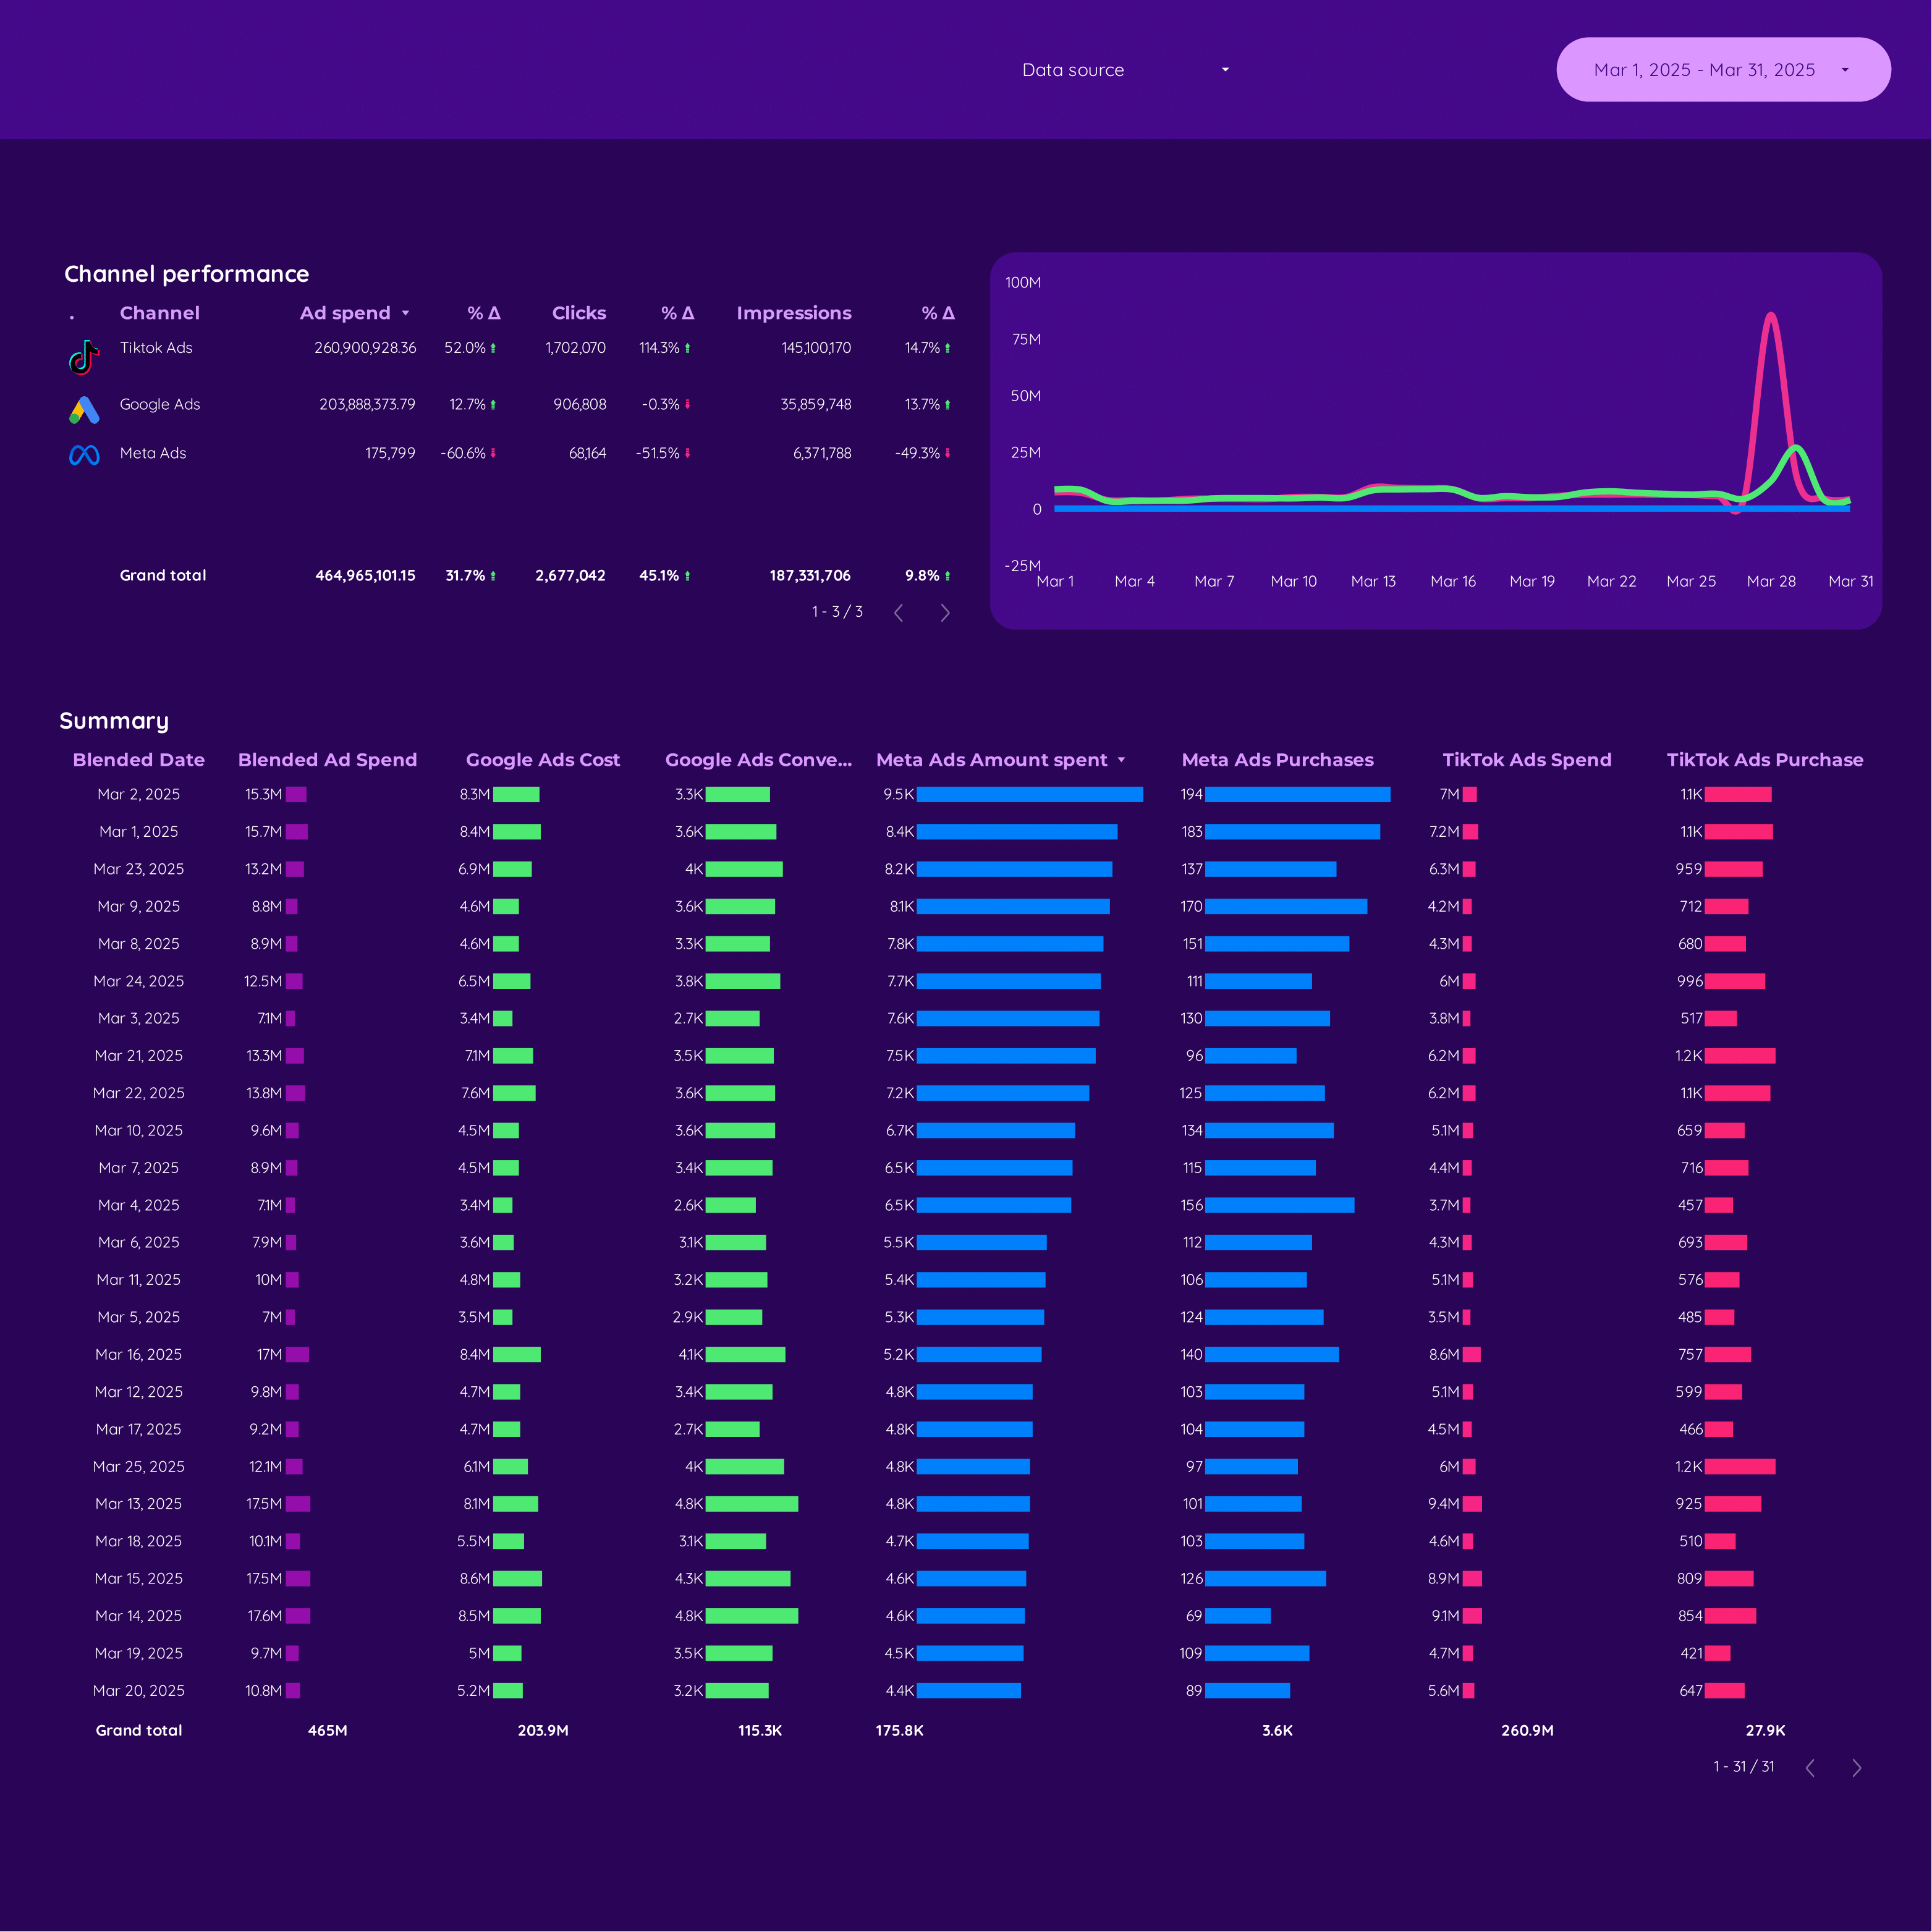
A Paid Media E-commerce dashboard is a tool used to track and analyze the performance of paid advertising campaigns across various platforms like Google Ads, Facebook Ads, and TikTok Ads. It integrates data from e-commerce platforms like Shopify and analytics tools like Google Analytics 4 to provide insights into key metrics such as impressions, clicks, ad spend, conversions, CTR (Click-Through Rate), CPC (Cost Per Click), ROAS (Return on Ad Spend), and more. This dashboard helps businesses optimize their advertising strategies by providing a comprehensive view of campaign performance and sales data.
Can I download this template in PDF?
 Impressions
 Page Likes
 Quality Score
 Video Views
 Sales
Sales Users
Users

