Real LinkedIn Ads dashboard example

Get the actual LinkedIn Ads dashboard example used by Porter to monitor your PPC performance.

Creator

Porter

This template is built by the same marketers behind all our tutorials, support, and our template gallery.

+40,000 marketers have downloaded our dashboards

Template setup

Copy-paste the same dashboards that other teams and agencies use to monitor their PPC performance

LinkedIn Ads dashboard example overview

With this LinkedIn Ads dashboard example, you can easily monitor specific metrics for performance monitoring. For instance, you can track metrics such as impressions, click-through rates, and conversion rates to analyze the effectiveness of your ads. Additionally, you can segment or break down the data by factors like demographics, industries, or job titles to understand which audience groups are responding best to your ads.

You can also share the insights from this dashboard with your teams or clients in various formats. Share the dashboard as a PDF document to provide a visual representation of the data. Alternatively, share it as a link, allowing others to explore the dashboard interactively. Additionally, you can send the dashboard via email, making it easy for others to review and discuss the data.

By using this dashboard, you can answer important questions related to your LinkedIn Ads campaigns. For example, you can determine which ad creative performs best by comparing click-through rates. You can also identify the most successful industries or job titles that convert into leads or sales. Furthermore, you can analyze the impact of different targeting strategies on your campaign performance, answering questions about optimal audience segmentation.

Suggested data sources

Use cases

Metrics and dimensions included

Customize the template’s metrics and dimensions as you like. See all available fields.

Metrics

Conversion metrics

– Click-through rate (CTR)
– Conversion rate
– Cost per conversion

Engagement metrics

– Click-through rate (CTR)
– Social actions (likes, comments, shares)
– Conversion rate

Visibility metrics

– Impressions
– Click-through rate (CTR)
– Social engagement

Dimensions

Campaign

– Campaign objective
– Ad format
– Audience targeting

Audience

– Location
– Gender
– Age

Time

By hour, day, week, month, quarter, or year

Features

100% custom charts

White-label

Custom metrics​

All-time historical data

Schedule email alerts​

Filters

Interactive

Goals​

Data blending

FAQs

A LinkedIn Ads report should include: Visibility metrics like impressions, reach, and click-through rate. Engagement metrics such as likes, comments, and shares. Conversion metrics like leads generated, conversion rate, and cost per conversion. Data should be segmented by campaign, channel, audience, content, objective, and date to get insights. For example, analyze which campaign drove the highest conversion rate, or compare the performance of different audiences in terms of engagement metrics.
To analyze LinkedIn Ads data, include the following in the report: 
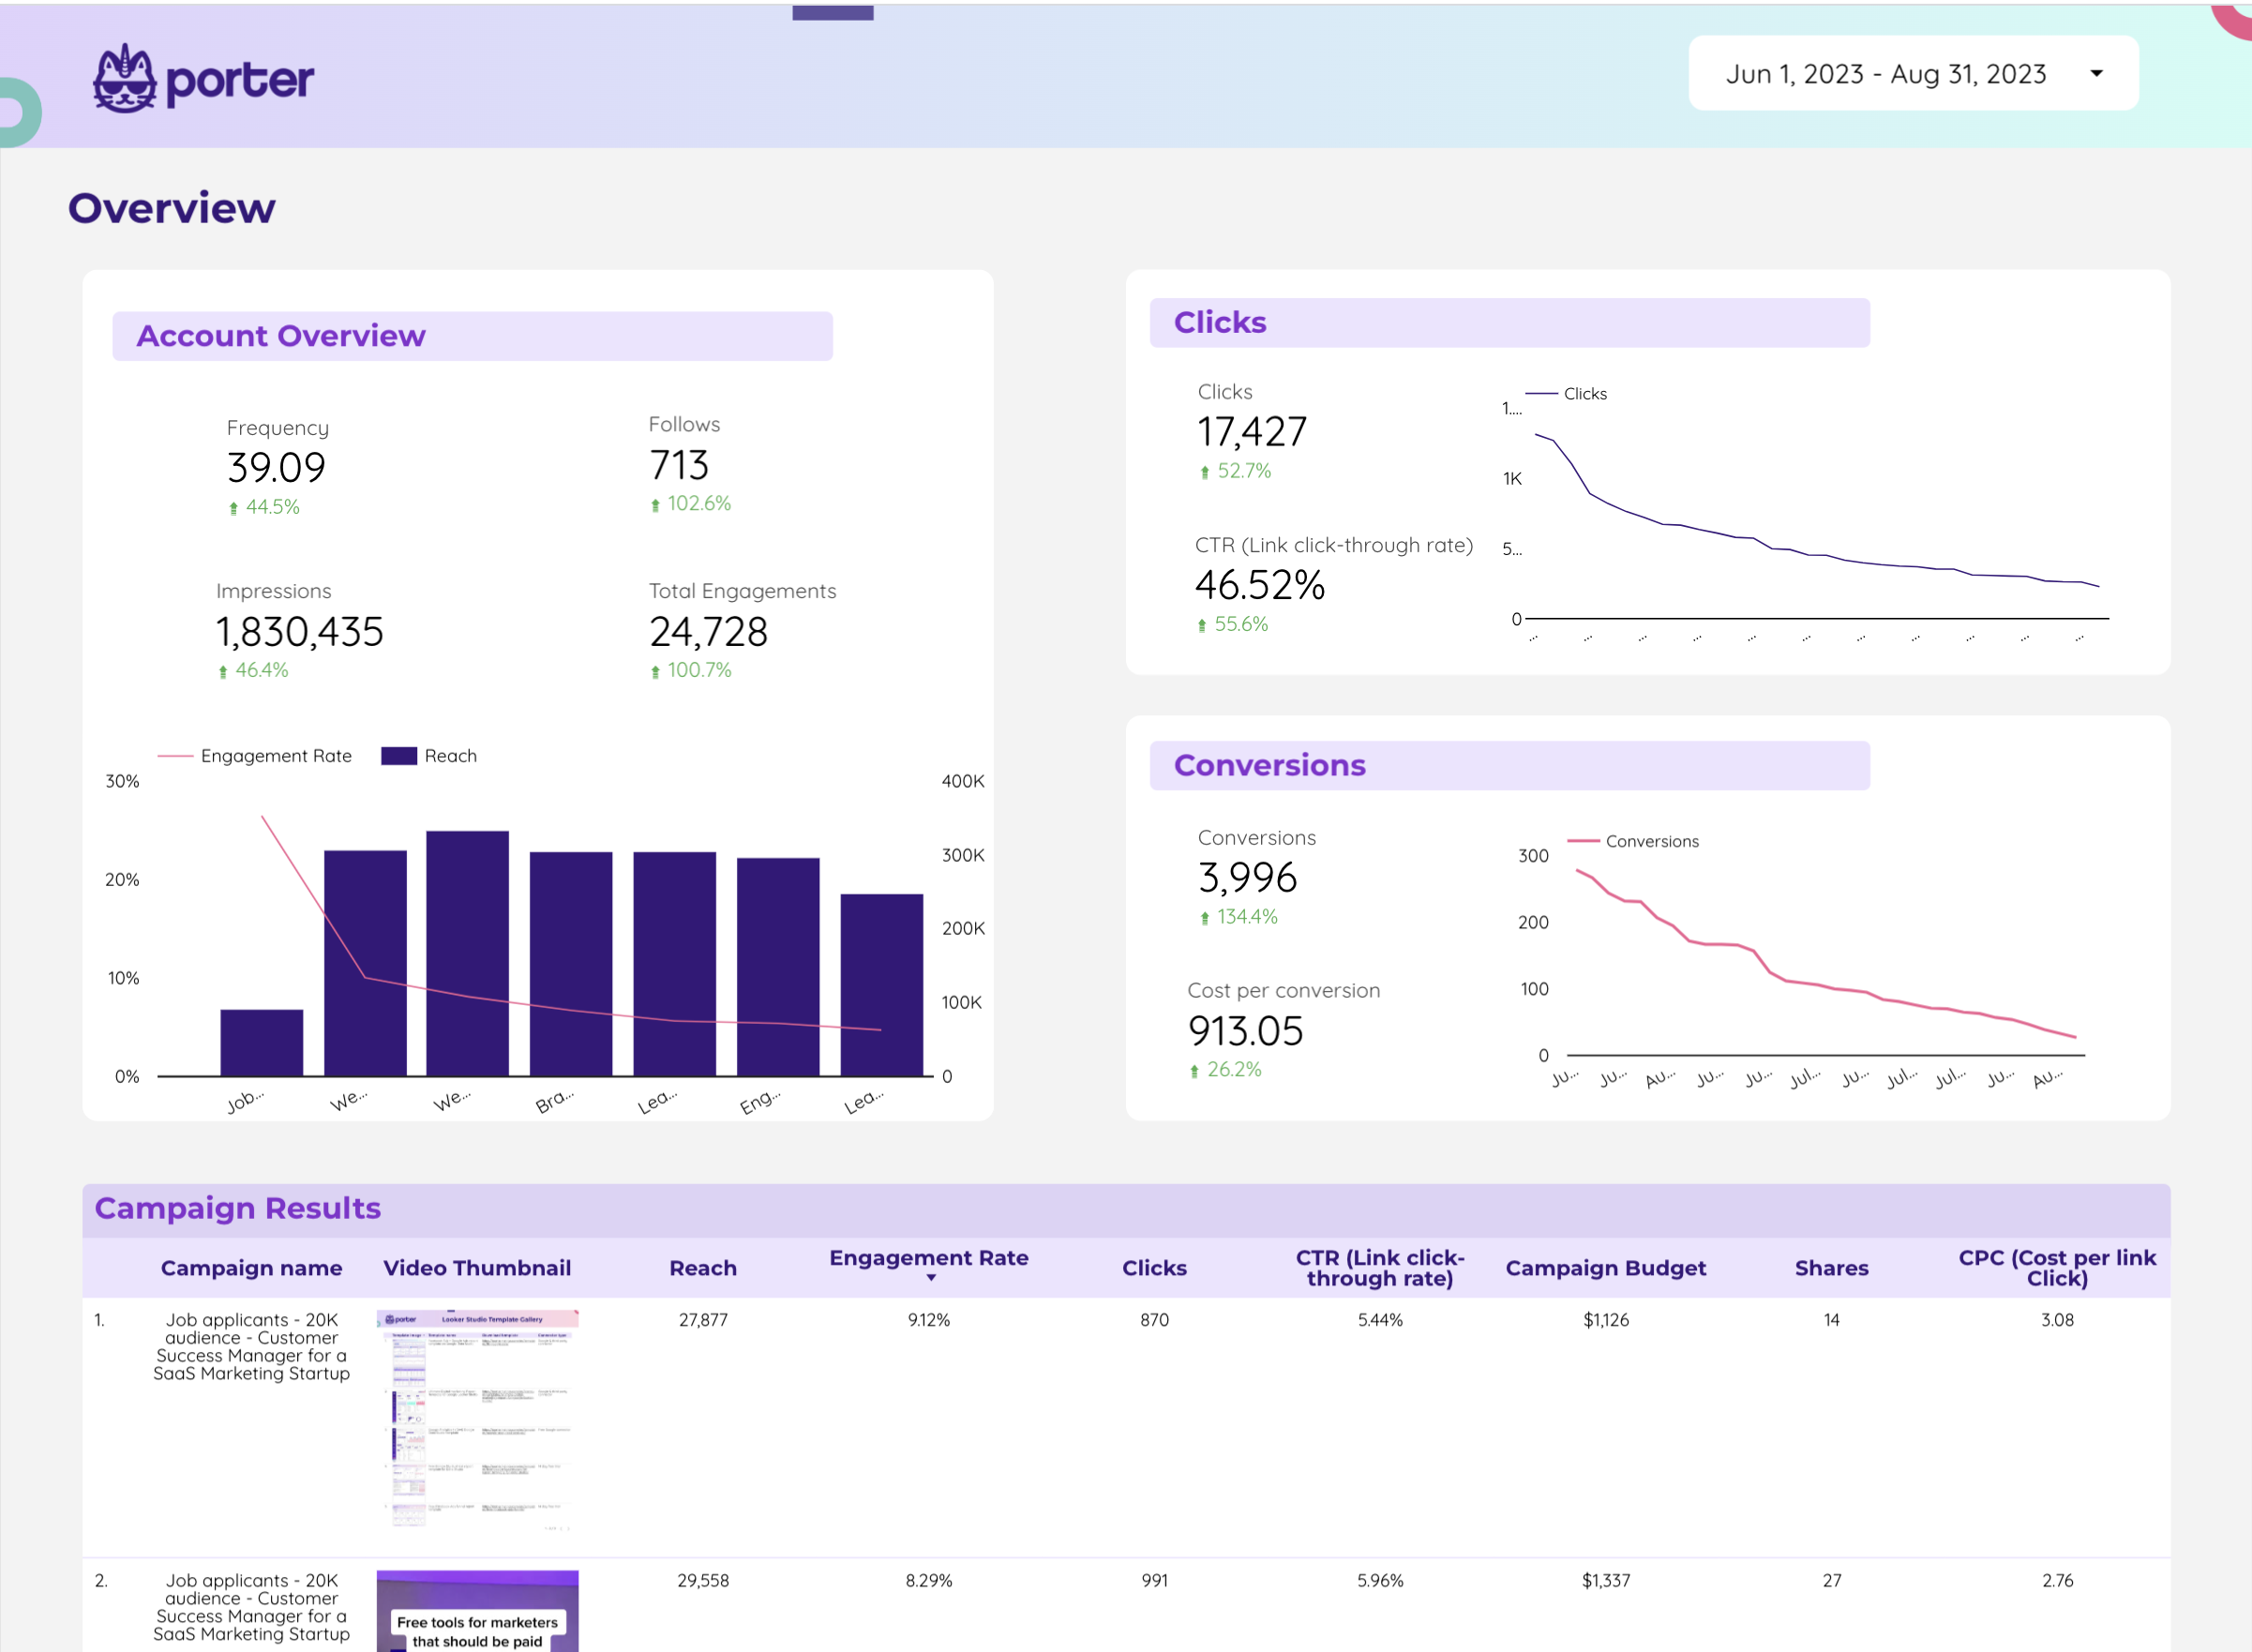
1) Metrics: Break down by visibility (impressions, reach), engagement (clicks, CTR), and conversion metrics (conversions, cost per conversion). 2) Context: Compare against the cost (CPM, CPC), date range (weekly, monthly), goals (lead generation, brand awareness), rates (CTR, conversion rate), and benchmarks (industry or previous campaign performance). 3) Data Segmentation: Segment the data by campaign (Campaign A vs. Campaign B), channel (Sponsored Content vs. Text Ads), audience (gender, age group), content (ad copy, image), objective (website visits vs. lead form submissions), and dates (compare performance over time). For example, compare the CTR of Campaign A’s Sponsored Content to Campaign B’s Text Ads to identify the more effective ad format.
To build a LinkedIn Ads dashboard, 1) connect your LinkedIn Ads account and any other relevant data sources. 2) Choose metrics such as click-through rate, impressions, and conversions to monitor performance. 3) Segment your data by campaign, channel, audience, product, customer content, objective, and date for a detailed analysis. 4) Add filters or buttons for interactivity, such as filtering by date range or campaign type. 5) Share your dashboard via PDF, scheduled emails, or links for easy access and review.

A LinkedIn Ads dashboard is a visual tool that displays key performance indicators (KPIs) related to LinkedIn advertising campaigns. It is significant for businesses as it helps them track the effectiveness of their LinkedIn ads, make data-driven decisions, and optimize their marketing strategies. Tools like Looker Studio are commonly used to create such dashboards, which typically include elements like click-through rates, impressions, conversions, and cost per action. Real-time data monitoring is crucial as it allows businesses to respond quickly to changes and trends. For learning how to create a marketing dashboard using Looker Studio, visit our YouTube channel: https://www.youtube.com/@porter.metrics.

Yes, Looker Studio allows you to download your report as a PDF. To do it, follow these steps:

Before downloading your report choose the date range you want to visualize on your report.
Click on the “File” menu at the top left corner of the screen.

Select “Download as” from the drop-down menu and choose “PDF.”

You can choose which pages you want to download, and also you can add a password to protect the report and add a link back to the online report.

Click on “Download” to save the report on your device.