An Instagram Insights report should include a breakdown of metrics by visibility (e.g., reach, impressions), engagement (e.g., likes, comments), and conversion metrics (e.g., website clicks, purchases). The data should be segmented by campaign, channel (e.g., organic, paid), audience (e.g., age, location), content (e.g., photos, videos), objective (e.g., brand awareness, lead generation), and date. For example, it should provide insights on the reach of a specific paid campaign targeting young adults in a particular location, the engagement received on a video post, and the conversion rate achieved through a link in the bio.
To analyze Instagram Insights data, first choose metrics from visibility, engagement, and conversion categories. For visibility, track impressions and reach. For engagement, consider likes, comments, and shares. For conversion, focus on click-through rates and conversions. Next, add context by comparing metrics with costs, date range, goals, and benchmarks. For example, compare engagement rates with previous campaigns or industry benchmarks. Then, segment the data by campaign, channel, audience, content, objective, and date. For instance, compare engagement rates by different content types or audience demographics. Remember to be concise and only mention the elements, not the benefits.
To build an Instagram Insights dashboard, 1) connect your Instagram business account to the dashboard. 2) Select metrics such as follower growth, post engagement, or website clicks to monitor performance. 3) Segment data by campaign, channel, audience, product, customer content, objective, or date for a detailed analysis. 4) Add filters or buttons like ‘time period’ or ‘post type’ to make your report interactive. 5) Share your insights via PDF, scheduled emails, or links for easy access and review.
An Instagram Insights dashboard is a tool that visually displays key metrics and data related to a business’s Instagram account to help monitor performance and inform decision-making. It is significant for businesses as it provides insights into follower demographics, post engagement, and the effectiveness of marketing strategies. Tools like Looker Studio are commonly used to create these dashboards, which typically include elements like follower growth, engagement rates, top posts, and audience demographics. Real-time data monitoring is crucial as it allows businesses to respond quickly to changes and optimize strategies. For a detailed guide on creating a marketing dashboard using Looker Studio, visit our YouTube channel: https://www.youtube.com/@porter.metrics.
Can I download this template in PDF?
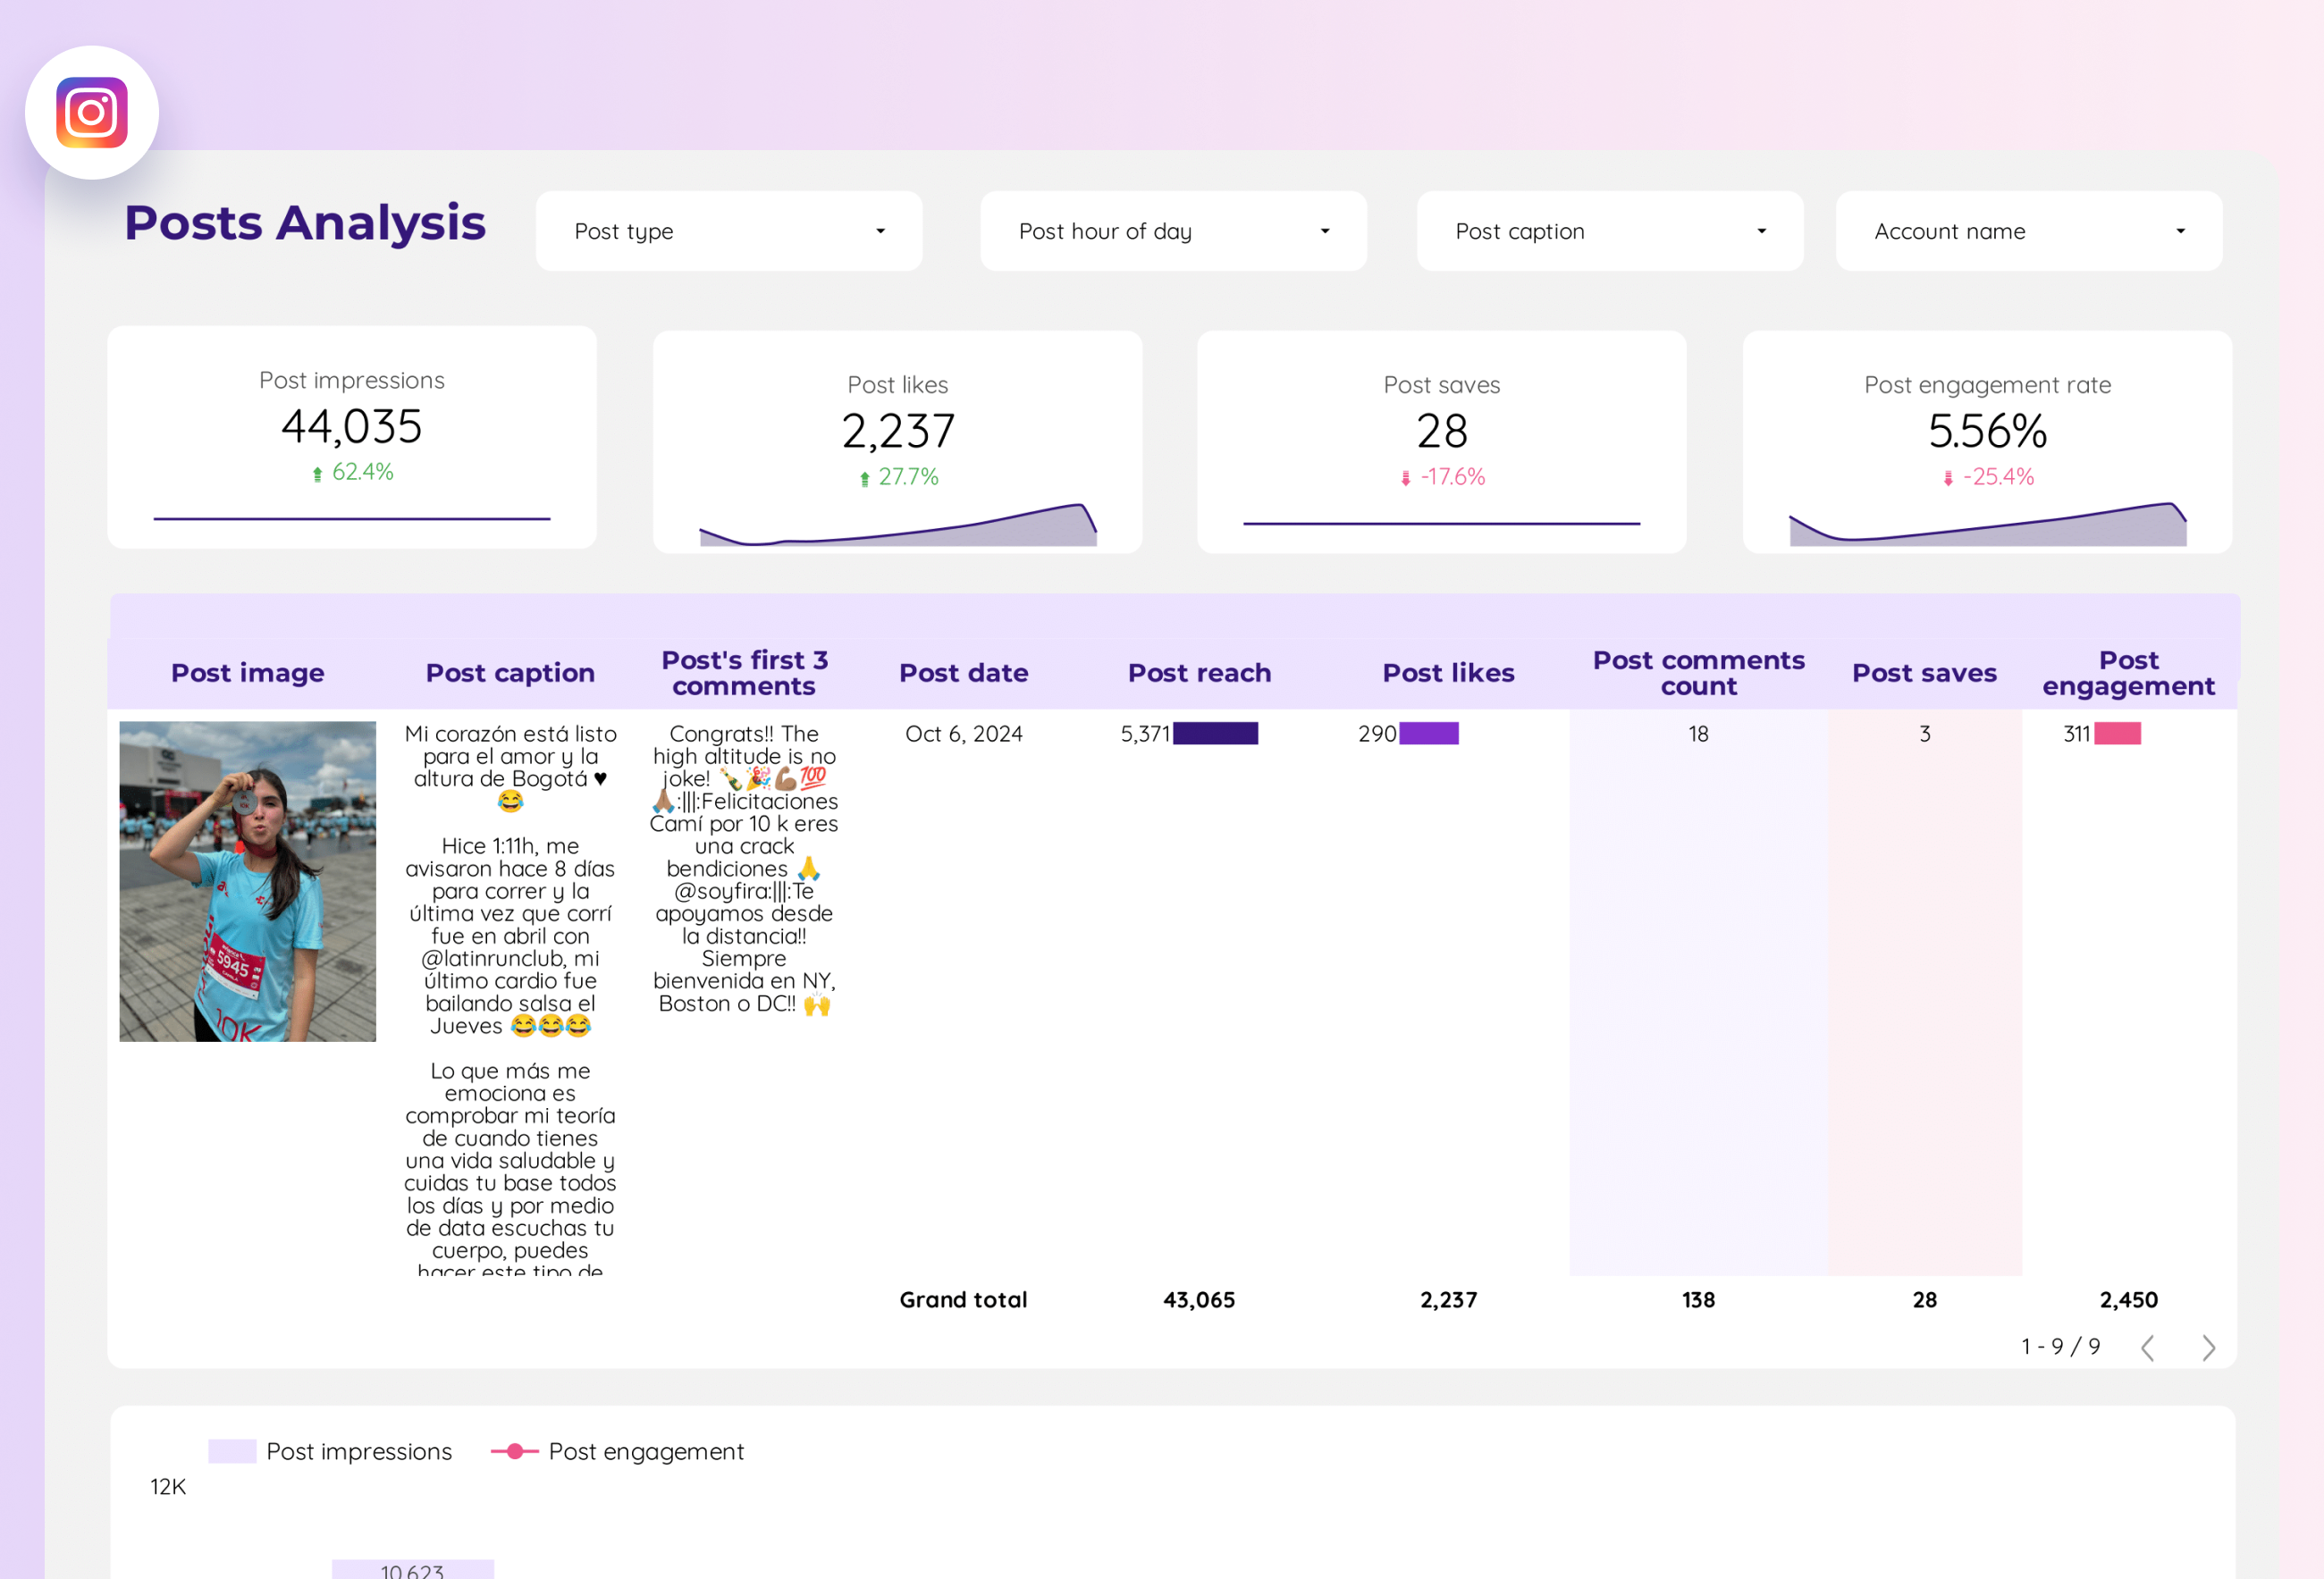
 Impressions
 Engagement

