A FB + GA report should include a breakdown of metrics by visibility (e.g., impressions, reach), engagement (e.g., likes, comments), and conversion metrics (e.g., click-through rate, conversion rate). The data should be segmented by campaign, channel, audience, content, objective, and date. For example, presenting the number of impressions generated by each campaign or the conversion rate based on different channels used. Being concise and precise, this report provides essential insights into the performance of Facebook and Google Analytics efforts.
1) To analyze the data, choose metrics related to visibility, such as reach and impressions, engagement metrics like likes and comments, and conversion metrics such as click-through rates and conversions. Break down these metrics by visibility, engagement, and conversion to gain a comprehensive understanding of performance.
2) Add context by comparing the metrics against the cost of the campaign, date ranges, goals, and benchmark rates. For example, compare the cost per impression with industry benchmarks to assess cost-effectiveness.
3) Segment the data by campaign, channel, audience, content, objective, and date to identify patterns and insights. For instance, analyze engagement metrics for different content types and determine which resonates best with the target audience.
To build a combined Facebook and Google Ads dashboard, 1) connect your Facebook Ads Manager and Google Ads accounts. 2) Select metrics such as click-through rates, cost per click, and conversion rates to monitor performance. 3) Segment data by campaign, channel, audience, product, customer content, objective, and date for a detailed analysis. 4) Add filters or buttons for metrics like ad spend or impressions to make your report interactive. 5) Share your dashboard via PDF, scheduled emails, or links for easy access.
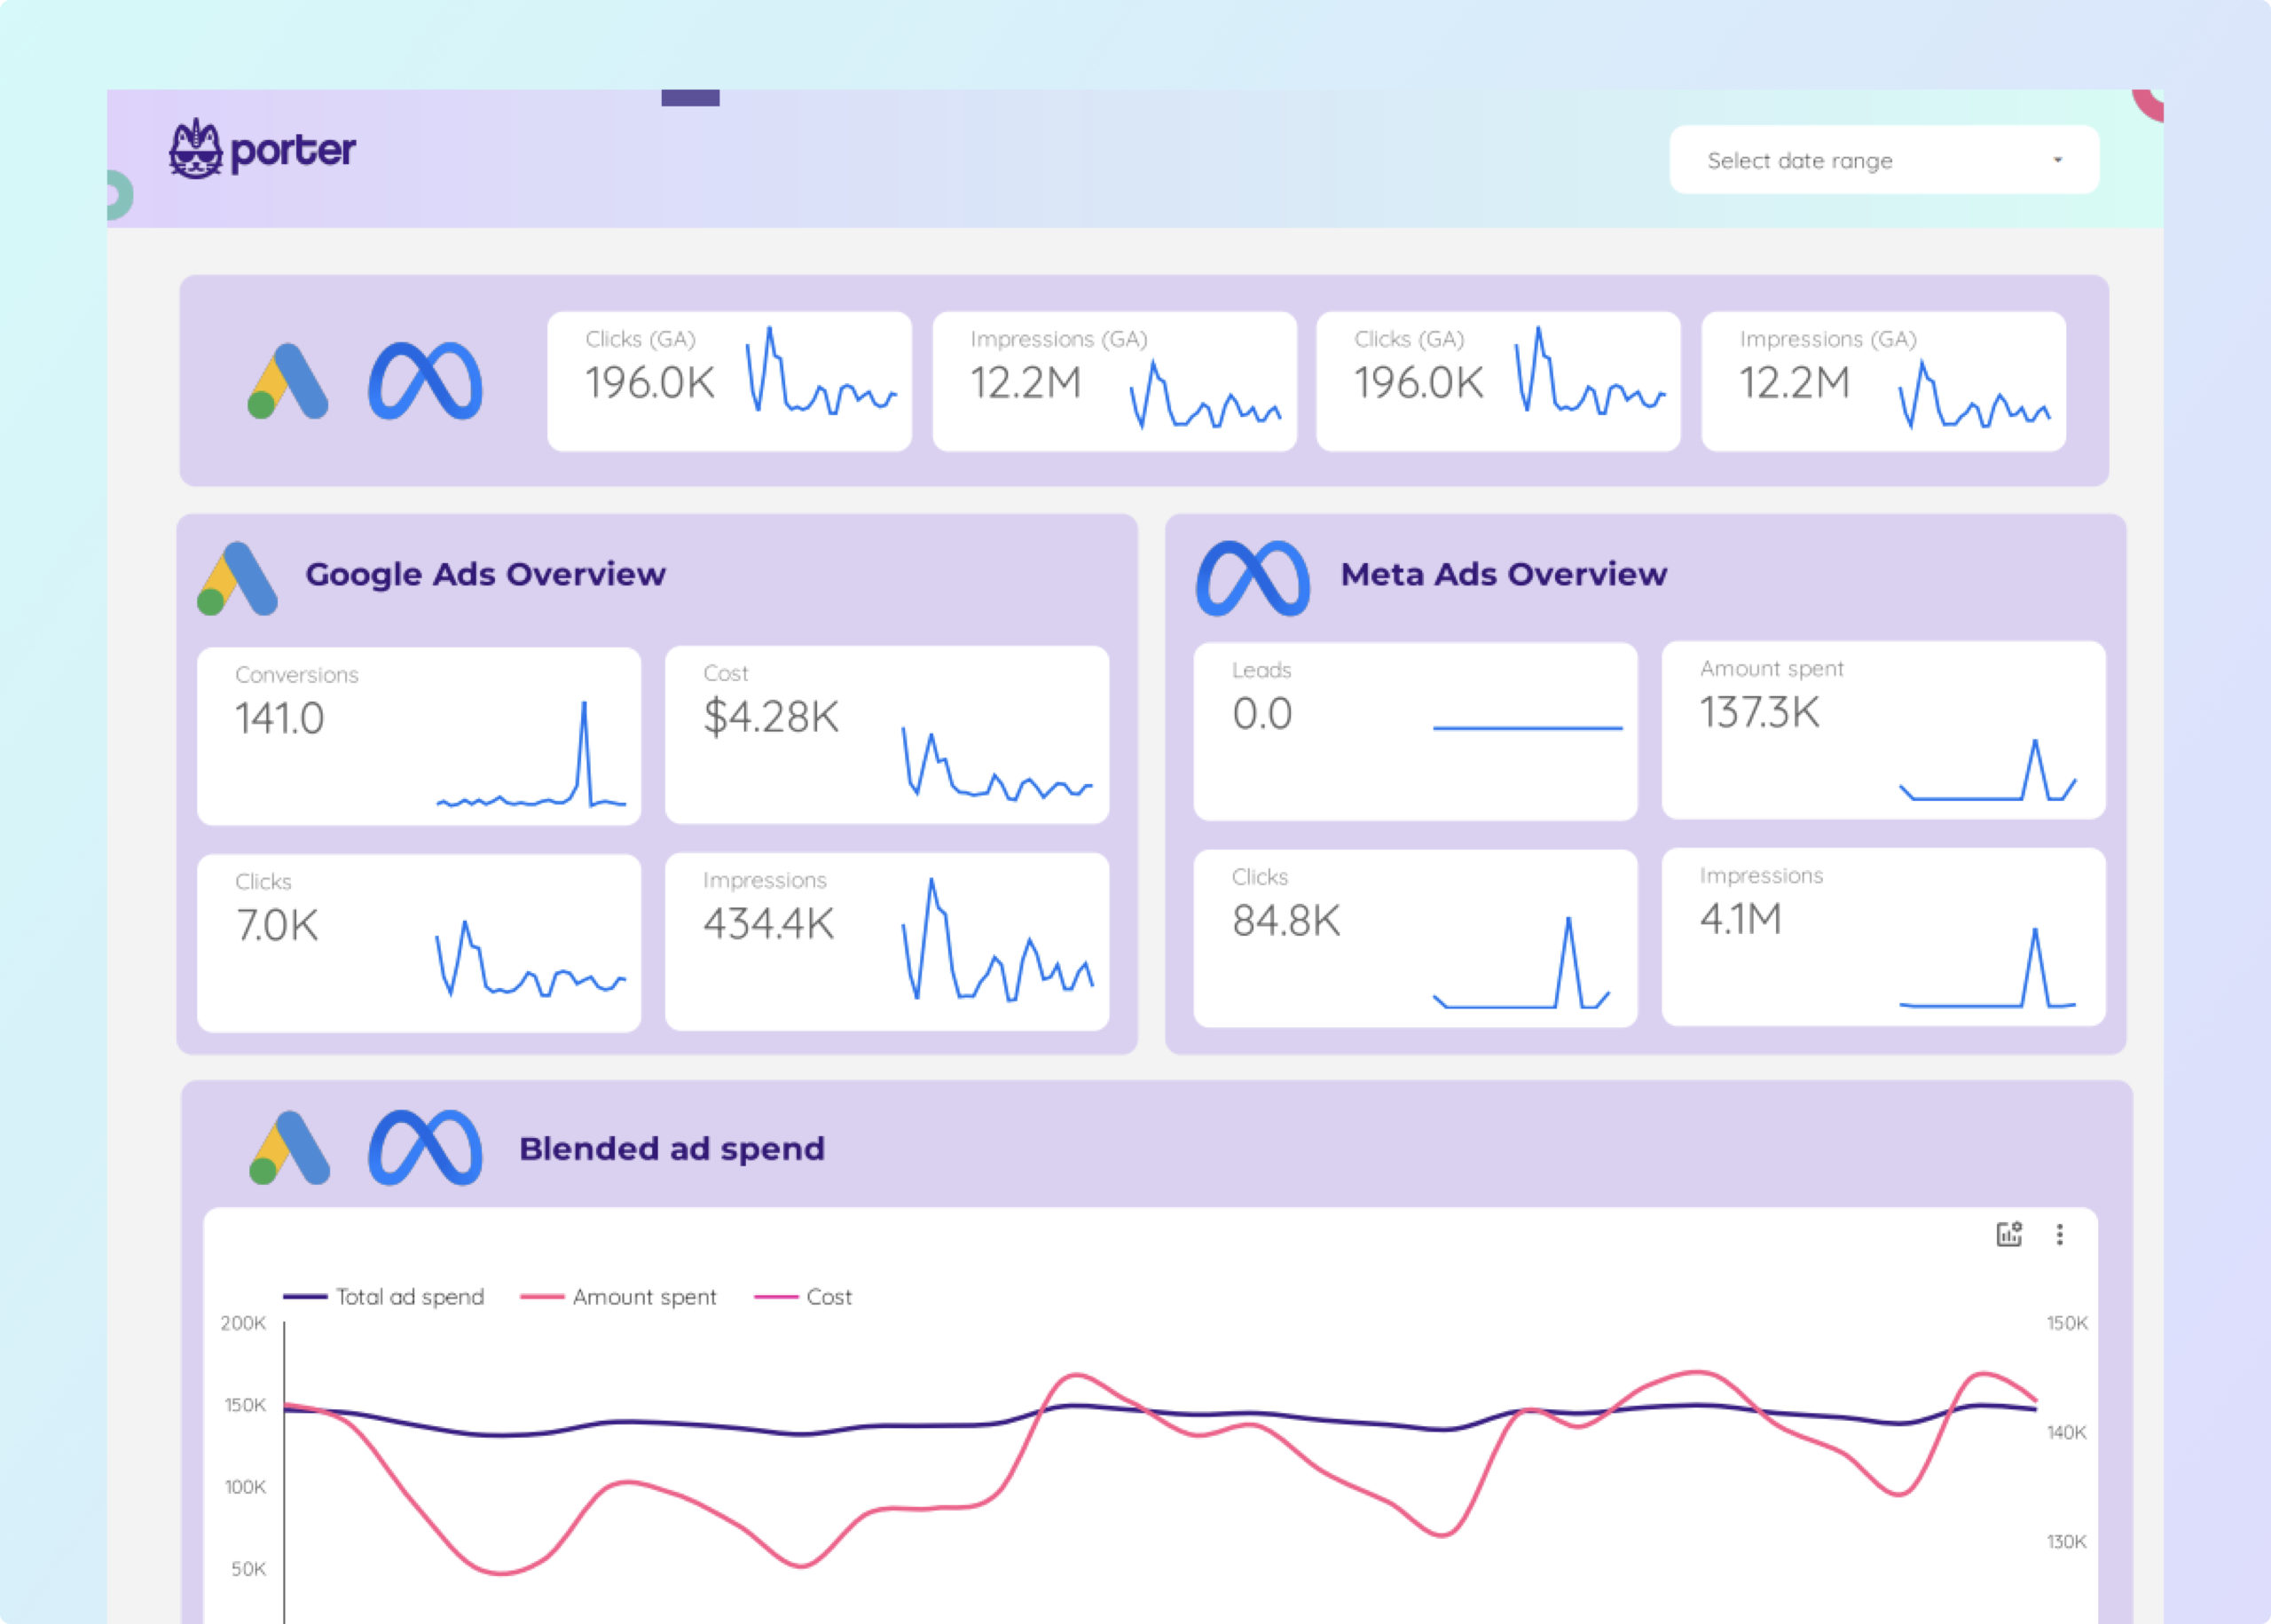
A Facebook Ads + Google Ads dashboard is a visual tool that consolidates, tracks, and displays key marketing metrics from both platforms to help businesses monitor their ad performance. It is significant for businesses as it aids in making data-driven decisions, optimizing ad campaigns, and improving ROI. Tools like Looker Studio are commonly used to create these dashboards, which typically include elements like impressions, clicks, conversions, and cost per action. Real-time data monitoring is crucial as it allows businesses to react quickly to changes and optimize their strategies. For learning how to create a marketing dashboard using Looker Studio, refer to our YouTube channel: https://www.youtube.com/@porter.metrics.
Can I download this template in PDF?
 Impressions
 Ad Spend
 Conversions

