An Engagement report should include visibility metrics such as impressions and reach, engagement metrics like likes, shares, and comments, and conversion metrics such as click-through rate and conversion rate. The data should be segmented by campaign, channel (e.g., social media, email marketing), audience demographics, content types (e.g., video, image), objective (e.g., brand awareness, lead generation), and date. For example, a report may show that a video campaign on Facebook targeted towards millennials achieved high reach and engagement, leading to an increased click-through rate and conversions.
To analyze engagement data, the first step is to choose metrics and break them down by visibility, engagement, and conversion metrics. For visibility, metrics like impressions and reach can be measured. For engagement, metrics such as likes, comments, shares, and time spent on content are relevant. And for conversion, metrics like click-through rates and conversion rates can be included.
Next, add context by comparing these metrics against cost, date range, goals, rates, and benchmarks. For example, comparing the cost per impression or cost per conversion can provide insights into efficiency and effectiveness. Additionally, comparing the metrics to set goals and industry benchmarks can provide a sense of performance.
Then, segment the data by campaign, channel, audience, content, objective, and date. For instance, analyzing engagement metrics for different campaigns or channels can determine which ones are driving higher engagement rates. Segmenting by audience or content can reveal preferences or trends among different groups. Lastly, analyzing data over different date ranges can identify temporal patterns or impact of specific events.
Overall, by following these steps and including contextual examples, an engagement report can provide a comprehensive analysis of the chosen metrics, how they compare to benchmarks and costs, and how they vary across different segments.
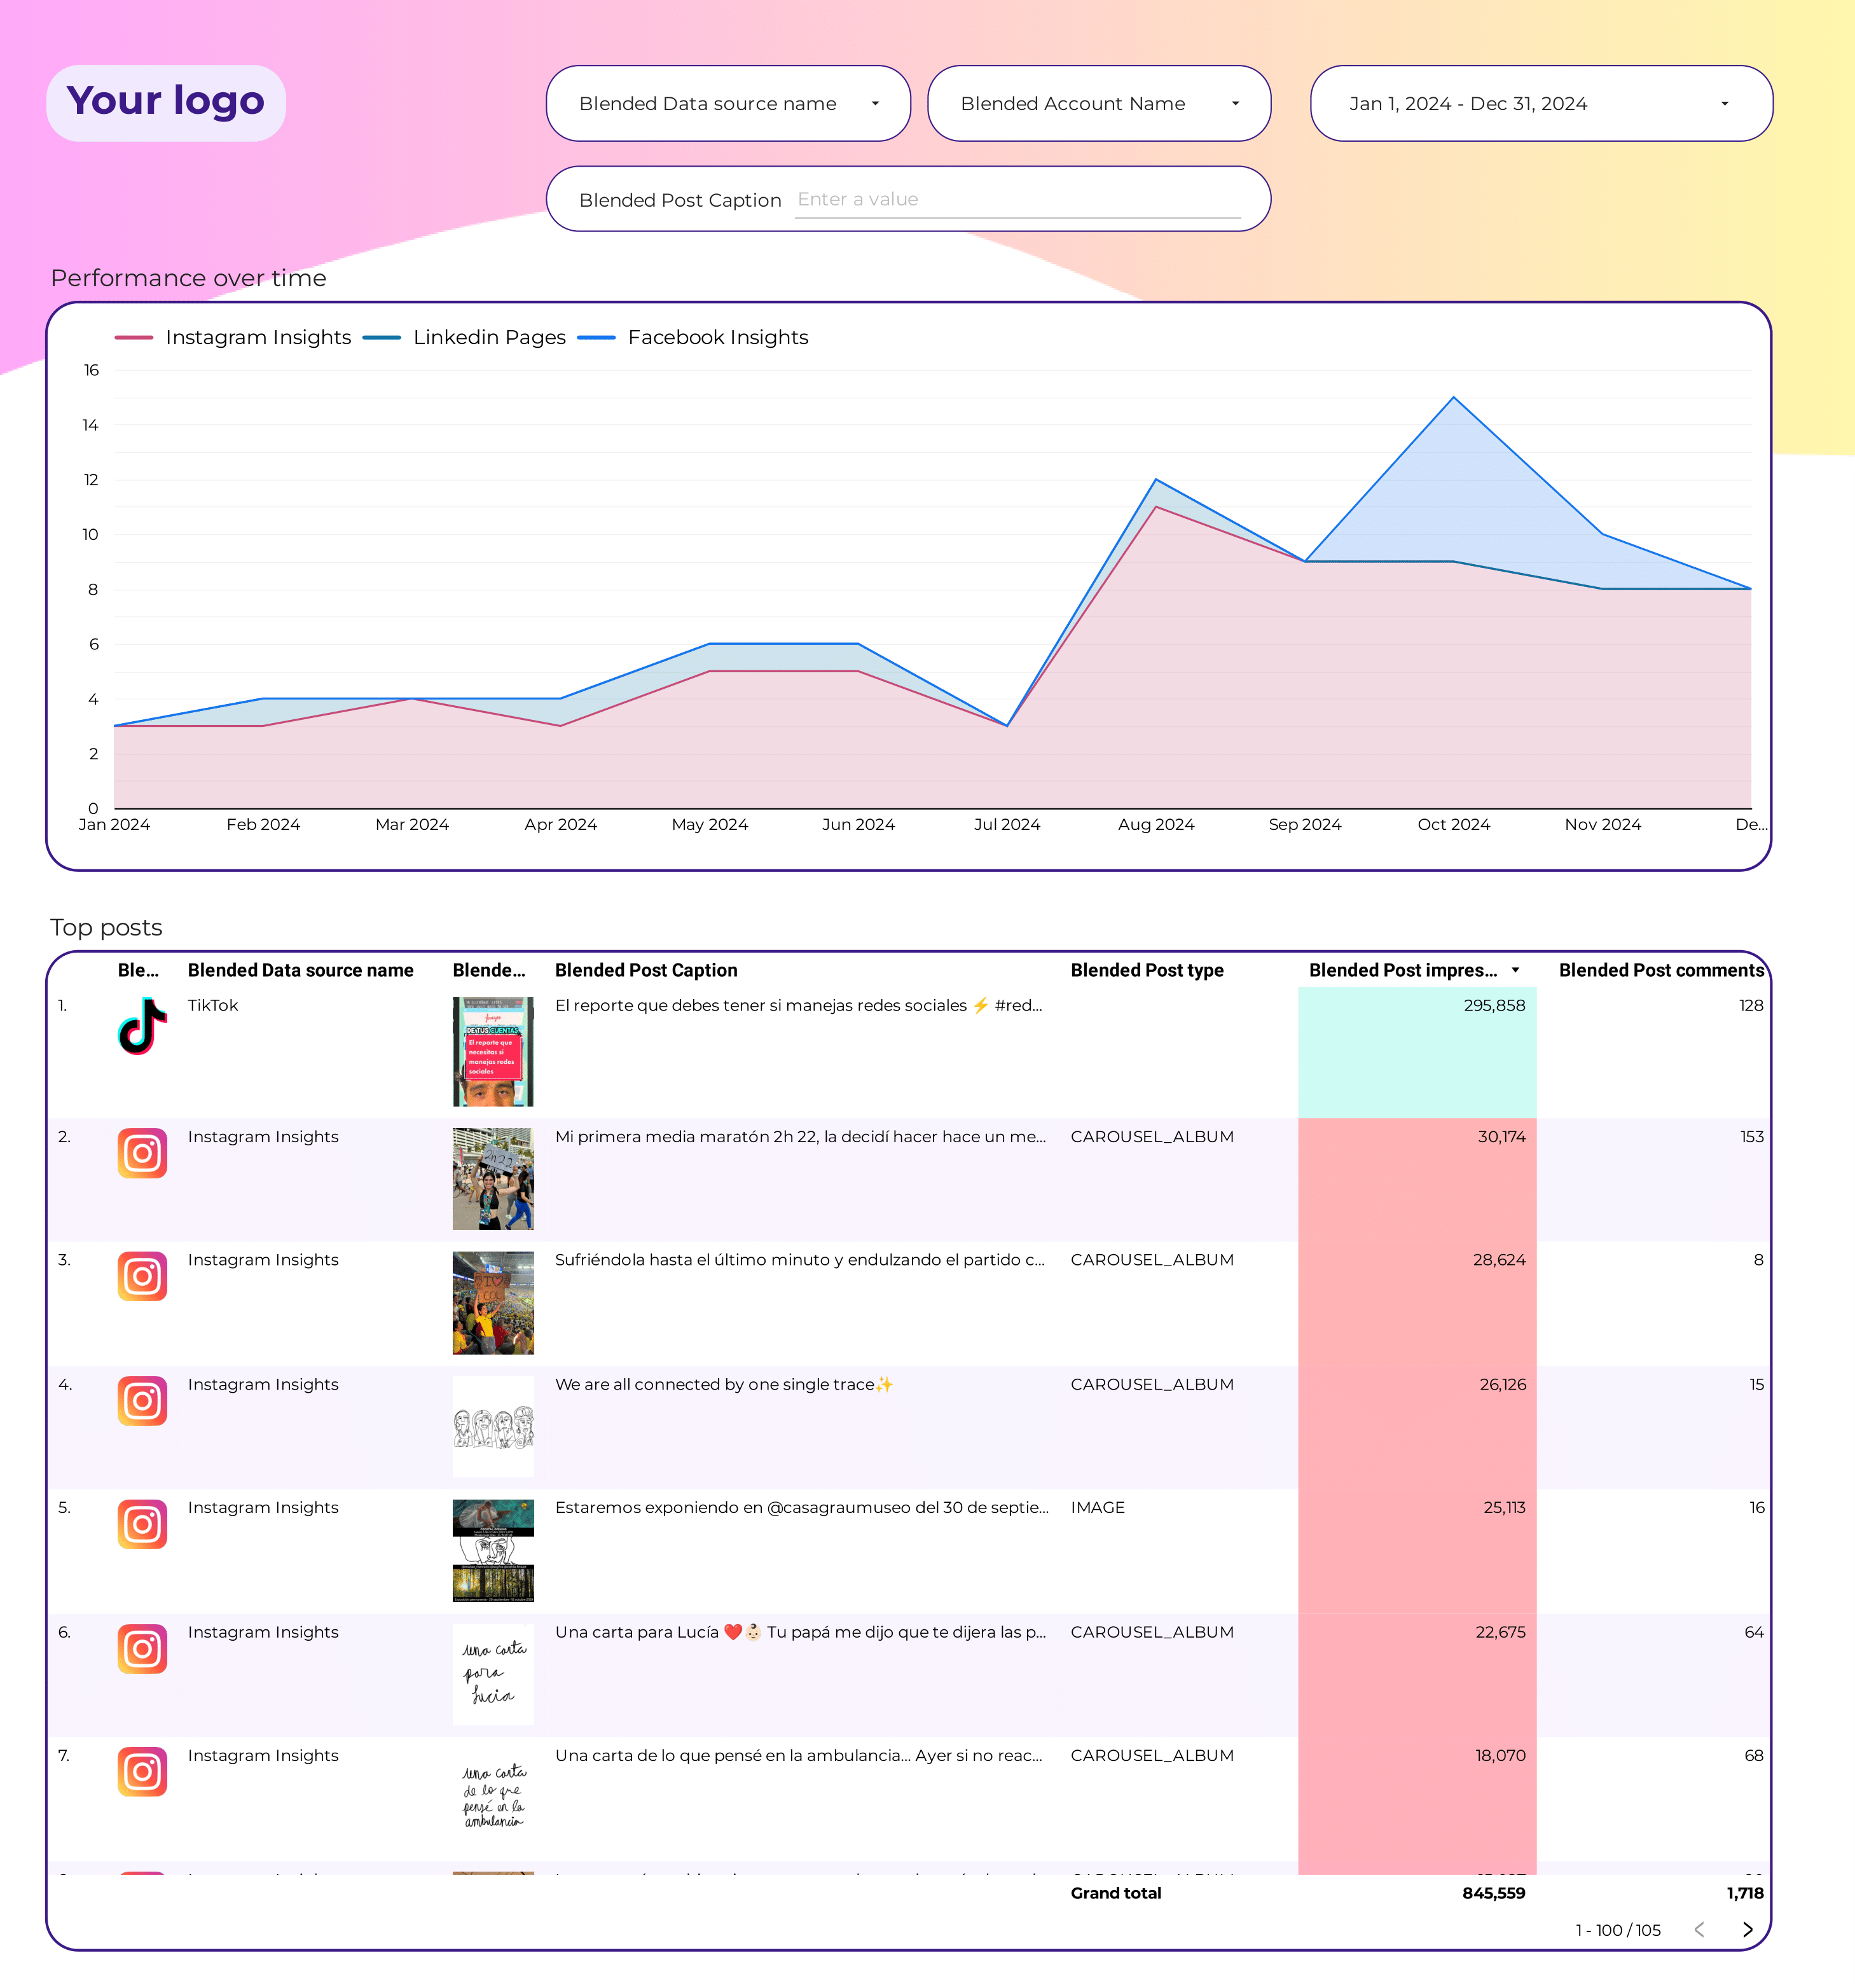
To build an Engagement dashboard, 1) connect your social media and website accounts to gather data. 2) Select metrics such as likes, shares, comments, click-through rates, and time spent on page. 3) Segment data by campaign, channel (Facebook, Twitter, etc.), audience demographics, product, customer content, objective, and date. 4) Add filters for specific time periods or audience groups, and buttons to switch between different data views. 5) Share your dashboard via PDF, scheduled emails, or direct links.
An Engagement Dashboard is a visual tool that displays key metrics related to customer or user engagement with a business’s products or services. It is significant for businesses as it helps them track, analyze, and improve their engagement strategies, using tools like Looker Studio. Key elements typically include metrics like active users, session duration, bounce rate, and conversion rate. Real-time data monitoring is crucial as it allows businesses to make immediate adjustments based on current trends. For learning how to create a marketing dashboard using Looker Studio, refer to the Porter Metrics YouTube channel (https://www.youtube.com/@porter.metrics).
Can I download this template in PDF?
 Impressions
 Ad Spend
 Engagement Rate
 Followers
 Video Views
 Pins Saved
 Location

