A Channels analysis report should include a breakdown of metrics by visibility (e.g. impressions, reach), engagement (e.g. clicks, likes, comments), and conversion metrics (e.g. conversions, revenue). The data should be segmented by campaign, channel, audience, content, objective, and date to provide insightful analysis. For example, it should show the performance of a social media campaign on Facebook vs Instagram, engagement rates of different audience segments, and the conversion rates of different content types.
To analyze channel data, follow these steps:
1) Choose your metrics: Break them down into visibility metrics (impressions, reach, click-through rate), engagement metrics (likes, comments, shares), and conversion metrics (conversion rate, cost per conversion).
2) Add context by comparing against cost, date range, goals, rates, and benchmarks: For example, compare the cost per conversion of different channels to determine the most cost-effective one. Compare the click-through rates of campaigns over different date ranges to identify trends. Benchmark against industry averages to assess performance.
3) Segment data by campaign, channel, audience, content, objective, and date: Analyze the performance of specific campaigns or channels to identify strengths and weaknesses. Compare audience engagement on different types of content to optimize future strategies. Analyze objective-based metrics to determine if the desired goals are being achieved.
For instance, when analyzing the data, compare the click-through rates of a Facebook campaign versus an Instagram campaign to assess their respective visibility metrics. Examine the cost per conversion of different campaigns conducted over a specific date range to evaluate conversion metrics. Segment the channel data by audience to understand the engagement metrics of different target groups. By analyzing the data in this manner, one can gain valuable insights into the performance of various channels, campaigns, and objectives without mentioning the benefits explicitly.
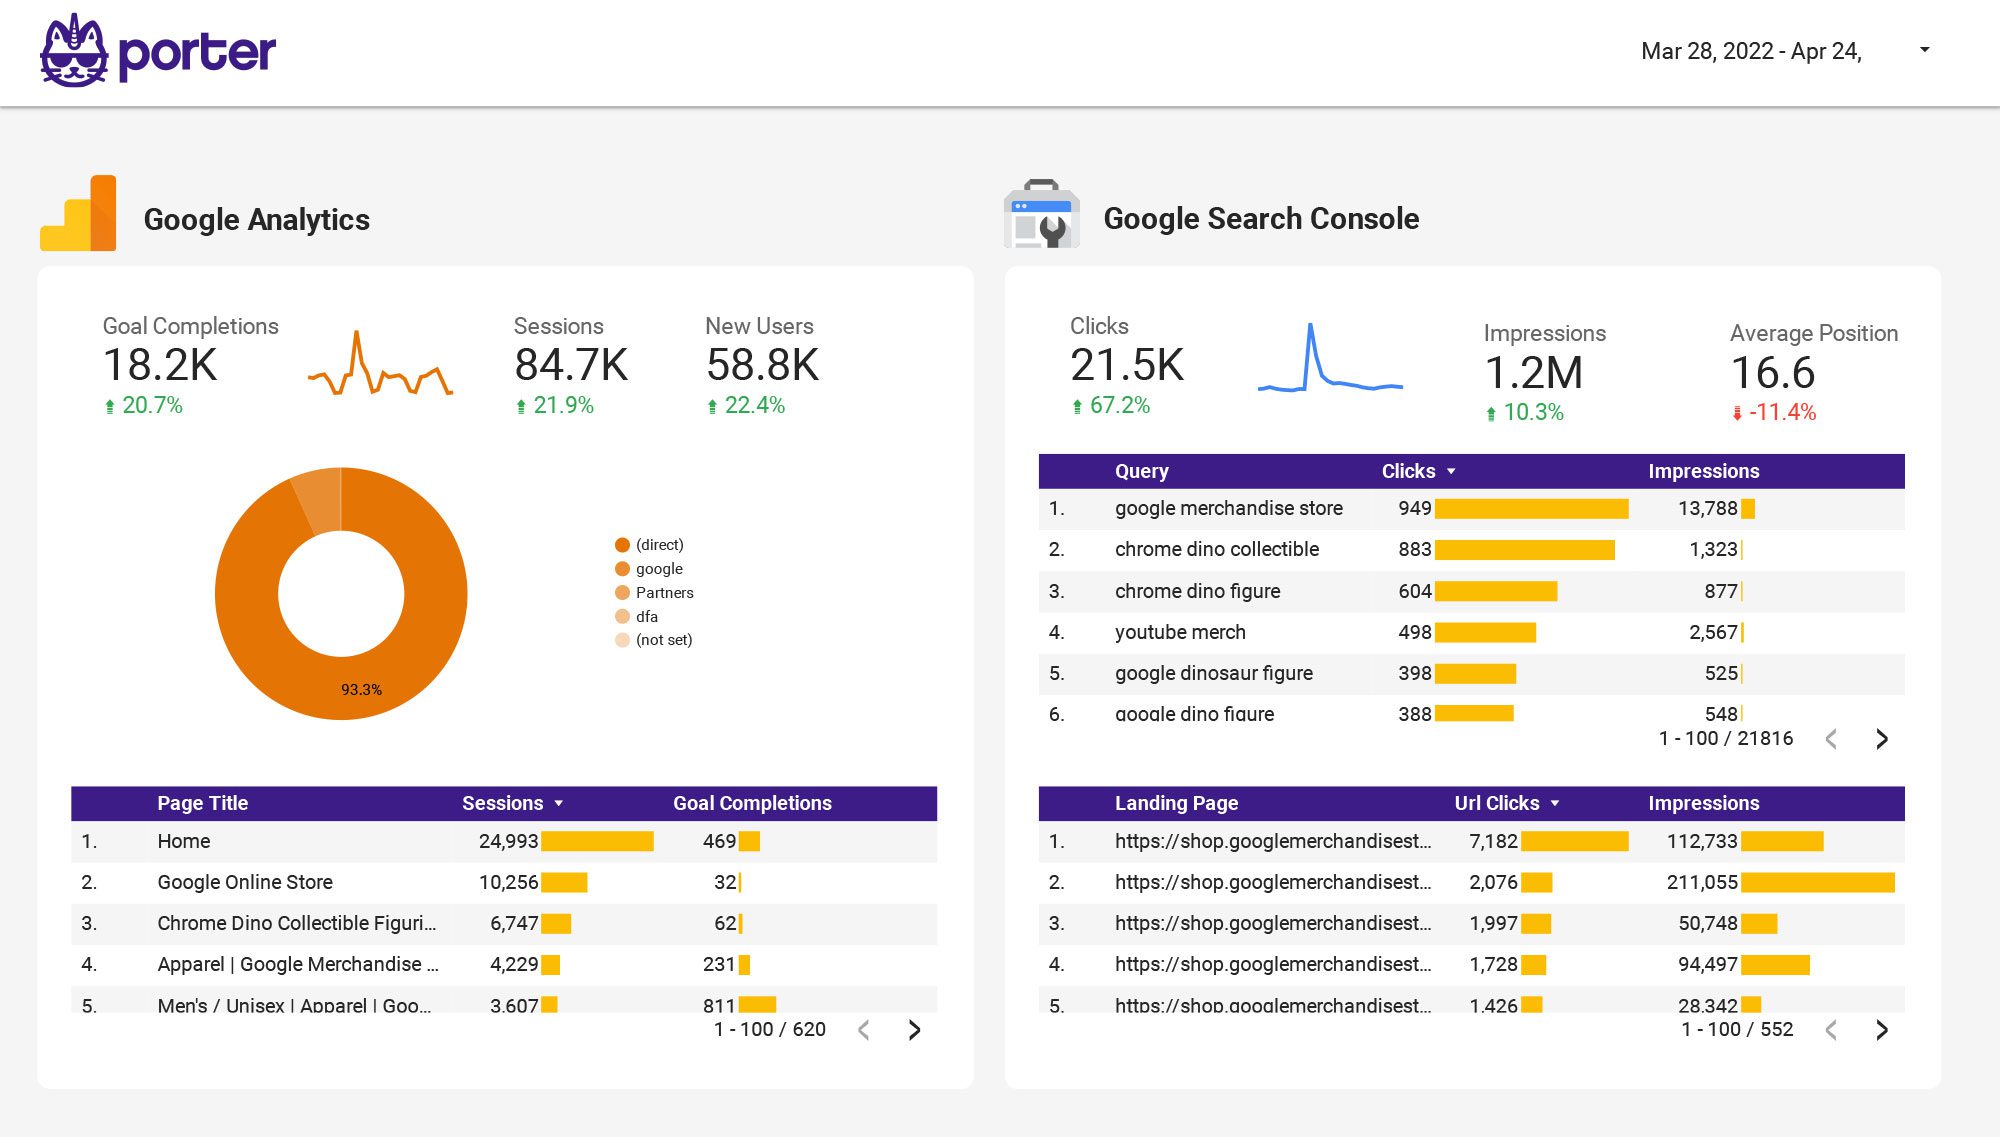
To build a channels analysis dashboard, 1) connect your data and accounts from various platforms like Google Analytics, Facebook, or Instagram. 2) Select the metrics to monitor performance such as click-through rates, conversion rates, or bounce rates. 3) Segment or break down data by campaign, channel, audience, product, customer content, objective, date. For instance, you can segment data by social media channels or email marketing campaigns. 4) Add filters or buttons to make your report interactive, allowing for real-time data analysis. 5) Share your dashboard via PDF, scheduled emails, or links for easy access and review.
A Channels Analysis Dashboard is a visual representation of key metrics and data related to a company’s marketing channels. It is significant for businesses as it helps in tracking performance, identifying trends, and making data-driven decisions. Tools like Looker Studio are commonly used to create these dashboards, which typically include elements like traffic sources, conversion rates, and customer engagement metrics. Real-time data monitoring is crucial as it allows for immediate response to changes and trends. For learning how to create a marketing dashboard using Looker Studio, visit our YouTube channel: https://www.youtube.com/@porter.metrics.
Can I download this template in PDF?
 Impressions
 CTR
CTR Conversions
 Engagement Rate
 Video Views
 Bounce Rate
 Followers
 Likes
Likes Shares
 Page Views

