A Stories report should include metrics breakdown by visibility, engagement, and conversion. The data should be segmented by campaign, channel, audience, content, objective, and date. For example, include the number of impressions, swipe-ups, and conversions for each campaign, channel, and audience. Additionally, provide insights on the type of content that generates higher engagement and conversion rates.
To analyze the data on Stories, we can include the following metrics:
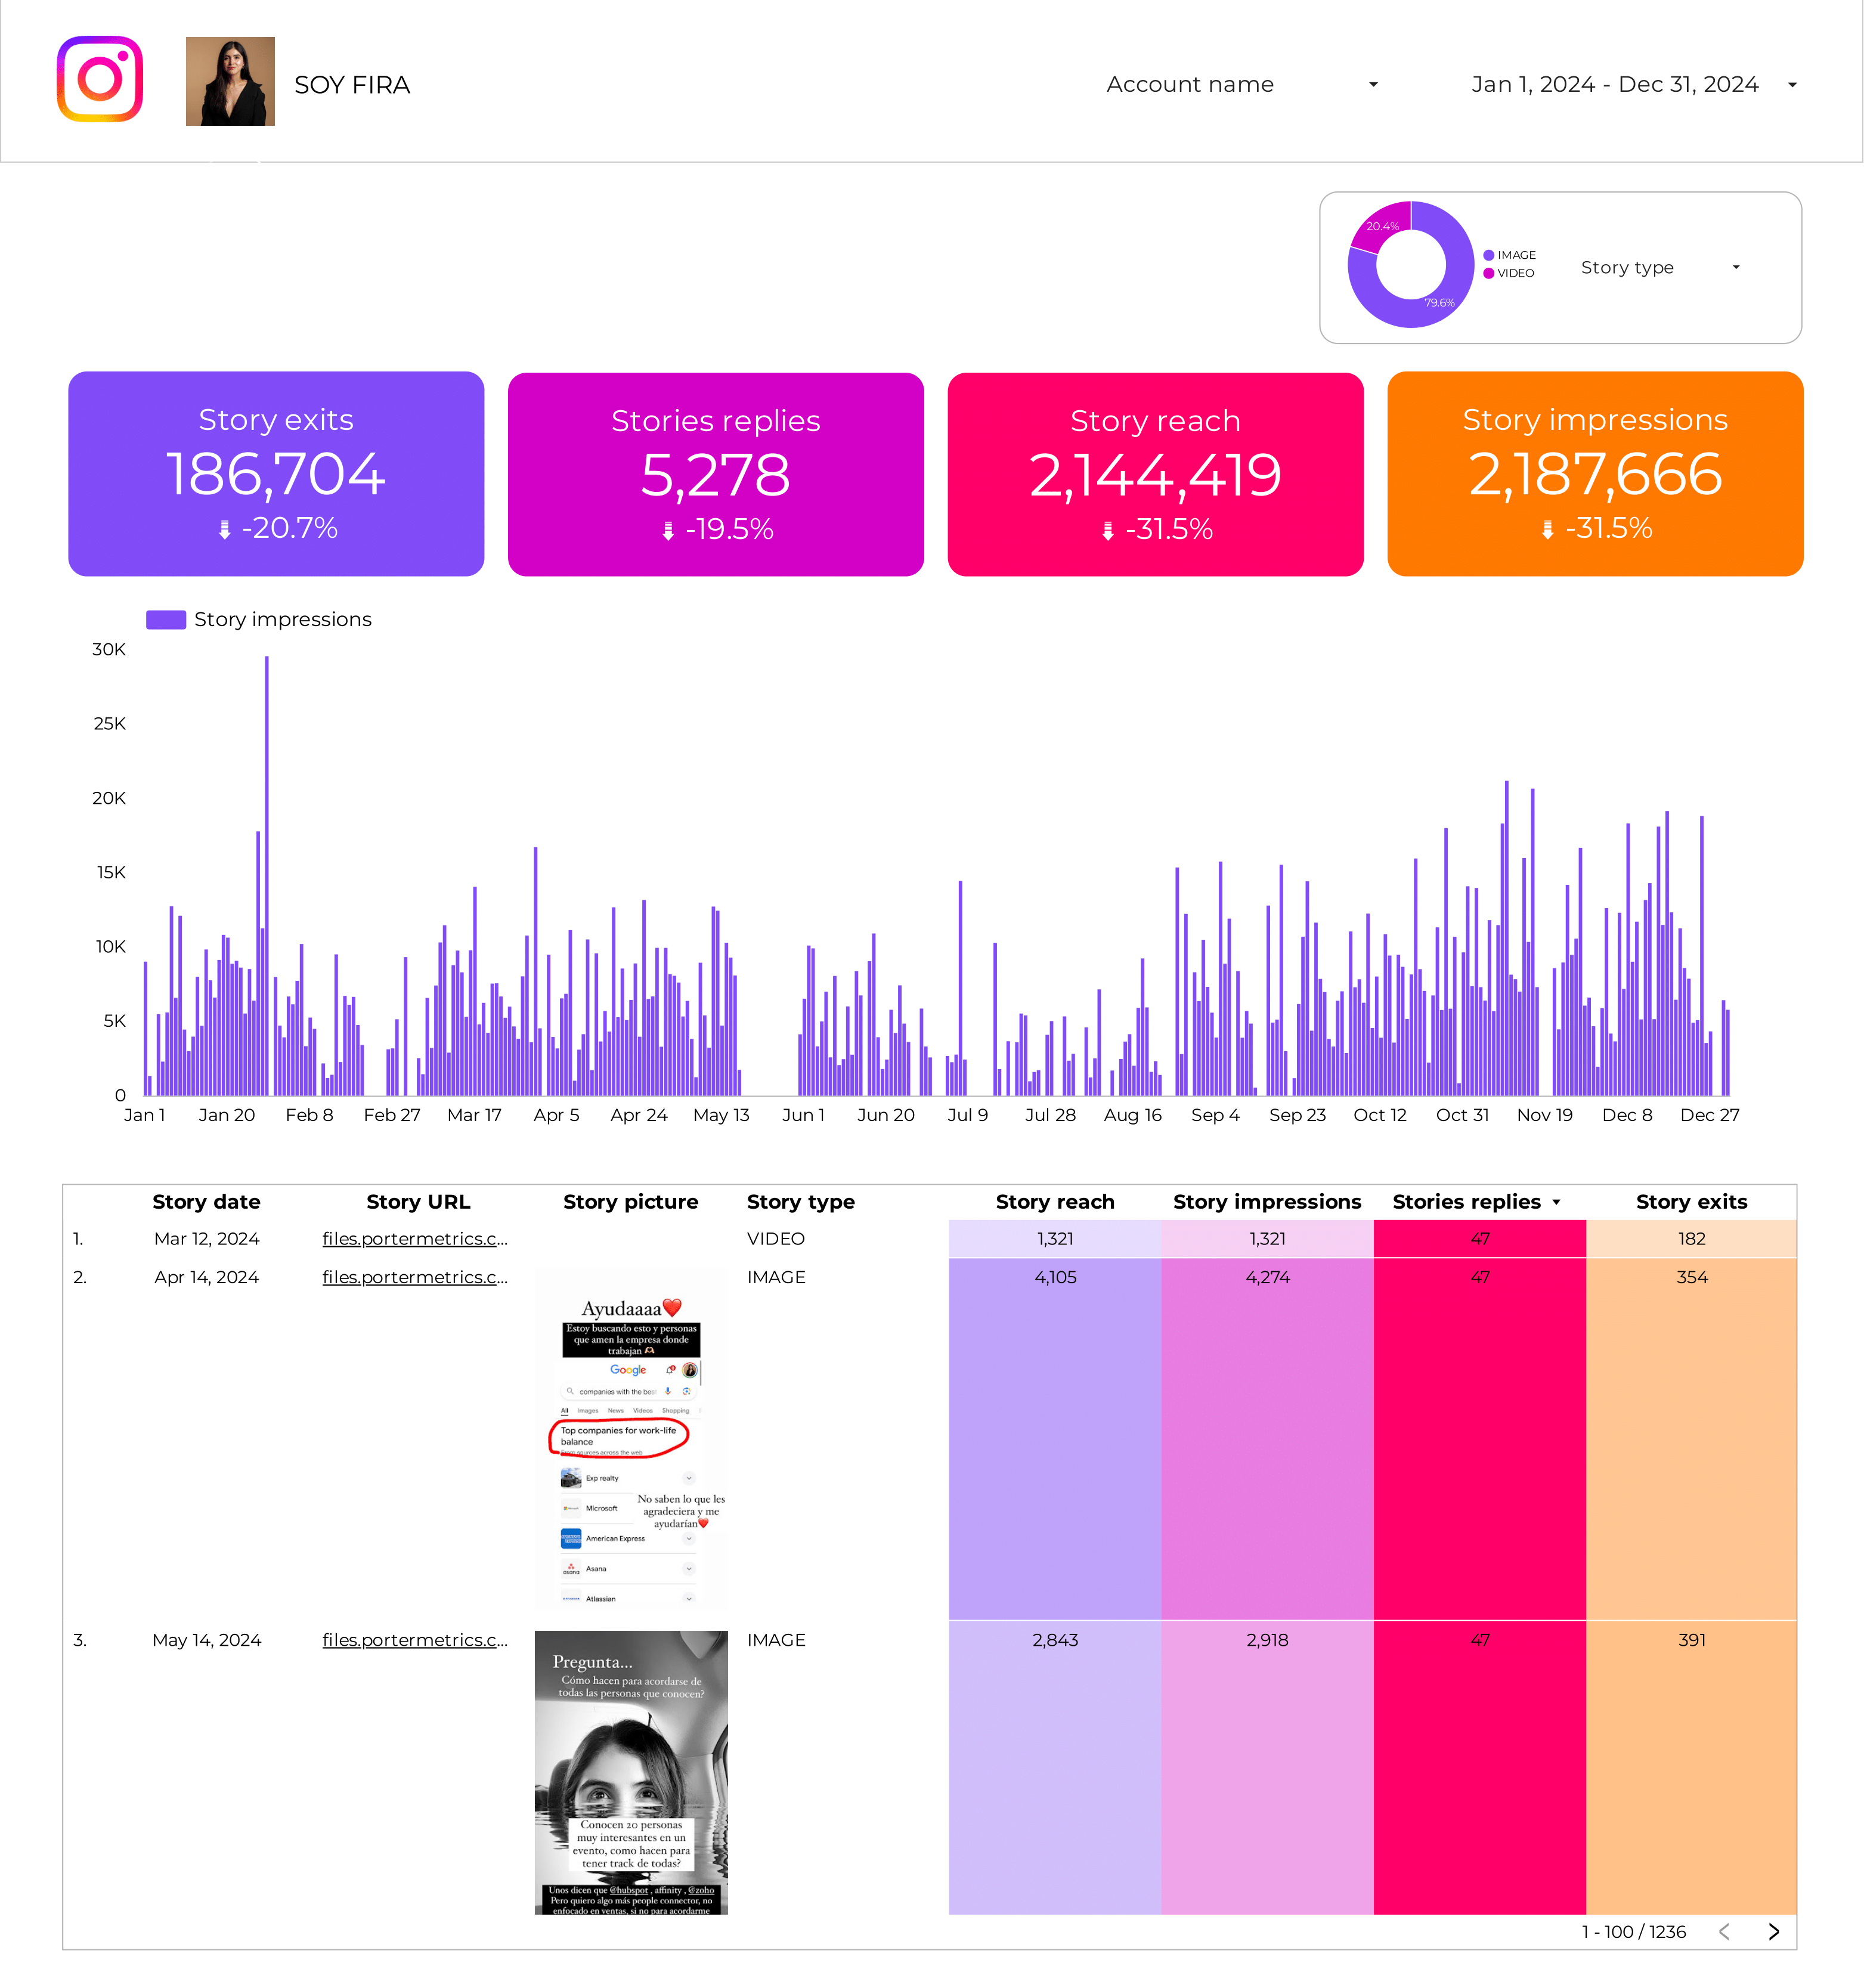
1) Visibility Metrics: Number of impressions, reach, and click-through rate (CTR).
2) Engagement Metrics: Number of likes, comments, and shares.
3) Conversion Metrics: Number of conversions, conversion rate, and return on investment (ROI).
To add context, we can compare these metrics against:
1) Cost: Analyze the cost per impression, cost per engagement, and cost per conversion.
2) Date Range: Compare the performance over different time periods to identify trends and patterns.
3) Goals: Evaluate if the metrics align with the set goals.
4) Rates: Analyze engagement and conversion rates to understand the effectiveness of the Stories.
5) Benchmarks: Compare the performance against industry benchmarks to ascertain the performance level.
Segment the data by:
1) Campaign: Compare the metrics across different campaigns to identify the best-performing ones.
2) Channel: Analyze how the Stories perform across different channels, such as Instagram, Facebook, or Snapchat.
3) Audience: Break down the metrics by the target audience demographics to identify any variations.
4) Content: Analyze the performance of different content types, such as images, videos, or interactive elements.
5) Objective: Assess the performance based on the different objectives, such as brand awareness or driving sales.
6) Date: Compare the performance on different dates or days of the week to identify any patterns or trends.
For example, analyzing the Stories data may reveal that a campaign targeting a younger audience on Instagram generates higher engagement metrics, such as likes and comments, compared to campaigns on other channels or targeting different demographics. By segmenting the data, it becomes evident that video content tends to have a higher conversion rate, resulting in a better ROI.
To build an Instagram Stories dashboard, 1) connect your Instagram account and any related data sources. 2) Choose metrics such as views, reach, replies, and exit rates to monitor performance. 3) Segment data by individual story, audience demographics, posting time, and content type. 4) Add filters for date ranges or specific content types to make your report interactive. 5) Share your dashboard via PDF, scheduled emails, or direct links.
An Instagram stories dashboard is a tool that visually presents data related to Instagram stories, such as views, engagement, and reach, to help businesses monitor and optimize their social media strategies. It is significant for businesses as it provides insights into customer behavior, content performance, and campaign effectiveness. Tools like Looker Studio are commonly used to create such dashboards, which typically include key elements like story views, click-through rates, and audience demographics. Real-time data monitoring is crucial as it allows businesses to make immediate adjustments to their strategies based on current trends and performance. For learning how to create a marketing dashboard using Looker Studio, you can refer to our YouTube channel: https://www.youtube.com/@porter.metrics.
Yes, Looker Studio allows you to download your report as a PDF. To do it, follow these steps:
Before downloading your report choose the date range you want to visualize on your report.
Click on the “File” menu at the top left corner of the screen.
Select “Download as” from the drop-down menu and choose “PDF.”
You can choose which pages you want to download, and also you can add a password to protect the report and add a link back to the online report.
Click on “Download” to save the report on your device.
 Instagram Insights
 Impressions

