A Peso model report should include metrics such as conversion metrics like Leads generated, Conversion rate, and Cost per conversion; engagement metrics like Shares, Comments, and Likes; and visibility metrics like Impressions, Reach, and Frequency.
Then, segment and filter this data by dimensions like Campaign name, campaign budget, campaign duration, Target audience, Audience demographics, Audience interests, and by hour, day, week, month, quarter, or year.
Once the data is ready, make sure to add buttons and filters to make your reports interactive, use custom colors and logos to make it white-label, and share via link, PDF, or email so your teams or clients can access it.
To analyze Peso model data, start by defining your use case, such as a client presentation or performance monitoring. Next, identify key metrics like revenue, cost, and funnel metrics such as visibility, engagement, and conversion. For example, in the context of Facebook Ads, you might track metrics like reach, likes, shares, and click-through rates.
Add context by comparing these metrics over time, against objectives, or against costs to assess efficiency and effectiveness. For instance, compare the engagement rates of your Facebook Ads to industry benchmarks to evaluate performance.
Segment your data by channel (e.g., Facebook, Instagram), objective (e.g., brand awareness), campaign (e.g., holiday sales), product, and time. For example, analyze the performance of an e-commerce campaign on Instagram Insights from January to March, focusing on video content aimed at increasing brand awareness.
To build a Peso model dashboard, start by connecting your Social Media data such as Facebook Ads to platforms like Google Sheets or Google Looker Studio. Then, choose the metrics such as Leads generated, Conversion rate, Cost per conversion, Shares, Comments, Likes, Impressions, Reach, and Frequency to fully map your funnel. Segment and break down your data by channel, campaign, audience, product, or objective, with dimensions such as Campaign name, campaign budget, campaign duration, Target audience, Audience demographics, and Audience interests. The combination of these metrics and segmentation will help you spot trends and identify areas for optimization. Share your dashboard via PDF, scheduled emails, or links for easy access.
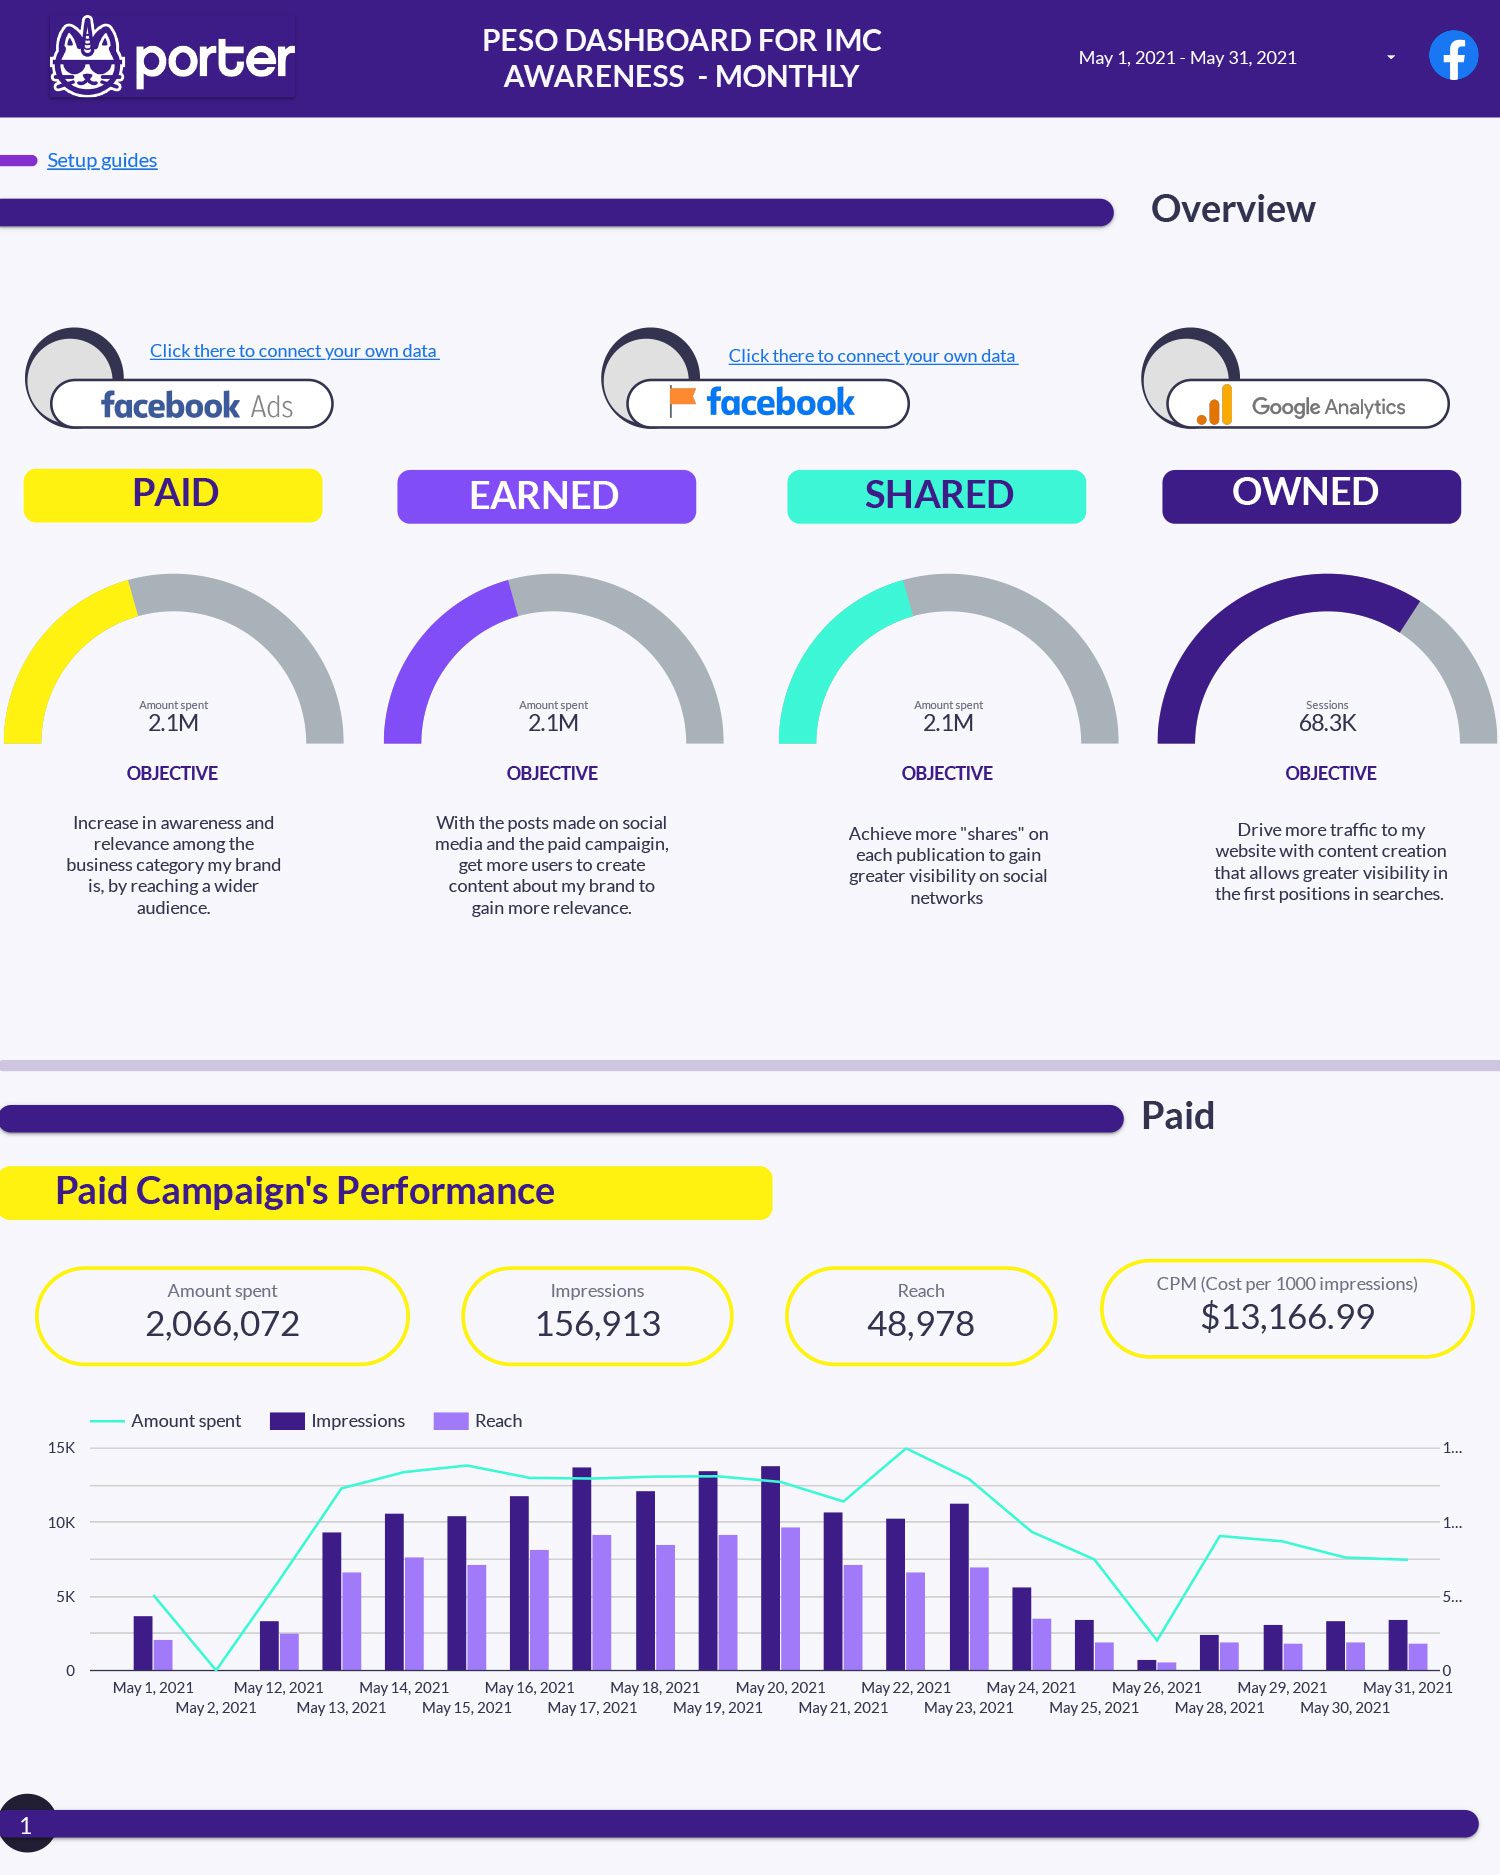
A Peso model dashboard is a visual tool used to track and analyze key metrics across Paid, Earned, Shared, and Owned media channels. It integrates data from platforms like Facebook Ads into tools such as Google Sheets or Looker Studio, focusing on metrics like leads, conversion rates, and engagement (shares, comments, likes). The dashboard segments data by channel, campaign, and audience, helping identify trends and optimization opportunities. It is shared via PDF, email, or links for easy access.
Can I download this template in PDF?


 Impressions
 Ad Spend
 Engagement Rate
 Followers
 Video Views
 Post Type
 Page Views