A creatives analysis report should include breaking down metrics by visibility, engagement, and conversion metrics. It should segment data by campaign, channel, audience, content, objective, and date. For example, providing the number of impressions, click-through rates, and conversions for each campaign, channel, or audience helps identify the performance of creatives at different stages. Additionally, analyzing engagement metrics like likes, shares, and comments provides insights into the effectiveness of different types of content. Lastly, conversion metrics such as lead generation or sales can highlight the impact of creatives.
To analyze this array of creatives data, follow these steps:
1) Choose metrics like visibility (impressions, reach), engagement (clicks, interactions), and conversion (conversions, ROI).
2) Add context by comparing against cost metrics, date range (e.g. weekly or monthly performance), goals (e.g. click-through-rate target), rates (e.g. engagement rate), and benchmarks for the industry or previous campaigns.
3) Segment the data by campaign (e.g. different ad sets), channel (e.g. Facebook, Instagram), audience (e.g. age groups), content (e.g. image vs. video), objective (e.g. brand awareness vs. lead generation), and date (e.g. analyze performance over time). For example, compare the engagement rate of video ads on Facebook vs. Instagram, or the conversion rate of different age groups.
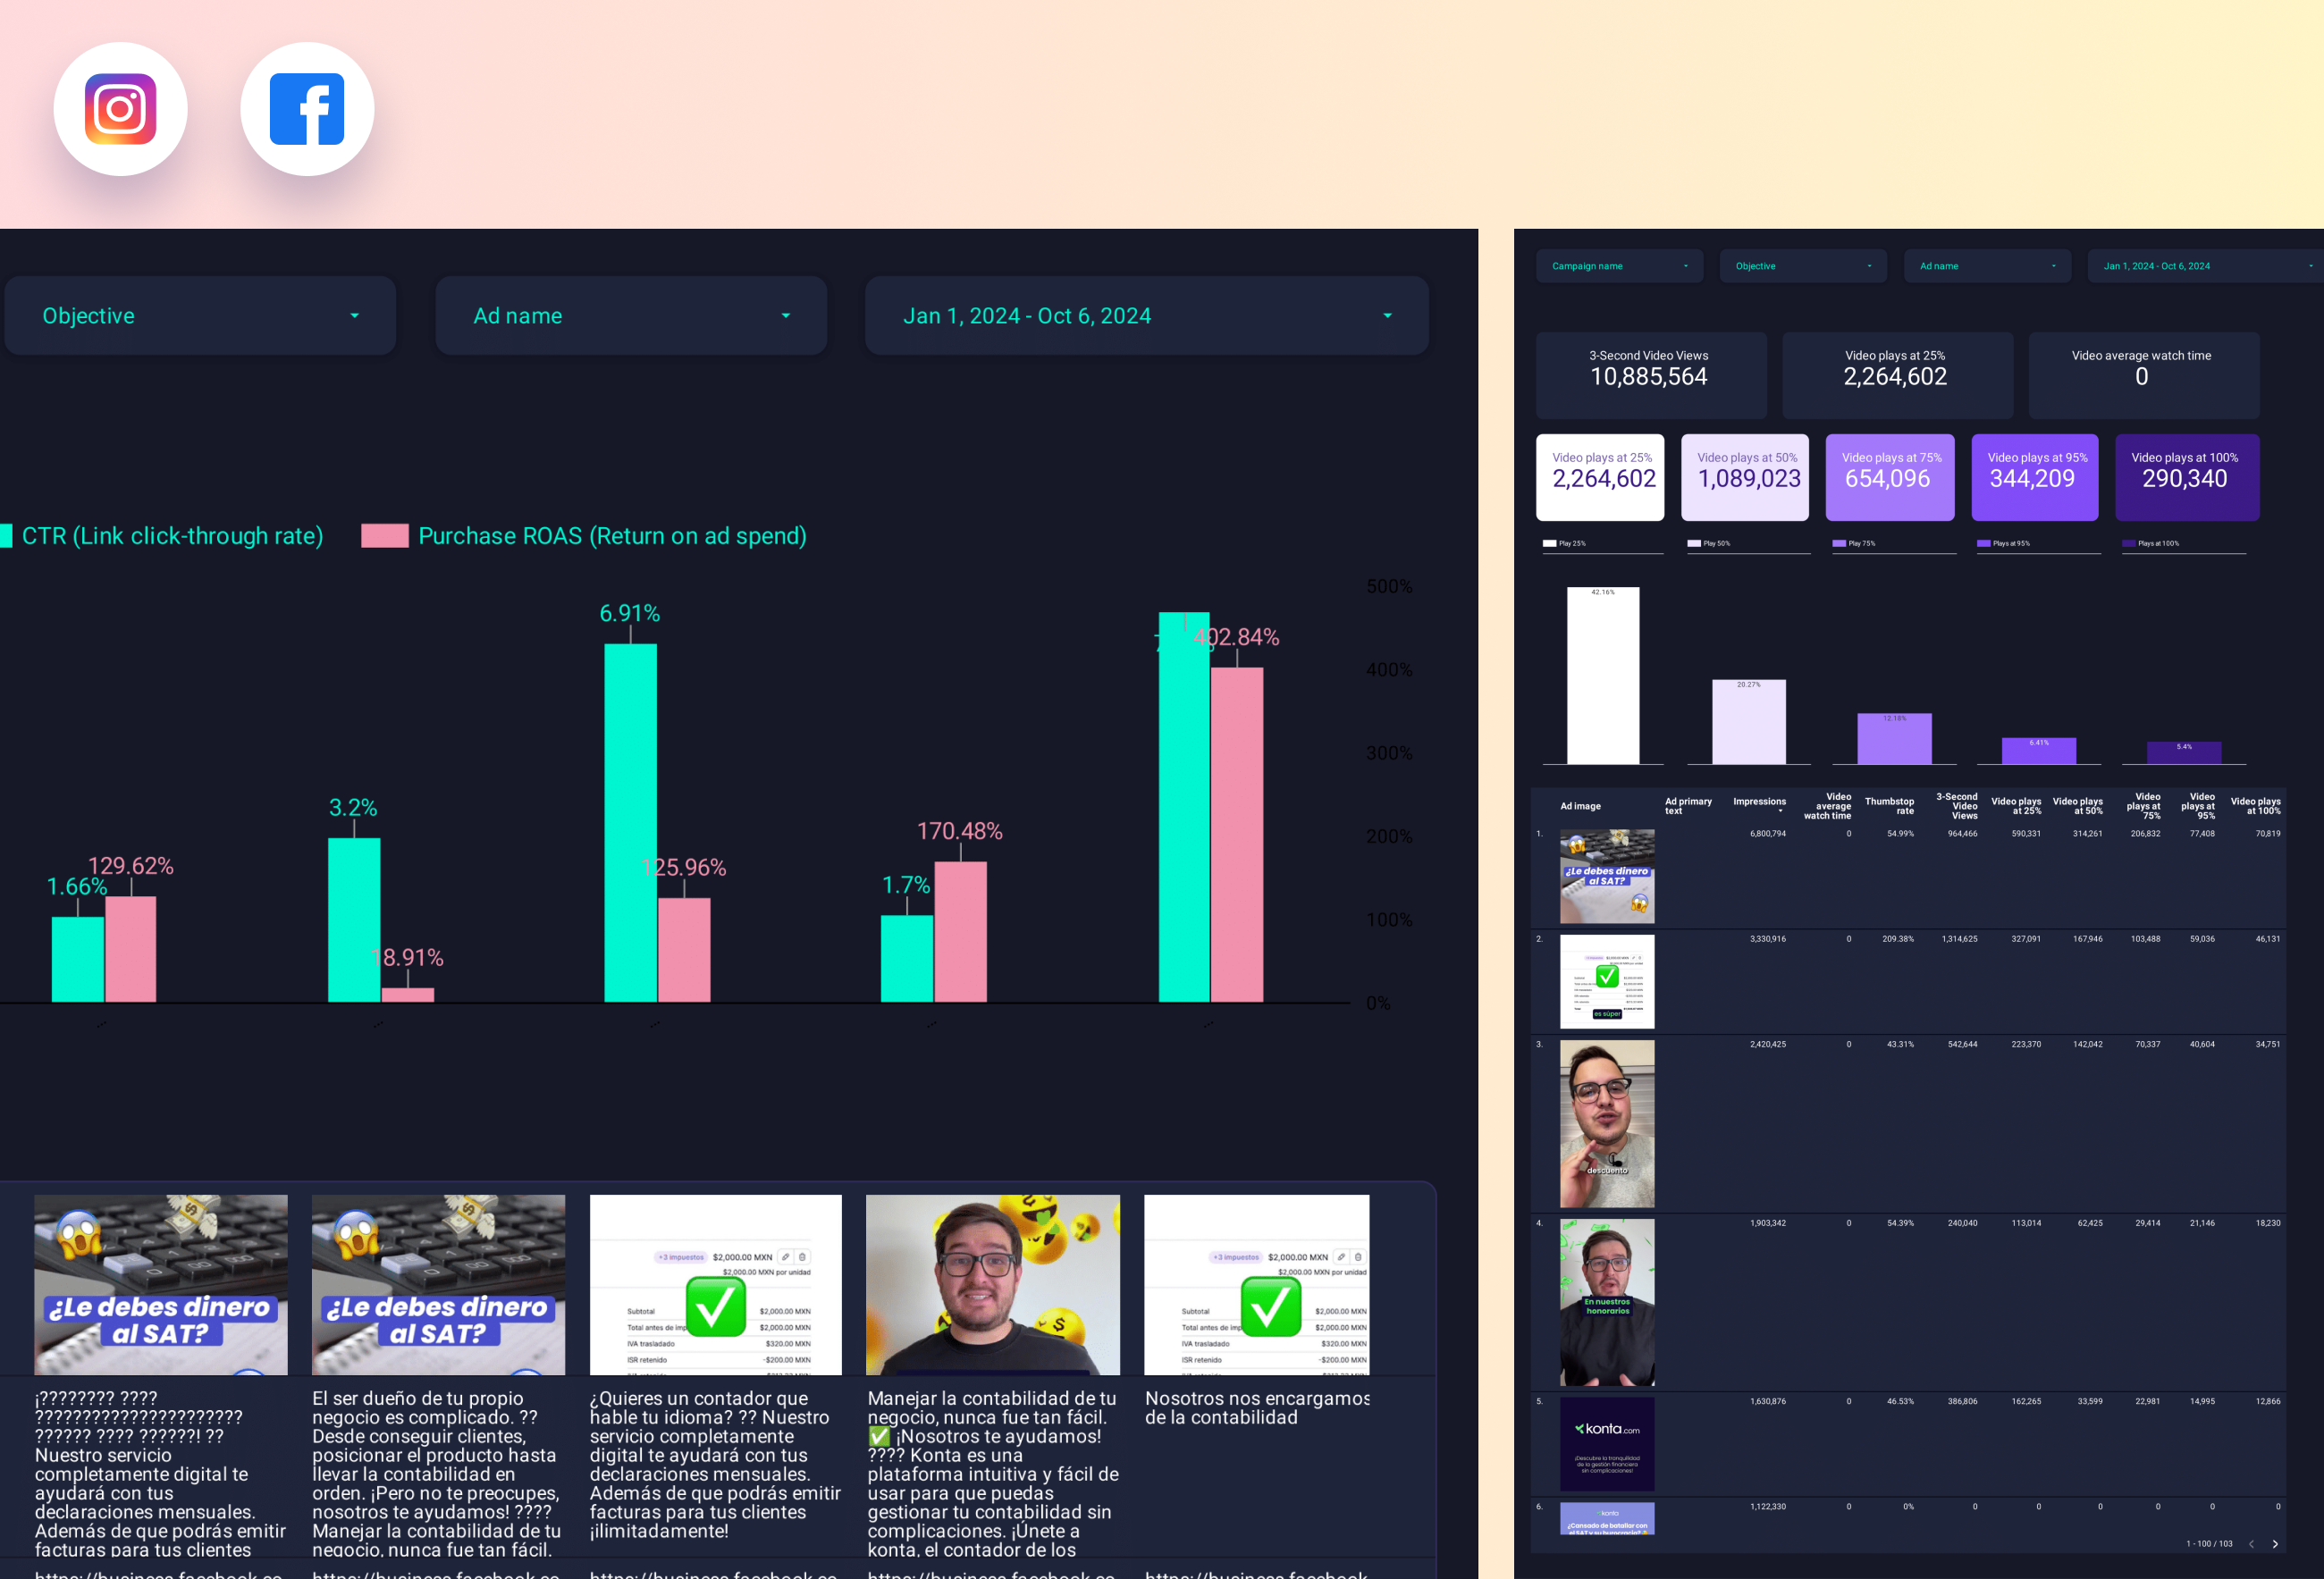
To build a Facebook Ads creative analysis dashboard, 1) connect your Facebook Ads account and any other relevant data sources. 2) Select metrics such as click-through rate, conversion rate, and cost per action to monitor performance. 3) Segment your data by campaign, channel, audience, ad creative, objective, and date to gain a comprehensive understanding. 4) Add filters or buttons for metrics like ad spend or impressions to make your report interactive. 5) Share your dashboard via PDF, scheduled emails, or links for easy access and review.
A Facebook Ads creative analysis dashboard is a visual representation of key metrics and data related to your Facebook ad campaigns. It is significant for businesses as it helps in tracking performance, identifying trends, and making data-driven decisions. Tools like Looker Studio are commonly used to create such dashboards, which typically include elements like ad spend, impressions, click-through rates, and conversion rates. Real-time data monitoring is crucial for timely adjustments and optimization. For learning how to create a marketing dashboard using Looker Studio, visit our YouTube channel: https://www.youtube.com/@porter.metrics.
Can I download this template in PDF?


 Impressions
 Ad Spend