A DTC report should include visibility metrics such as impressions, reach, and click-through rates, engagement metrics like likes, comments, shares, and time spent per session, and conversion metrics including conversion rate, cost per conversion, and return on ad spend. The report should segment data by campaign (e.g., Black Friday sale), channel (e.g., social media platforms), audience (e.g., age groups), content (e.g., video ads), objective (e.g., lead generation), and date (e.g., monthly performance). For example, the report may highlight that the Black Friday campaign on Instagram had a higher impression rate and conversion rate compared to the campaign on Facebook.
To analyze DTC (Direct-to-Consumer) data, we need to include the following elements in the report:
1) Metrics breakdown:
– Visibility metrics: Impressions, reach, website traffic.
– Engagement metrics: Click-through rate (CTR), social media likes, shares, comments.
– Conversion metrics: Conversion rate, sales revenue, average order value.
2) Contextual comparison:
– Compare performance metrics vs cost: ROI, cost per conversion.
– Compare data within a specific date range and against previous periods to track trends.
– Compare performance metrics against campaign goals and set benchmarks for improvement.
3) Data segmentation:
– Segment data by campaign: Analyze performance of different marketing campaigns separately.
– Segment data by channel: Analyze the effectiveness of different marketing channels like social media, email, or SEO.
– Segment data by audience: Analyze the performance for different target segments or demographics.
– Segment data by content: Analyze performance based on the type of content used in campaigns (e.g., videos, blogs).
– Segment data by objective: Analyze performance based on the specific objectives of each campaign (e.g., brand awareness, lead generation).
– Segment data by date: Analyze performance trends and identify any seasonality patterns.
For example, the report can showcase the CTR for a social media campaign targeting a specific audience segment. It can compare the cost per conversion of different marketing channels to identify which one is most cost-effective. Additionally, it can analyze the conversion rates and revenue generated from different campaigns to assess their overall effectiveness.
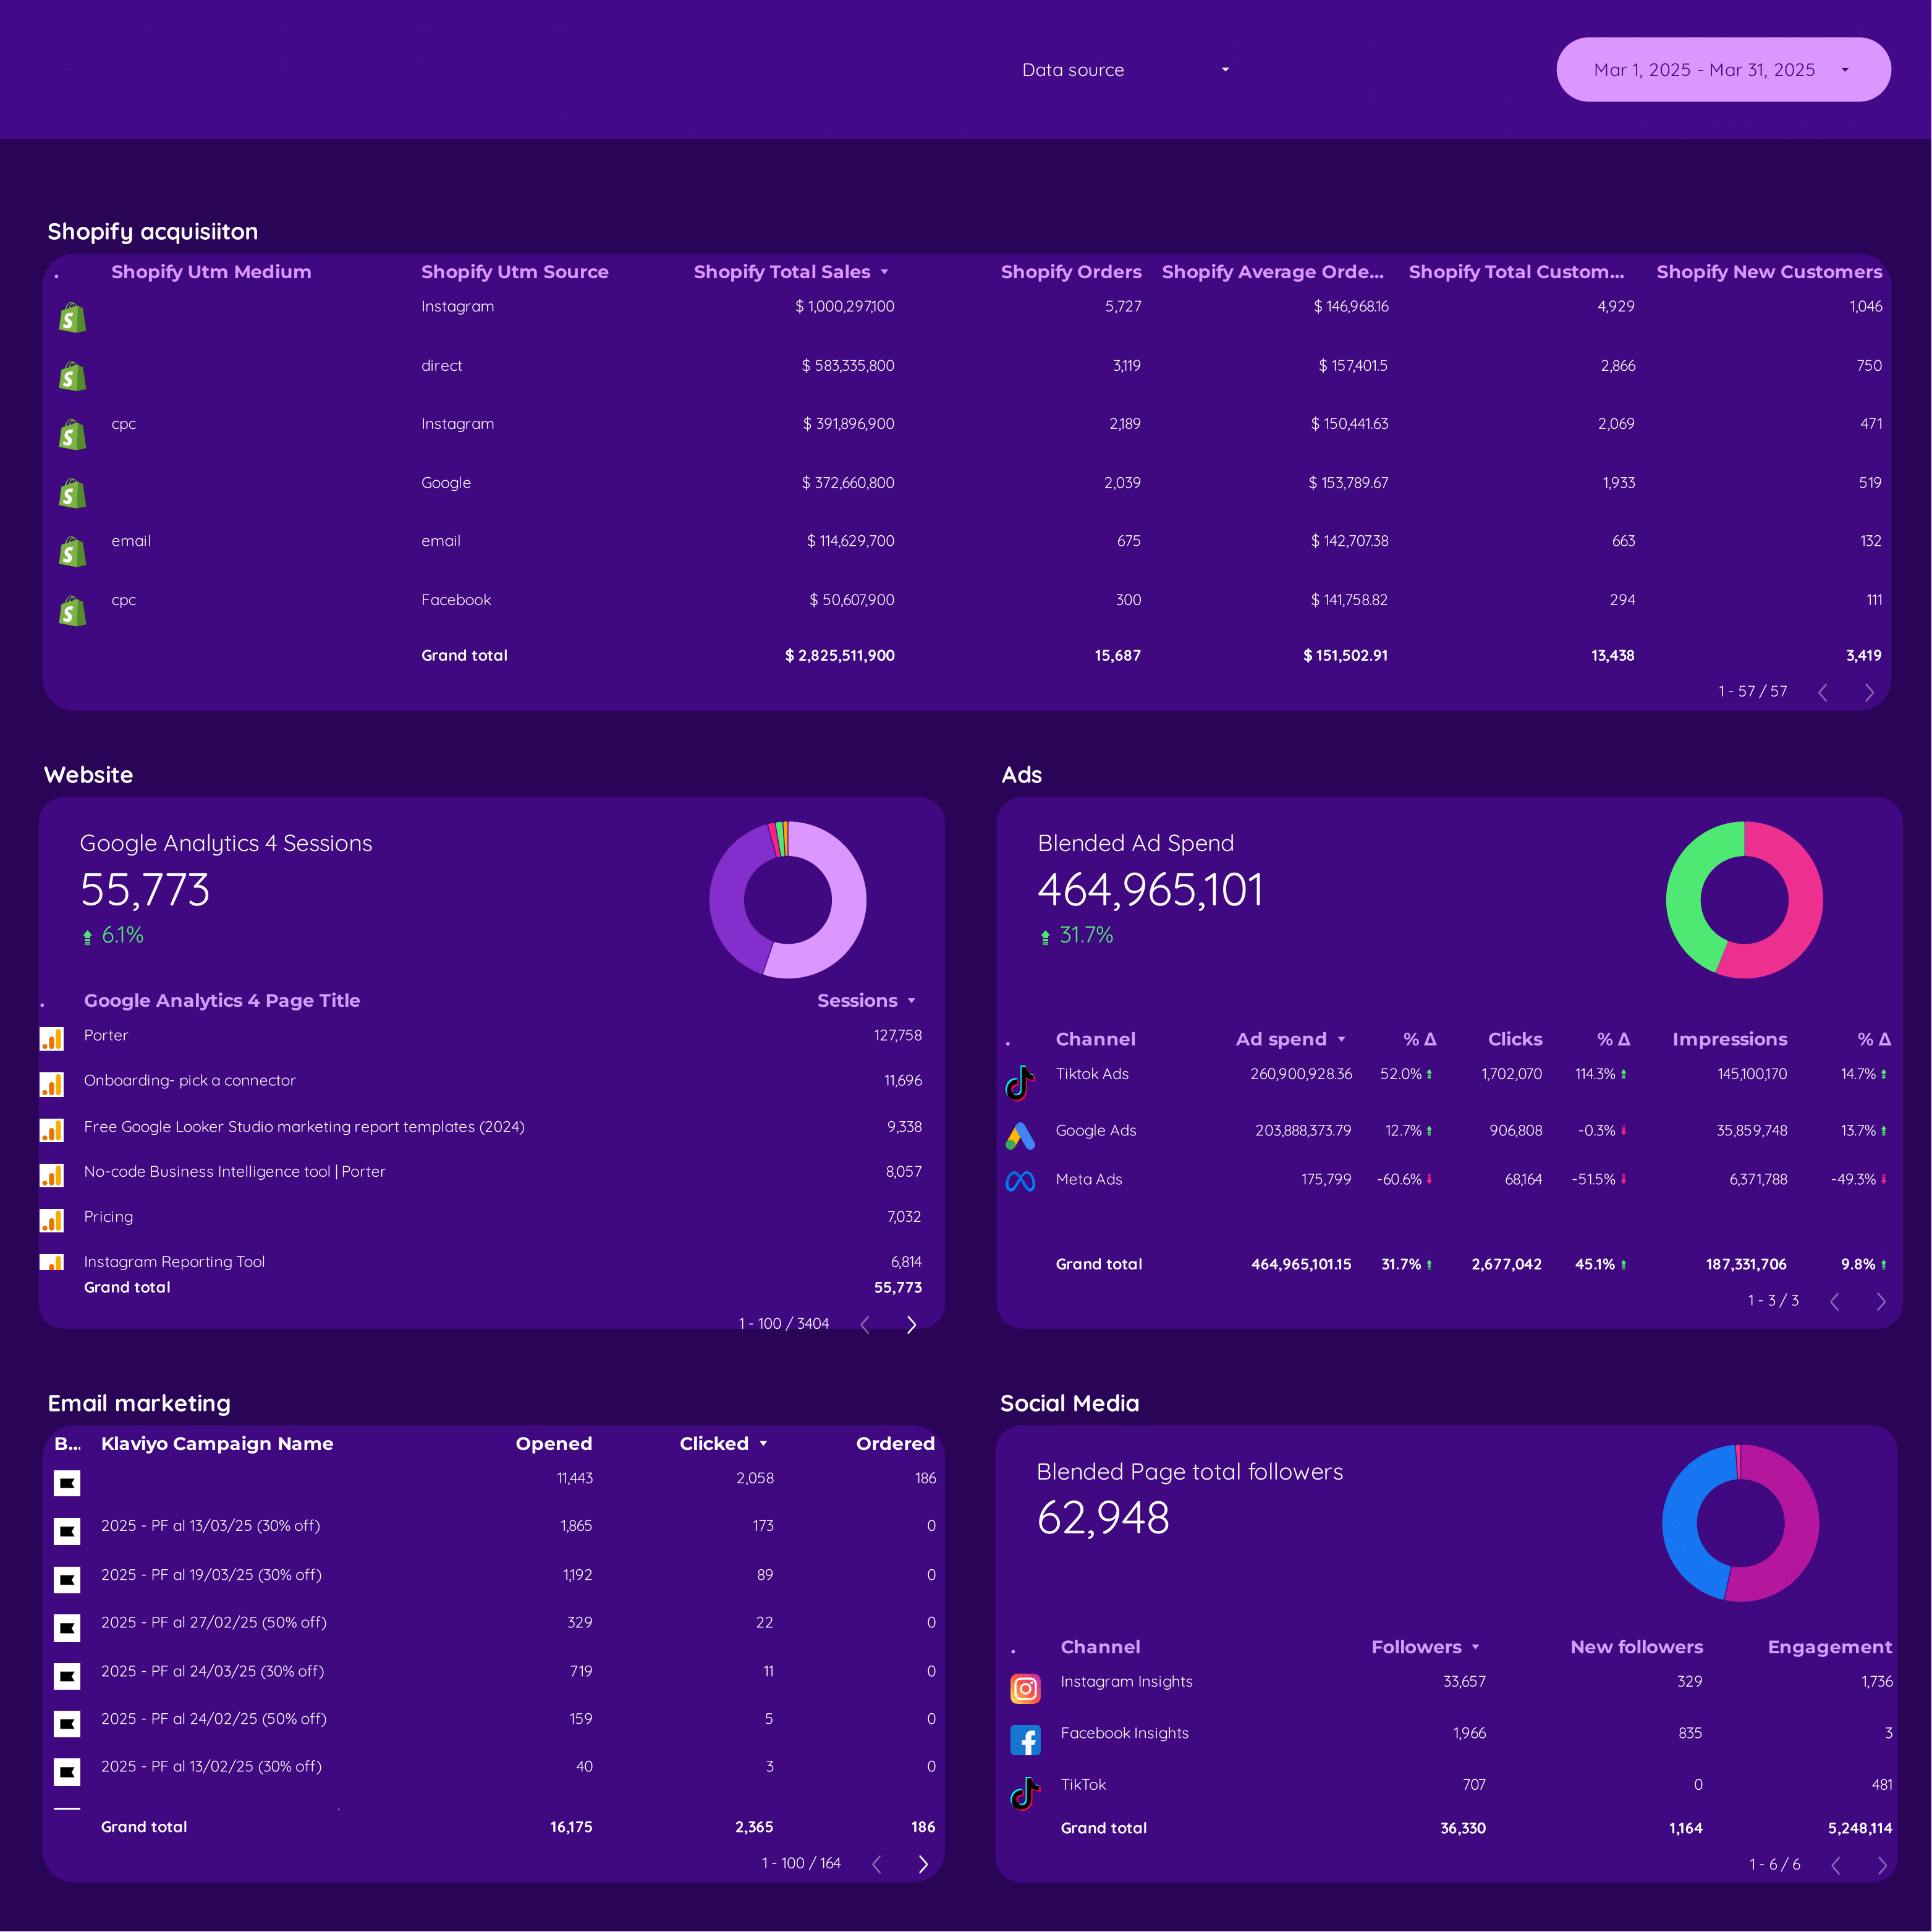
To build a DTC dashboard, 1) connect your data and accounts from various sources like Google Analytics, Facebook Ads, or Shopify. 2) Select the metrics to monitor performance such as sales, conversion rates, or customer acquisition costs. 3) Segment or break down data by campaign, channel, audience, product, customer content, objective, date. For example, you can segment data by a specific marketing campaign or a particular product. 4) Add filters or buttons to make your report interactive, allowing users to view specific data sets. 5) Share your dashboard via PDF, scheduled emails, or links to relevant stakeholders.
A DTC (Direct-to-Consumer) dashboard is a tool used by e-commerce businesses to track and analyze key performance metrics related to their online sales and marketing efforts. It integrates data from various platforms such as Google Analytics 4, Shopify, Google Ads, Facebook Ads, and TikTok Ads. The dashboard typically includes metrics like impressions, clicks, ad spend, conversion rate, bounce rate, sessions, transactions, revenue, product views, and more. It helps businesses monitor their digital marketing campaigns, optimize their strategies, and improve overall performance.
Can I download this template in PDF?


 Impressions
 Conversion Rate
 Transactions
 Cost Per Click
 Video Views
 CTR
CTR