An Attribution report should include metrics such as visibility (impressions, reach), engagement (clicks, likes, shares), and conversion metrics (sales, sign-ups). Data should be segmented by campaign (e.g., Black Friday Sale), channel (e.g., Facebook ads), audience (e.g., age group), content (e.g., blog post), objective (e.g., brand awareness), and date. For example, the report may show that a Black Friday Sale campaign on Facebook ads generated 10,000 impressions, received 500 clicks, and resulted in 50 sales on November 27th.
To analyze attribution data, it is important to include the following elements in an attribution report:
1) Metrics breakdown: Break down visibility metrics such as impressions and reach, engagement metrics like clicks and interactions, and conversion metrics including conversion rate and cost per conversion.
2) Contextual comparison: Compare these metrics against the cost incurred, date range of the campaign, set goals, industry benchmarks, and rates achieved. For example, compare the conversion rate achieved in a specific campaign against the industry average.
3) Segment data: Segment the data by campaign to analyze the performance of different campaigns individually, by channel to assess the effectiveness of each channel, by audience to understand which audience segment generated the most conversions, by content to identify the top-performing content pieces, by objective to evaluate the success of various campaign objectives, and by date to identify any trends or patterns over time. For instance, segmenting the data by channel can show the conversion rate of email marketing versus social media marketing.
To build an Attribution dashboard, 1) connect your data and accounts such as Google Analytics, Facebook Ads, or CRM systems. 2) Select metrics like click-through rates, conversion rates, or return on ad spend to monitor performance. 3) Segment data by campaign, channel, audience, product, customer content, objective, or date for a detailed analysis. 4) Add filters or buttons like date range or campaign type to make your report interactive. 5) Share your dashboard via PDF, scheduled emails, or links for easy access and review.
An Attribution dashboard is a visual representation of marketing data that tracks the effectiveness of different marketing strategies in driving customer behavior. It is significant for businesses as it helps them understand which marketing channels are most effective, enabling informed decision-making and resource allocation. Common tools used to create an Attribution dashboard include Looker Studio, Tableau, and Power BI, with key elements including channel performance, customer journey, conversion rates, and ROI. Real-time data monitoring is crucial as it allows businesses to respond quickly to changes in marketing performance. For learning how to create a marketing dashboard using Looker Studio, visit our YouTube channel: https://www.youtube.com/@porter.metrics.


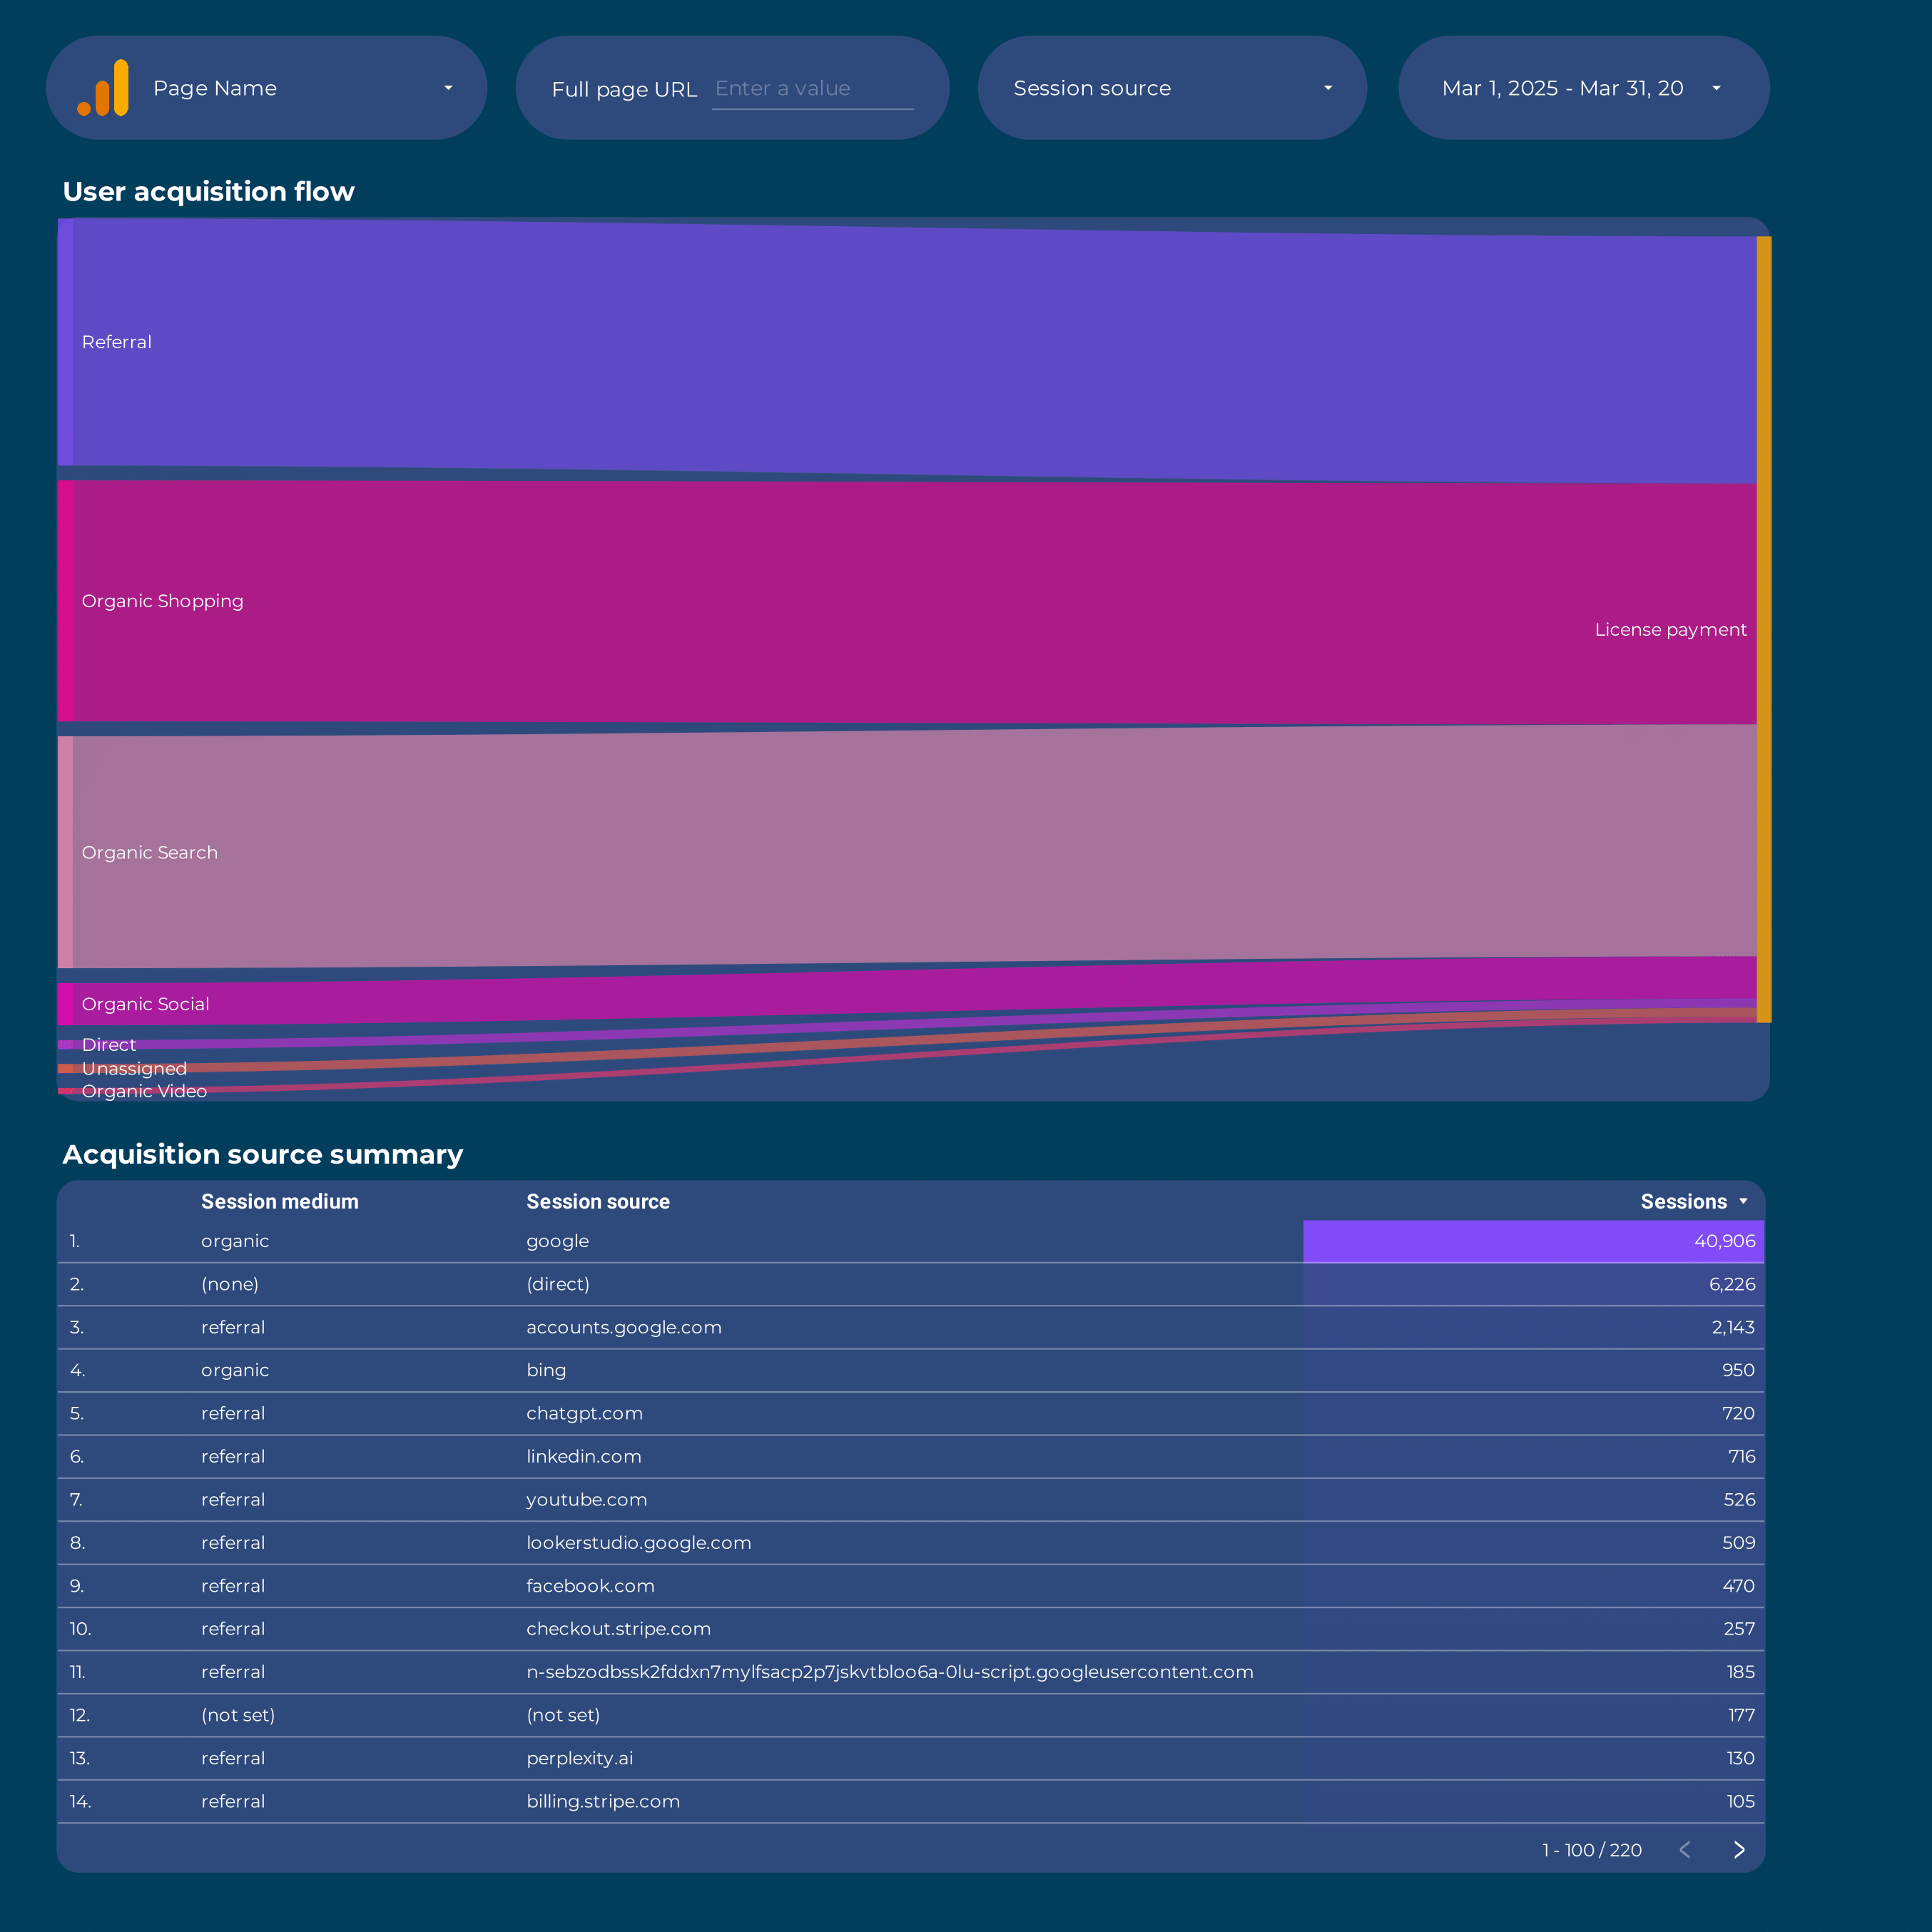
 Google Analytics 4
 Ad Spend