

Best Free Influencer Marketing Report Templates for Data Studio (2026)
Free influencer marketing report templates for Data Studio. Mide influencer campaigns, engagement, reach, and ROI across social platforms.
Conecta tus datos gratis →Última actualización: Abril 2026
Browse 28 Influencer Marketing Report Templates for Data Studio
Choose from our library of free, white-label influencer marketing templates. Cada plantilla mide el embudo completo: visibilidad (impresiones, alcance), engagement (CTR, interacciones) y conversión (leads, ingresos). Organizadas siguiendo el SUMAS framework con segmentación por canal, campaña, audiencia y período.
Instagram Insights Followers tracking Report template for Data Studio by Porter
Mide follower growth rate → engagement rate per follower → follower-to-visitor ratio. Segmenta por date, growth source.
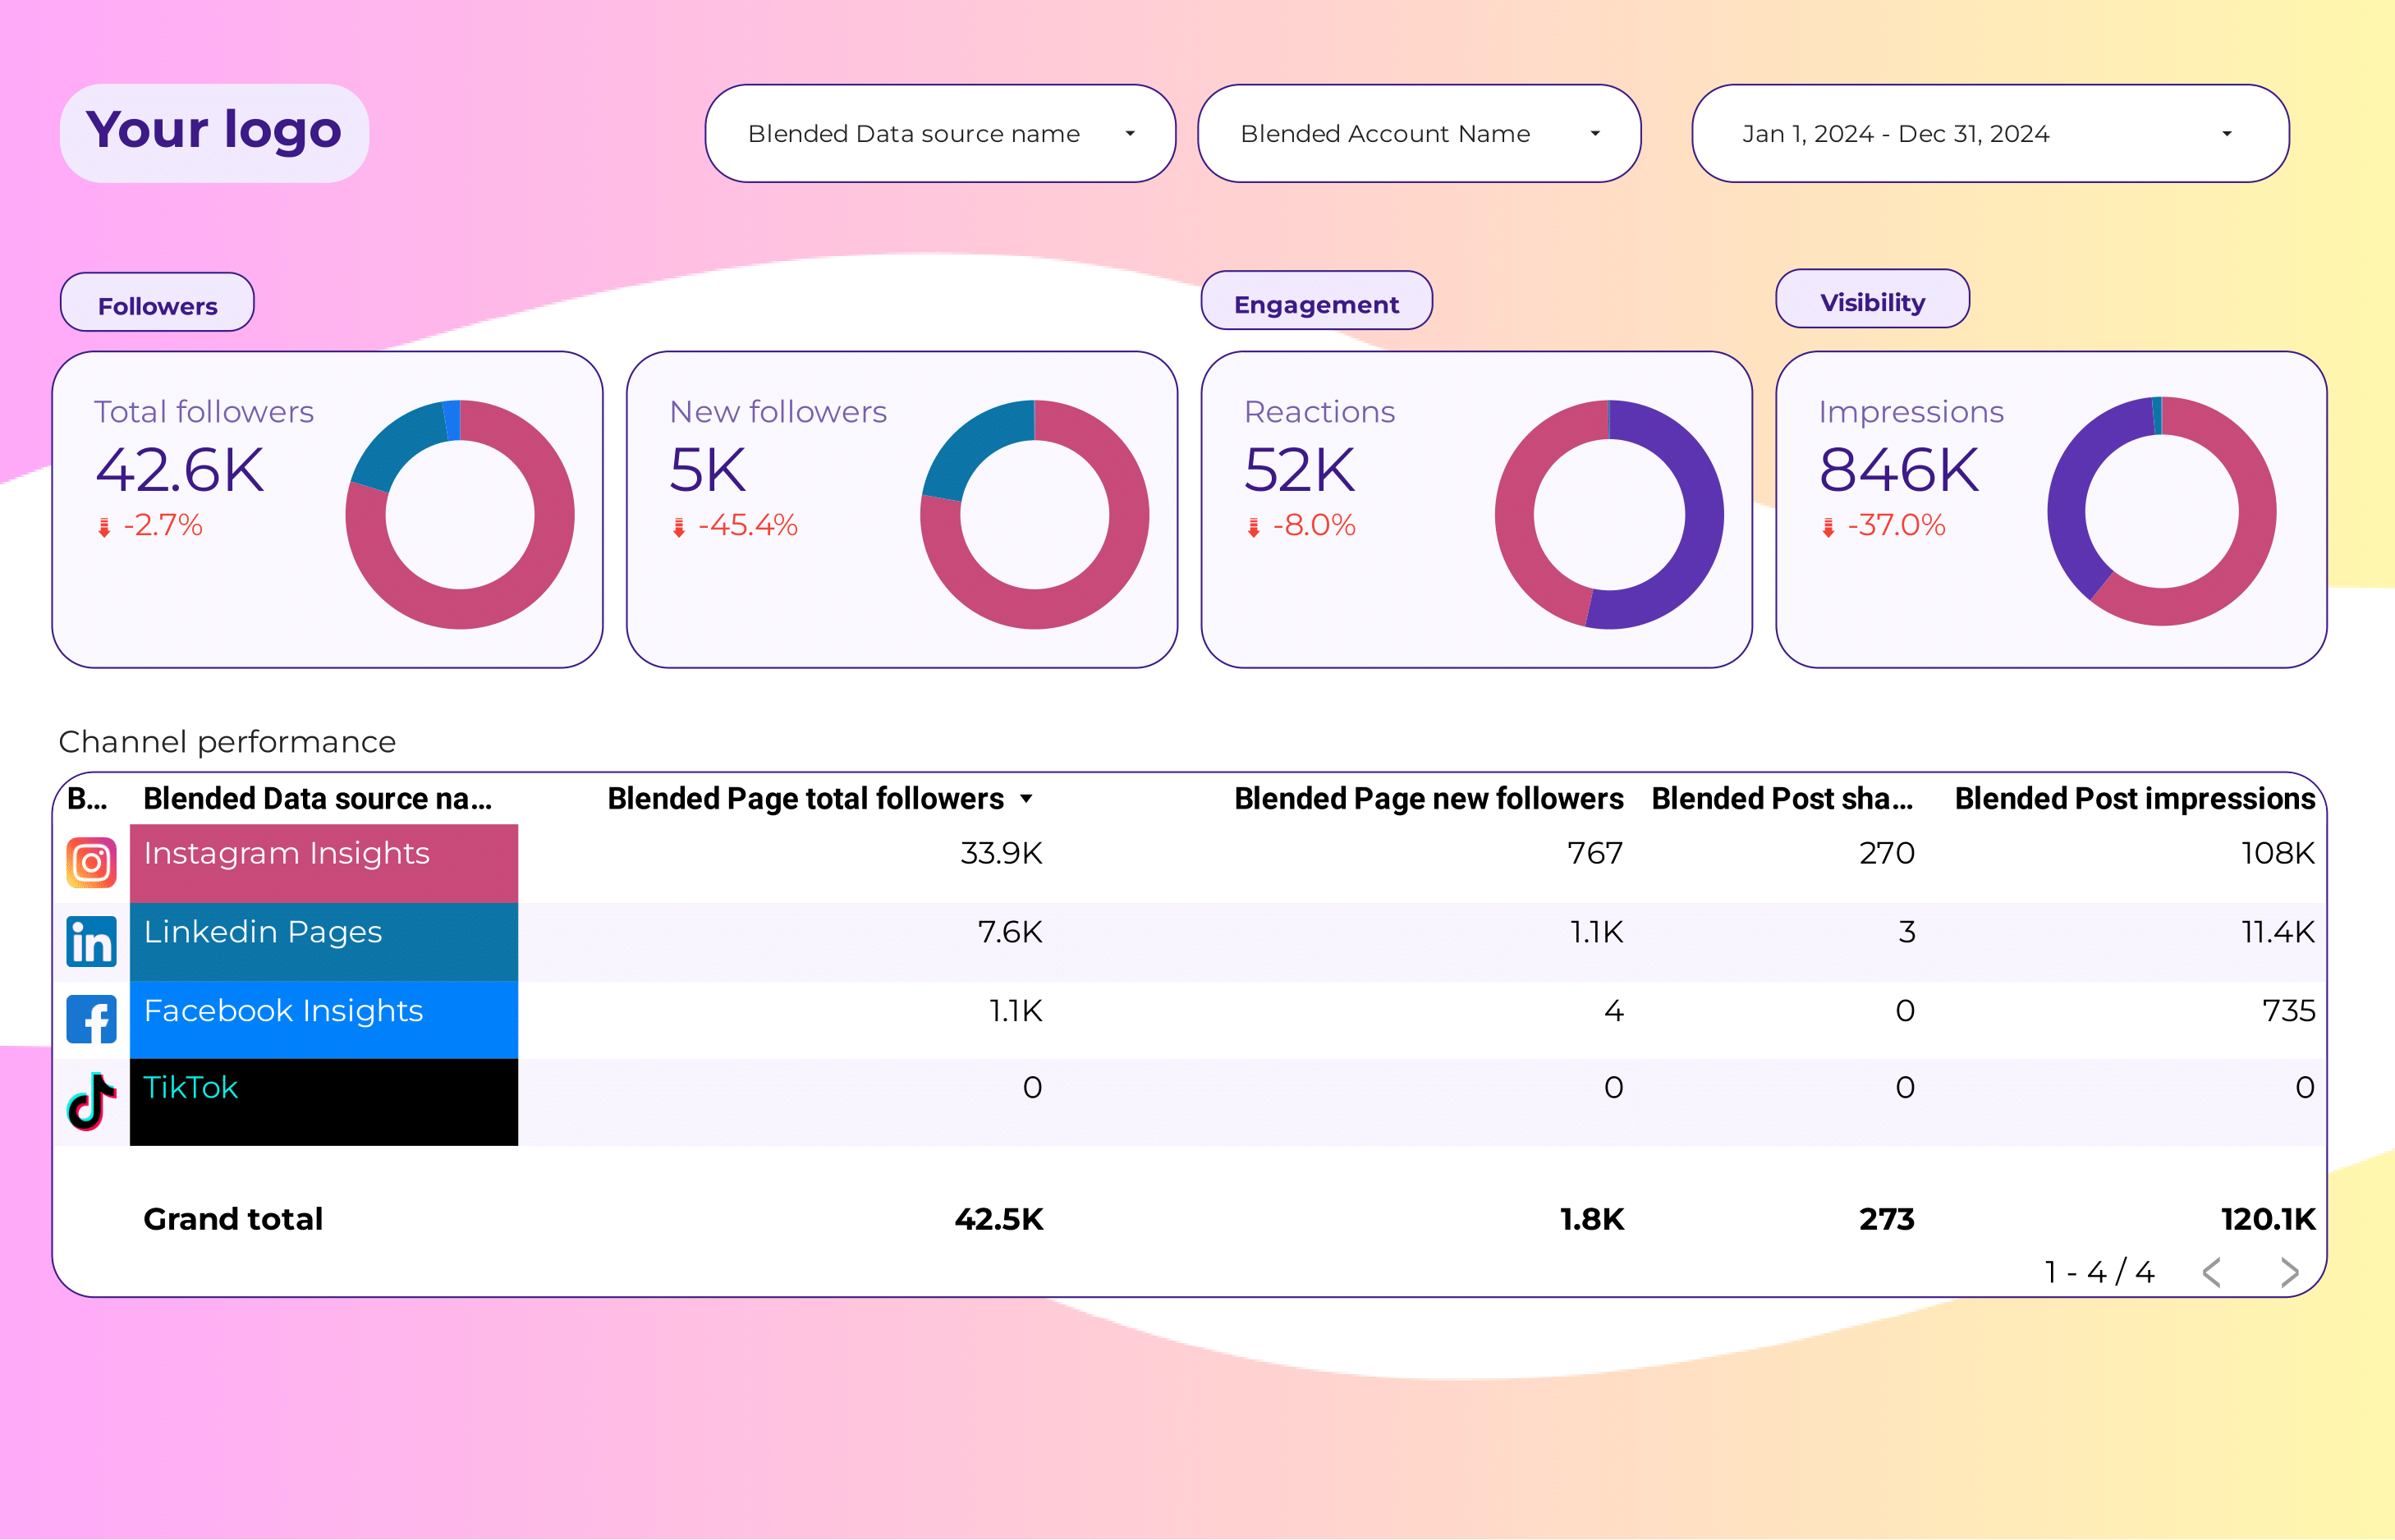
Social Media Followers tracking Report template for Data Studio by Porter
Mide follower growth across platforms → engagement rate per follower → follower-to-customer ratio. Segmenta por platform, date.
Social Media Engagement Report template for Data Studio by Porter
Mide total reach, impressions → likes, comments, shares, saves → engagement-to-click rate. Segmenta por post type, platform, day.
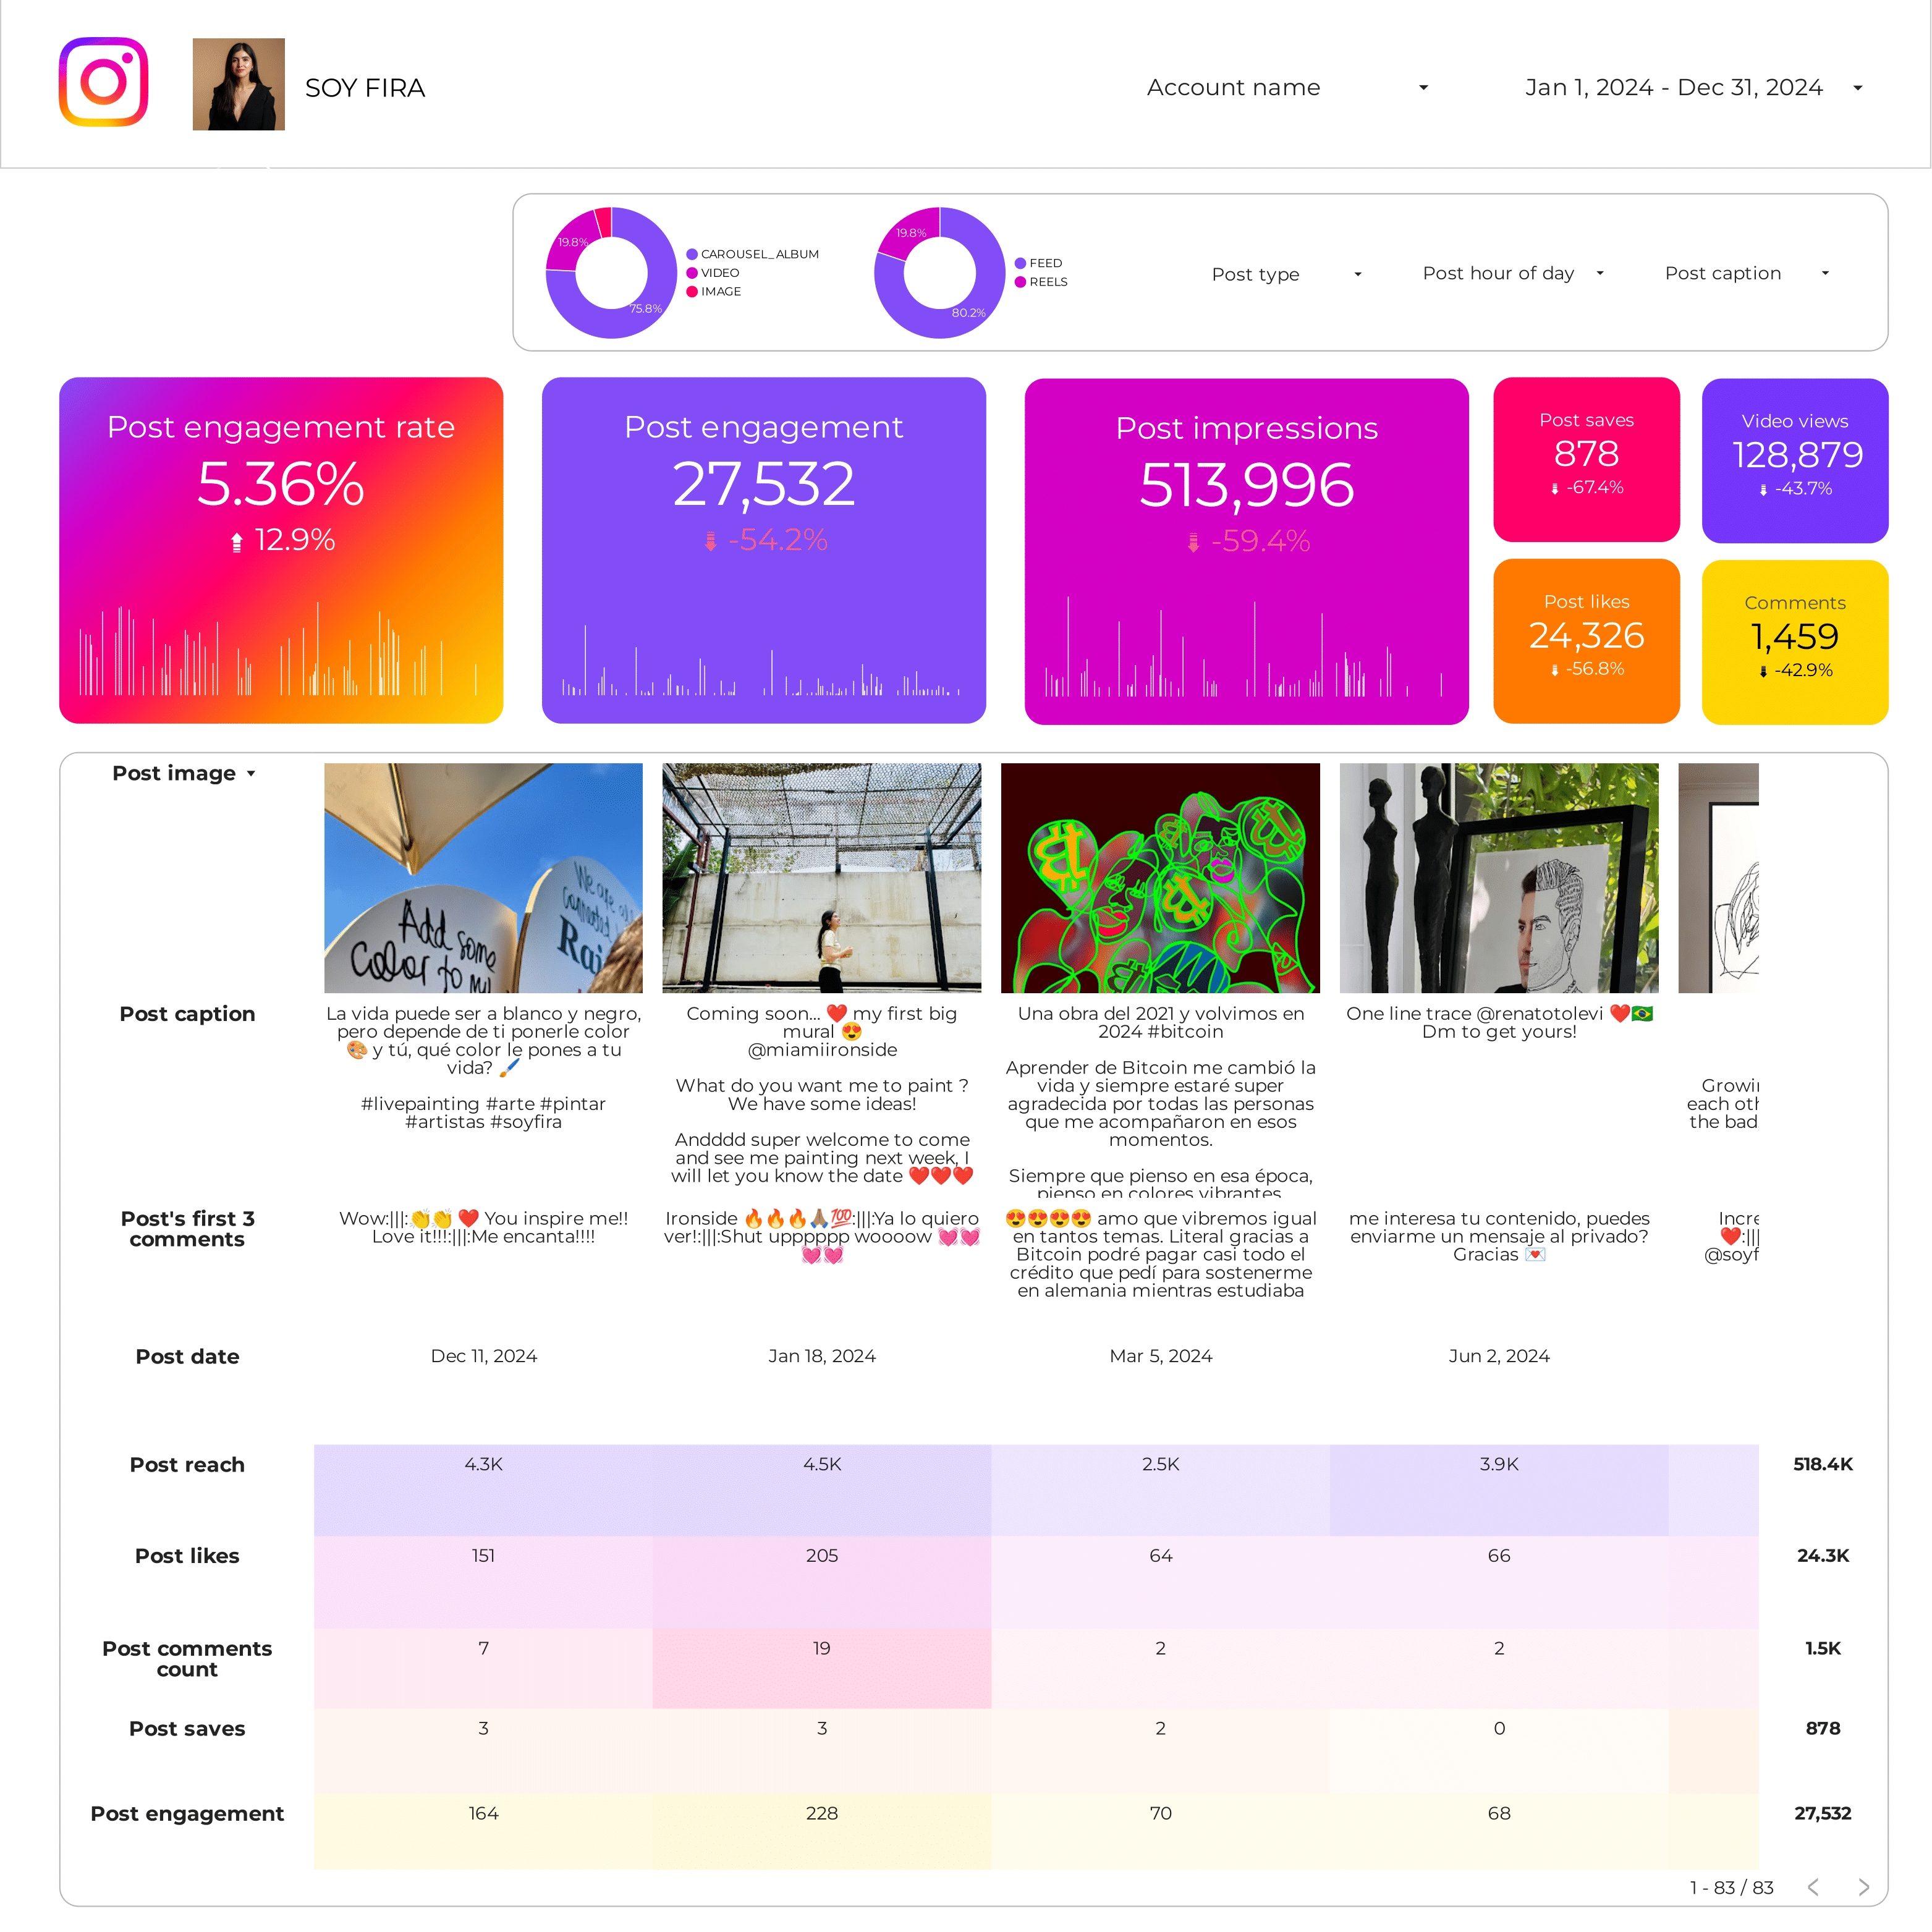
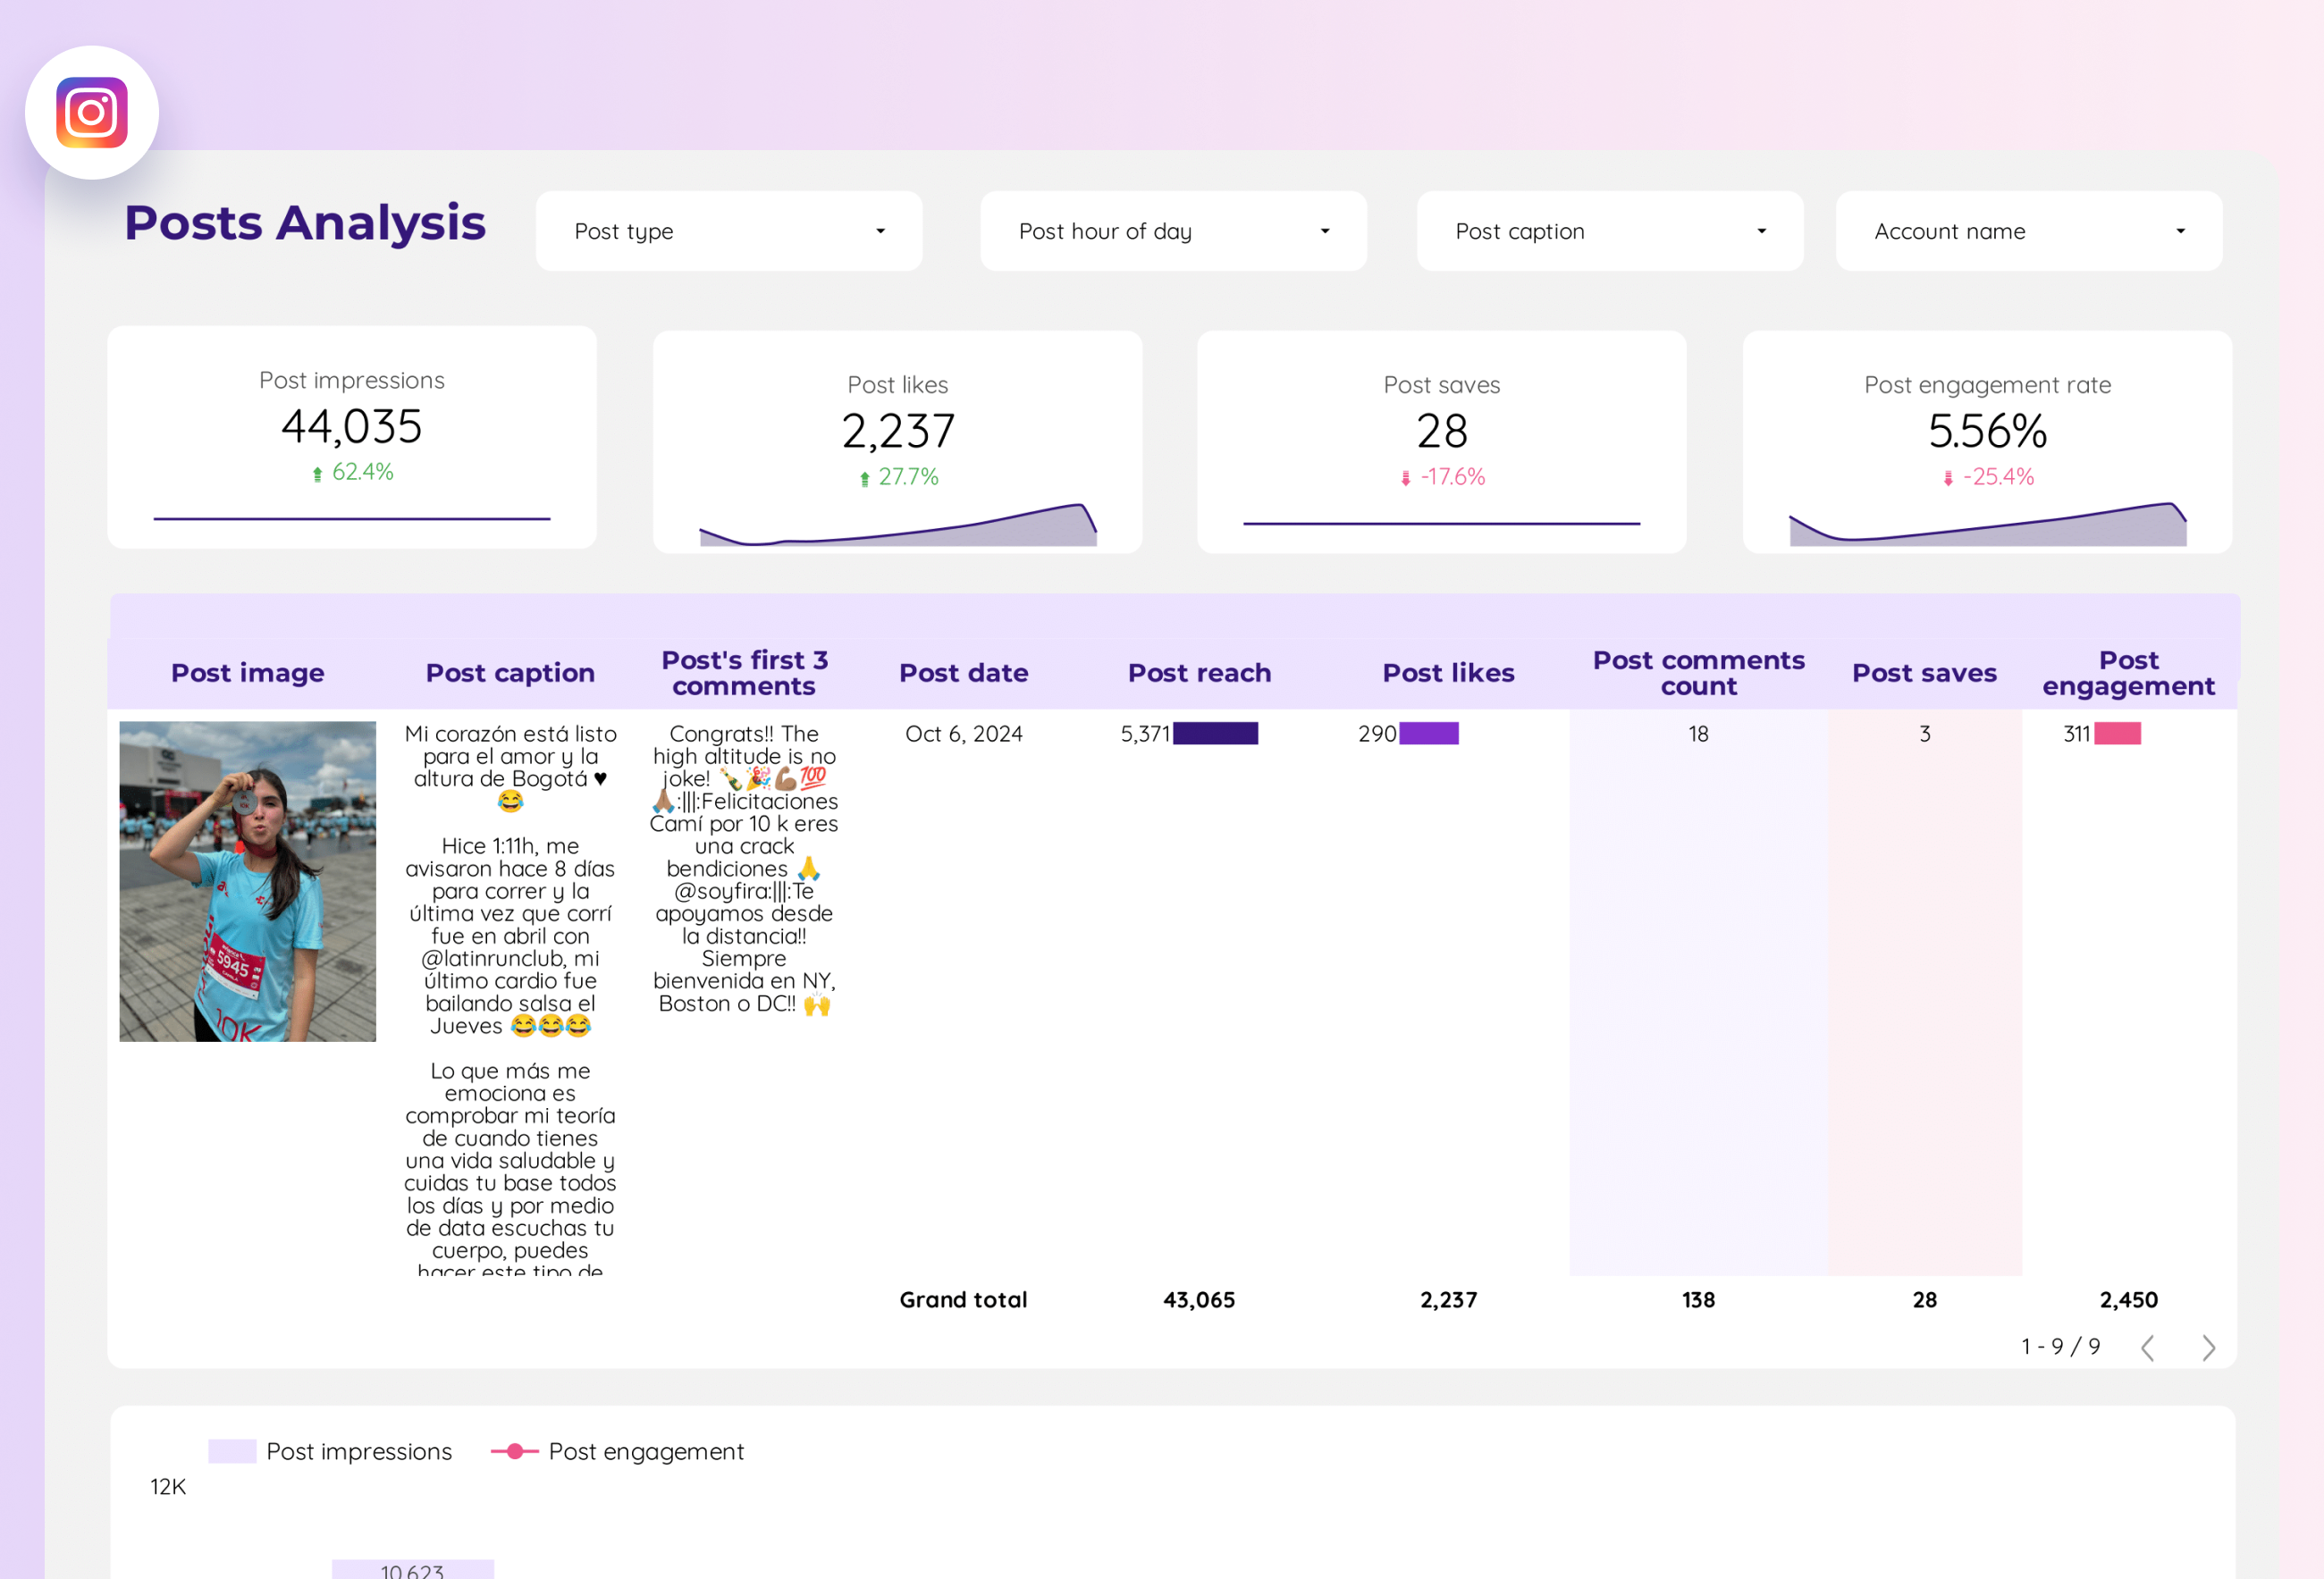
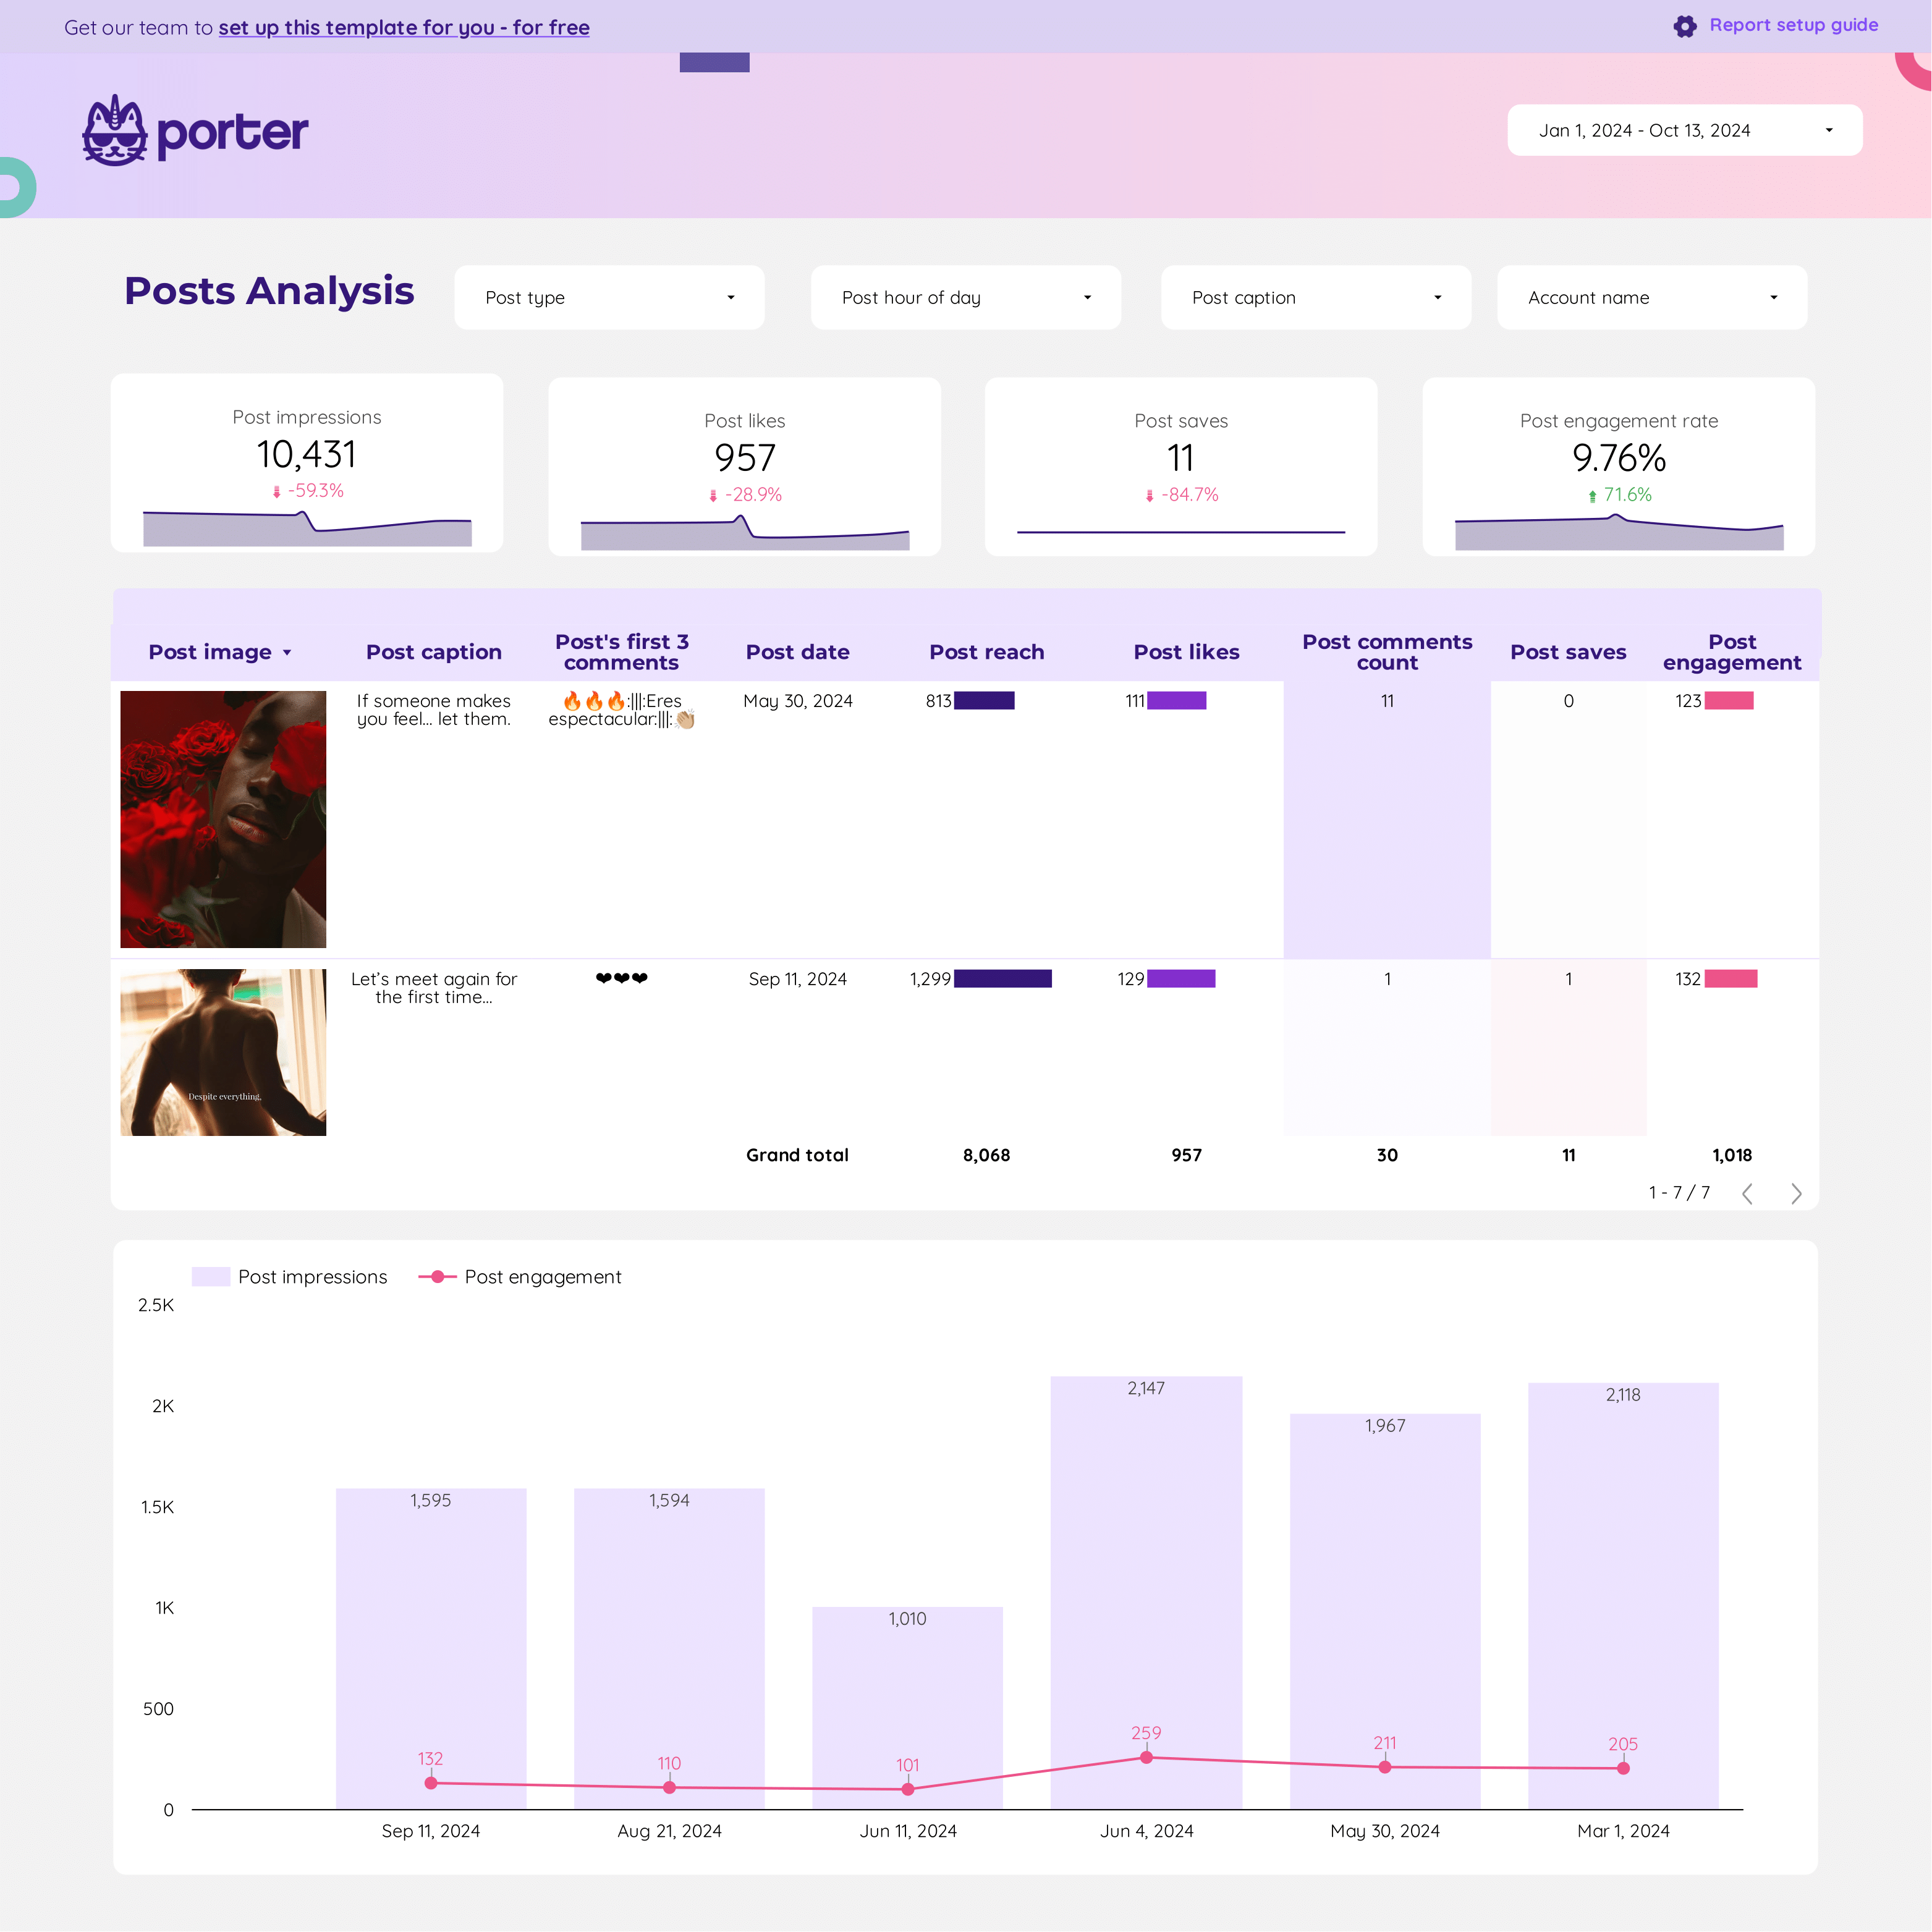
Instagram Insights Post performance Report template for Data Studio by Porter
Mide post reach, impressions → likes, comments, saves per post → CTR to profile, website taps. Segmenta por post format, topic, time.

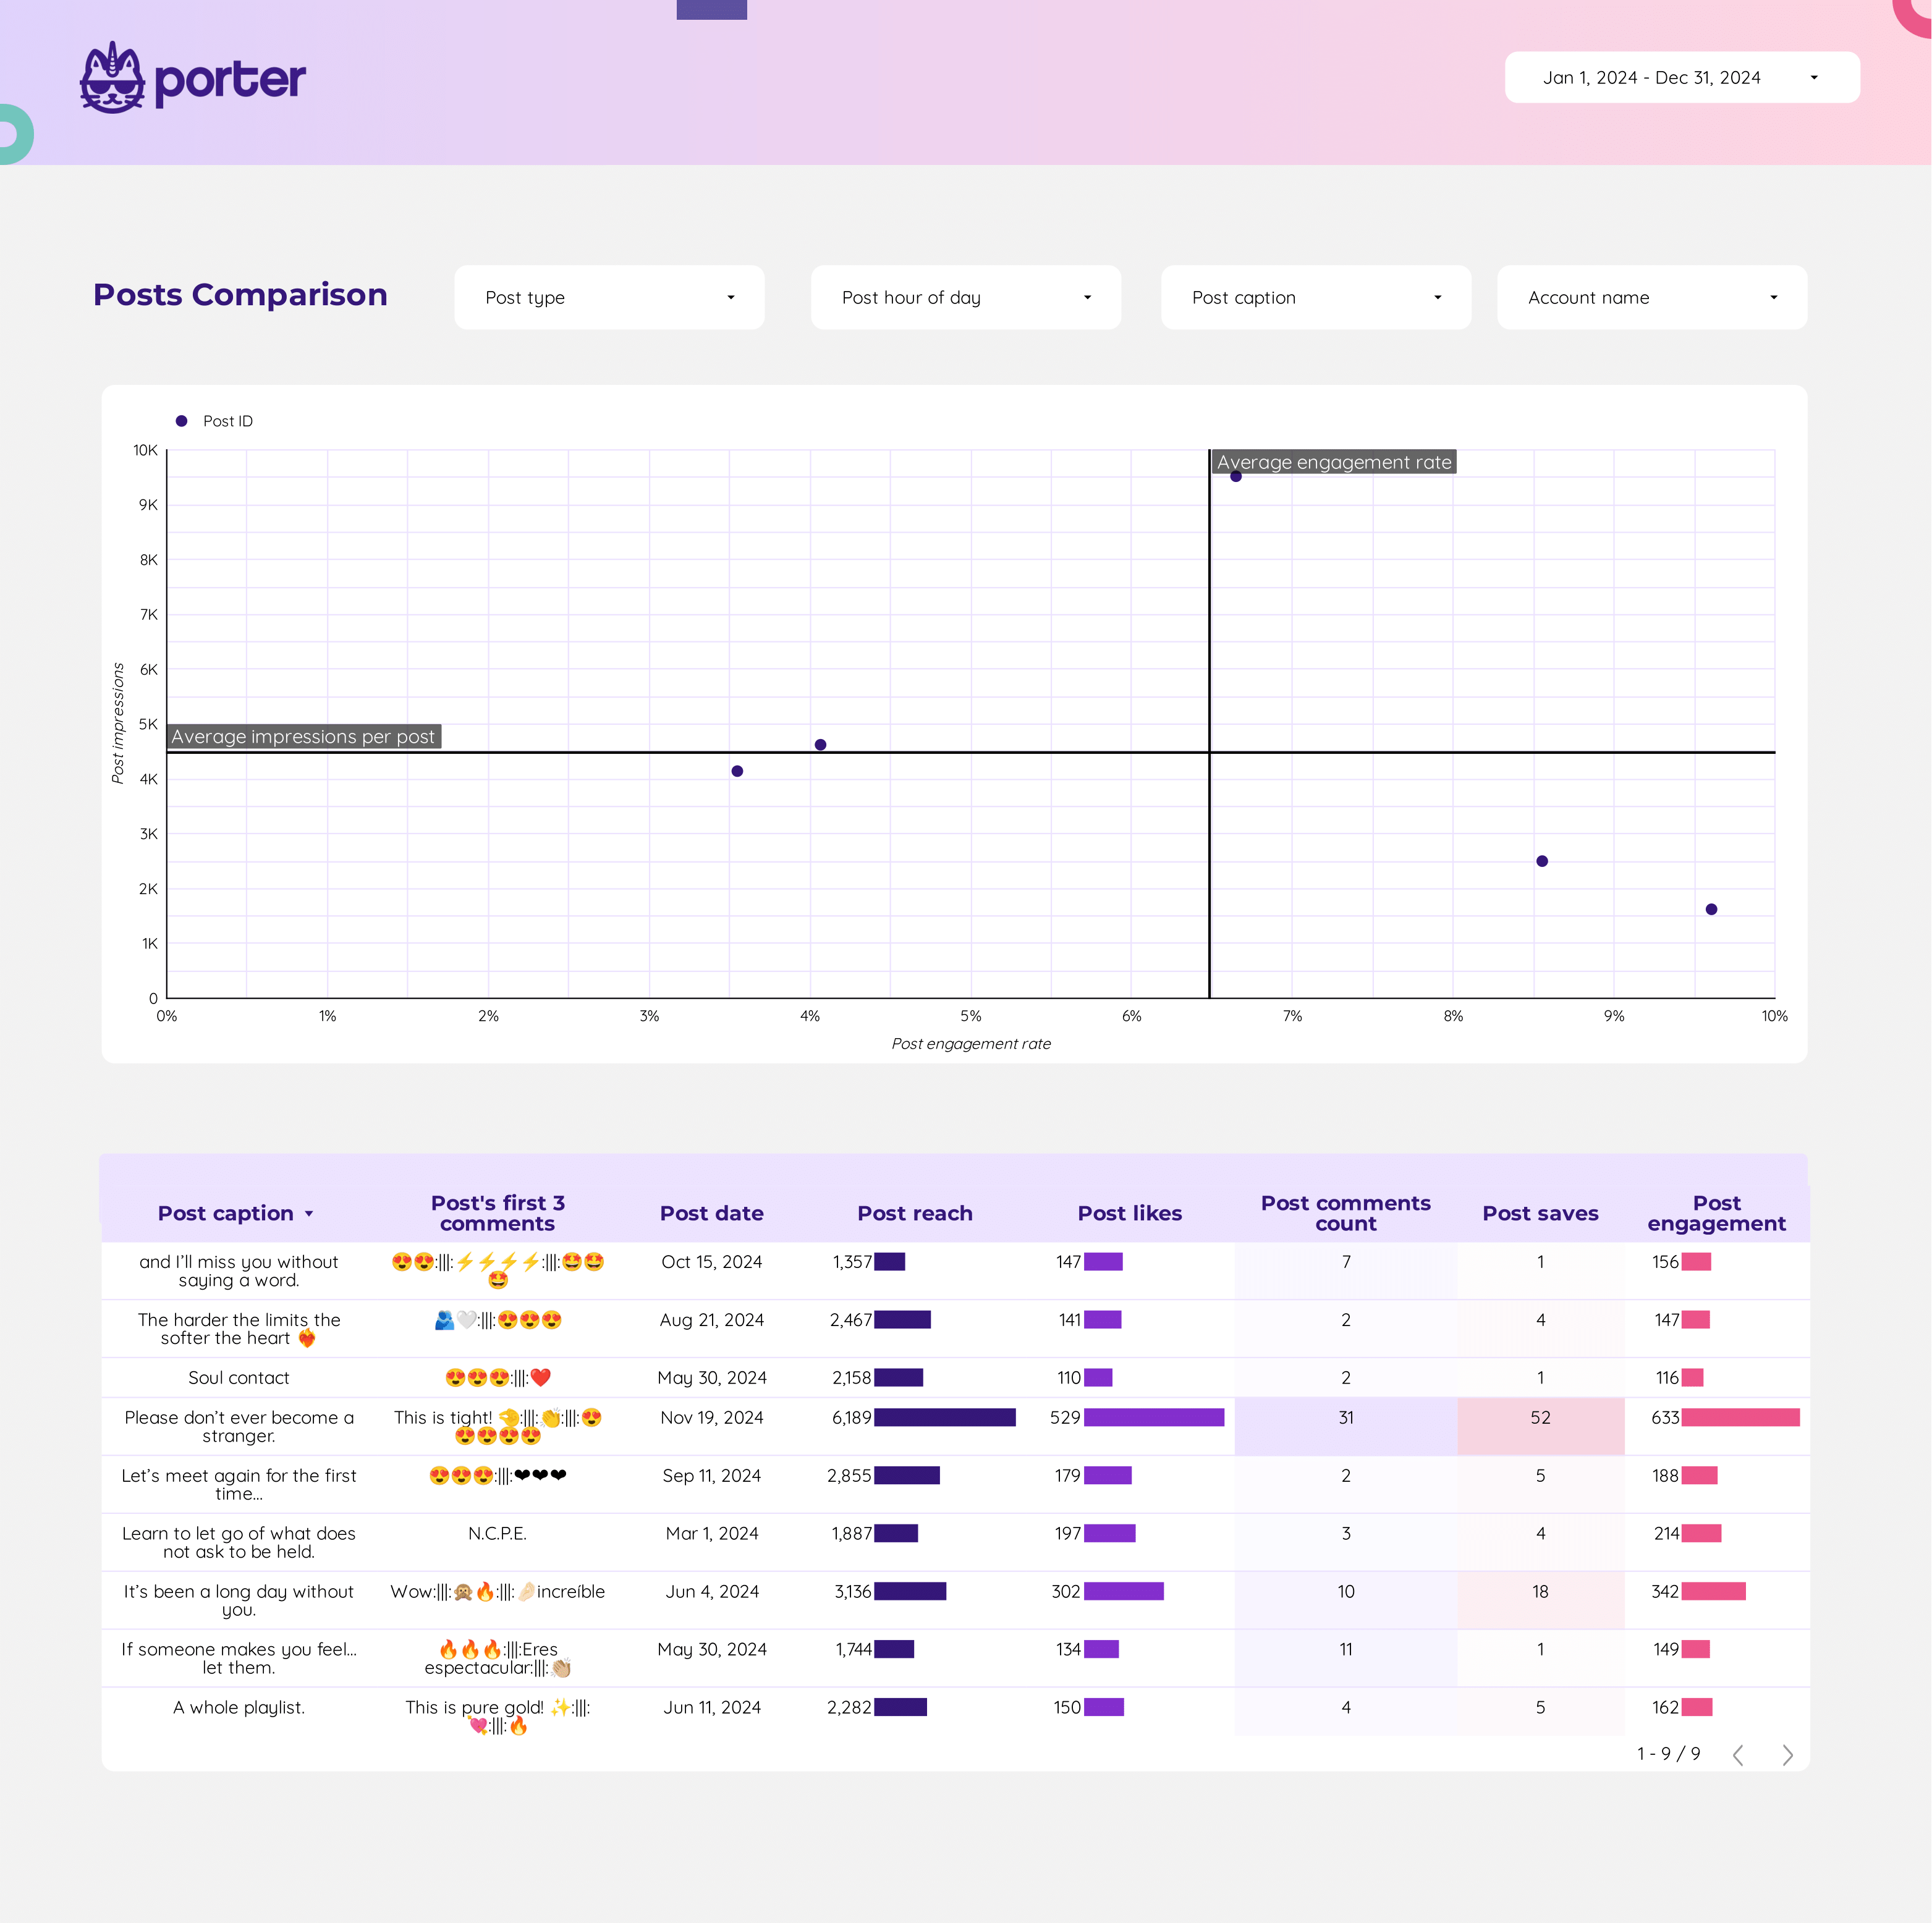
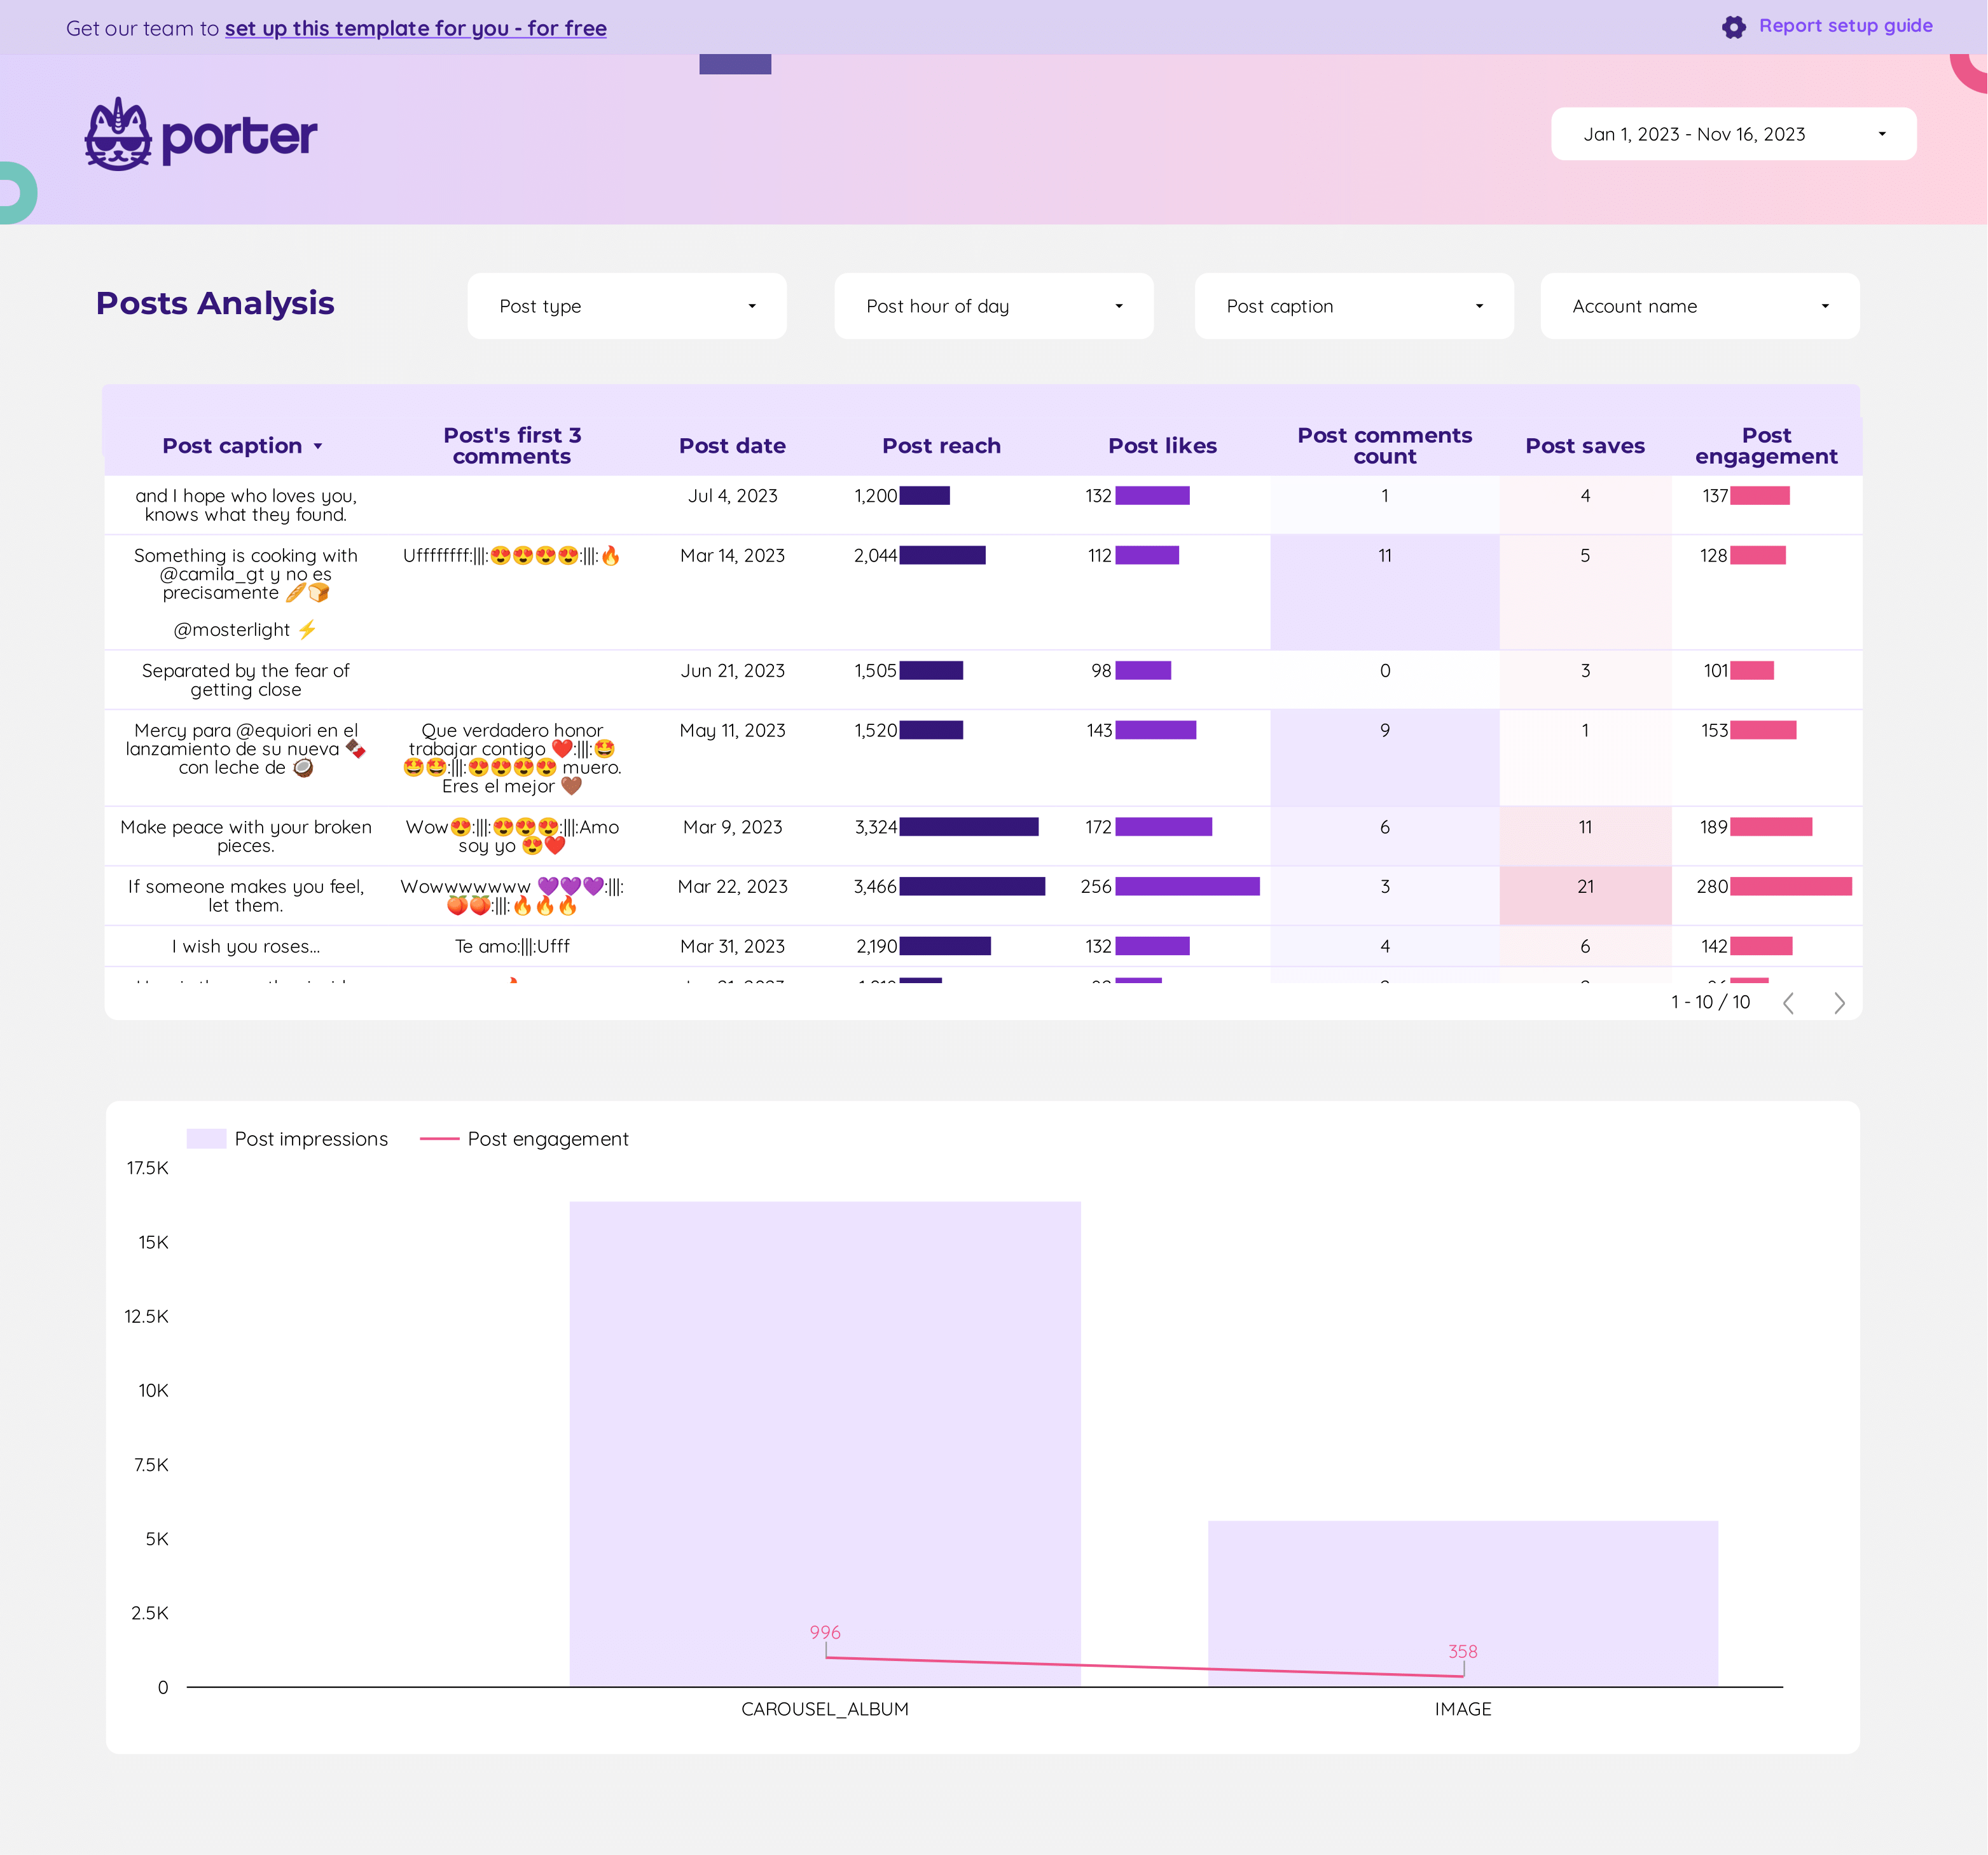
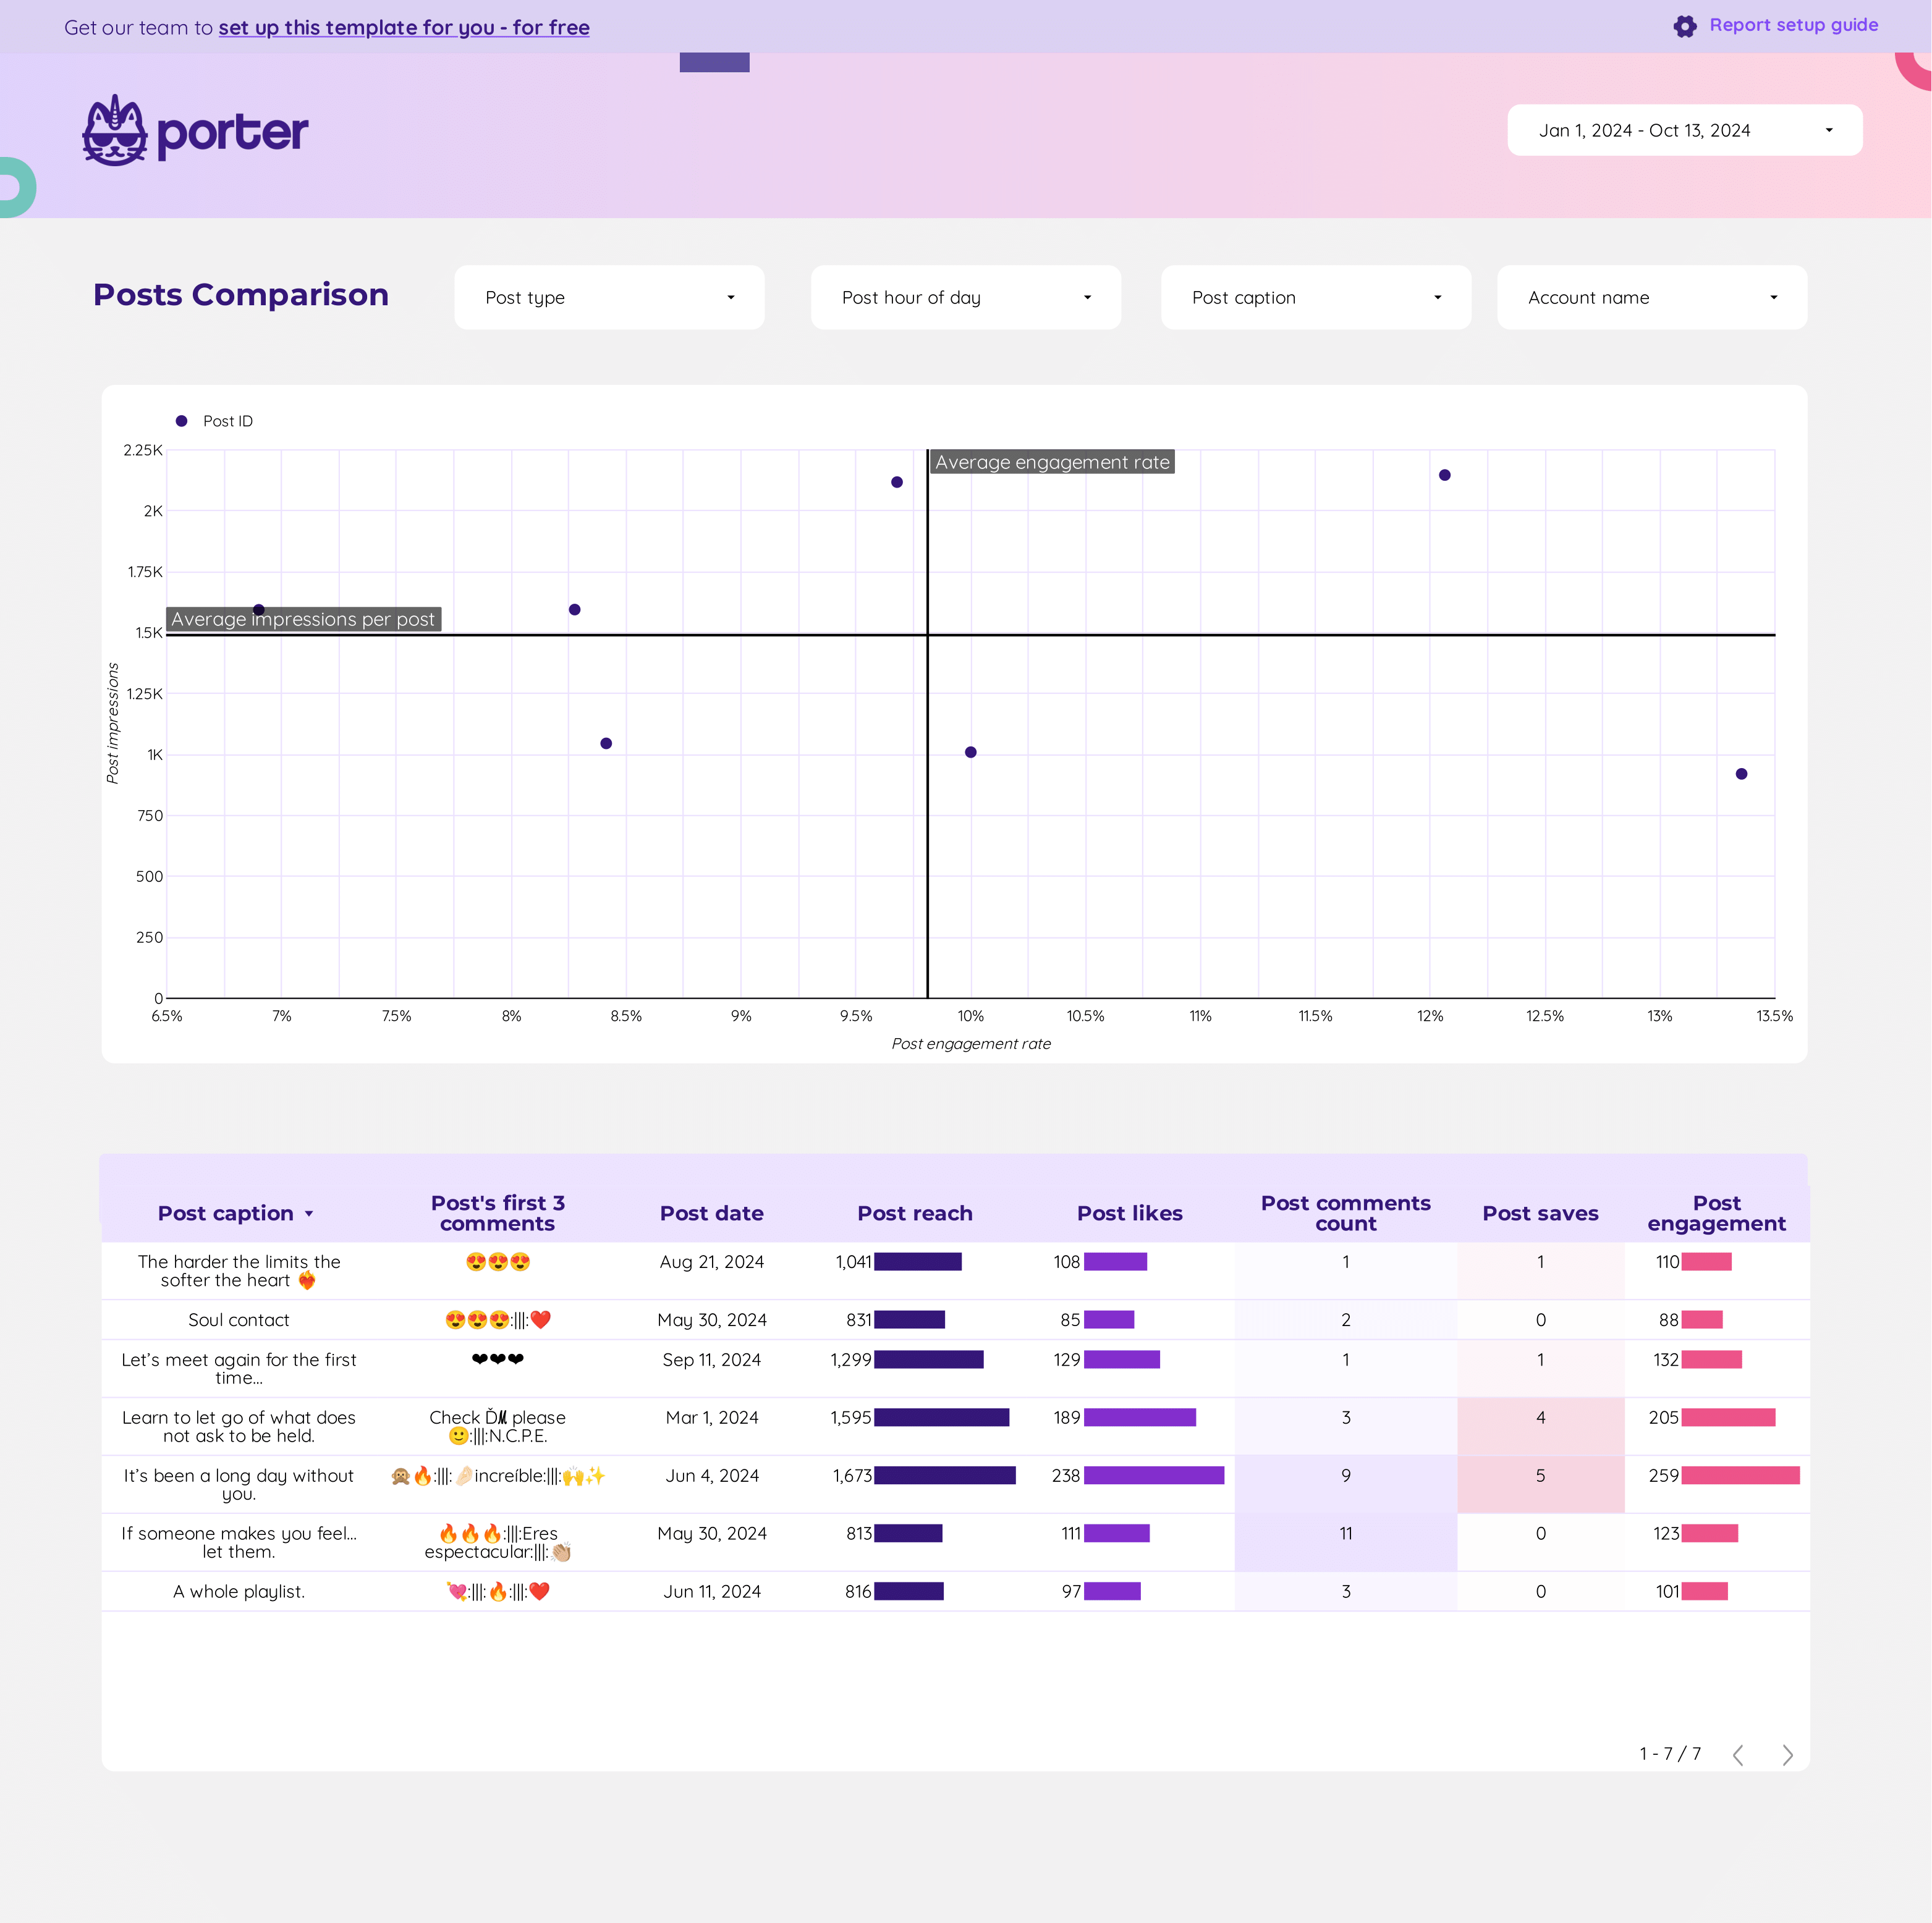
Social Media Post performance Report template for Data Studio by Porter
Mide post reach, impressions → engagement per post → clicks per post, conversions. Segmenta por format, topic, time.
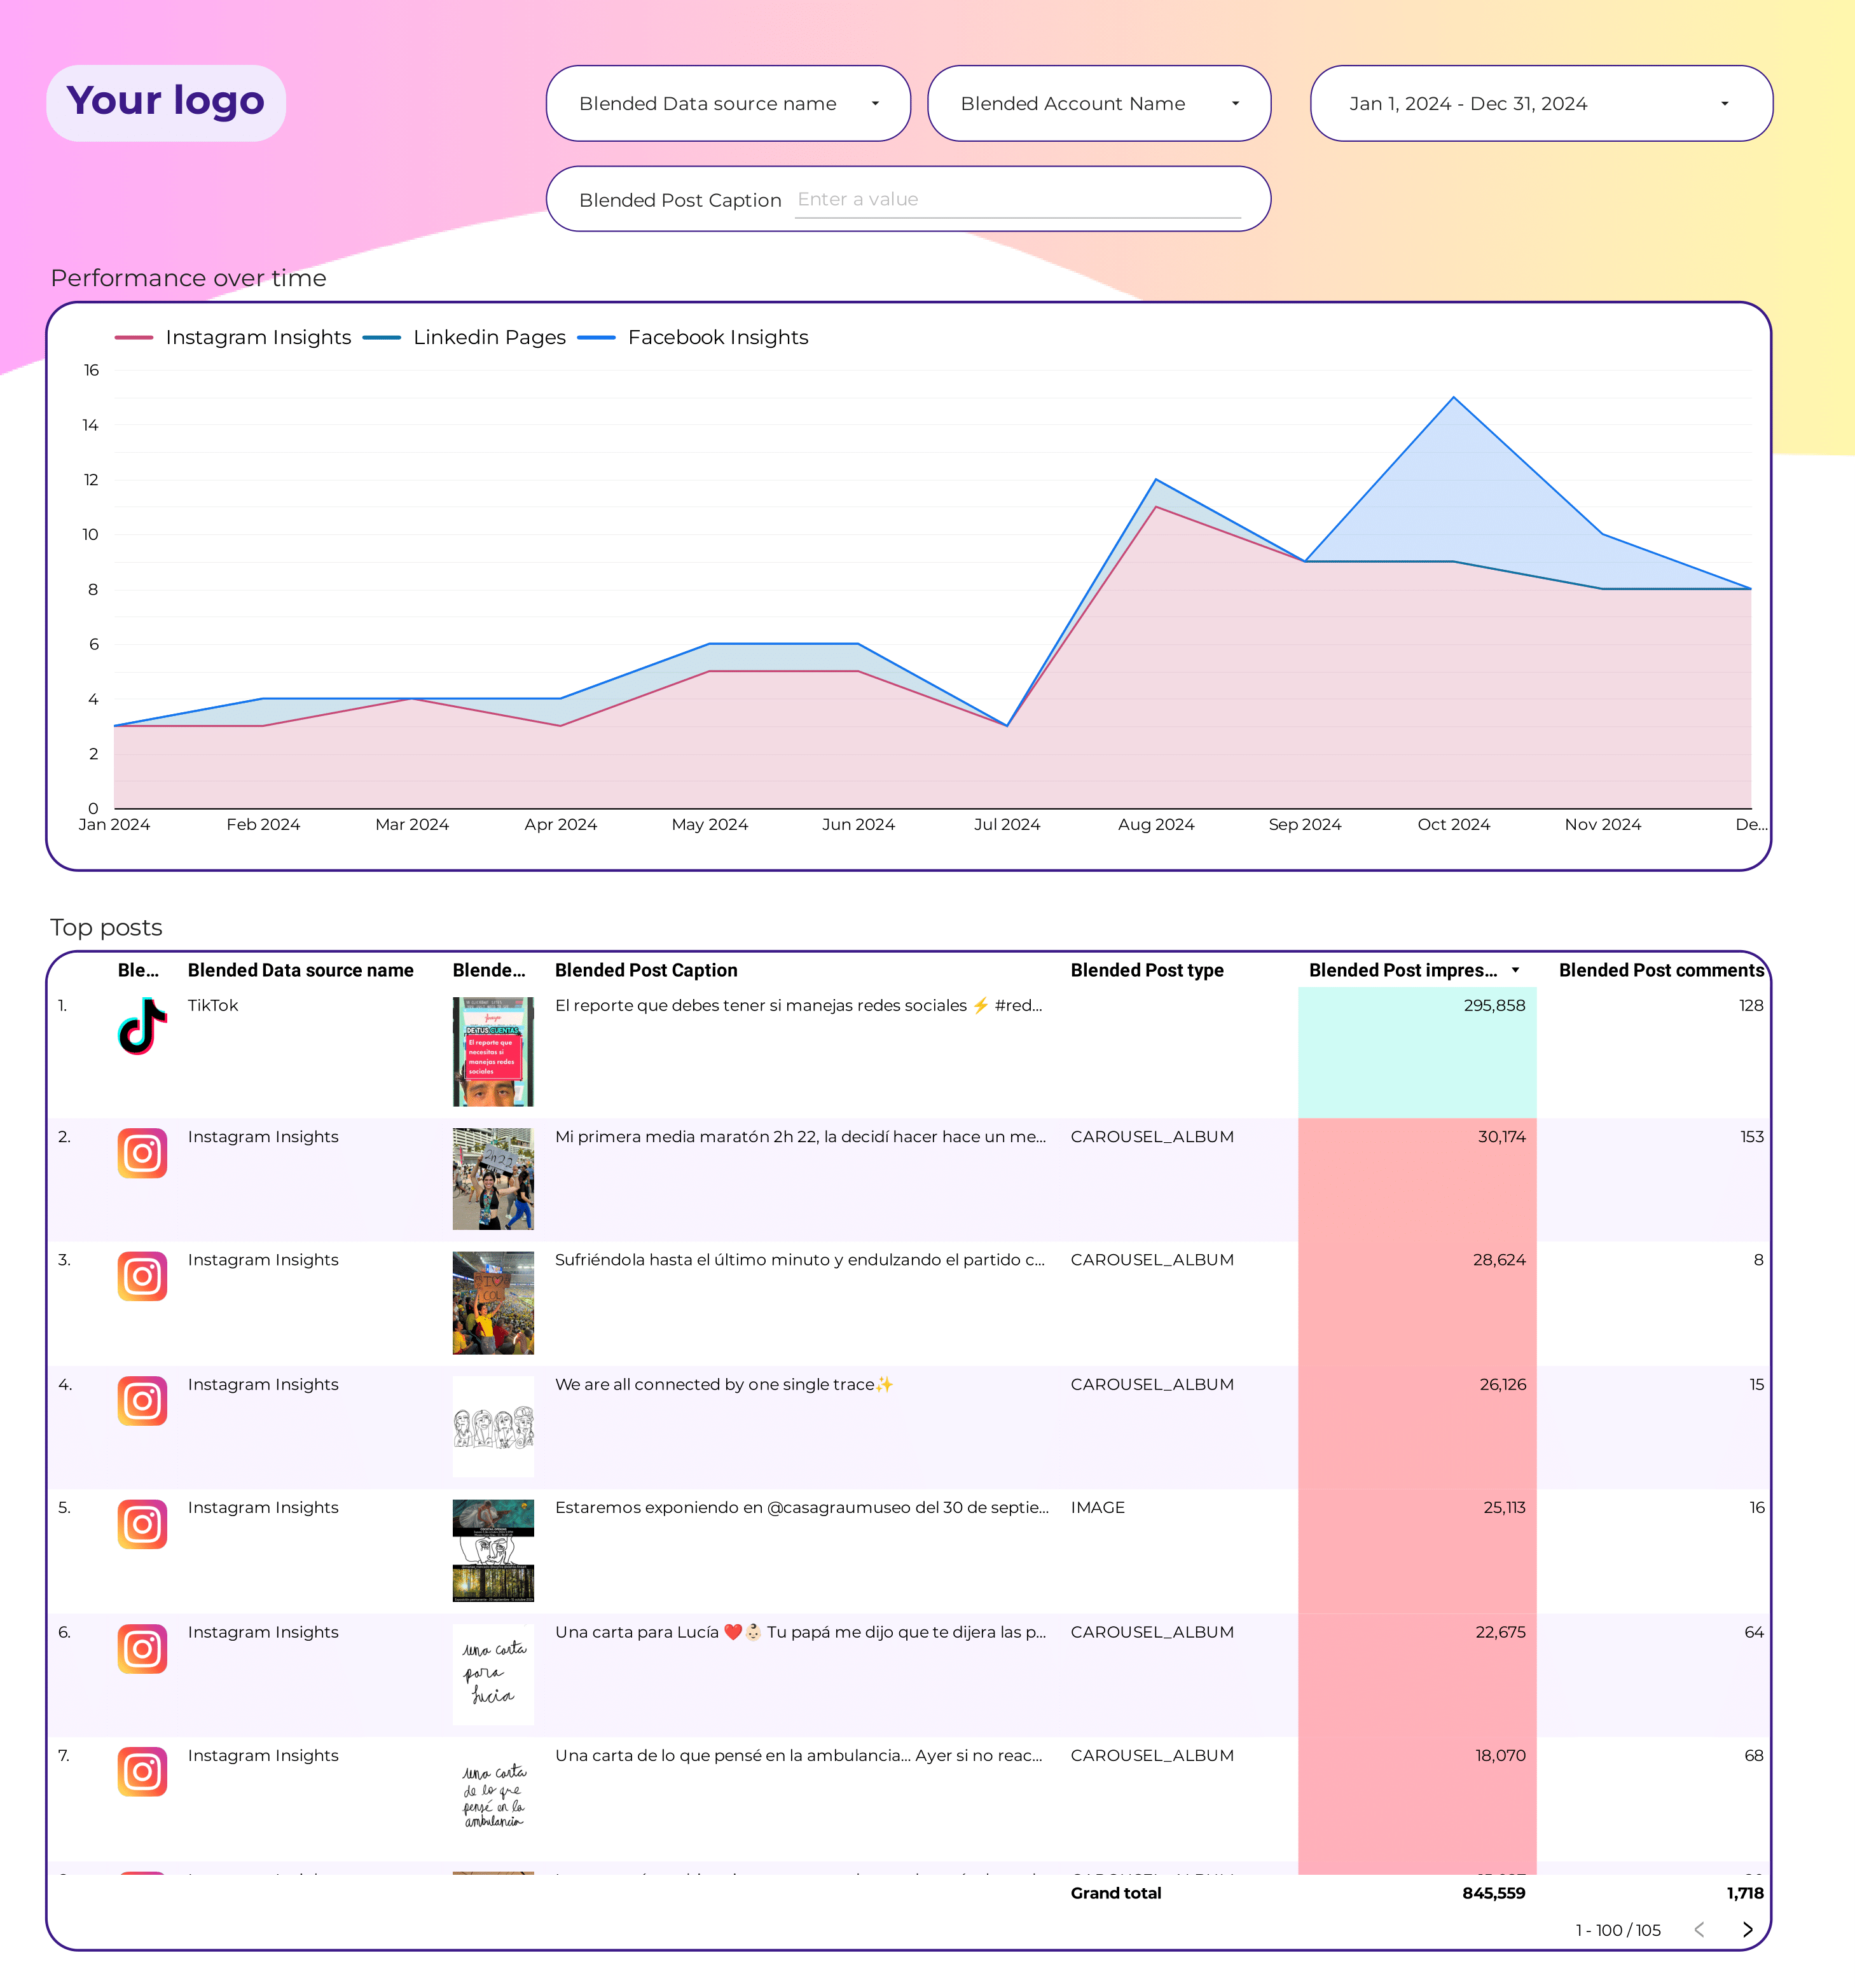
Creator marketing Report template for Data Studio by Porter
Mide creator reach, impressions → engagement per creator, saves → conversions per creator, ROI. Segmenta por creator, platform.
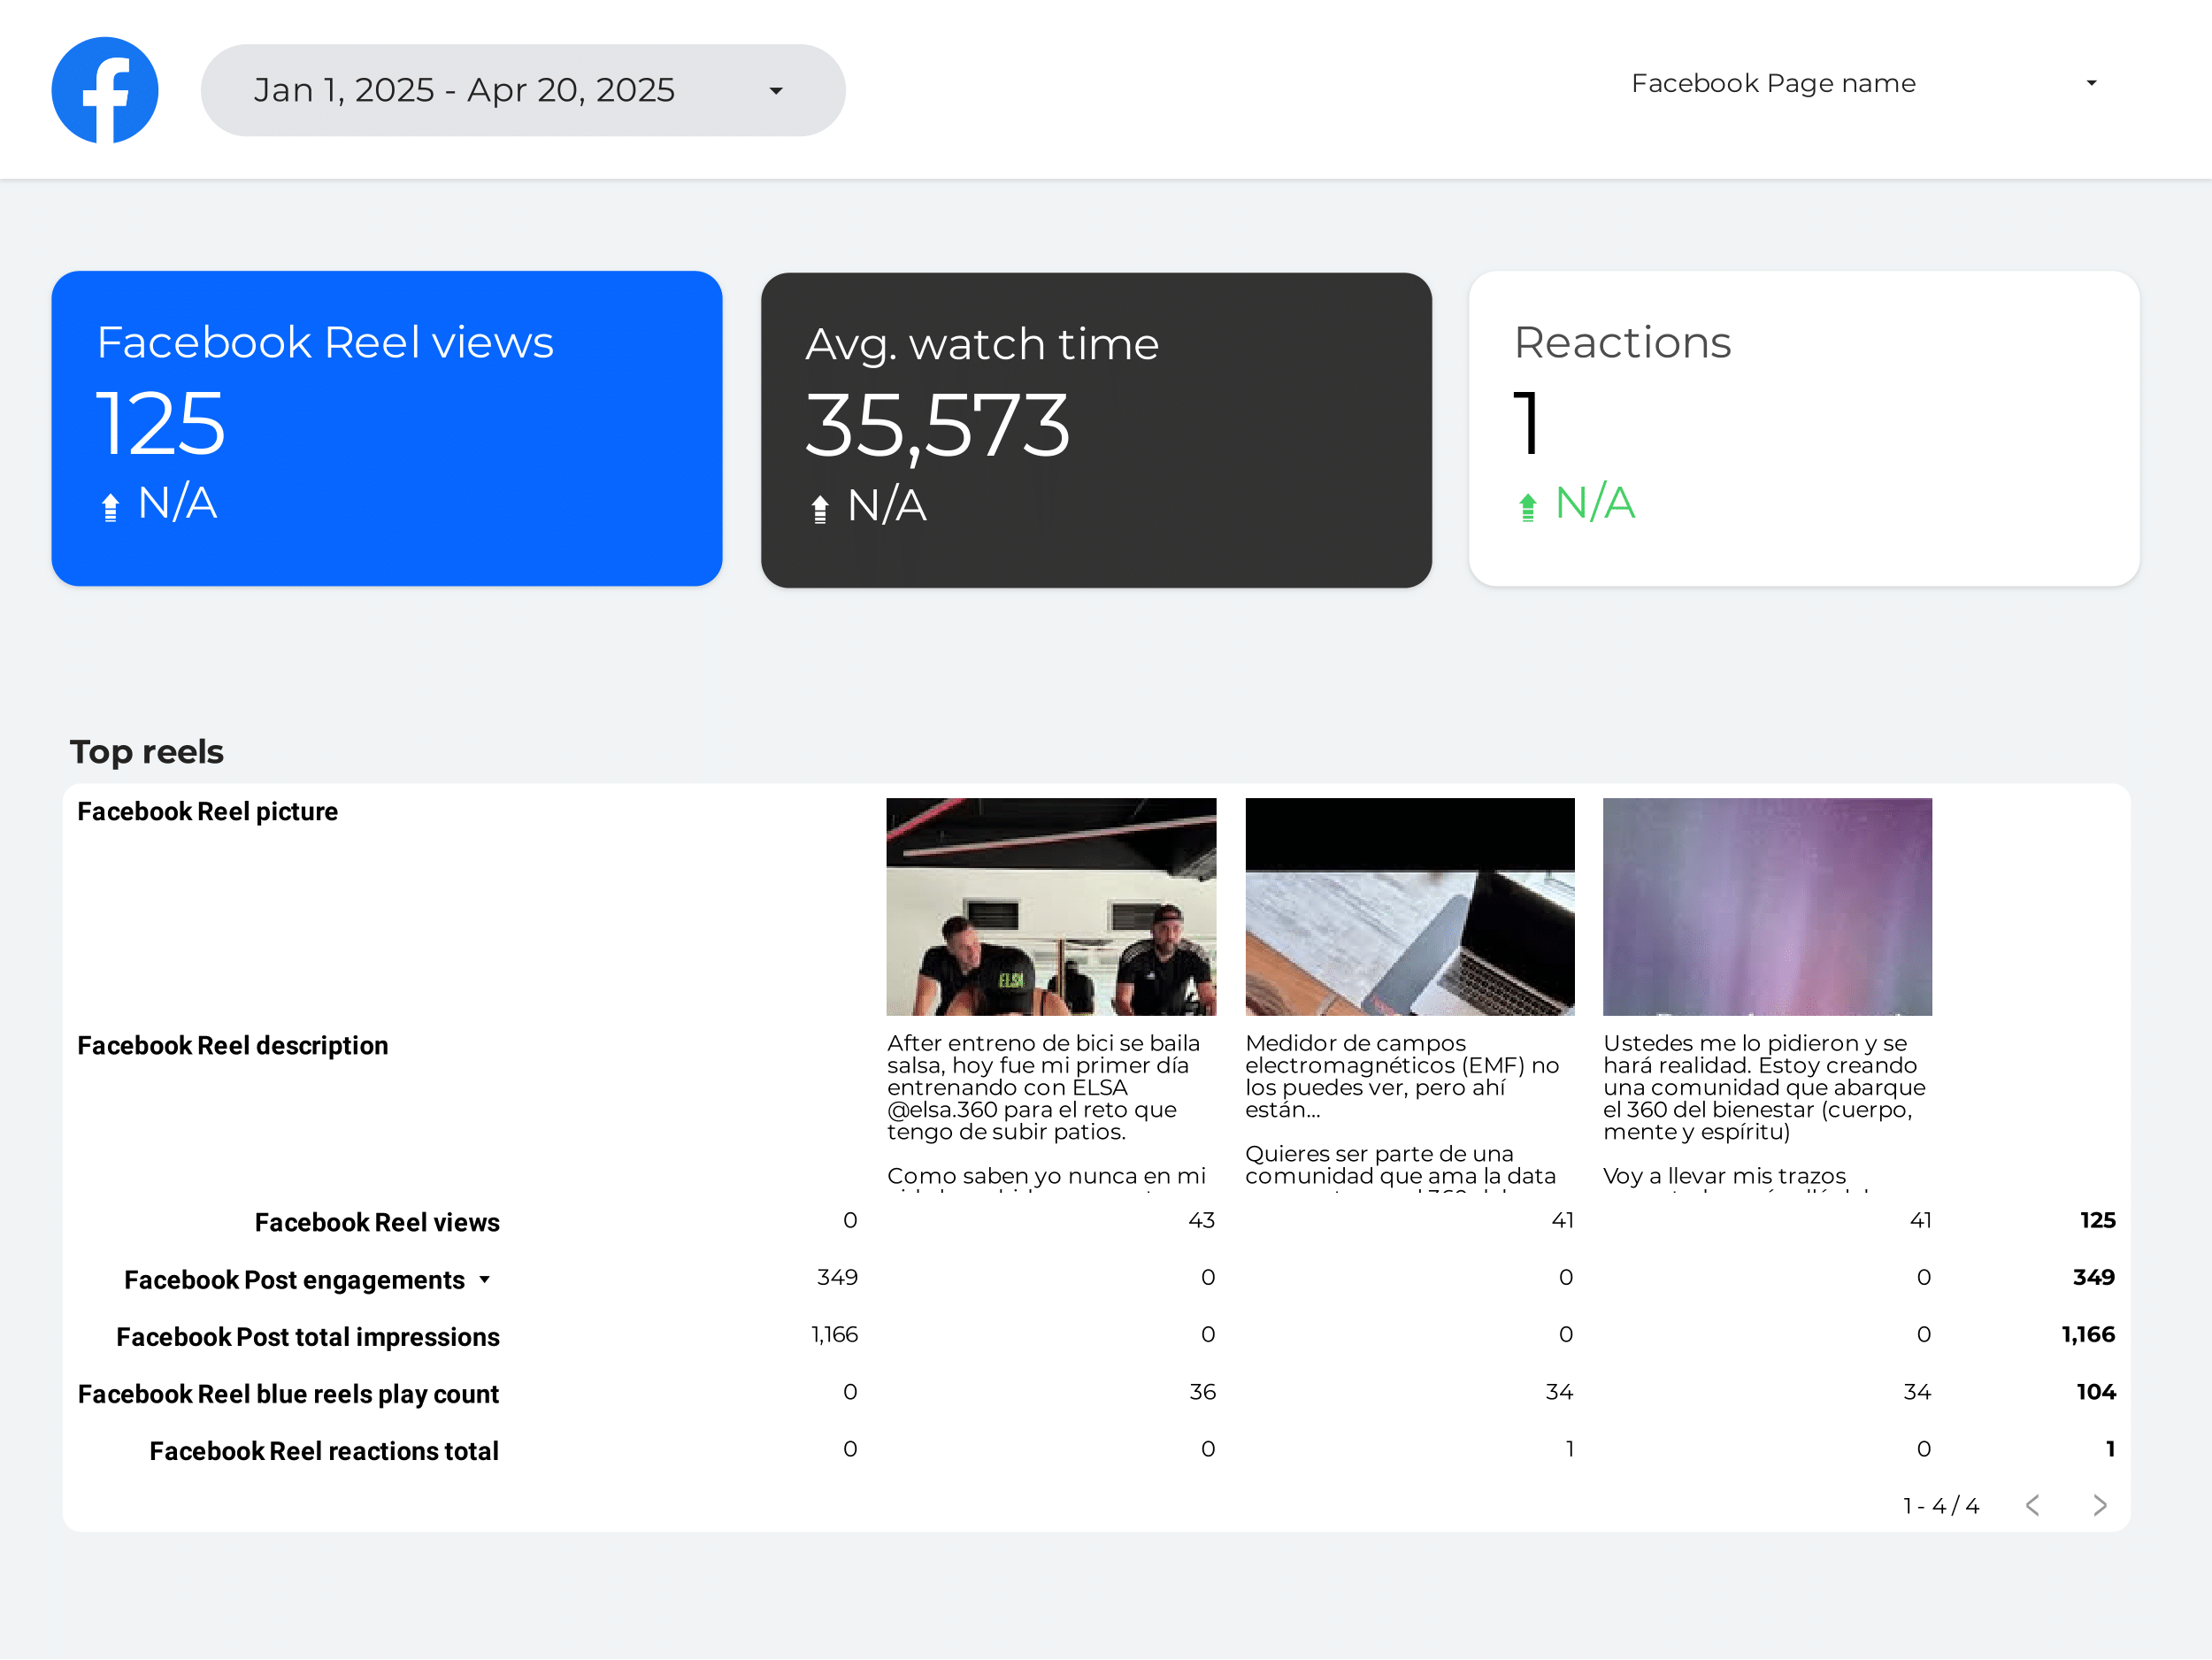
Instagram Insights Reels Report template for Data Studio by Porter
Mide Reel plays, reach → likes, comments, shares/Reel → profile visits, follower growth. Segmenta por Reel, audio, format.
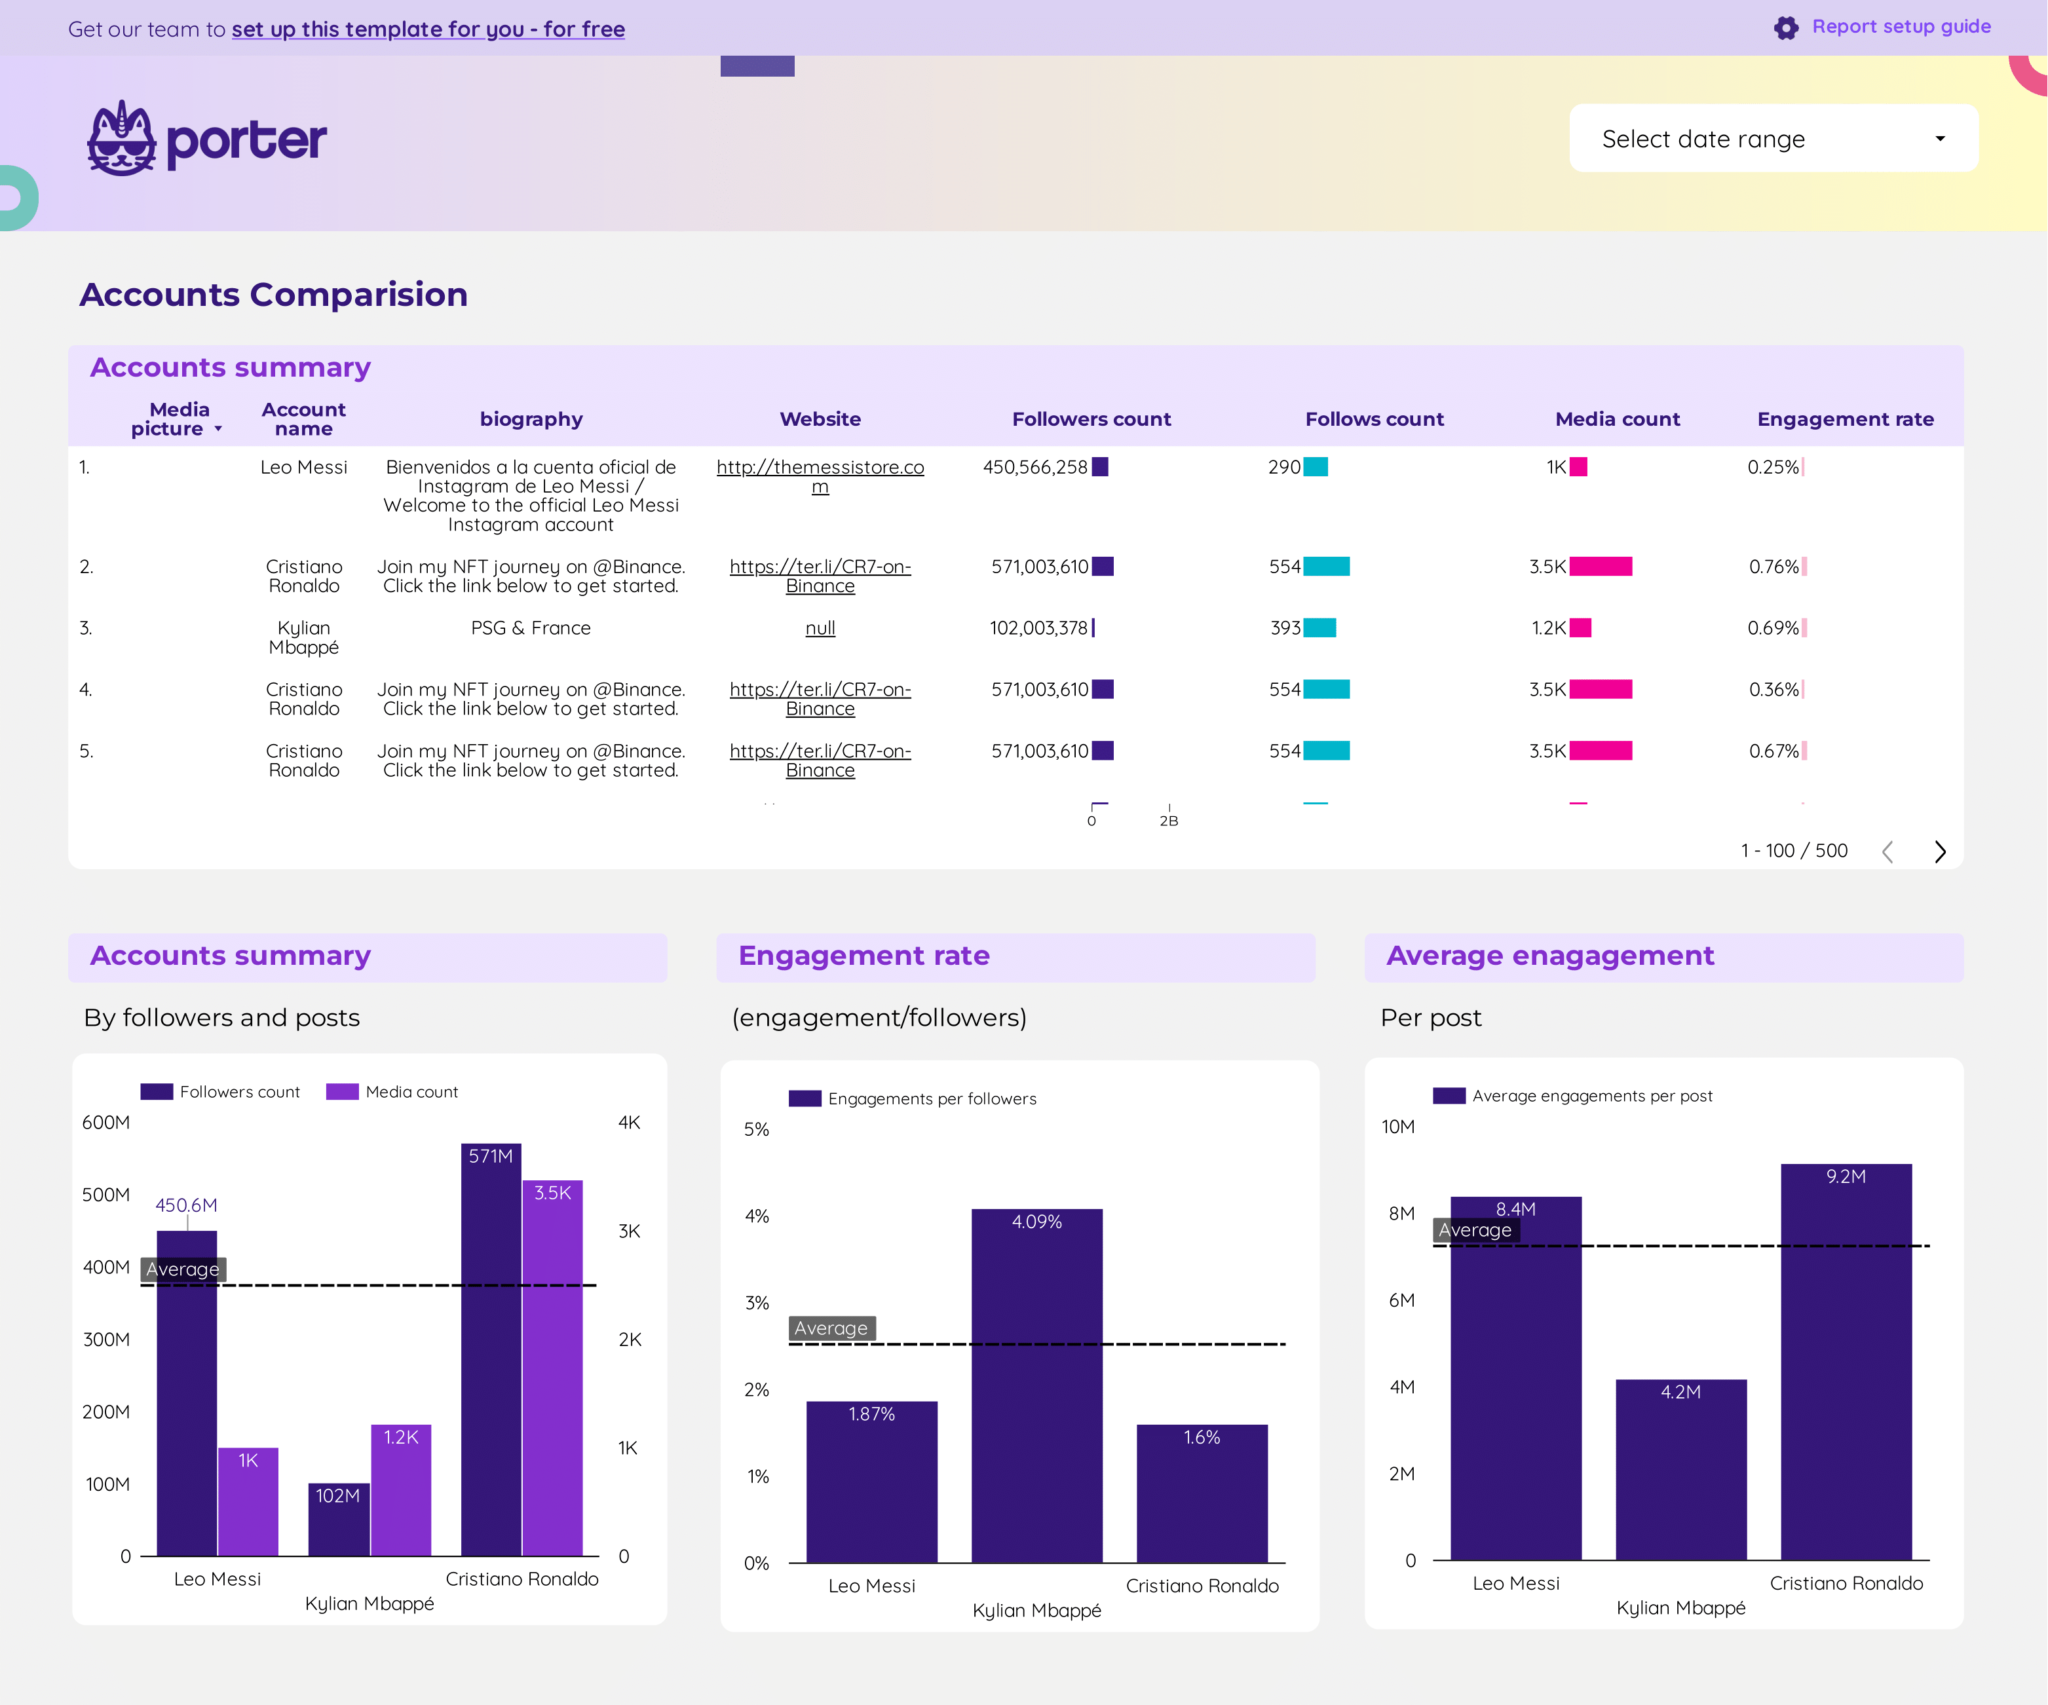
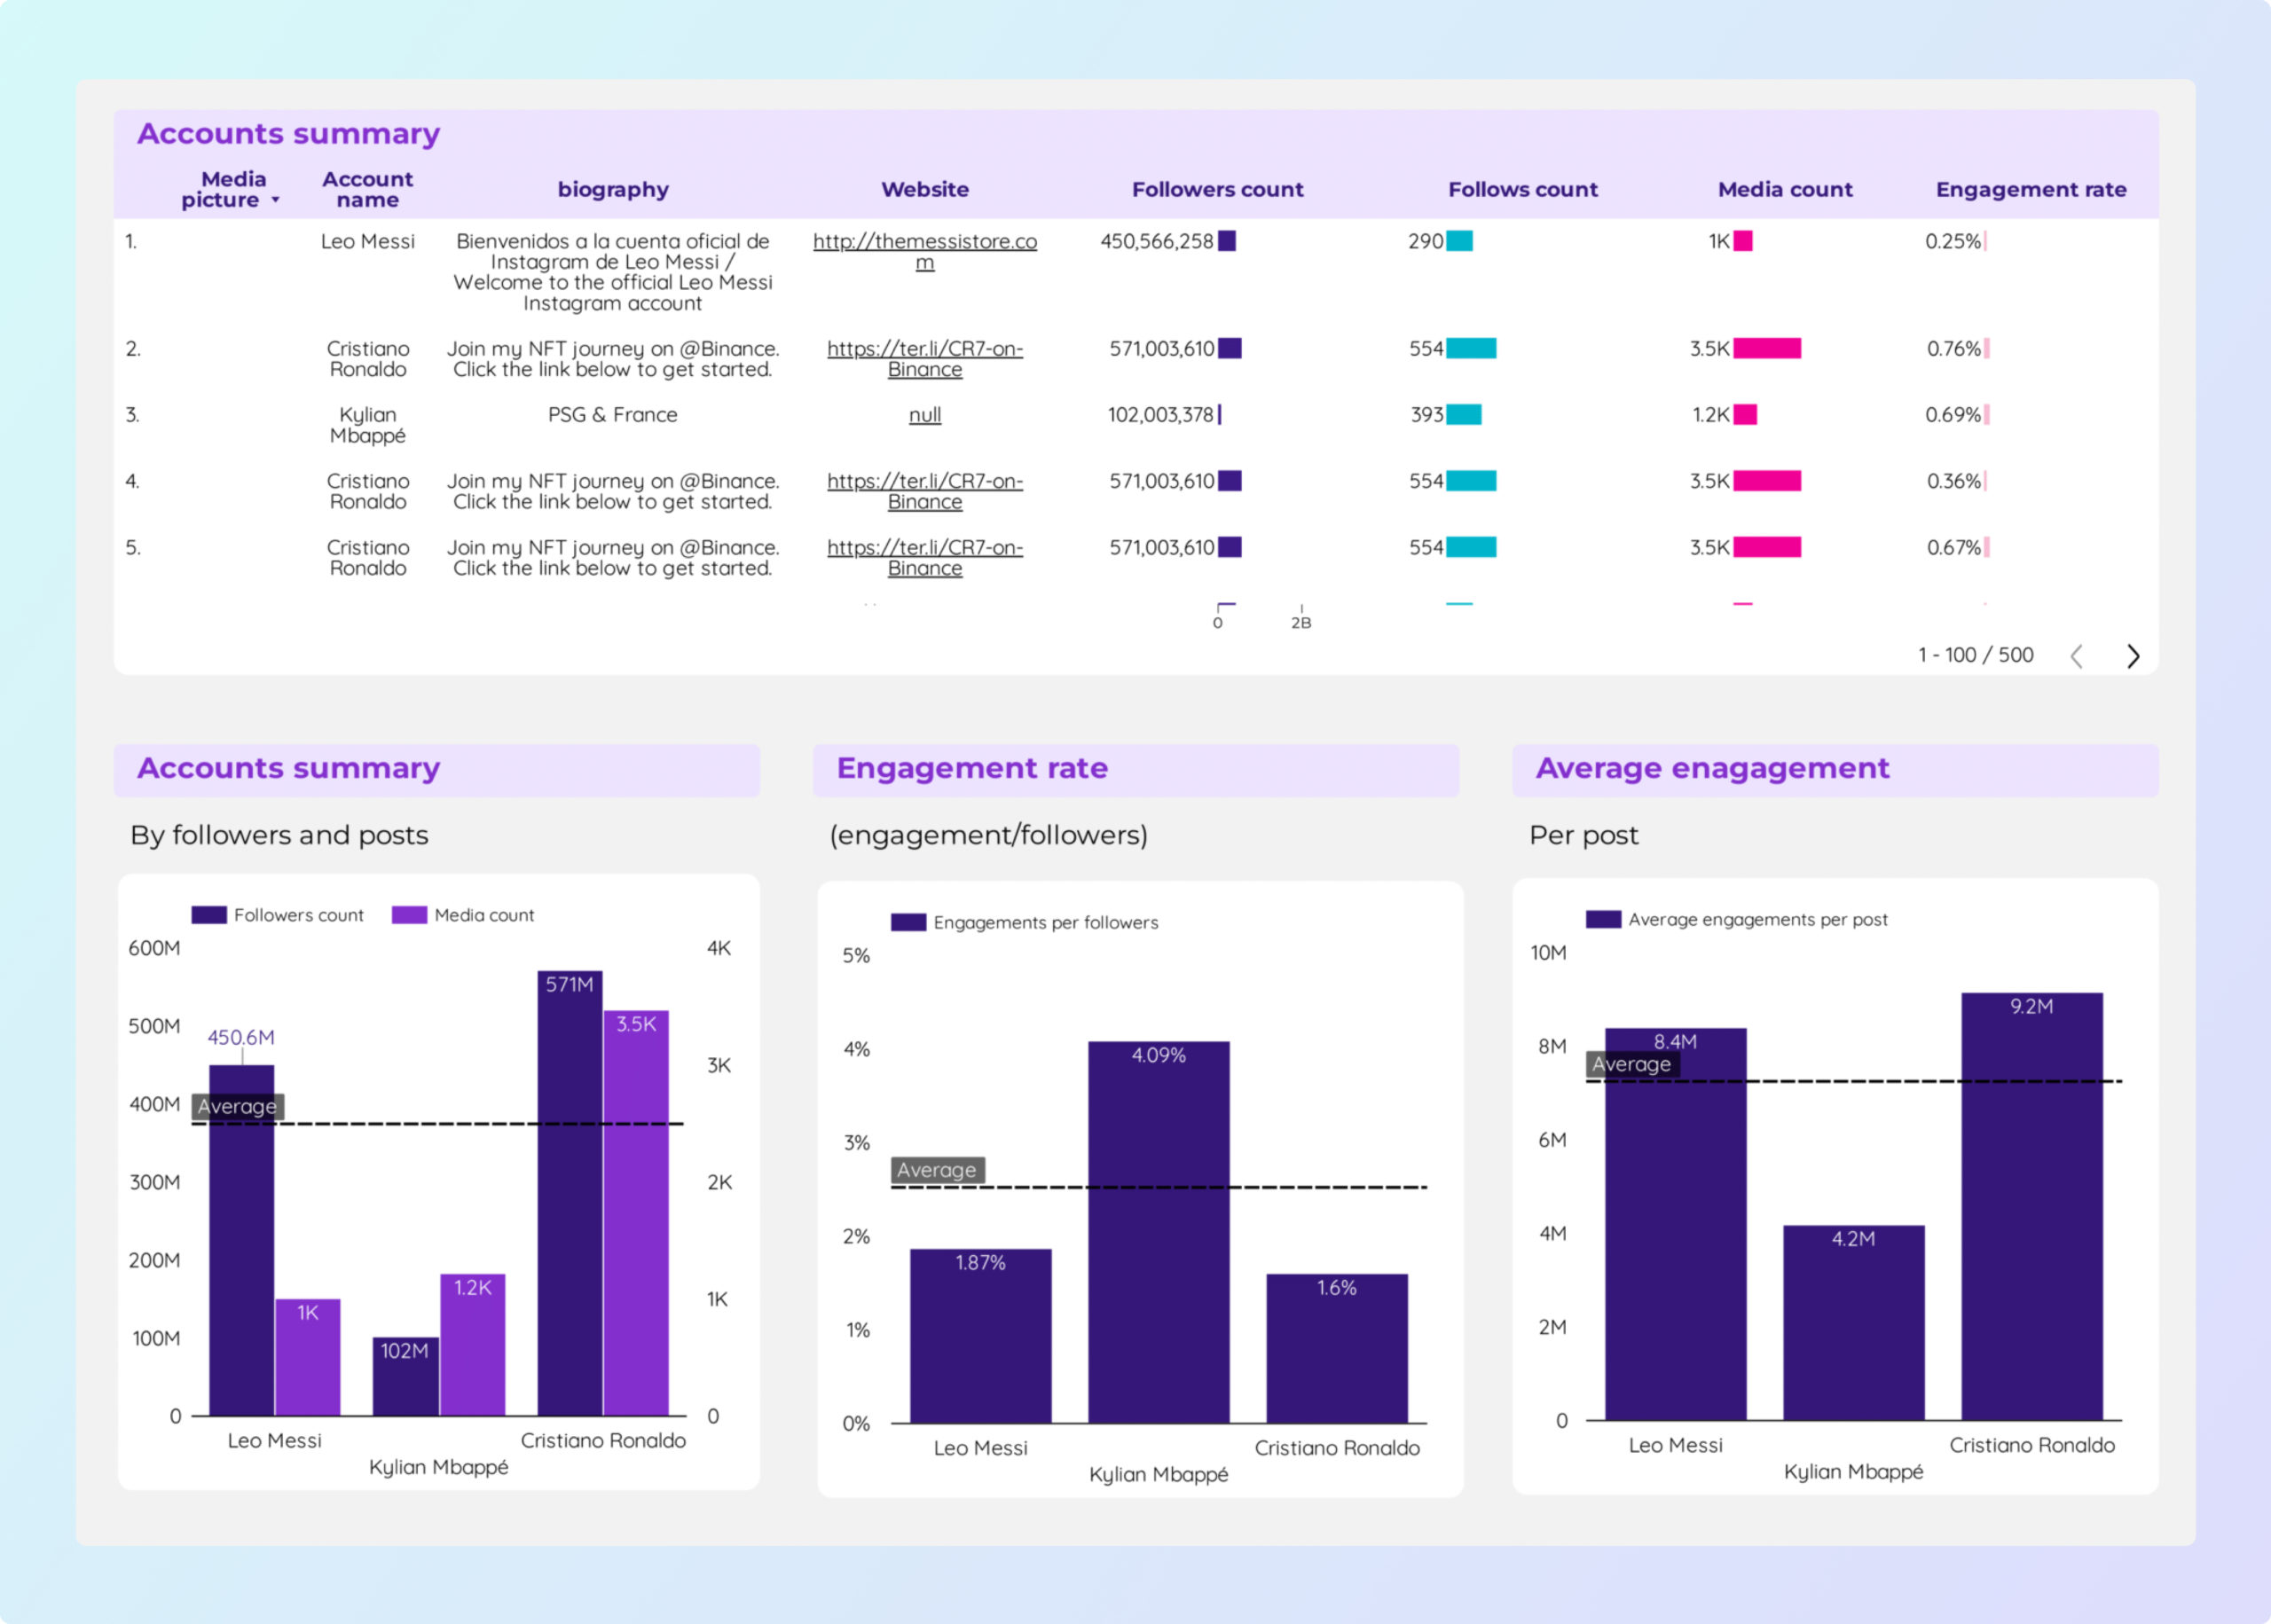
Instagram Insights competitors Report template for Data Studio by Porter
Mide competitor followers, frequency → competitor engagement rate → share of engagement, growth gap. Segmenta por competitor, post type.
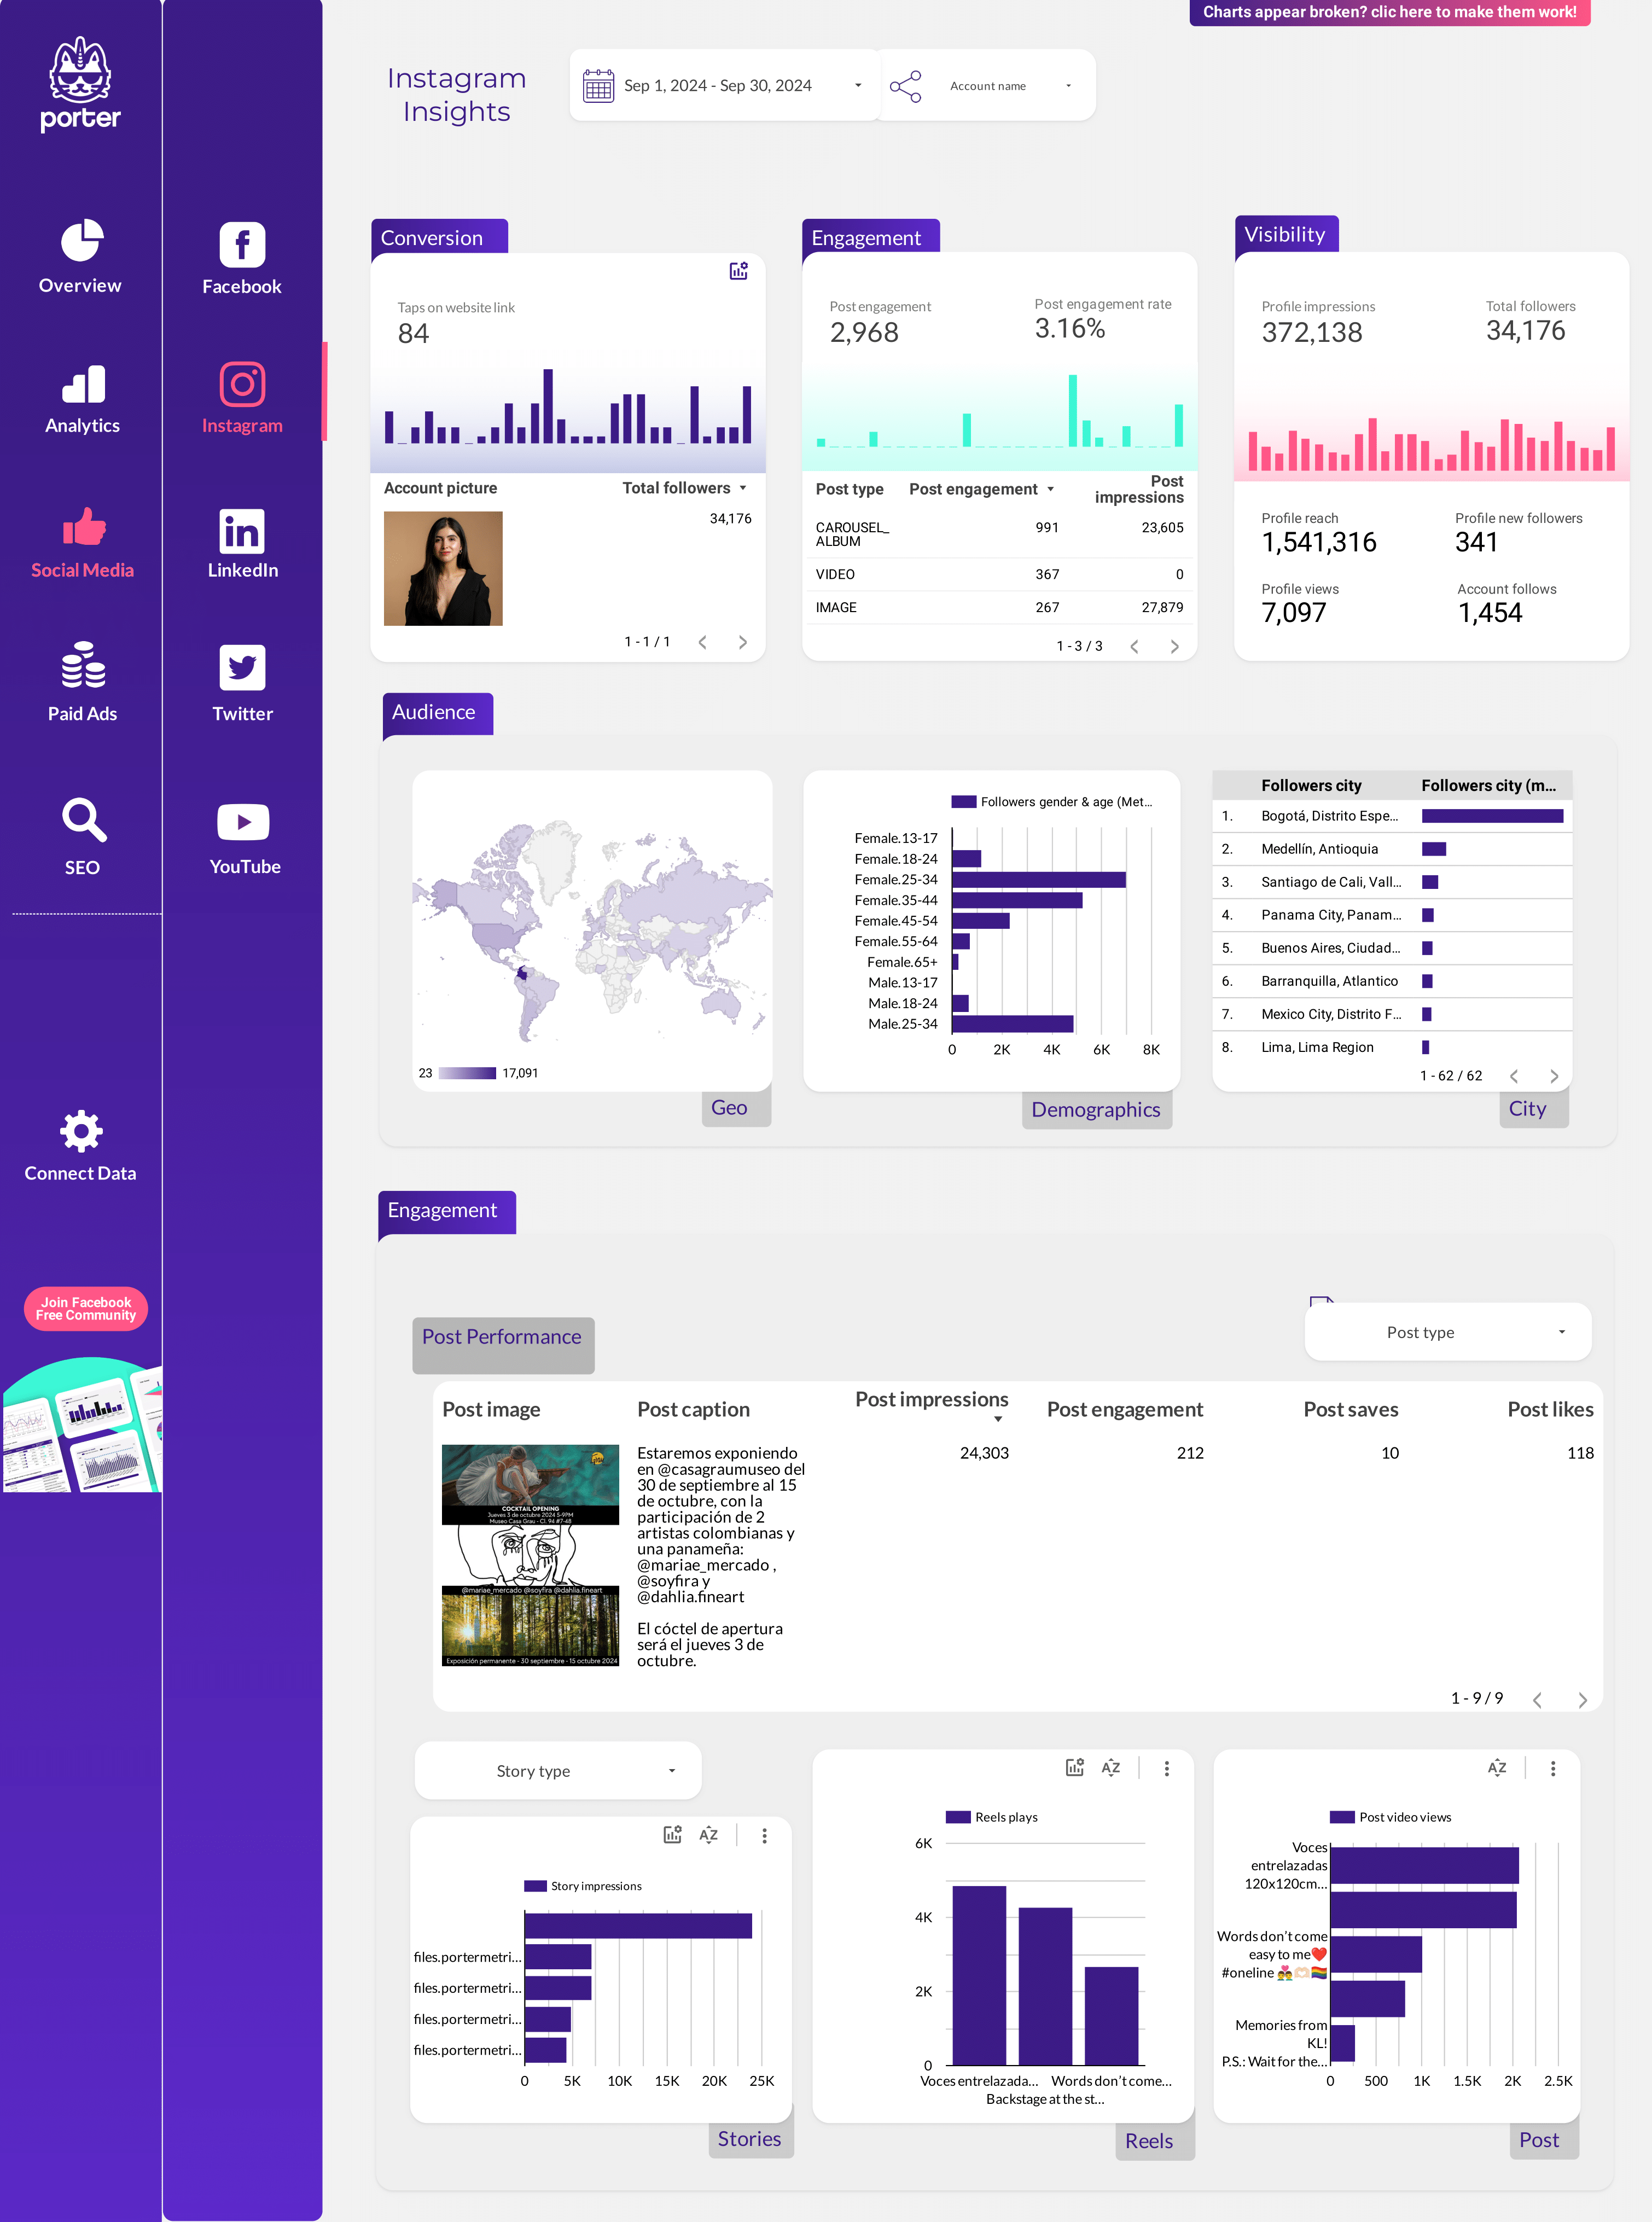
Instagram Insights Report template for Data Studio by Porter
Mide Reel plays, reach → likes, comments, shares/Reel → profile visits, follower growth. Segmenta por Reel, audio, format.
Engagement rate Report template for Data Studio by Porter
Mide total reach, impressions → engagement rate by type → engagement-to-click conversion. Segmenta por platform, format, time.
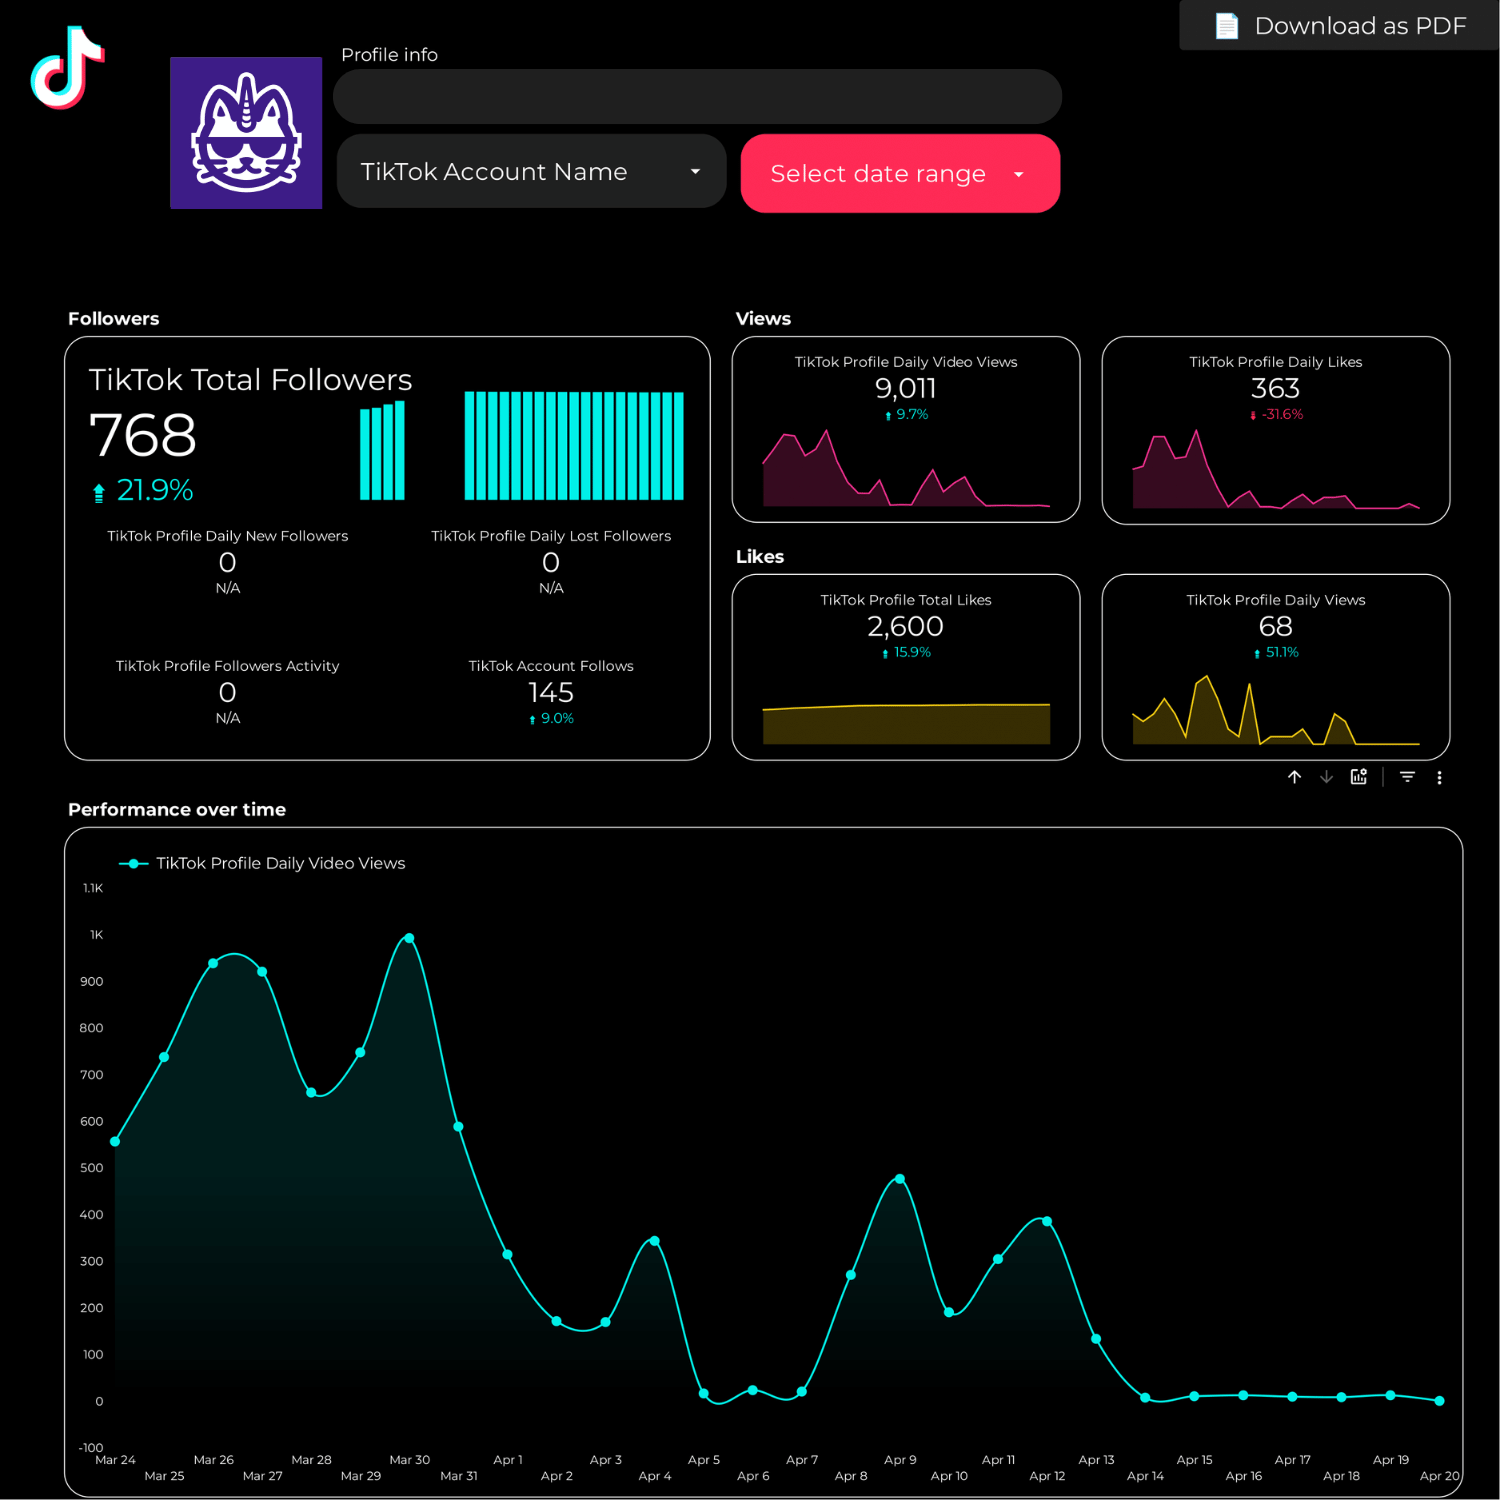
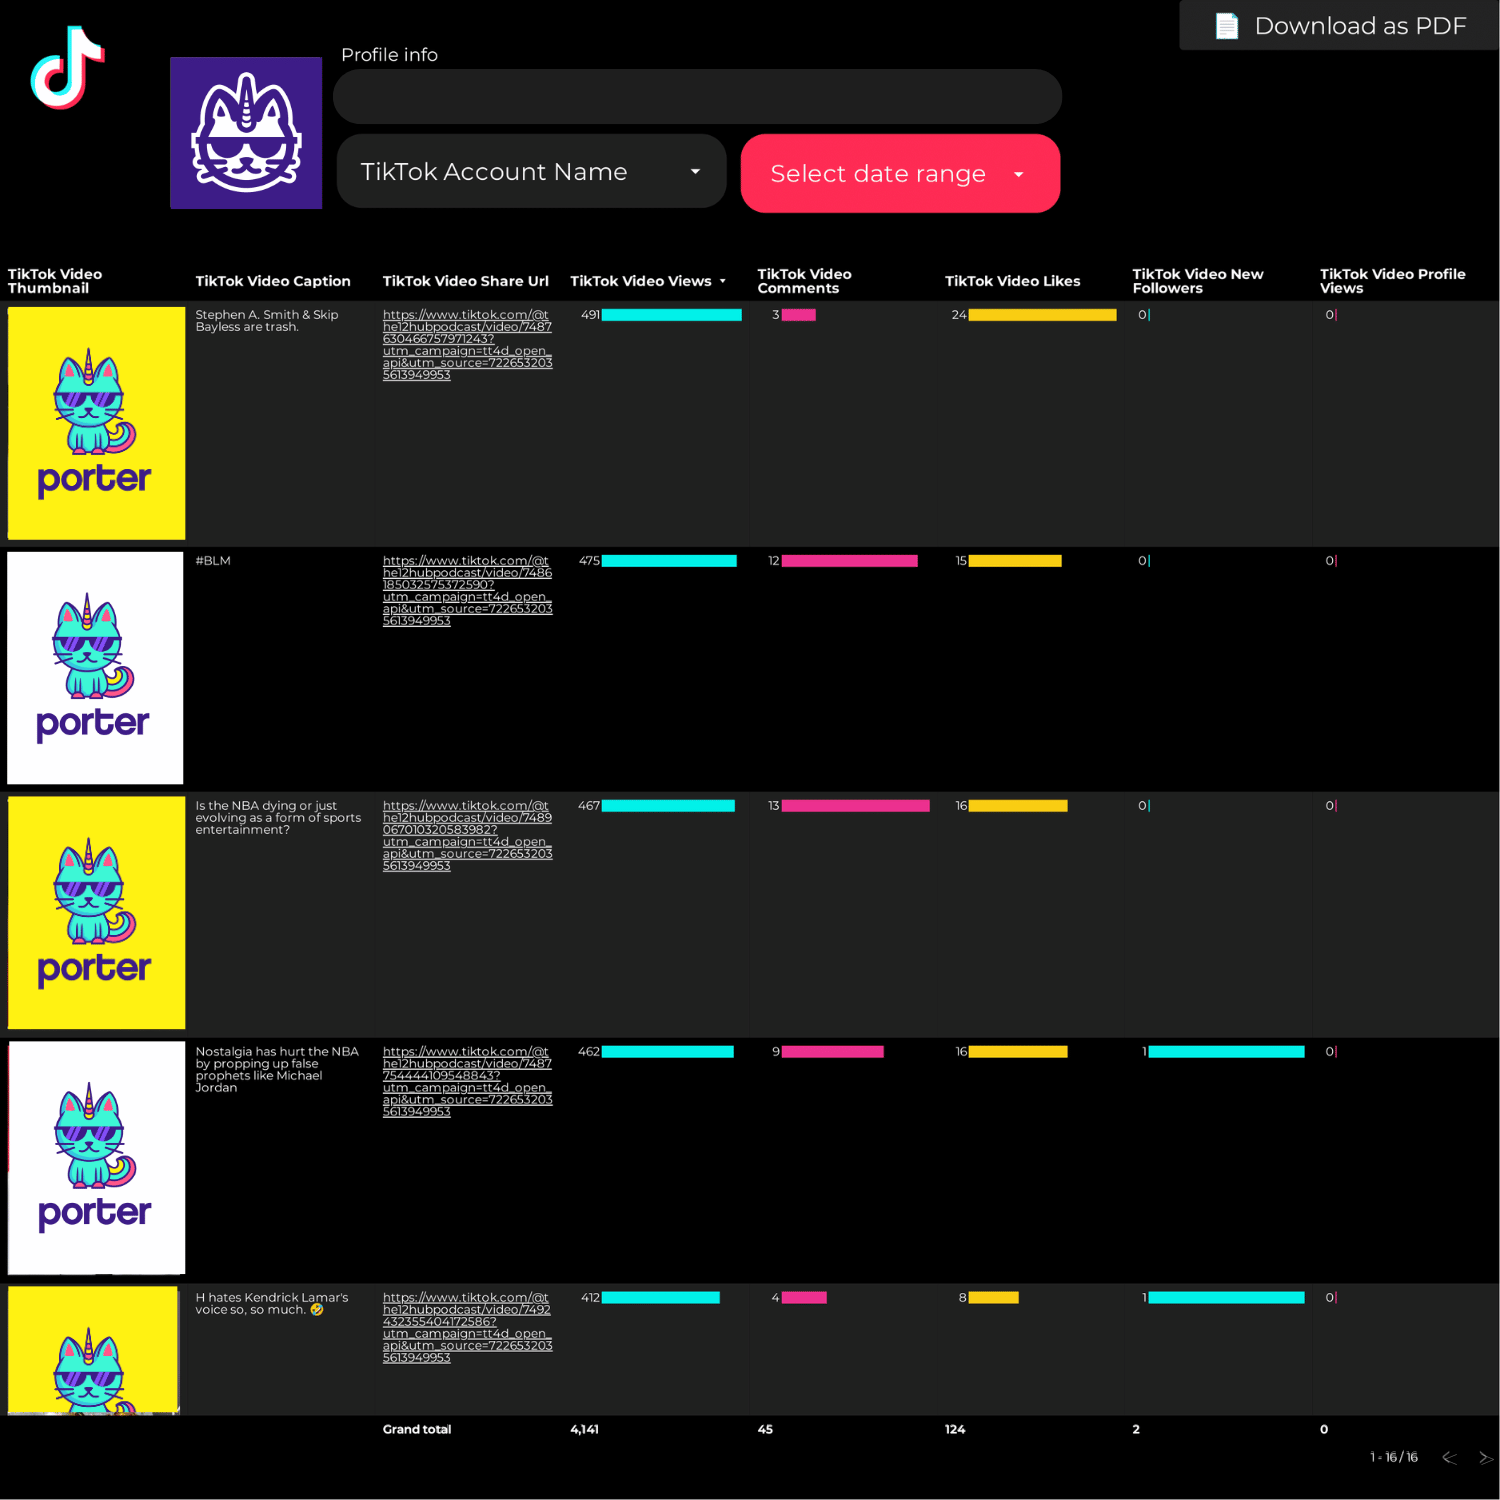
TikTok Report template for Data Studio by Porter
Mide video views, reach → VTR, CTR, engagement rate → conversions, ROAS, CPA. Segmenta por campaign, creative, audience.
Social Media Report template for Data Studio by Porter
Mide follower growth across platforms → engagement rate per follower → follower-to-customer ratio. Segmenta por platform, date.
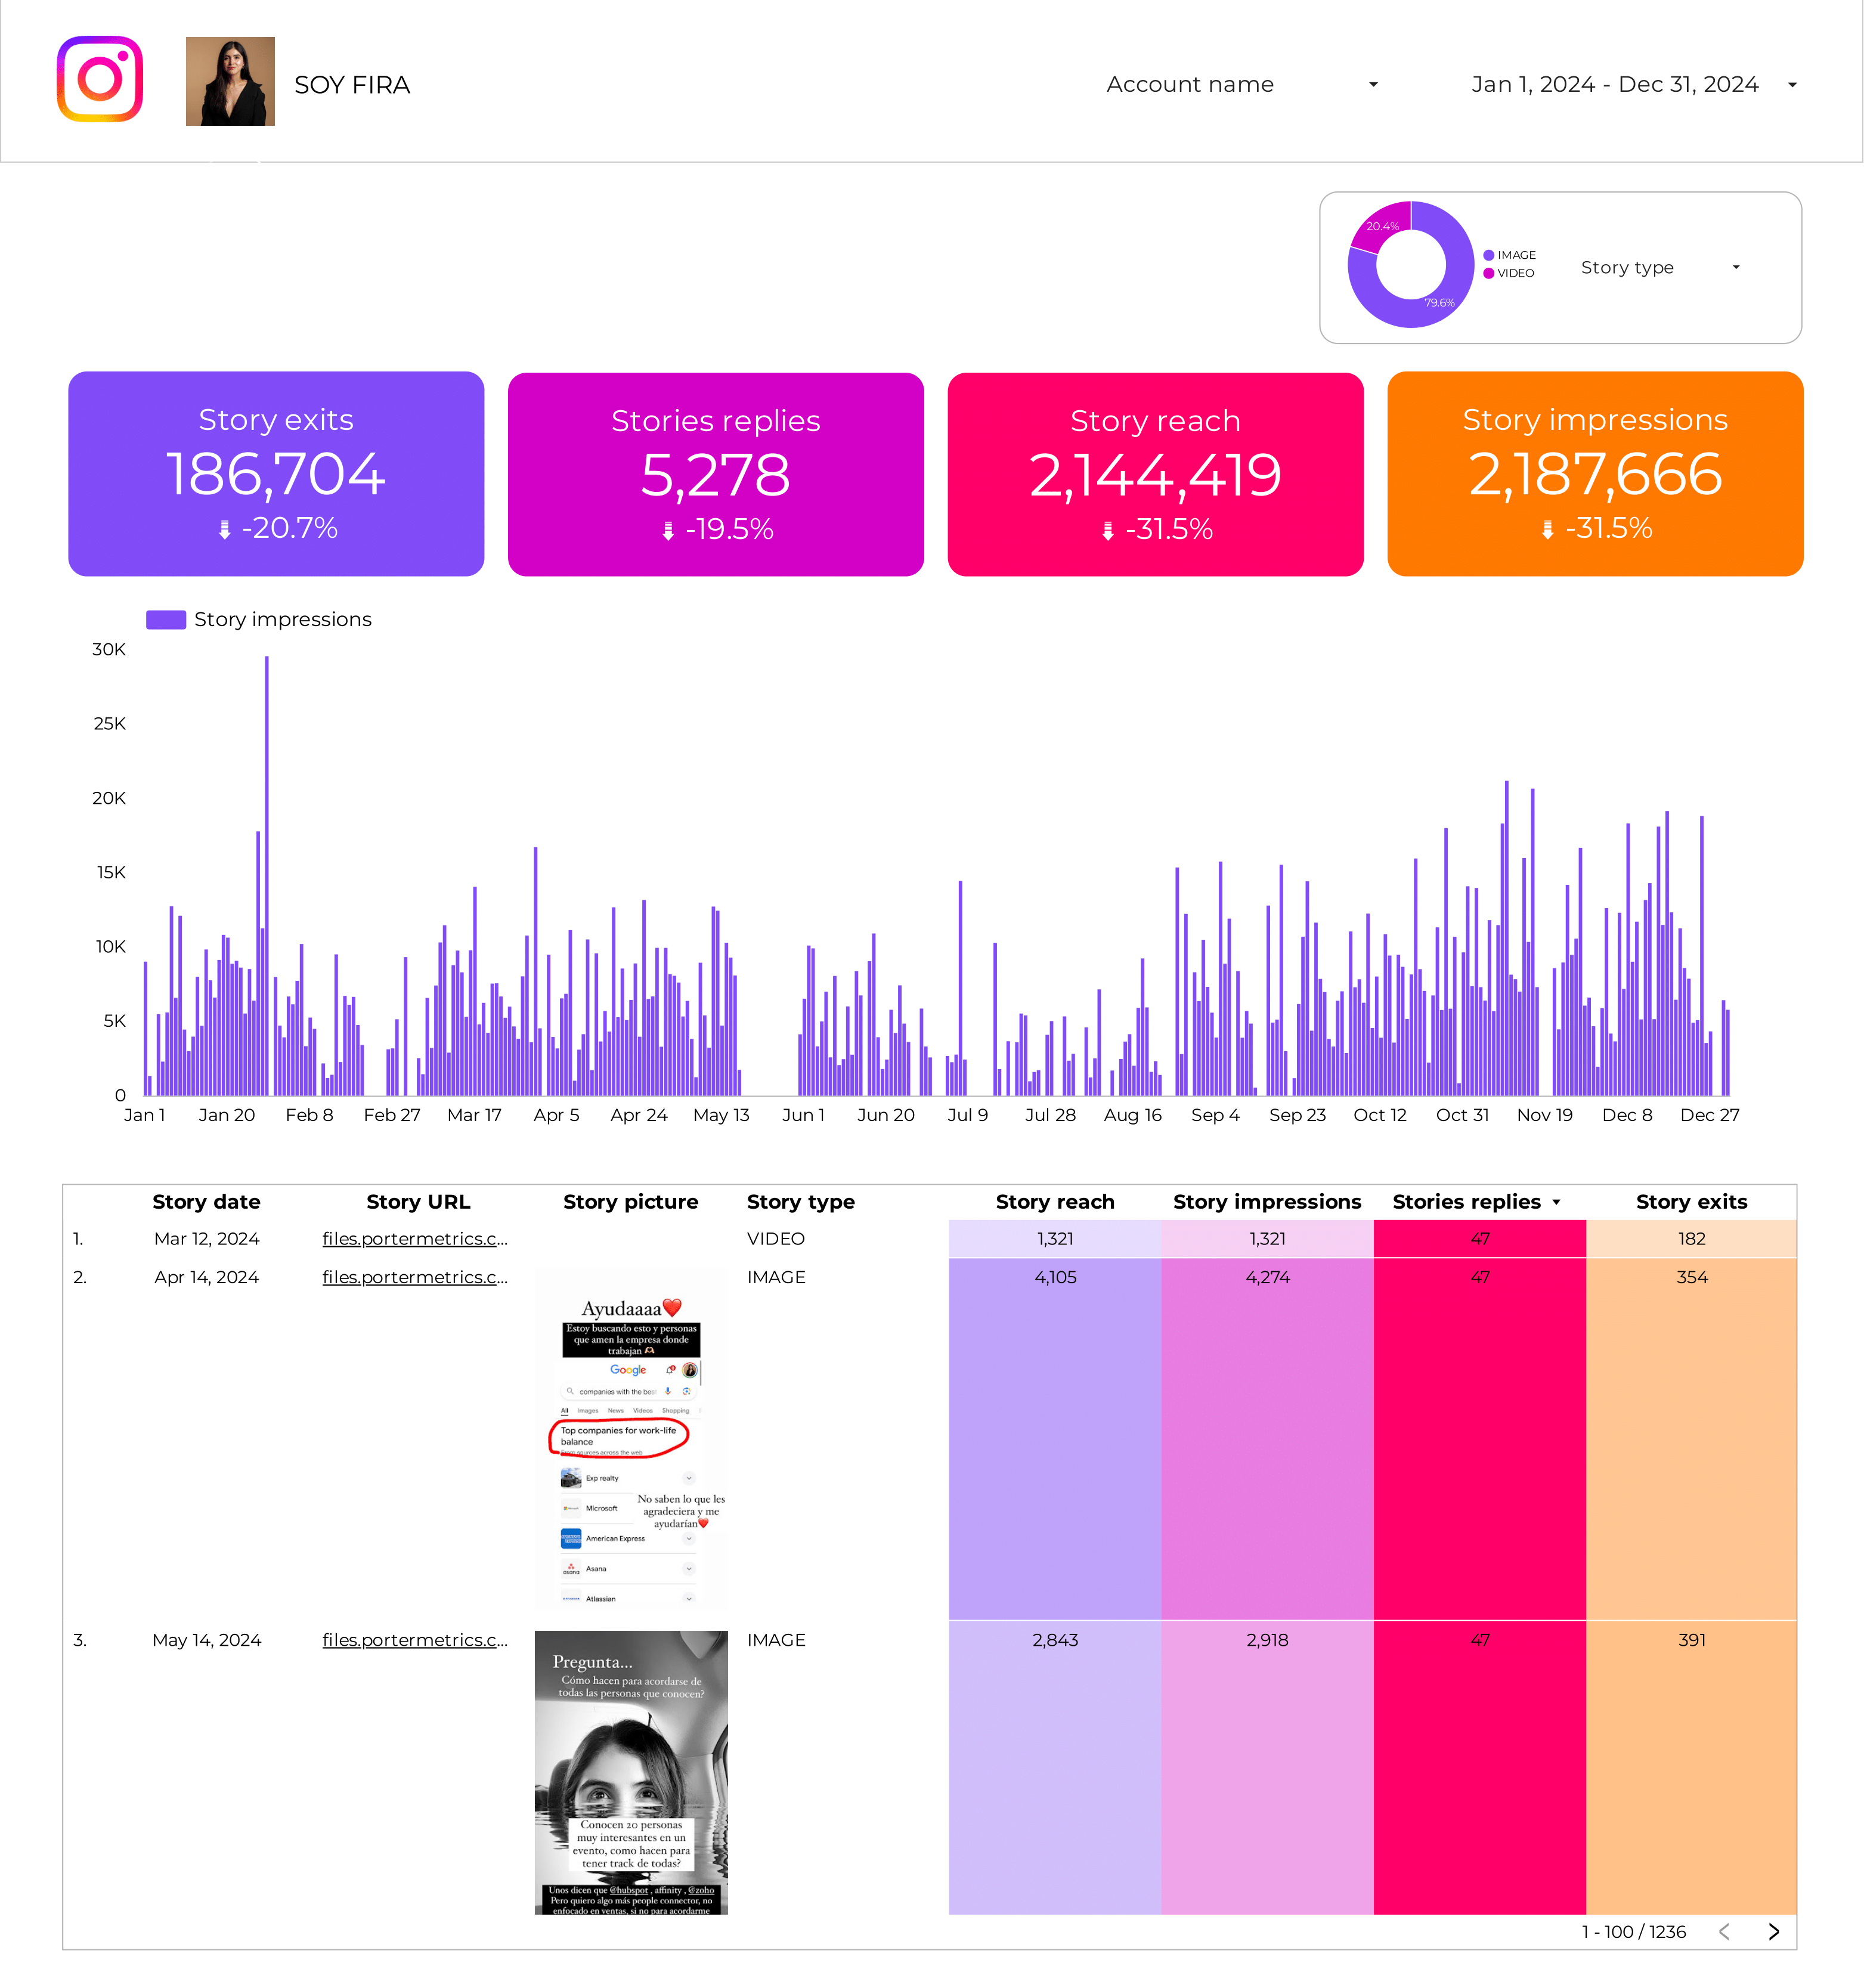
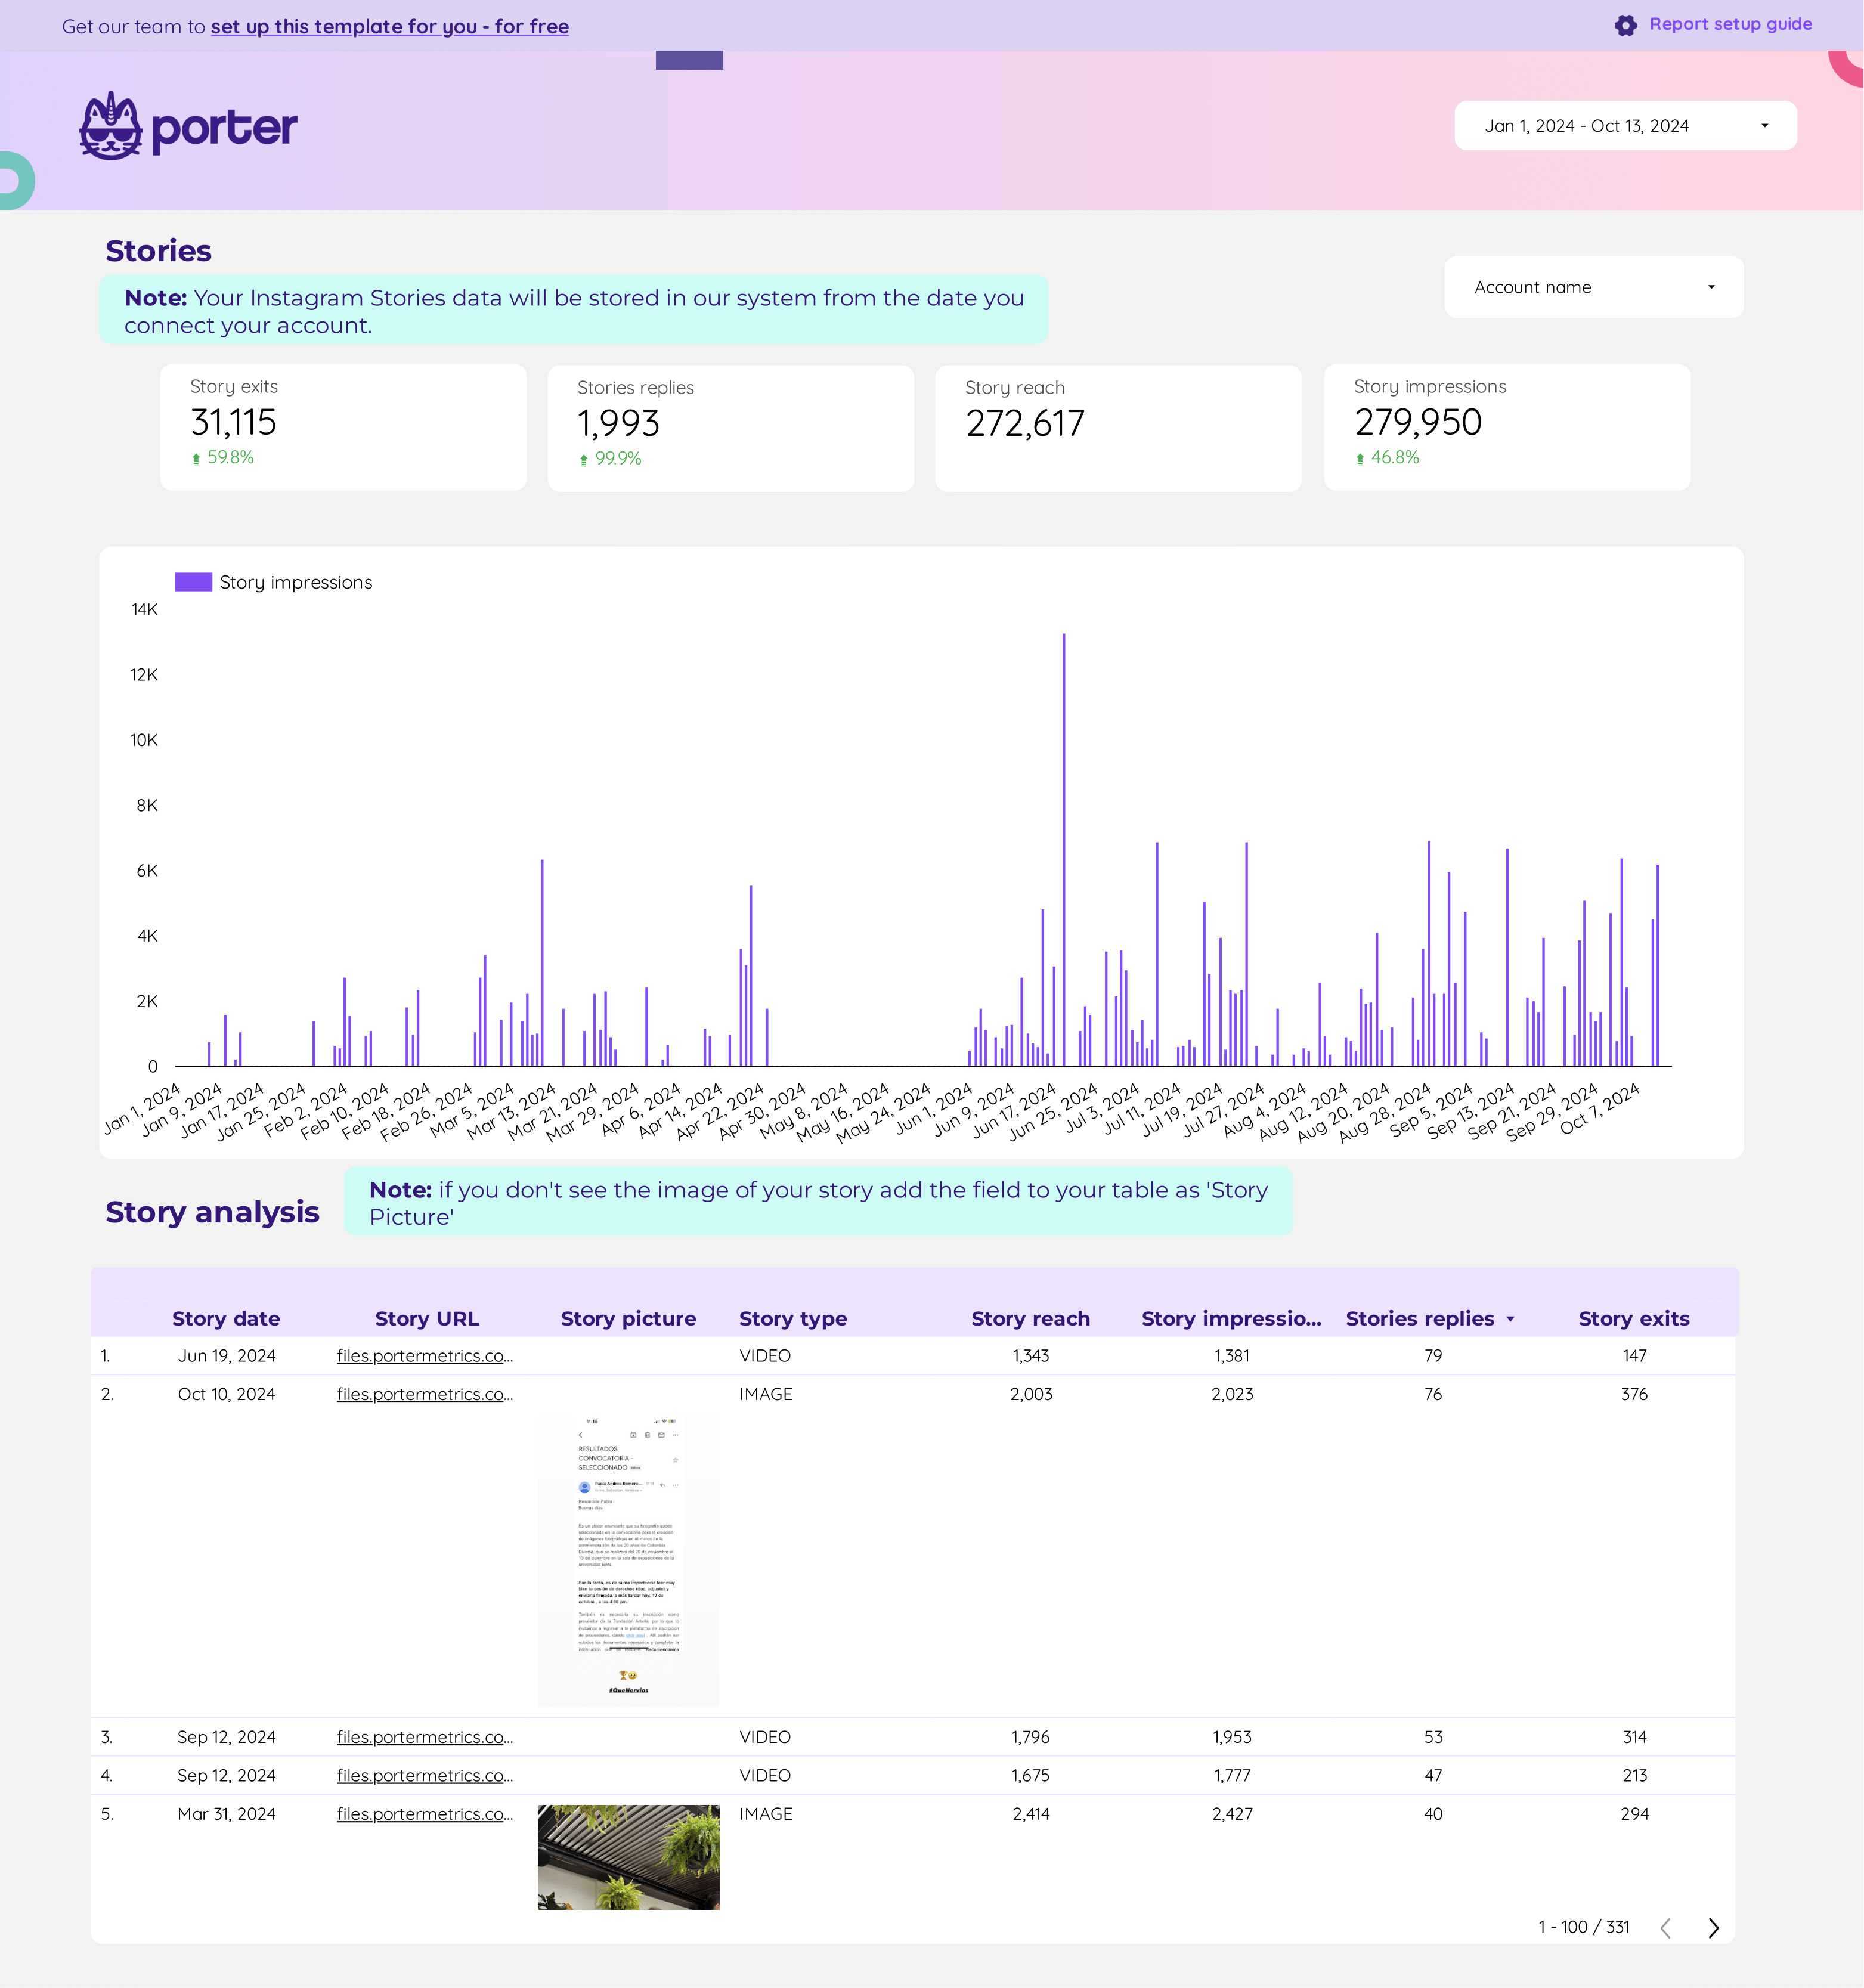
Instagram Insights Stories Report template for Data Studio by Porter
Mide Story reach, impressions → tap-forward, tap-back, replies → swipe-ups, completion rate. Segmenta por day, story type, sticker.
Social Media competitors Report template for Data Studio by Porter
Mide competitor followers, reach → engagement rate benchmarks → share of voice, growth gap. Segmenta por competitor, platform.
Social Media Client presentation Report template for Data Studio by Porter
Mide client social reach → client engagement benchmarks → social-driven leads. Segmenta por client, platform, content.
Instagram Insights KPIs Report template for Data Studio by Porter
Mide follower growth, reach trends → engagement rate vs target → profile actions, website clicks. Segmenta por KPI, period, post type.
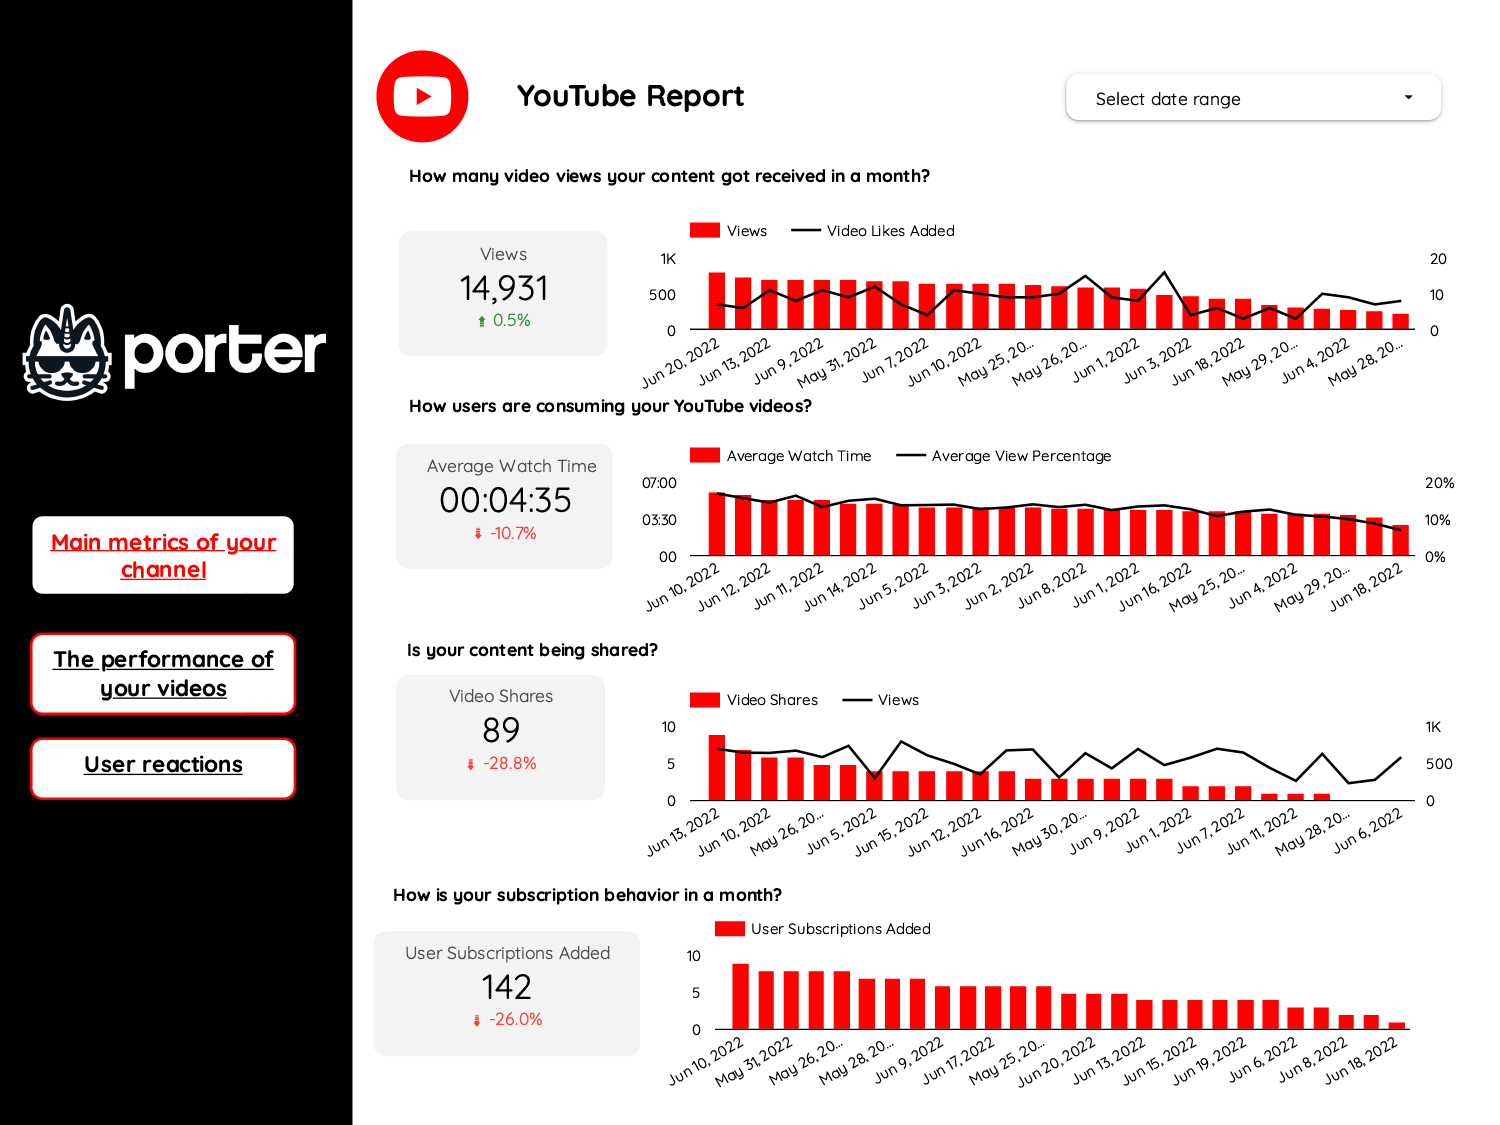
Youtube Report template for Data Studio by Porter
Mide views, impressions, subscribers → watch time, CTR, likes → subscriber growth, end screens. Segmenta por video, traffic source.
Instagram Insights Hashtags Report template for Data Studio by Porter
Mide hashtag reach, impressions → engagement by hashtag set → discovery rate from hashtags. Segmenta por hashtag, post, reach source.
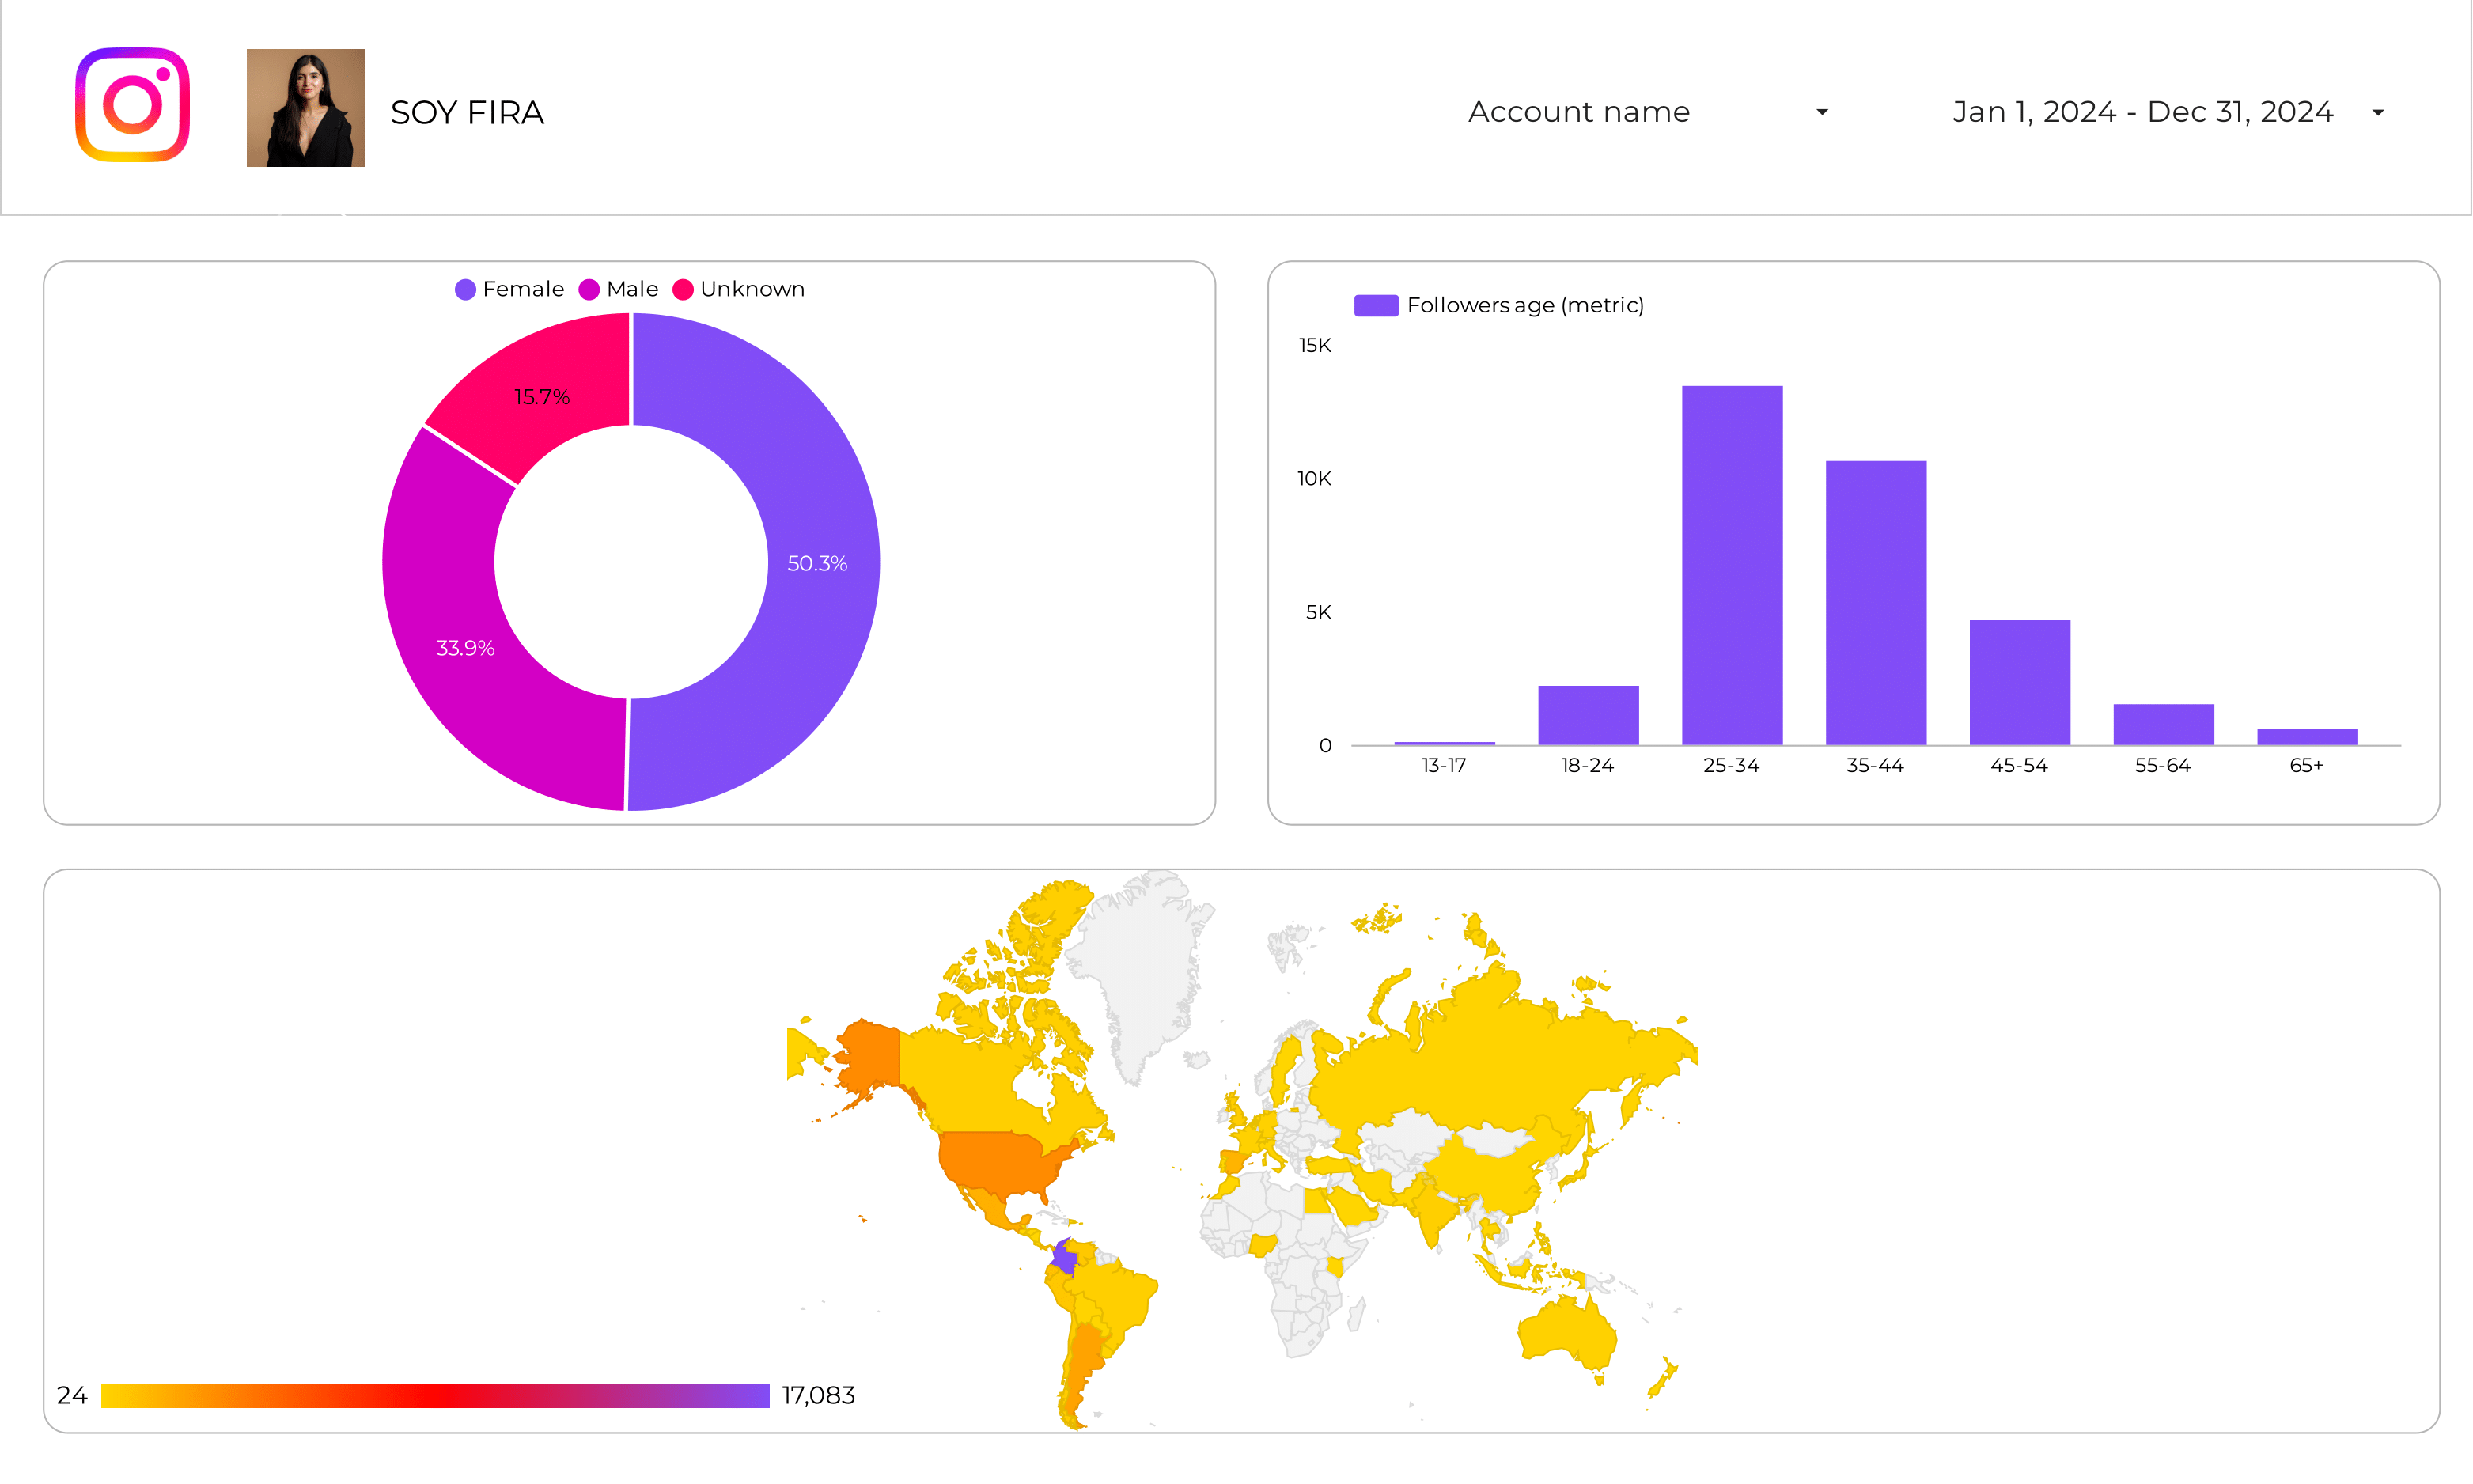
Instagram Insights Audience Report template for Data Studio by Porter
Mide audience size, demographics → engagement by segment → conversion rate by demographic. Segmenta por age, gender, city.
Content performance Report template for Data Studio by Porter
Mide post reach, impressions → engagement rate, shares, saves → click-through rate, content ROI. Segmenta por format, topic, platform.
Brand awareness Report template for Data Studio by Porter
Mide brand impressions, reach, SOV → brand mentions, sentiment → branded search, direct traffic. Segmenta por channel, competitor.
Community manager Report template for Data Studio by Porter
Mide community size, reach → response rate, comments, DMs → community conversions. Segmenta por platform, content type.
Video marketing Report template for Data Studio by Porter
Mide video views, reach → watch time, completion rate → CTA clicks, subscriber growth. Segmenta por platform, video type.
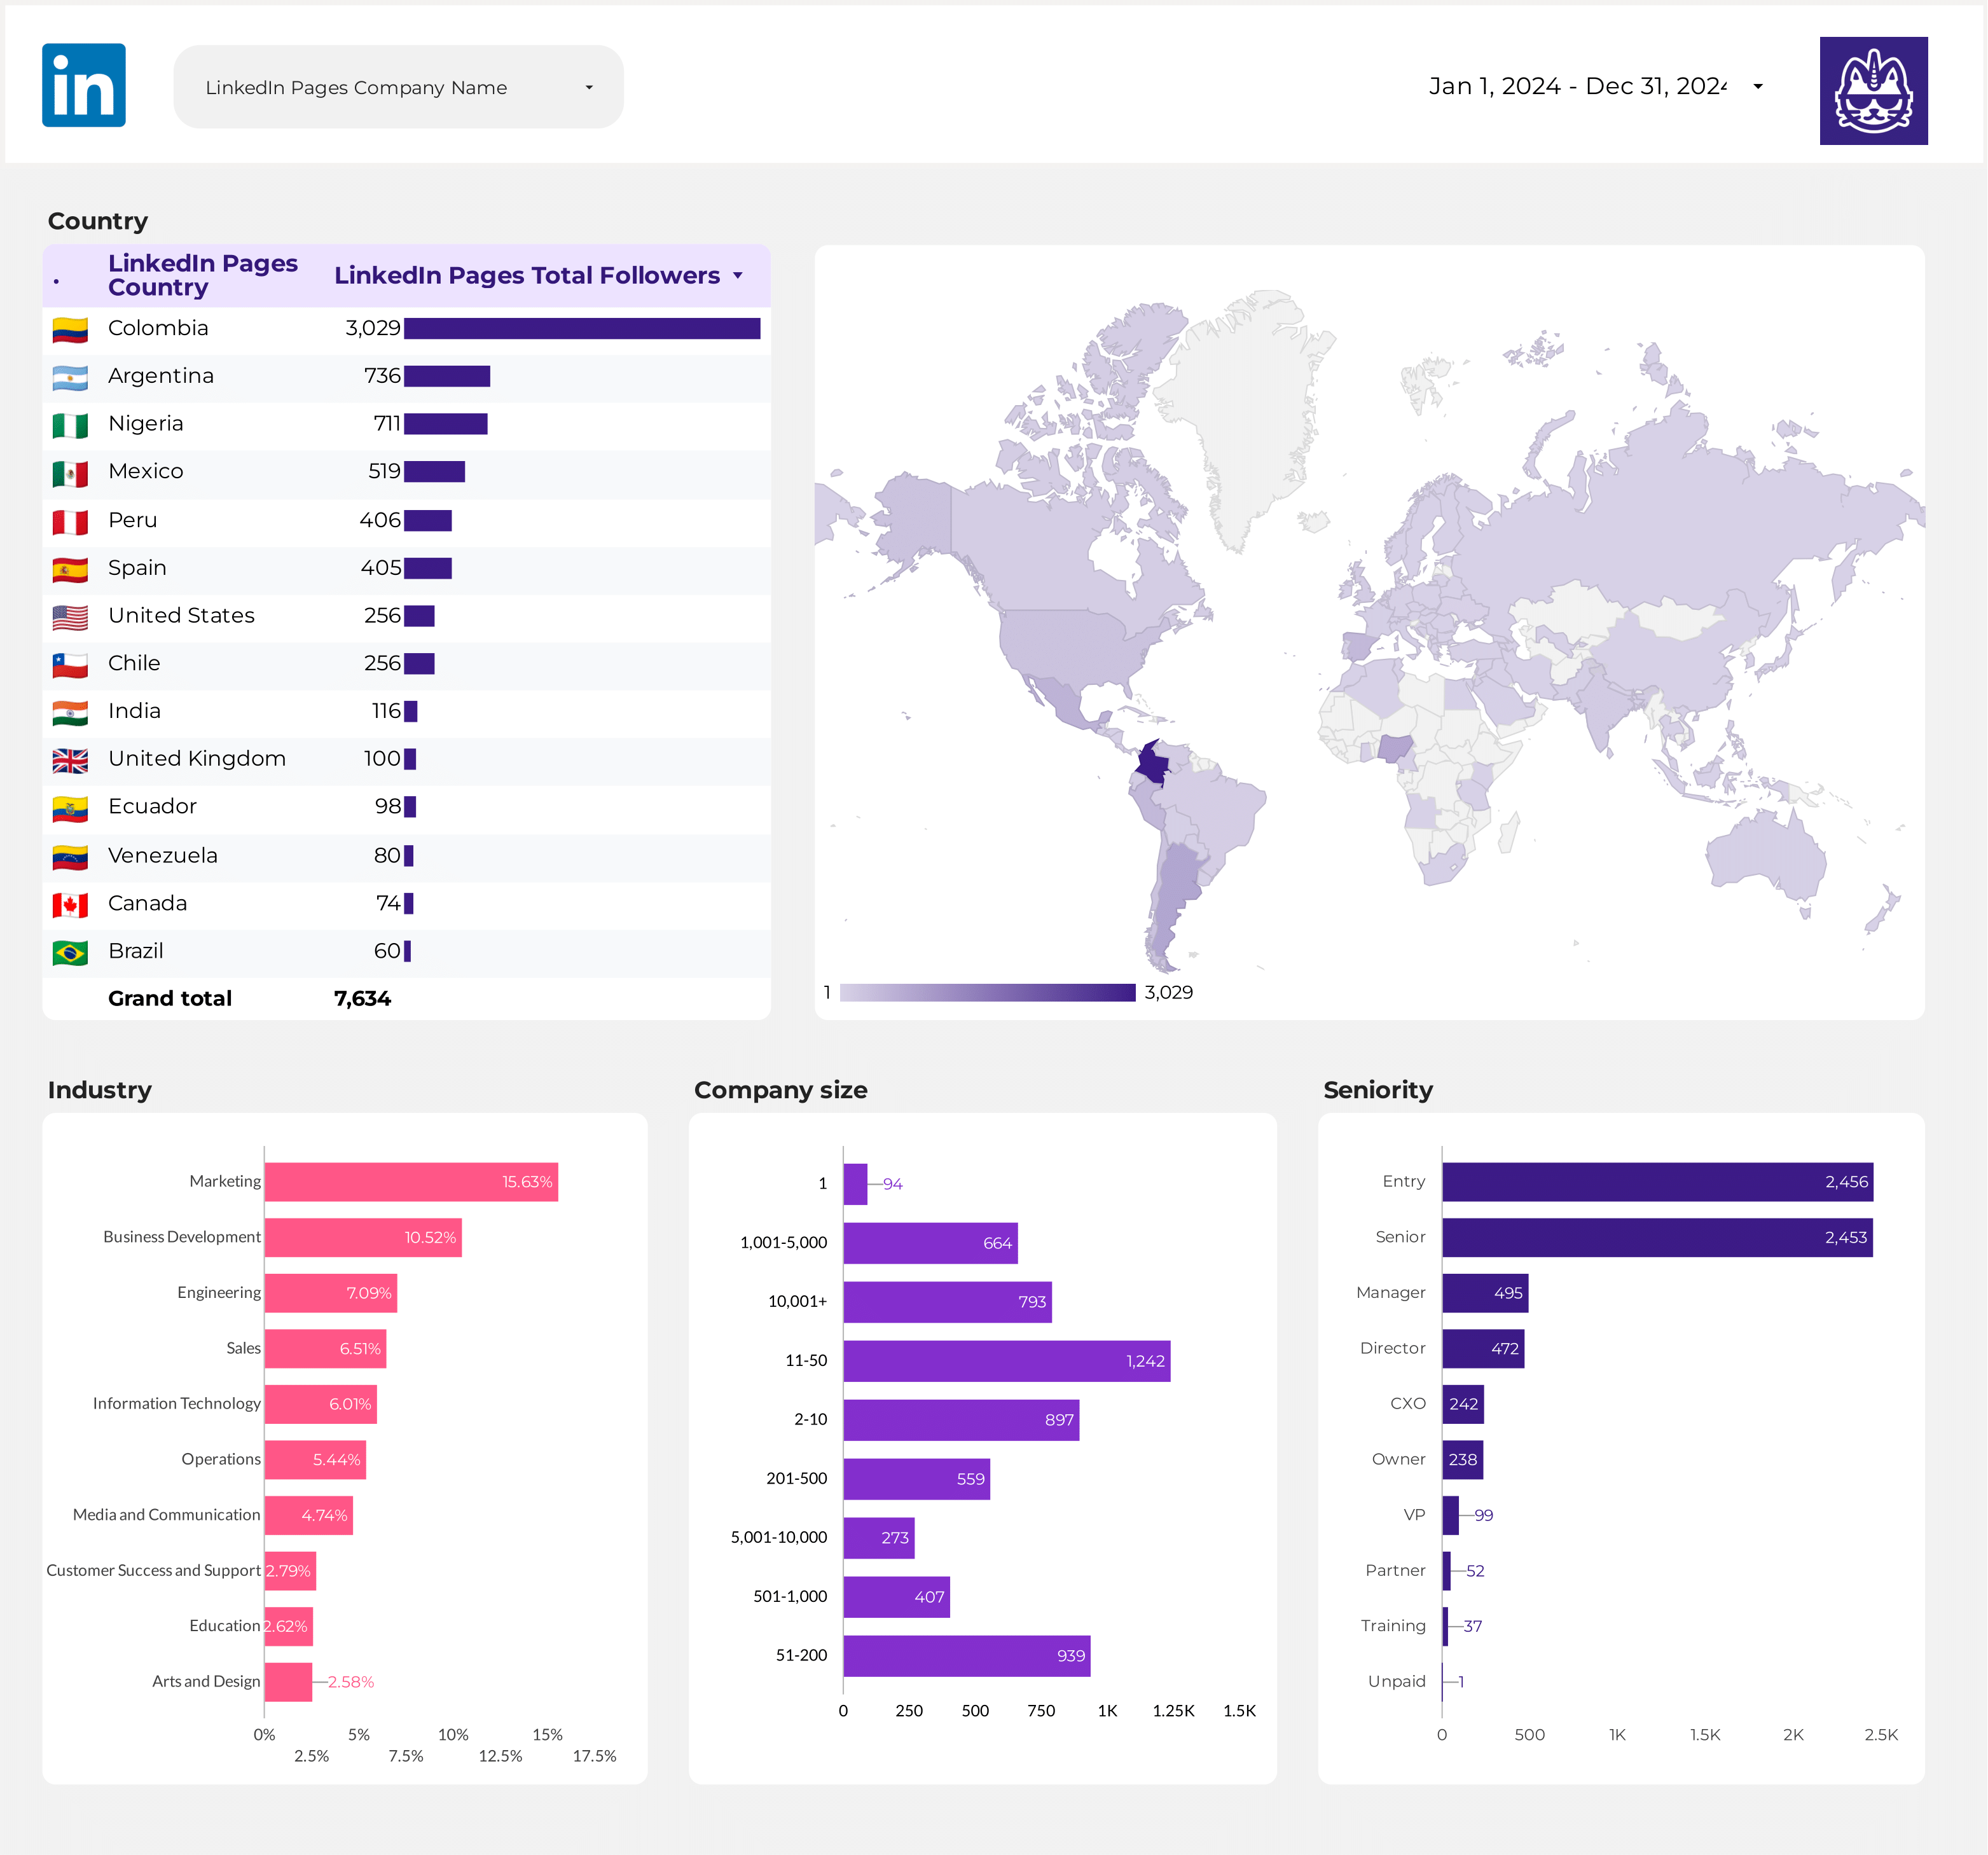
LinkedIn Pages Report template for Data Studio by Porter
Mide page impressions, followers → CTR, engagement rate/post → website visits, lead forms. Segmenta por post type, seniority.
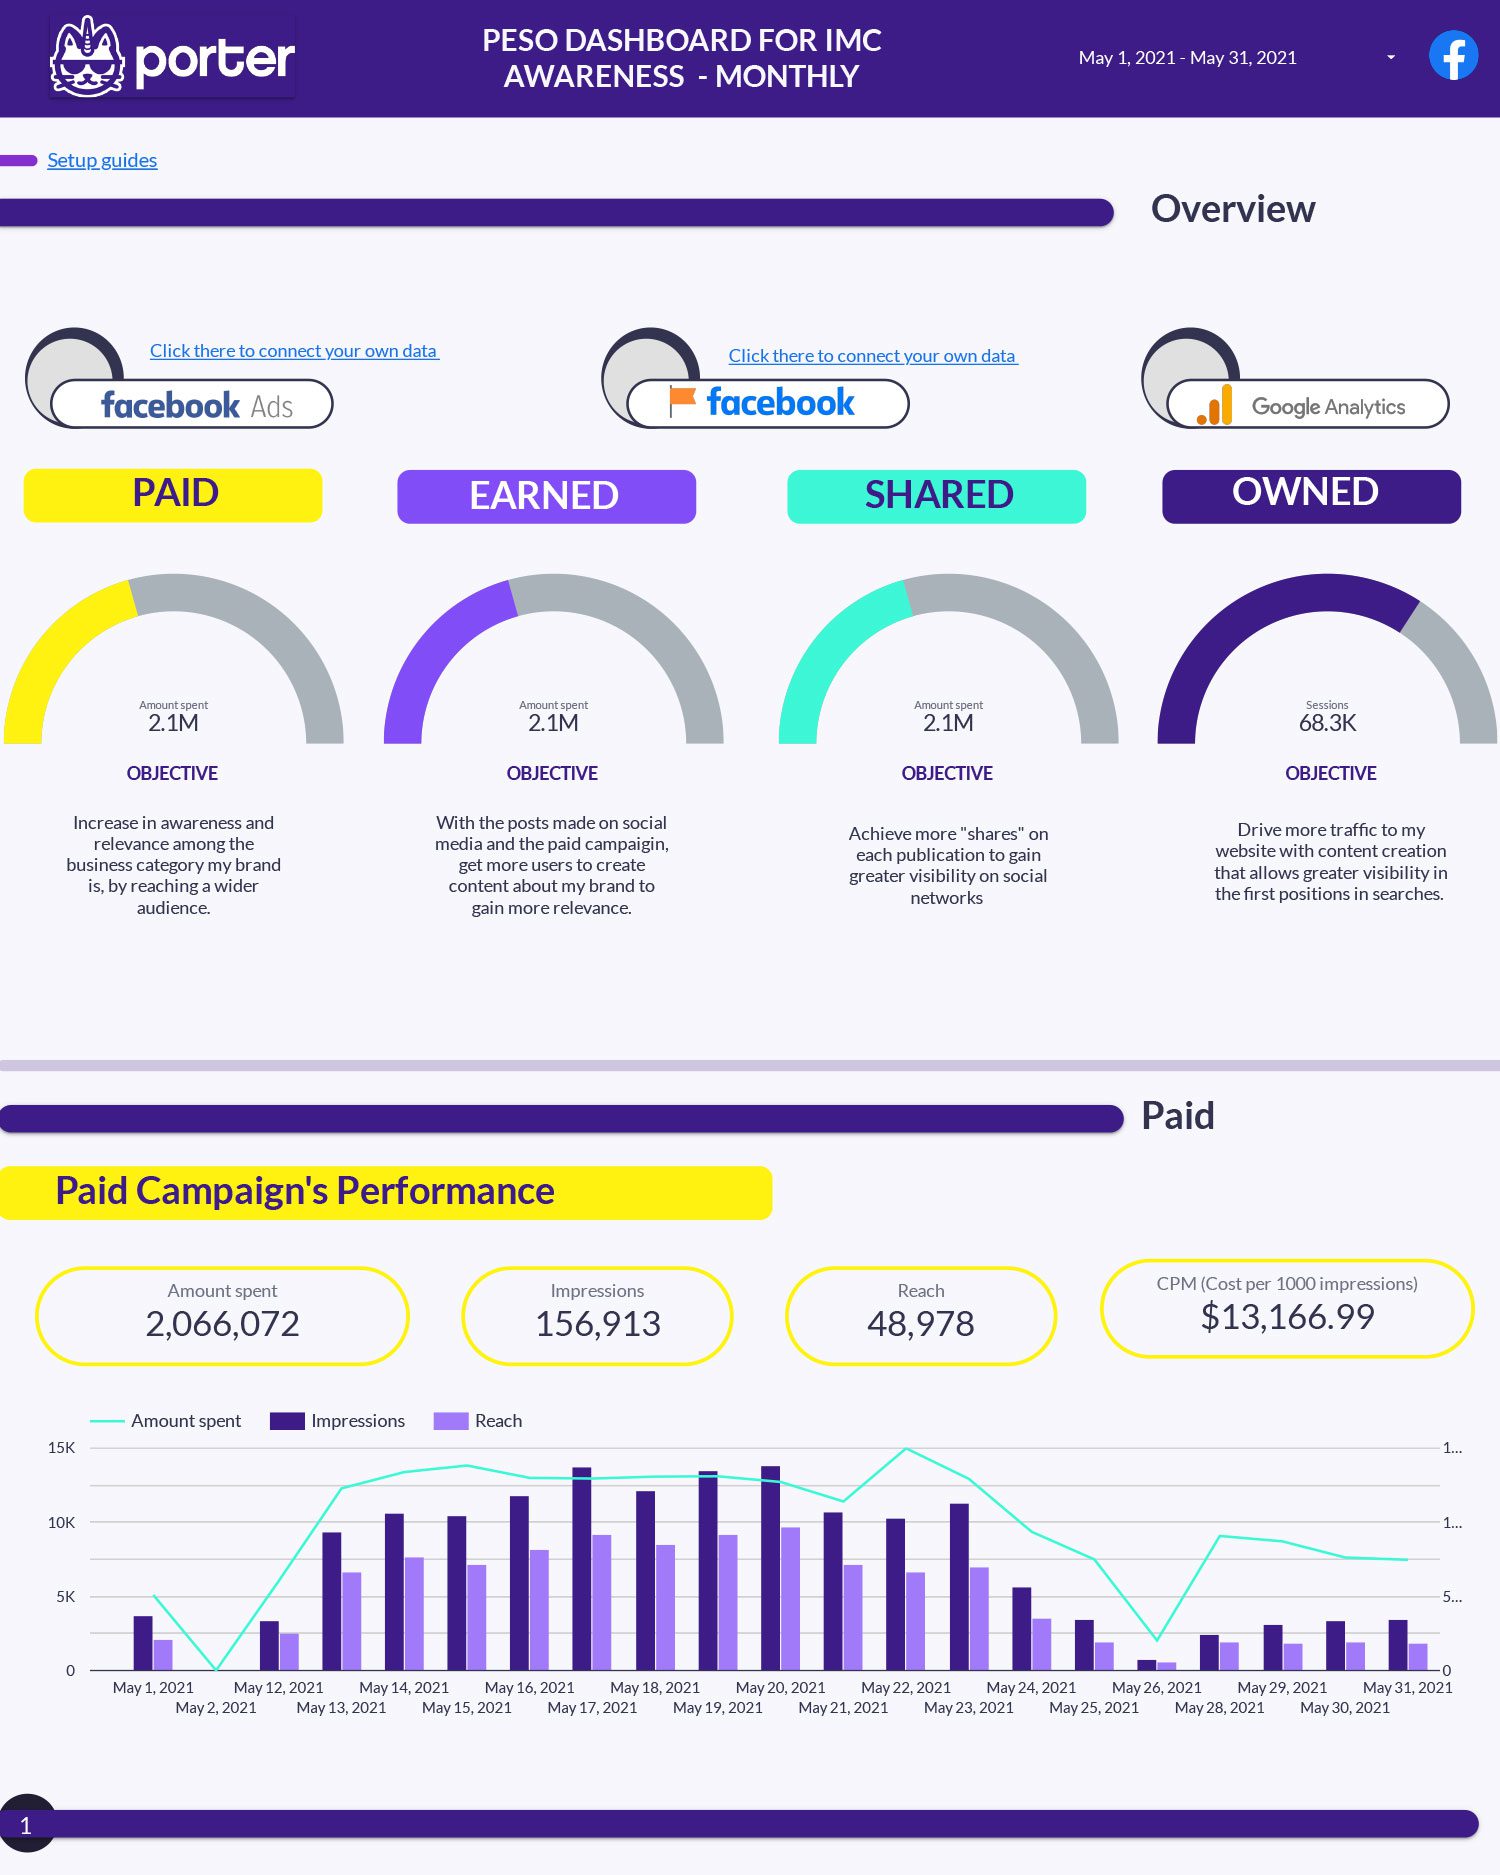
Peso model Report template for Data Studio by Porter
Mide reach: Paid/Earned/Shared/Owned → engagement by PESO channel → conversions by channel type. Segmenta por PESO type, campaign.
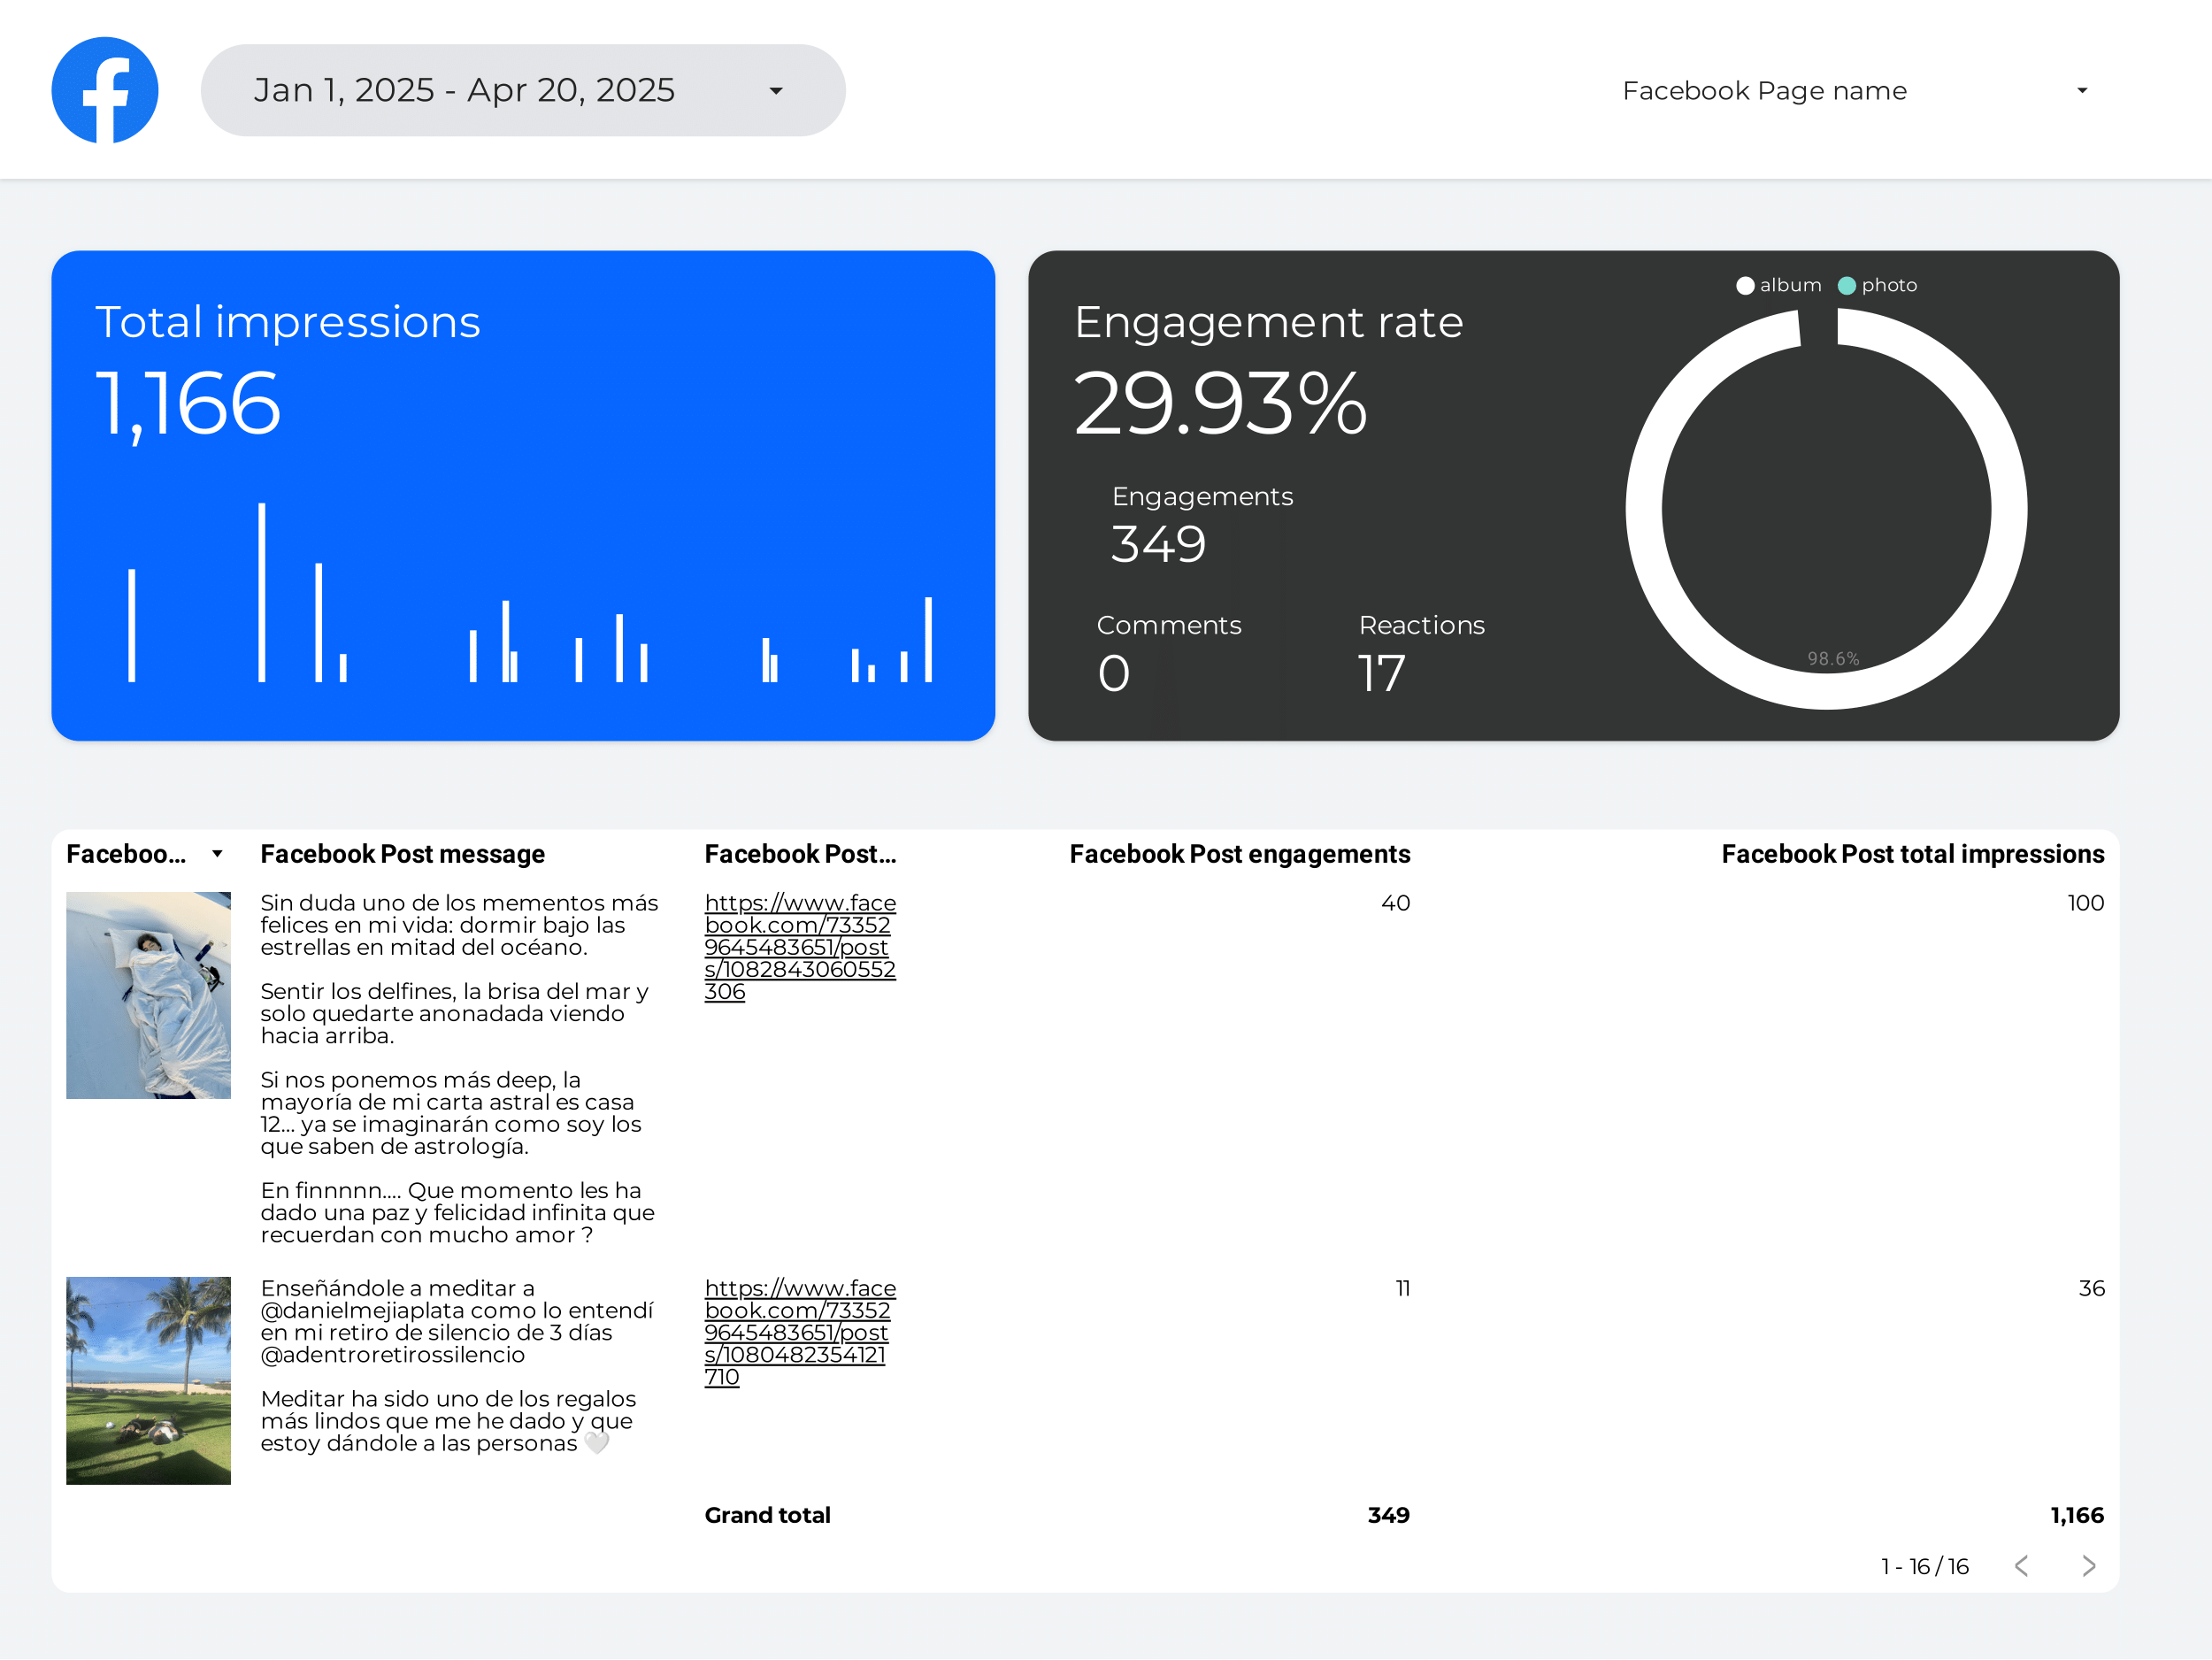
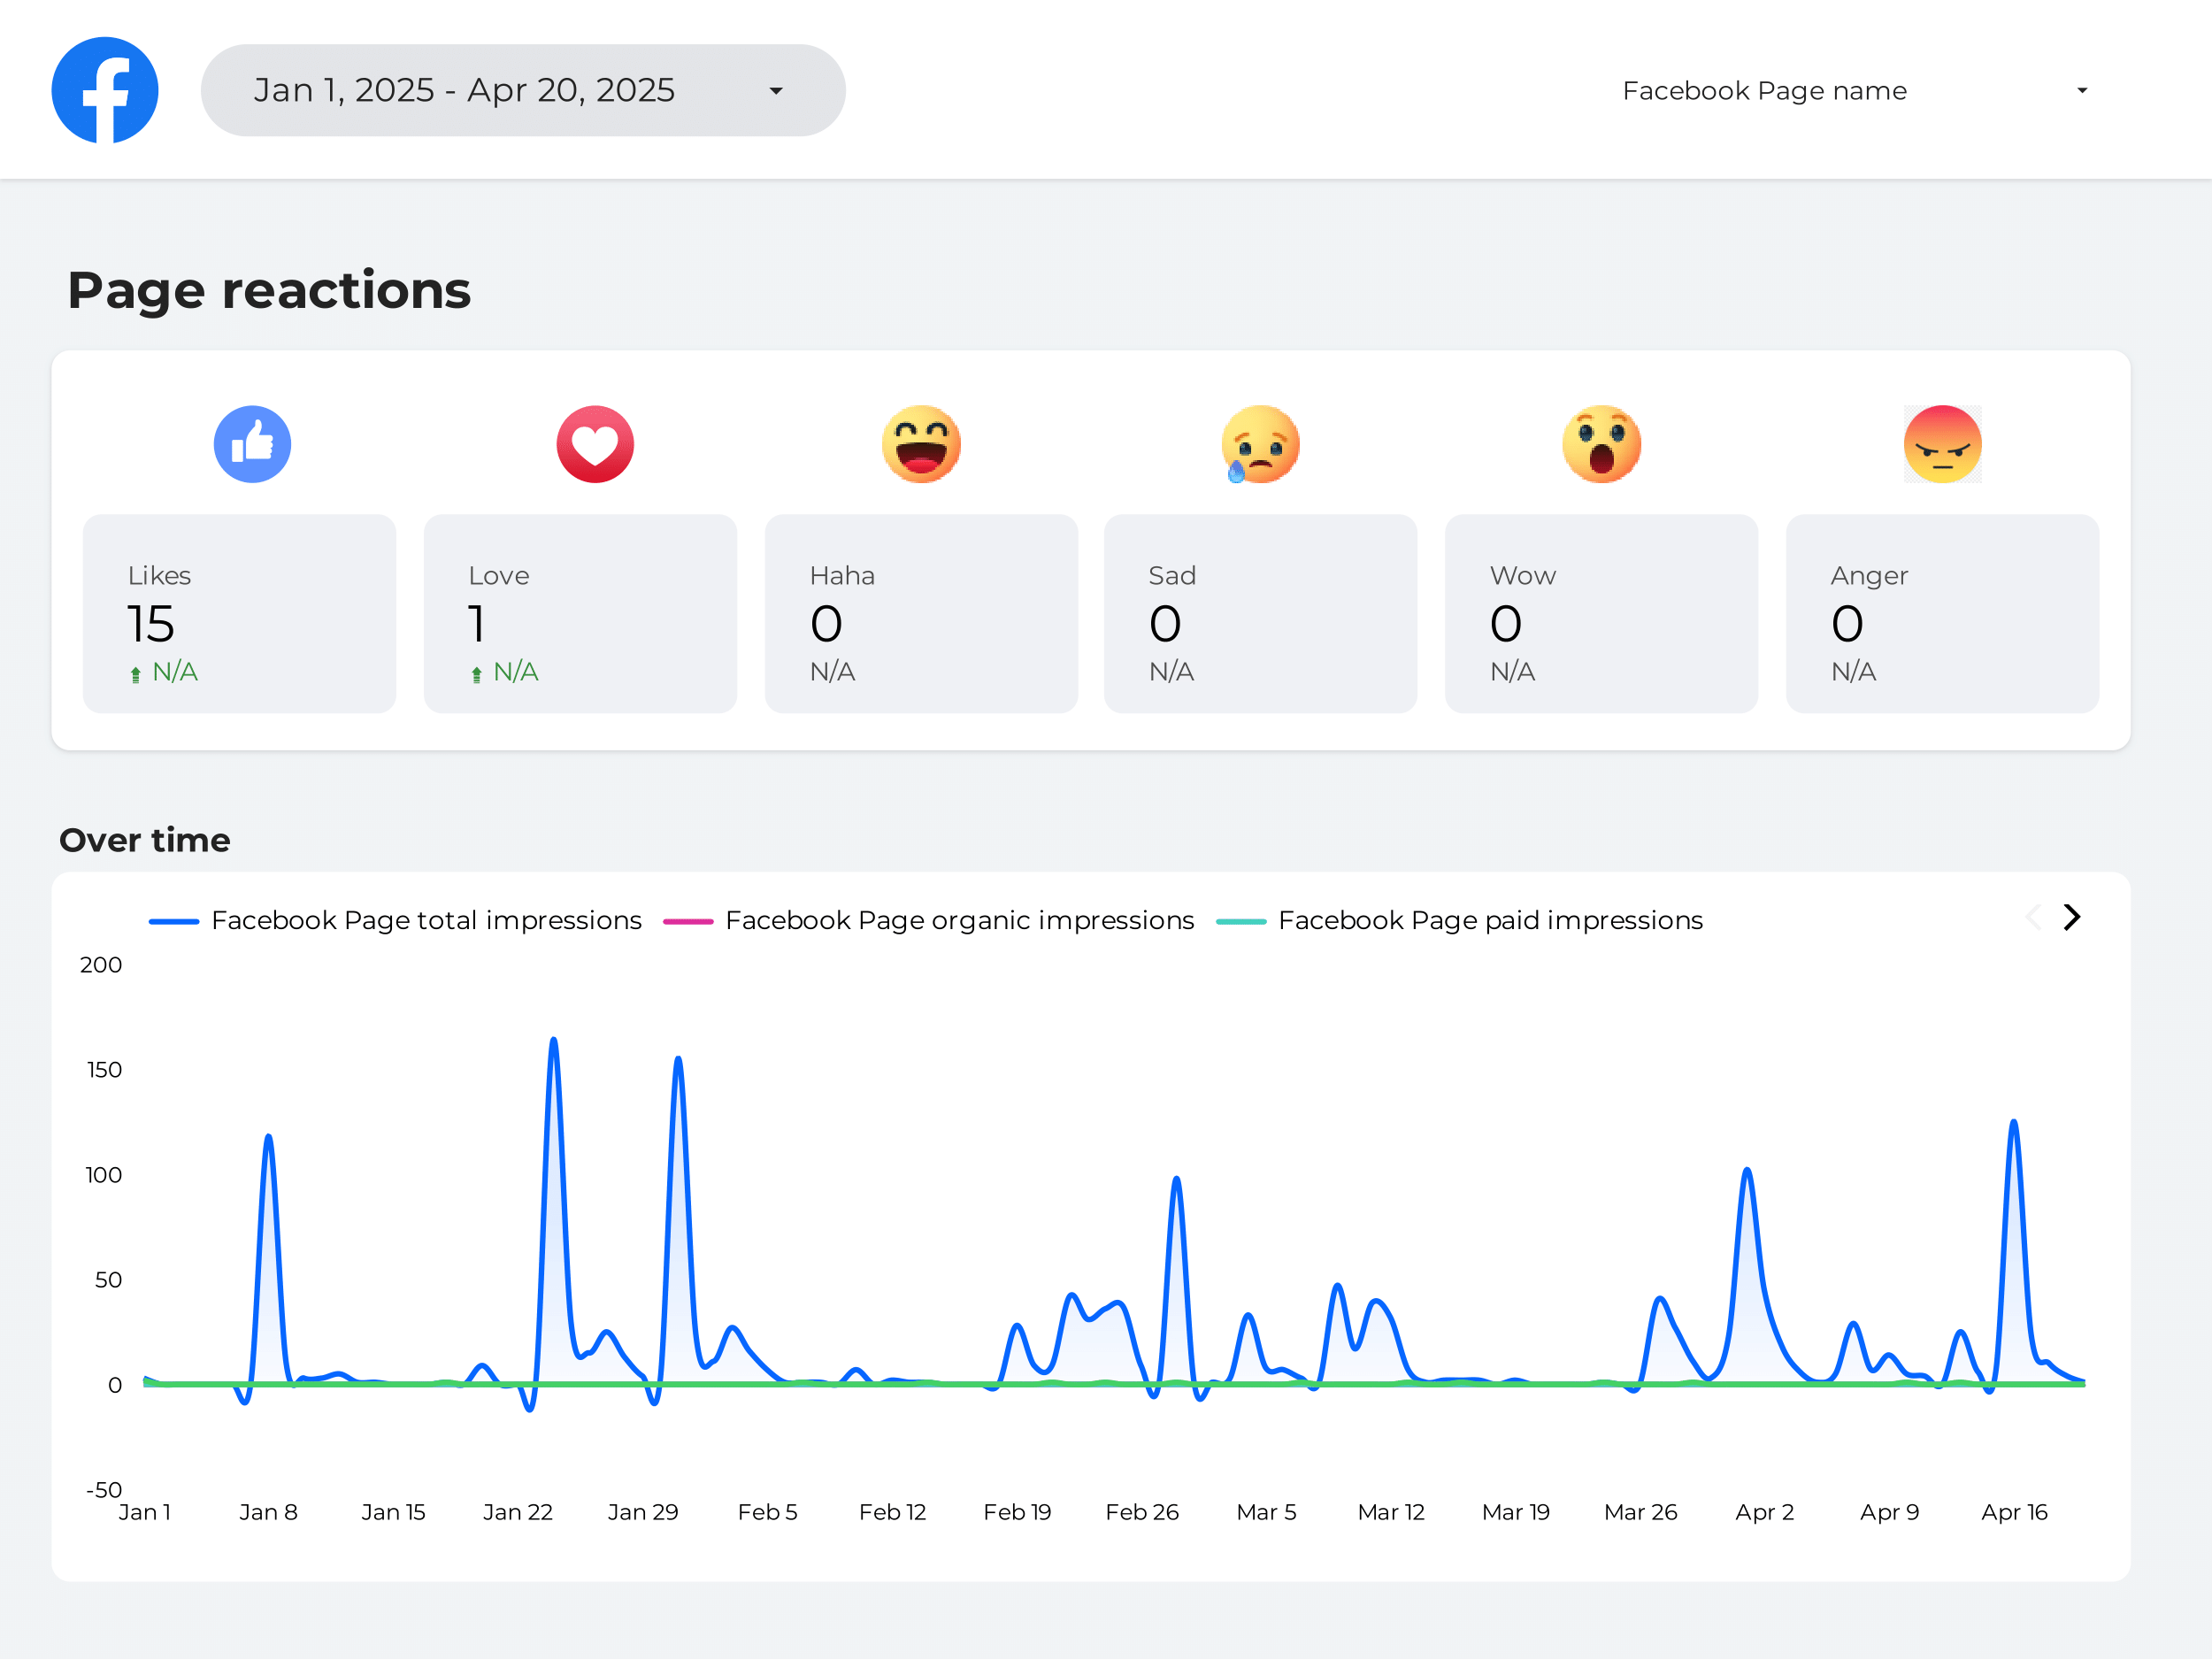
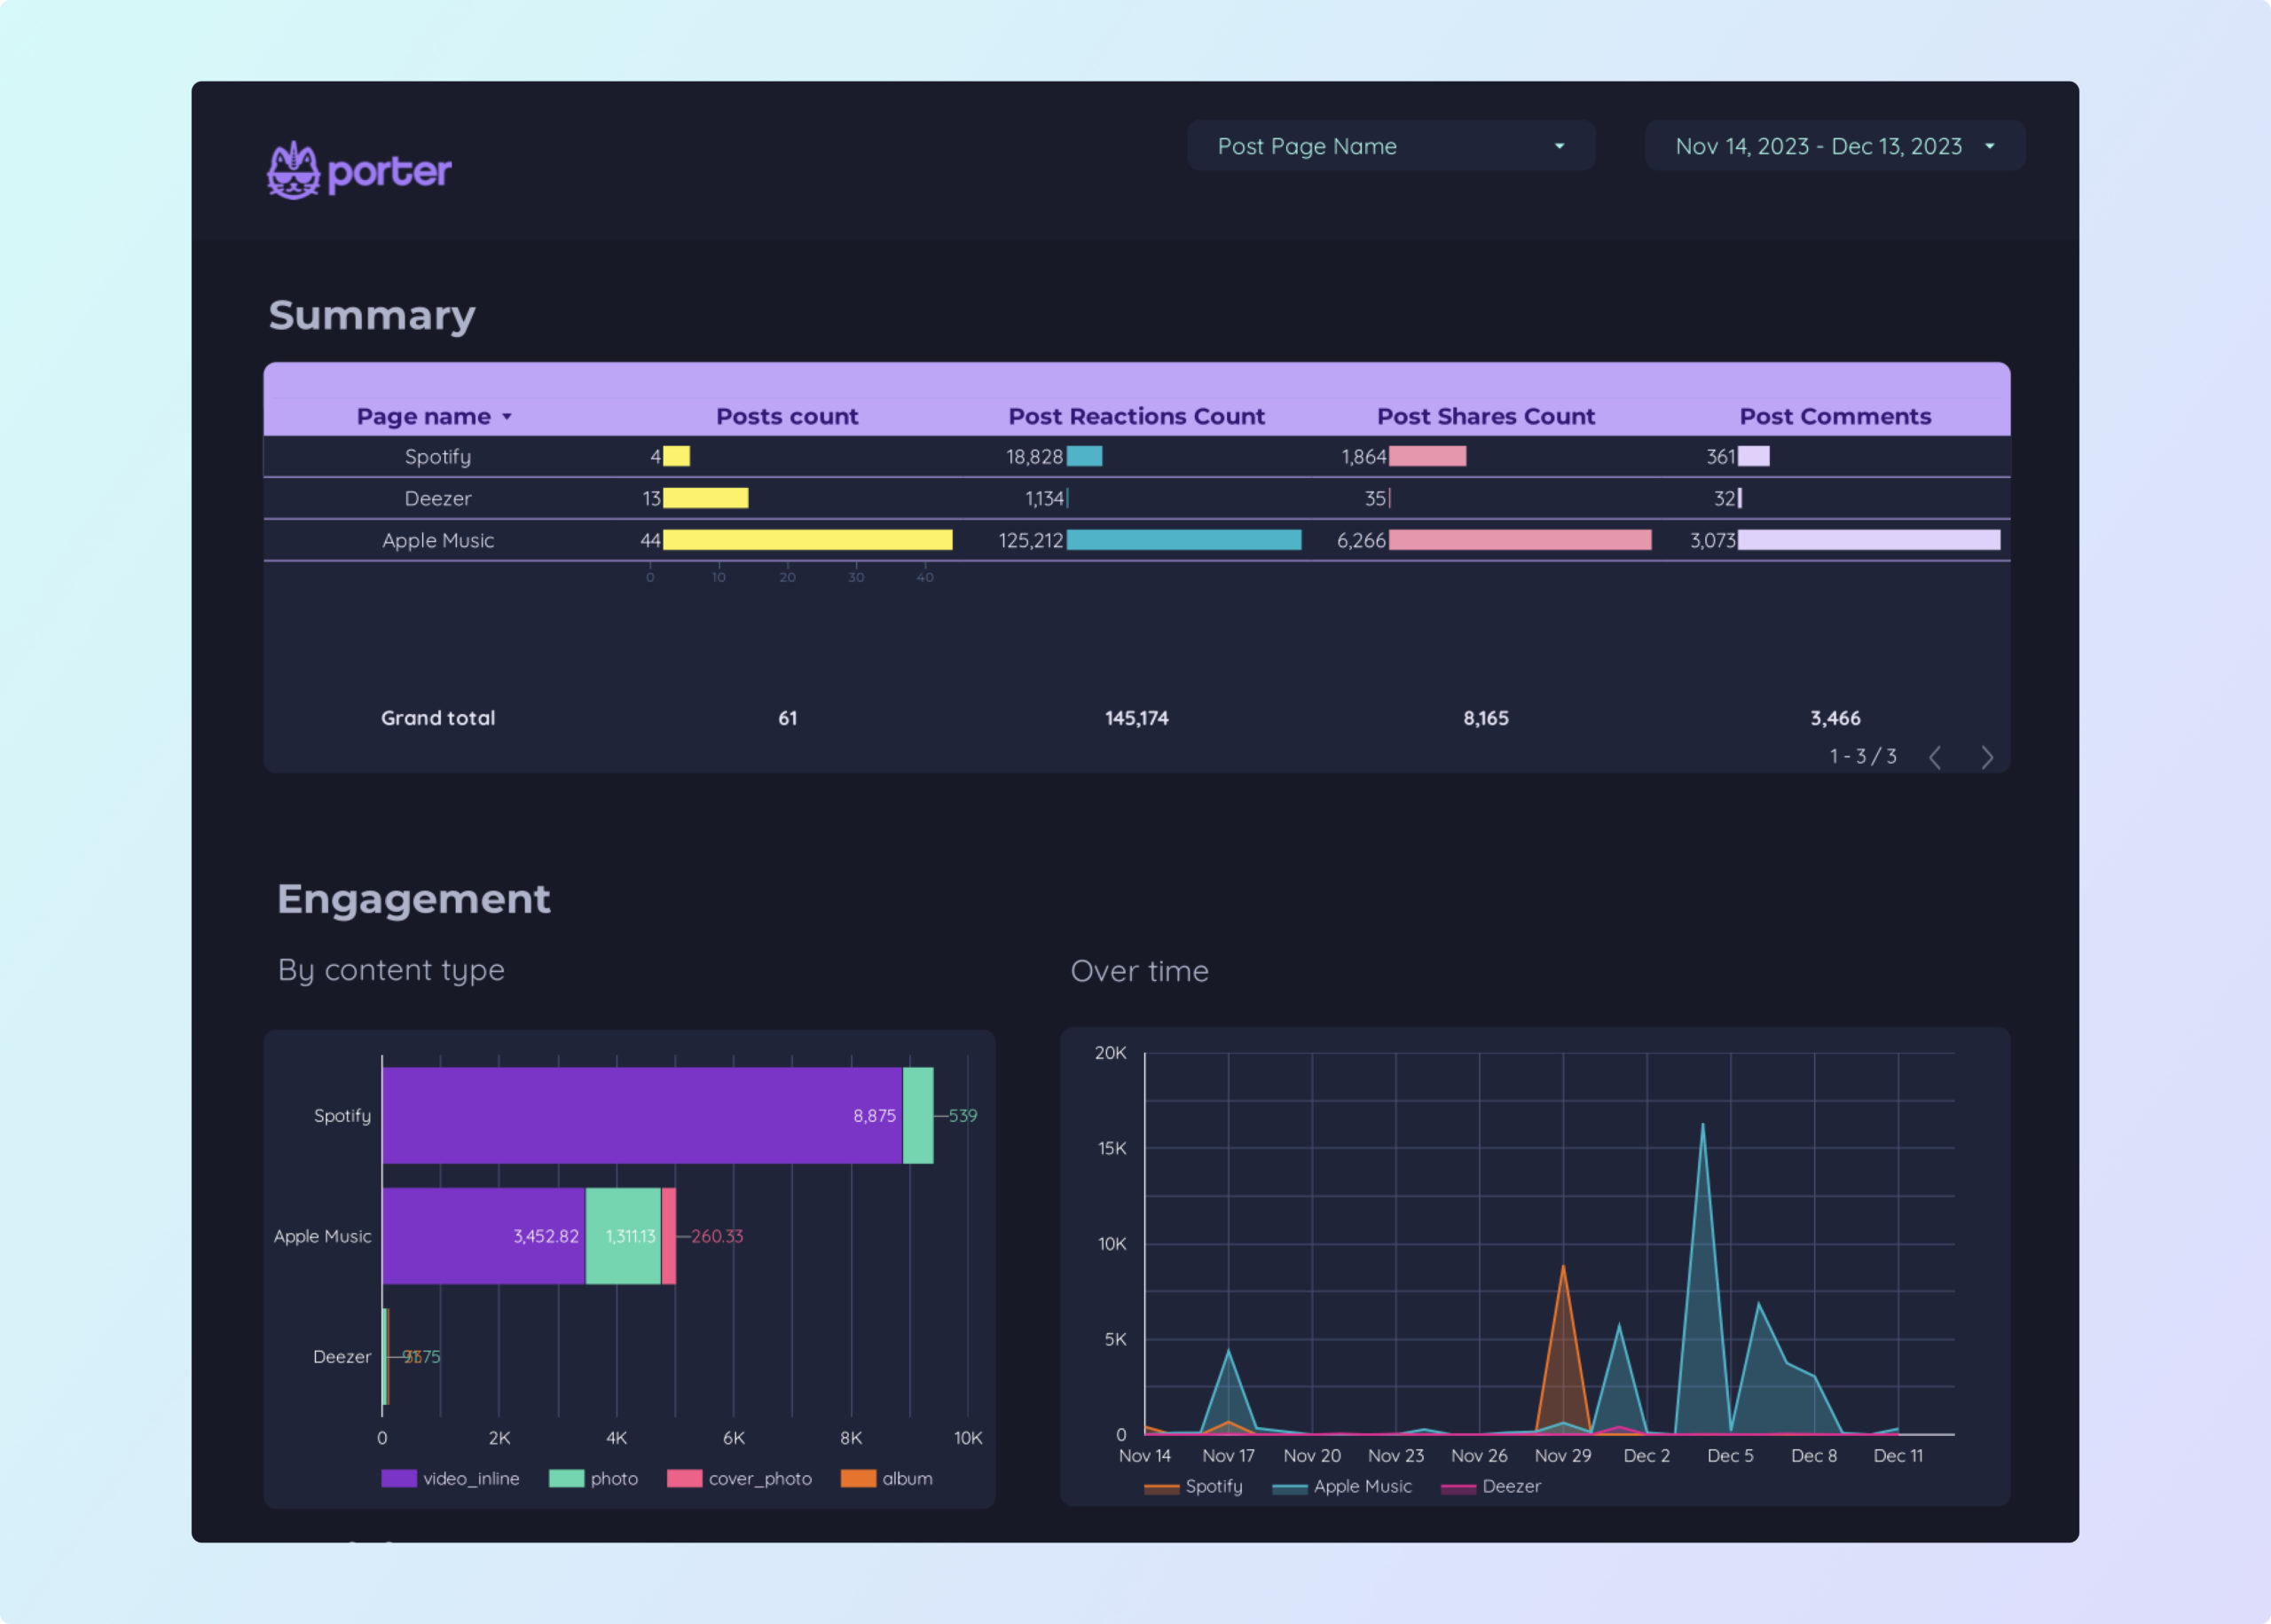
Facebook Insights Report template for Data Studio by Porter
Mide page reach, impressions → reactions, comments, shares → page actions, website clicks. Segmenta por post type, day, demographic.
Facebook Insights competitors Report template for Data Studio by Porter
Mide page reach, impressions → reactions, comments, shares → page actions, website clicks. Segmenta por post type, day, demographic.
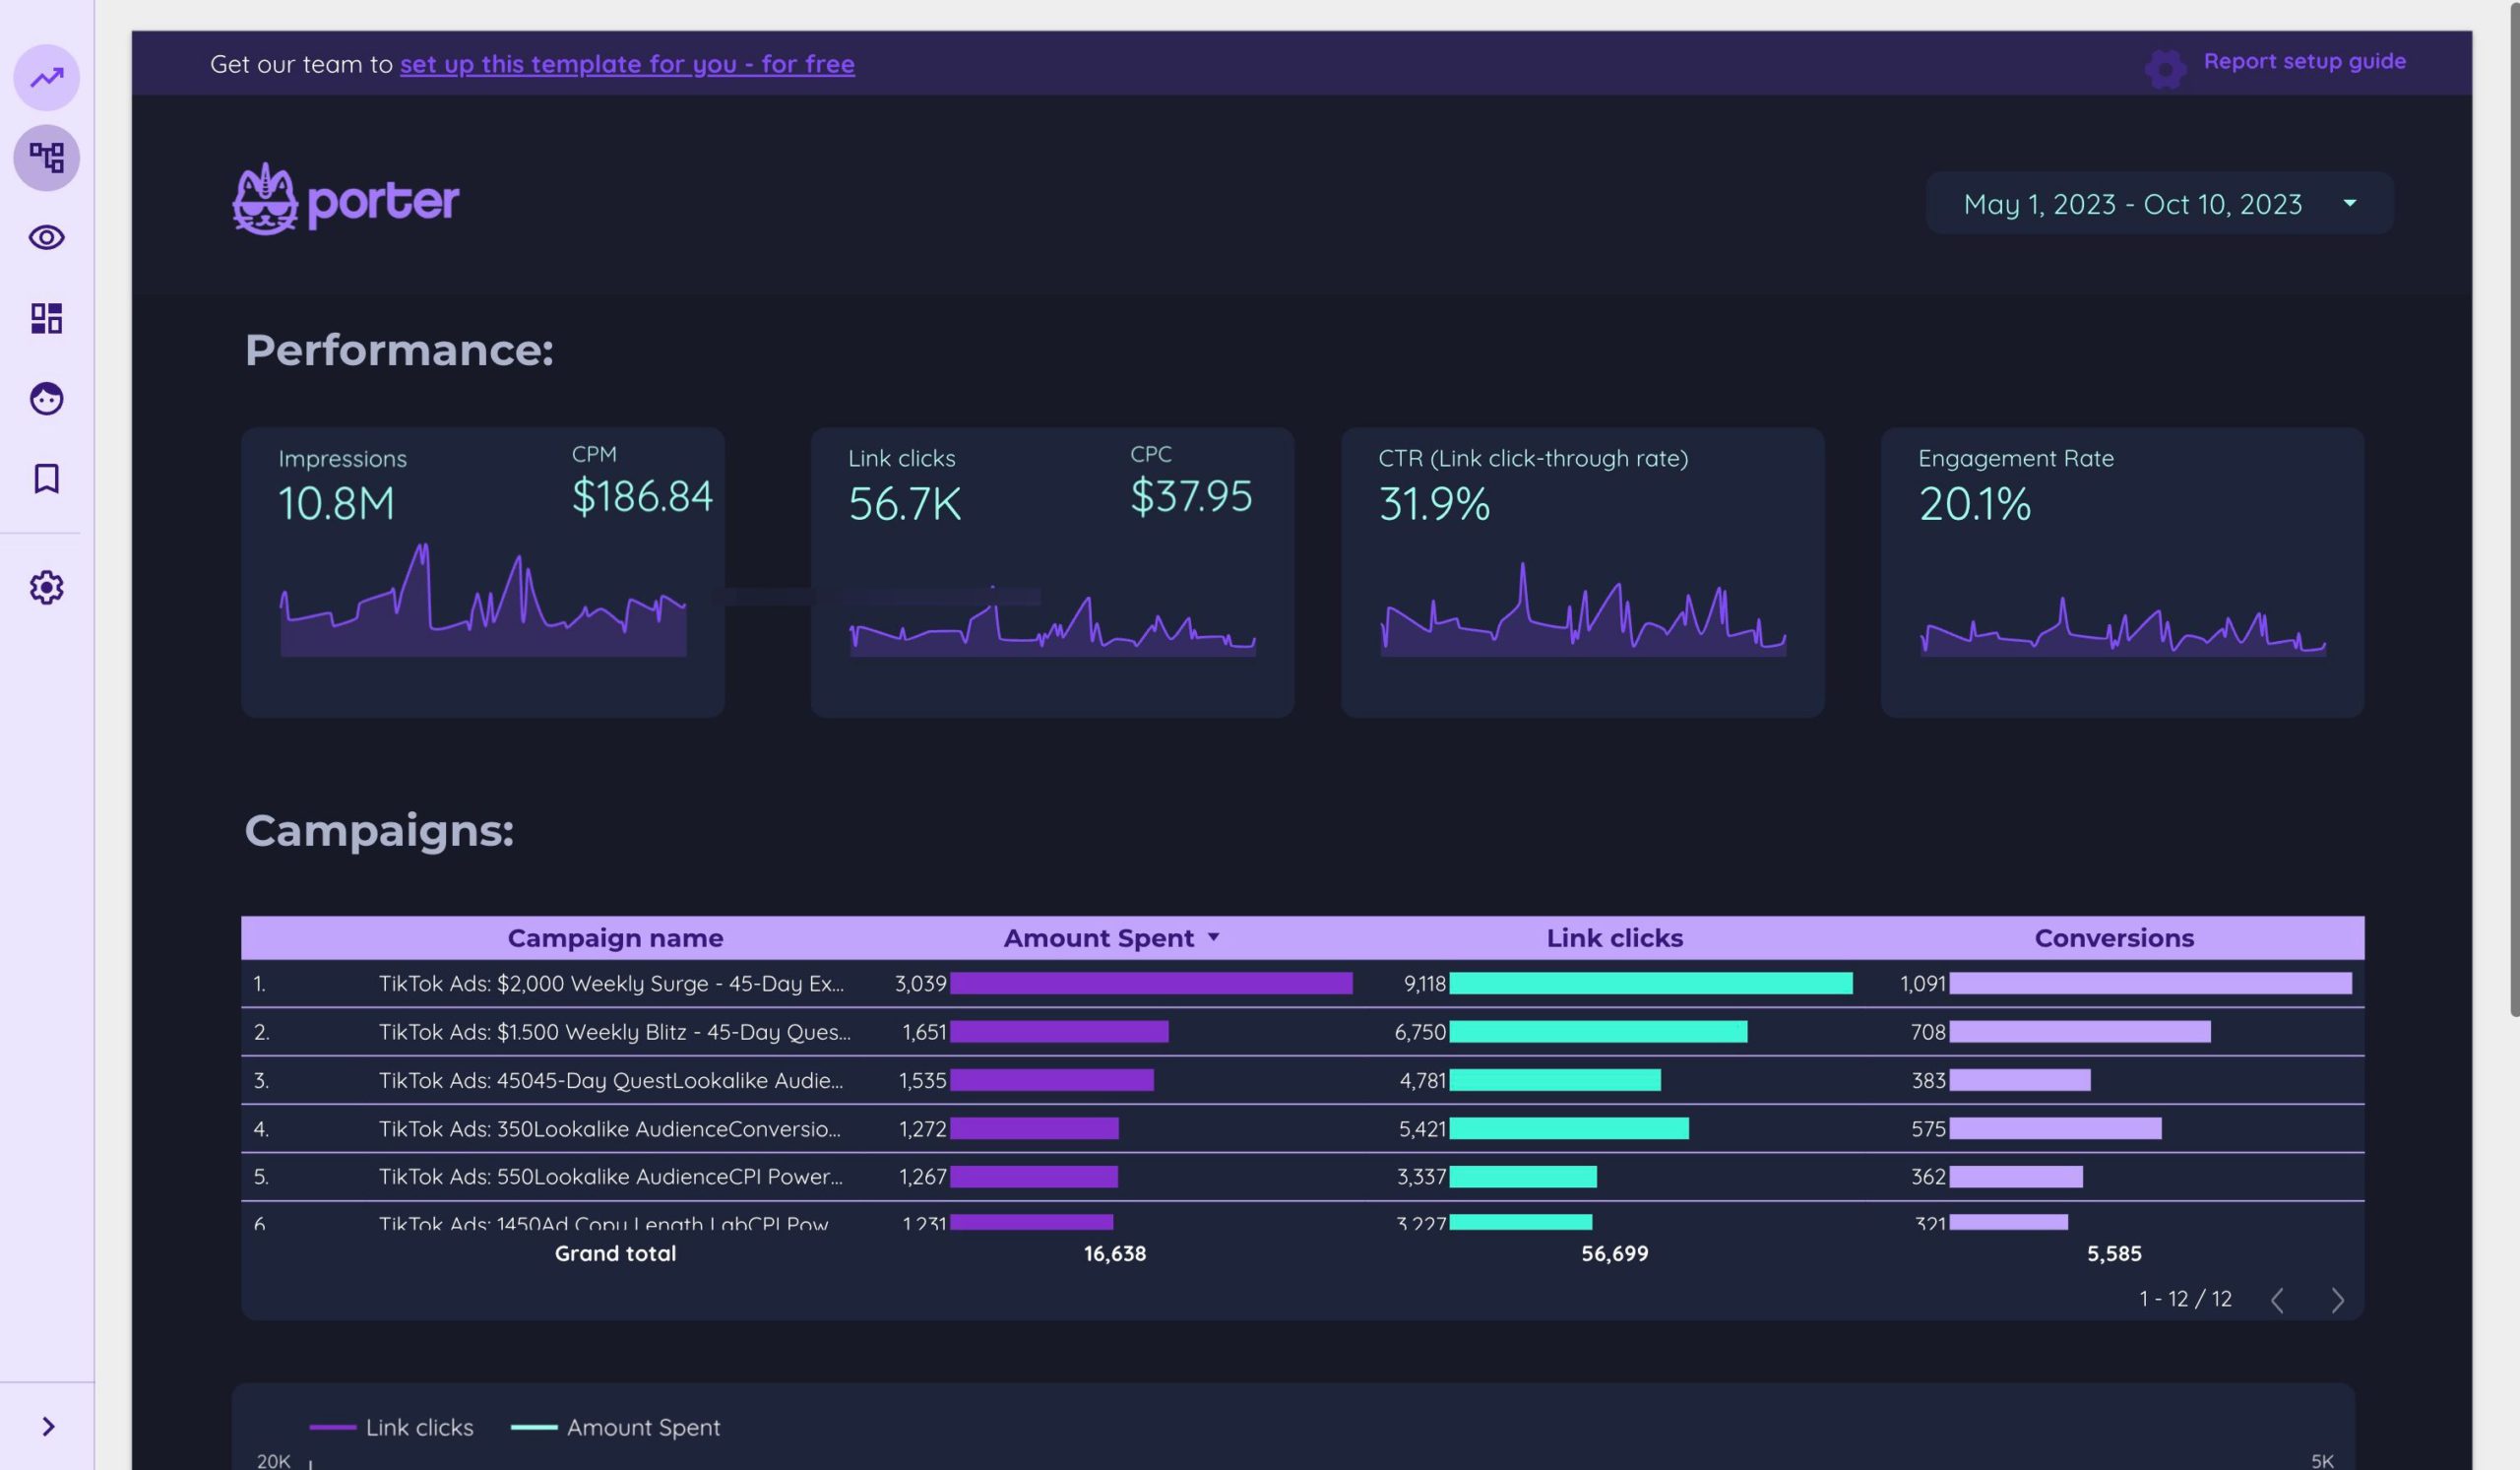
TikTok Ads Report template for Data Studio by Porter
Mide video views, reach → VTR, CTR, engagement rate → conversions, ROAS, CPA. Segmenta por campaign, creative, audience.
What is an influencer marketing dashboard?
An influencer marketing dashboard on Data Studio tracks your influencer campaigns across Instagram, TikTok, YouTube, and other platforms. Monitor engagement, reach, and campaign ROI.
These free influencer dashboard templates for Data Studio connect to your data sources and update automatically. These templates cover popular search terms like influencer marketing platform, influencer database, how to track influencers. Customize any template with your branding, metrics, and filters to create professional influencer reports in minutes.
Mide influencer ROI: Porter Metrics connects social platforms to track influencer campaign performance.
Why use this dashboard?
Campaign tracking
Monitor multiple influencer campaigns and their performance metrics.
Engagement analysis
Mide likes, comments, shares, and saves across influencer content.
Reach and impressions
Measure how many people see your influencer content.
ROI measurement
Calculate cost per engagement, CPM, and overall influencer campaign ROI.
How to build this dashboard

Connect Meta Ads and Google Ads to Data Studio
Porter Metrics
How To Design Marketing Reports on Data Studio
Porter MetricsKey metrics
Reach
- Impressions — total views
- Reach — unique users
- Video views — video content
- Story views — ephemeral content
Engagement
- Likes — positive reactions
- Comments — conversation
- Shares — amplification
- Saves — bookmark rate
Conversion
- Link clicks — traffic driven
- Promo codes used — direct attribution
- Sales — revenue generated
- CPE — cost per engagement
Campaign
- Posts delivered — content count
- On time — deadline adherence
- Brand mentions — awareness
- Sentiment — audience reaction
Influencer Dashboard Best Practices
Follow these proven practices to get the most from your influencer dashboard on Data Studio:
- Focus on actionable metrics — Mide leading indicators you can influence (like content published, ad spend, engagement rate) alongside lagging indicators (revenue, conversions) that show results.
- Segmenta your data — Break down influencer metrics by channel, campaign, audience, or time period. Aggregated data hides insights; segmented data reveals opportunities.
- Set up automated reporting — Schedule weekly or monthly reports to stakeholders. Consistent reporting builds trust and keeps teams aligned on influencer goals.
- Compare time periods — Use month-over-month and year-over-year comparisons to account for seasonality and measure real growth in your influencer performance.
- Keep it visual — Use charts for trends, scorecards for KPIs, and tables for detailed breakdowns. The right visualization makes complex influencer data easy to understand.
Mide your influencer campaigns today
Connect social platforms and measure influencer performance on Data Studio. Get started for free →