Cómo crear un reporte de Facebook Competitors en menos de 5 minutos
Para crear un informe de datos de competidores de Facebook, sigue estos pasos:
– Paso 1: Elige las integraciones de datos públicos de Facebook
– Paso 2: Inicia sesión con el Google que usas en Looker Studio
– Paso 3: Inicia sesión con un perfil de Facebook que tenga acceso a al menos una página de negocios de Facebook.
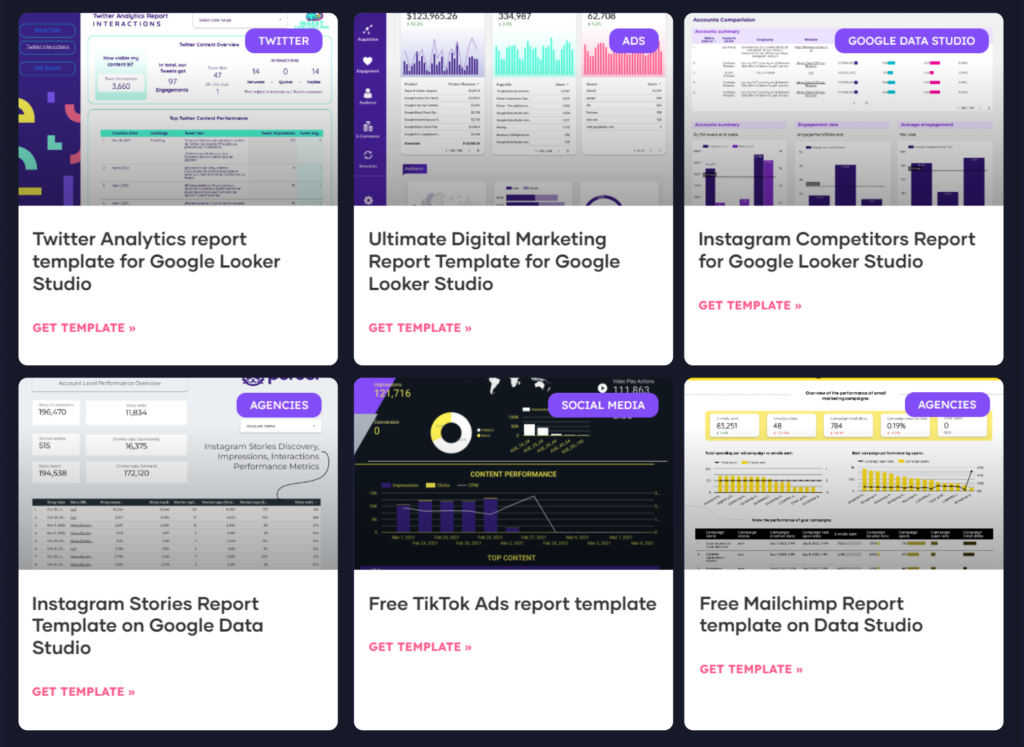
– Paso 4: carga una plantilla de informe predeterminada para monitorear el rendimiento de tus campañas de redes sociales y automatizar tus informes de marketing.
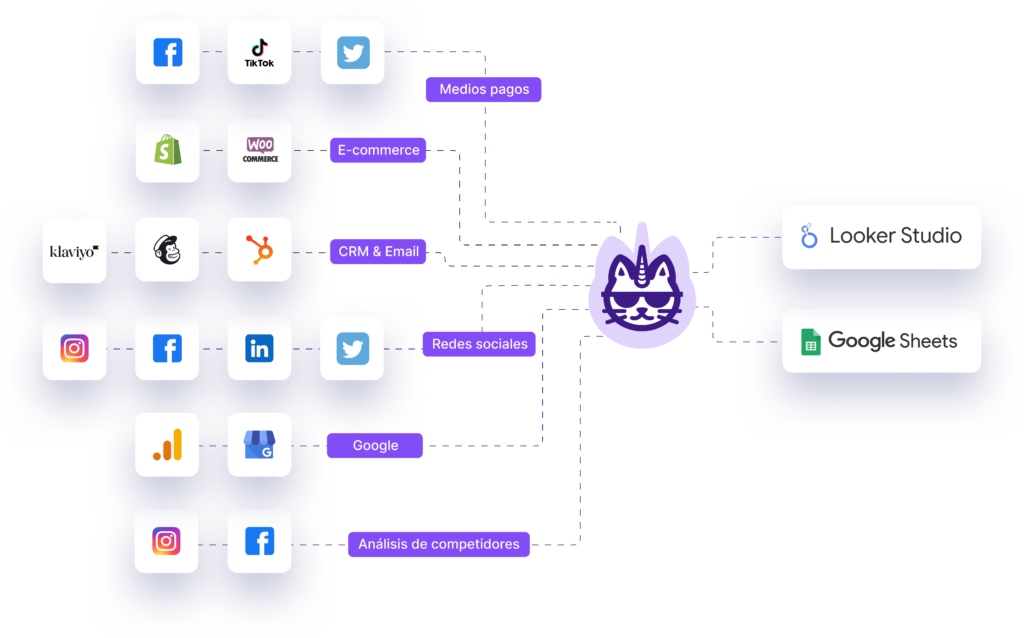
Conecta todos tus datos de marketing una sola vez y permite que se actualicen diariamente en las herramientas que ya conoces
Integraciones y almacenamiento sin necesidad de un ingeniero
Personaliza tus reportes de Facebook Competitors de forma sencilla
Crear tus dashboards de Facebook Competitors en Looker Studio y Google Sheets te da la flexibilidad que necesitas
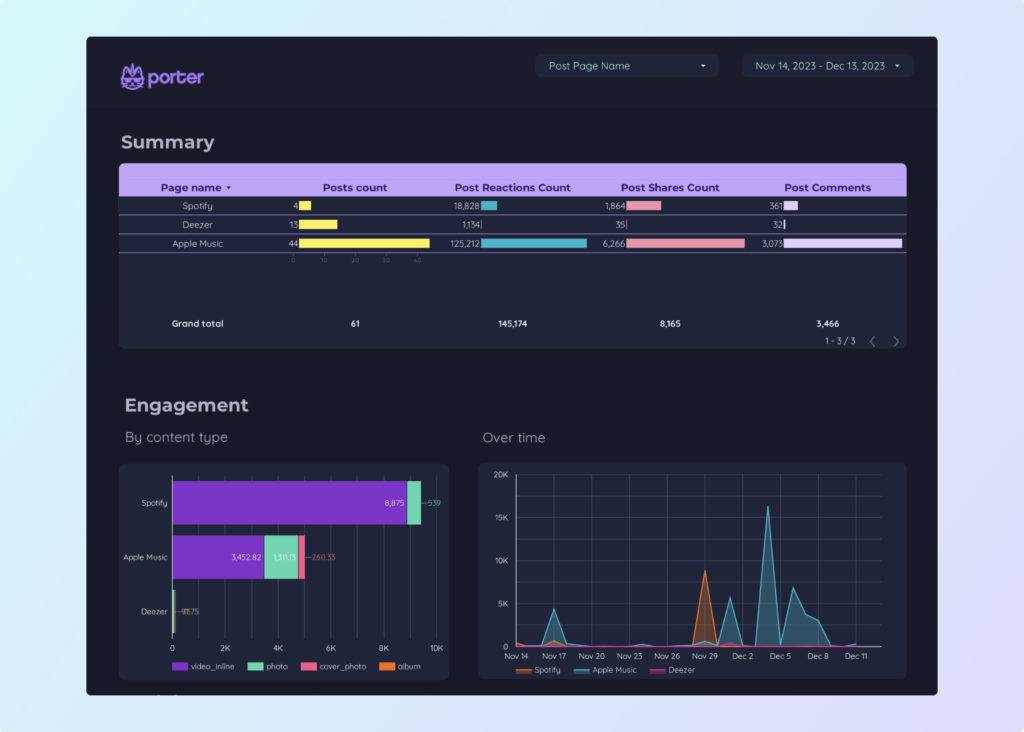
Calcula tus métricas de Redes sociales
Obtén una vista consolidada del rendimiento en redes sociales de Impresiones, Crecimiento de Seguidores, Tasa de Compromiso y Earned Media Value.
Reportes marca blanca
Personaliza los colores de la marca, logo, iconos y texto
Agrega gráficos y filtros
Agrega más de doce gráficos diferentes en una sola vista o un reporte con múltiples páginas
Filtros dinámicos
Filtra por fecha, creativos, tipo de publicación, ID de publicación, audiencias.
Combina tus datos de Facebook Competitors
Para tener tus indicadores de marketing correctos una sola fuente de la verdad.
Combina Competidores de Facebook con GA4
Convierte las mediciones provenientes de Facebook Insights (monitoreando tu propio perfil) combinando datos de tráfico y UTMs.
Etiqueta o agrupa por tema o hashtag
Categoriza el rendimiento por pilares de contenido, temas o hashtags para identificar el contenido de mejor rendimiento y priorizar lo que resuena más con la audiencia de tus competidores e identificar nuevas ideas de contenido.
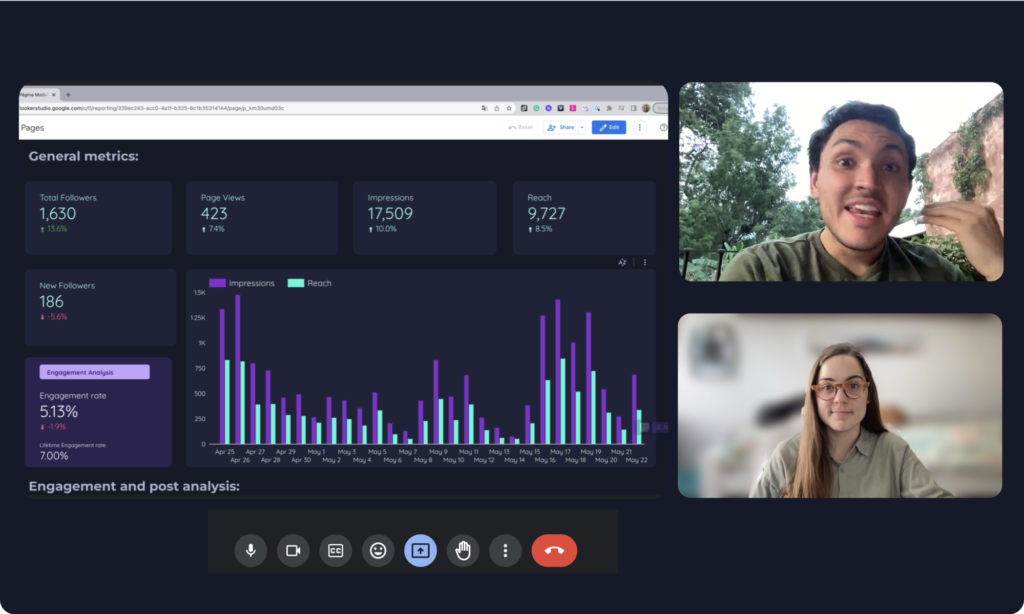
Informes de redes sociales a través de múltiples canales
Combina el alcance, las impresiones, los seguidores y las interacciones en todos tus canales de redes sociales para tener una visión integral de tu rendimiento.
Comparte y presenta tus informes de Redes Sociales con tu equipo y clientes
Agenda el envío de reportes
Envía resúmenes diarios, semanales o mensuales por correo y en PDF de forma programada
Comparte reportes en vivo
Comparte links con accesos de vista o edición para colaborar más rápido
Descarga tus reportes en PDF
Descarga una versión en PDF para los clientes que no están familiarizados con Looker Studio o Google Sheets
Cómo Porter es diferente
Soporte ilimitado y gratuito por chat, email y llamadas
Agenda llamada con especialistas de marketing o con nuestros fundadores, para personalmente: