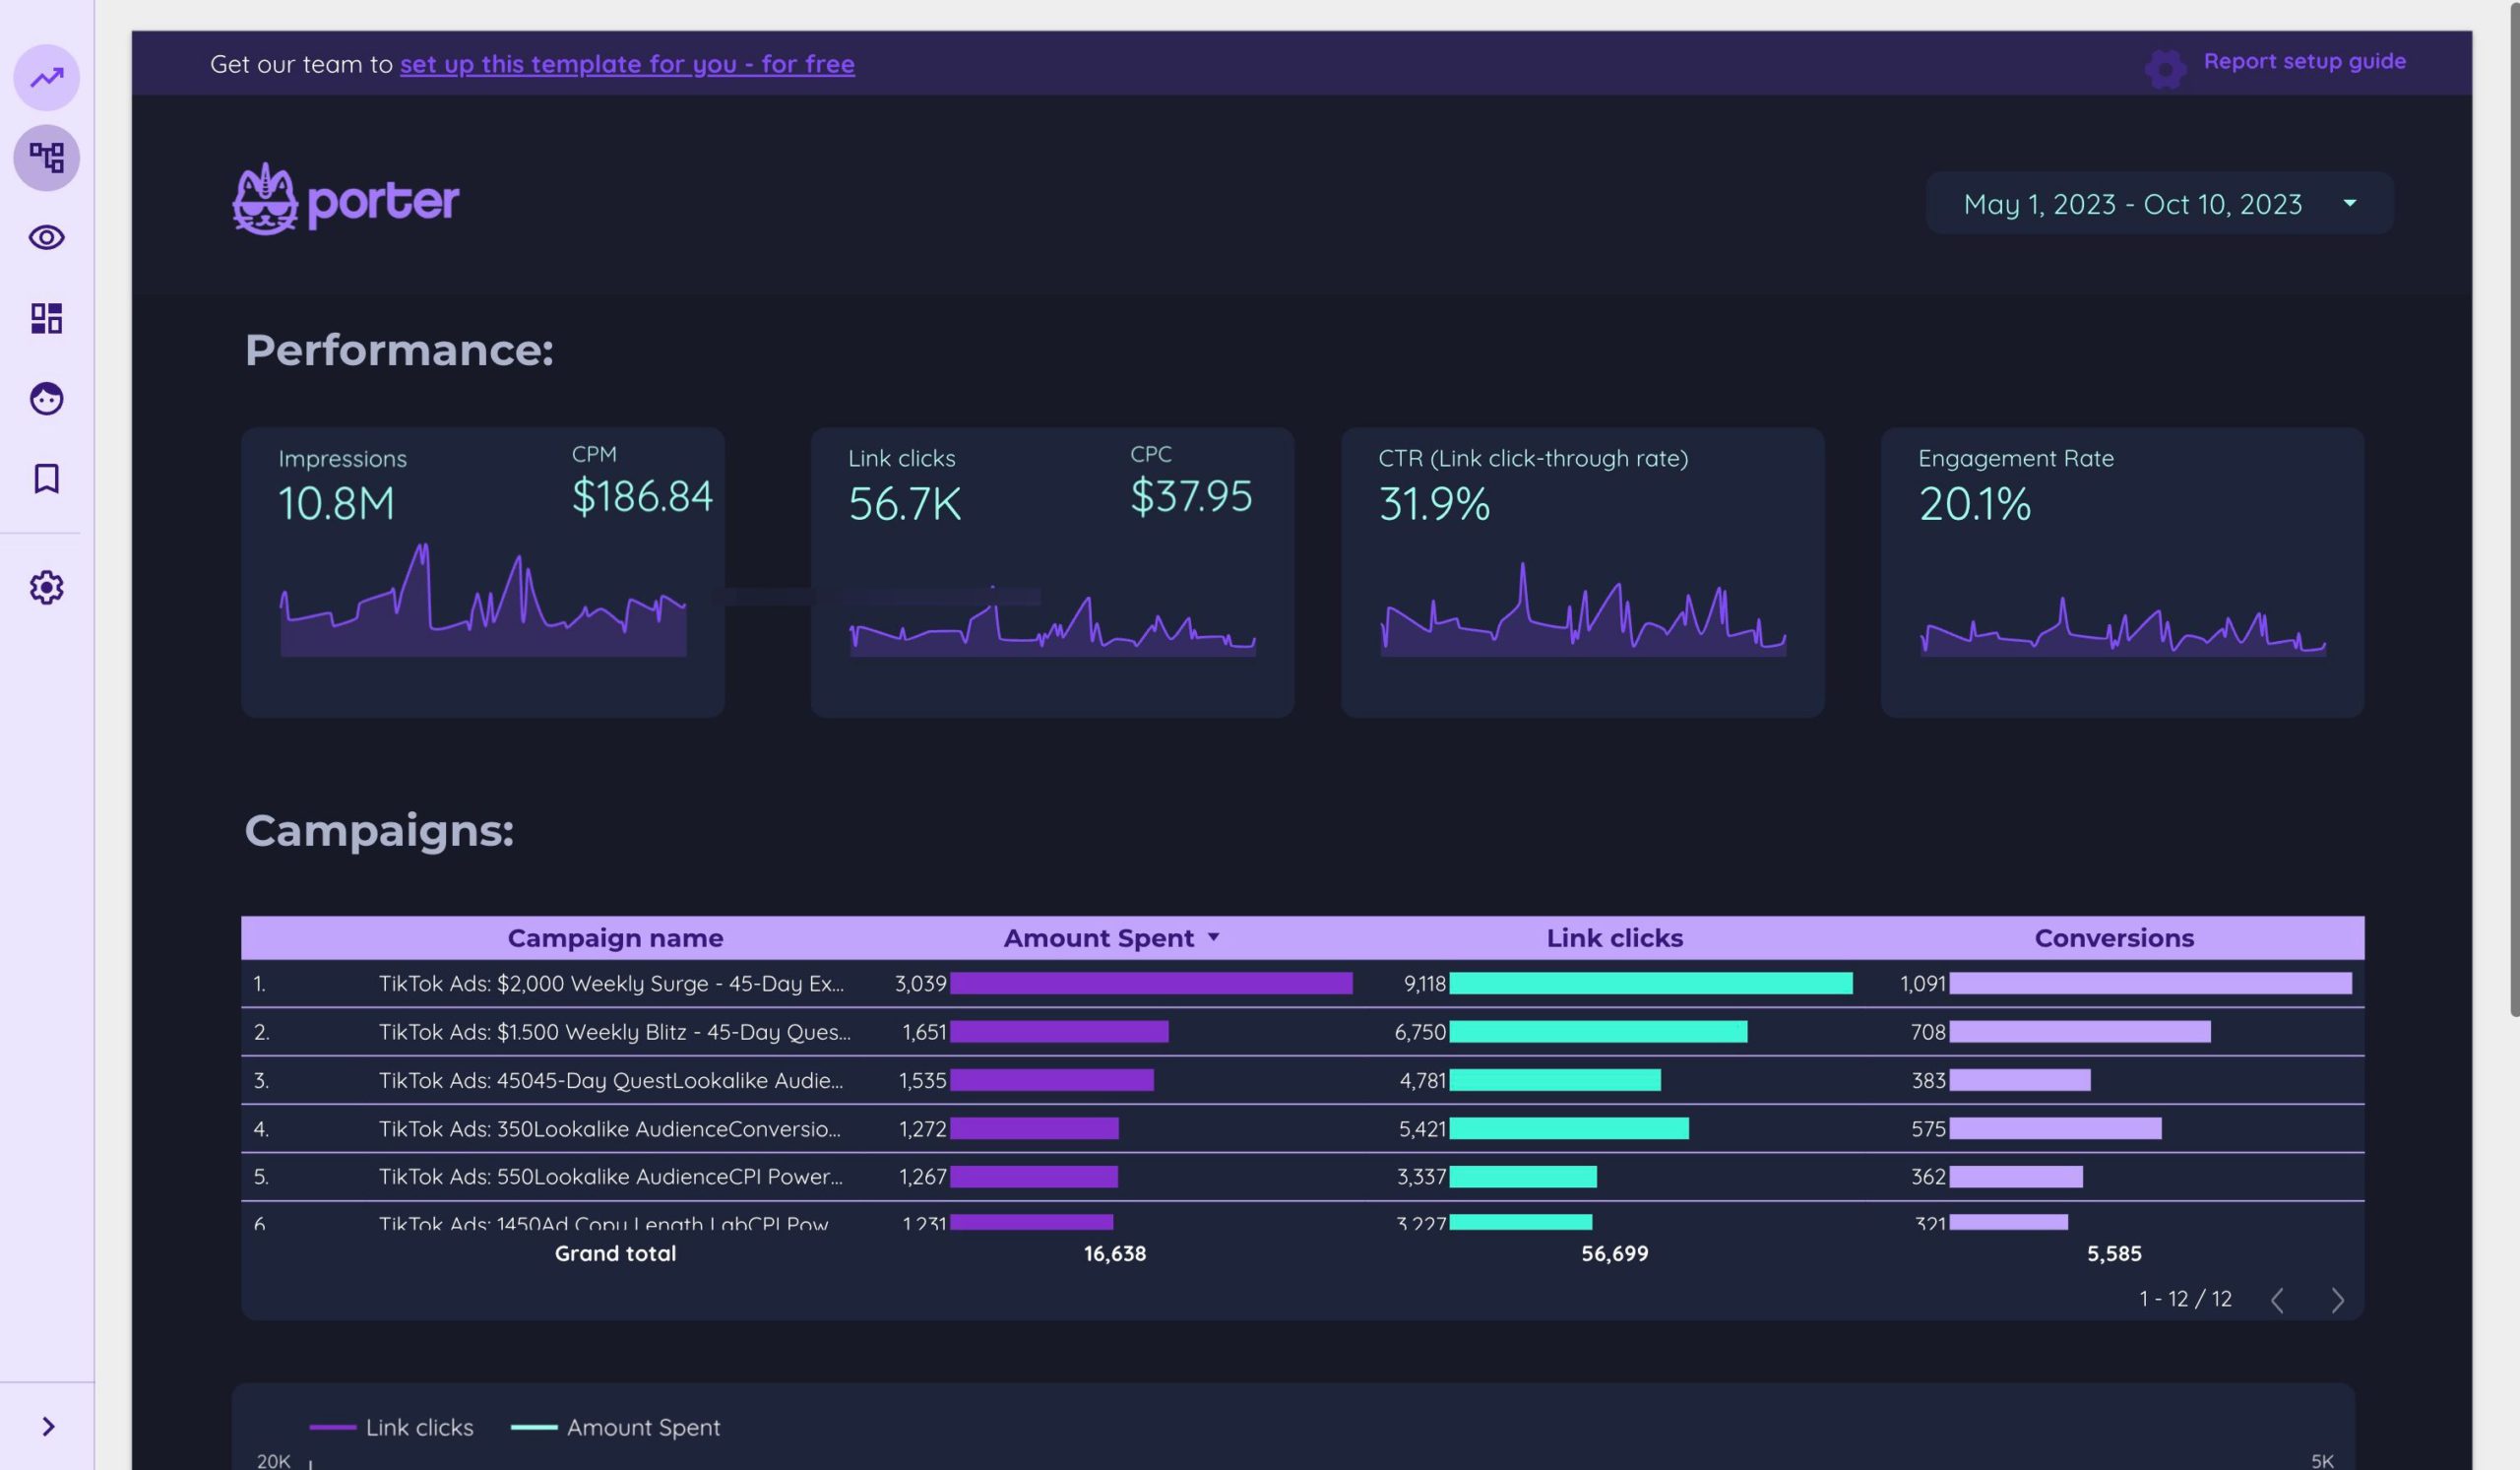
TikTok Ads Report template for Marketing teams and agencies
Optimize TikTok Ads performance with this report template. Track CTR, conversion rate, and cost per conversion. Analyze impressions, reach, and engagement. Segment by audience, ad placement, and time. Perfect for PPC specialists aiming to achieve marketing goals and enhance strategy.
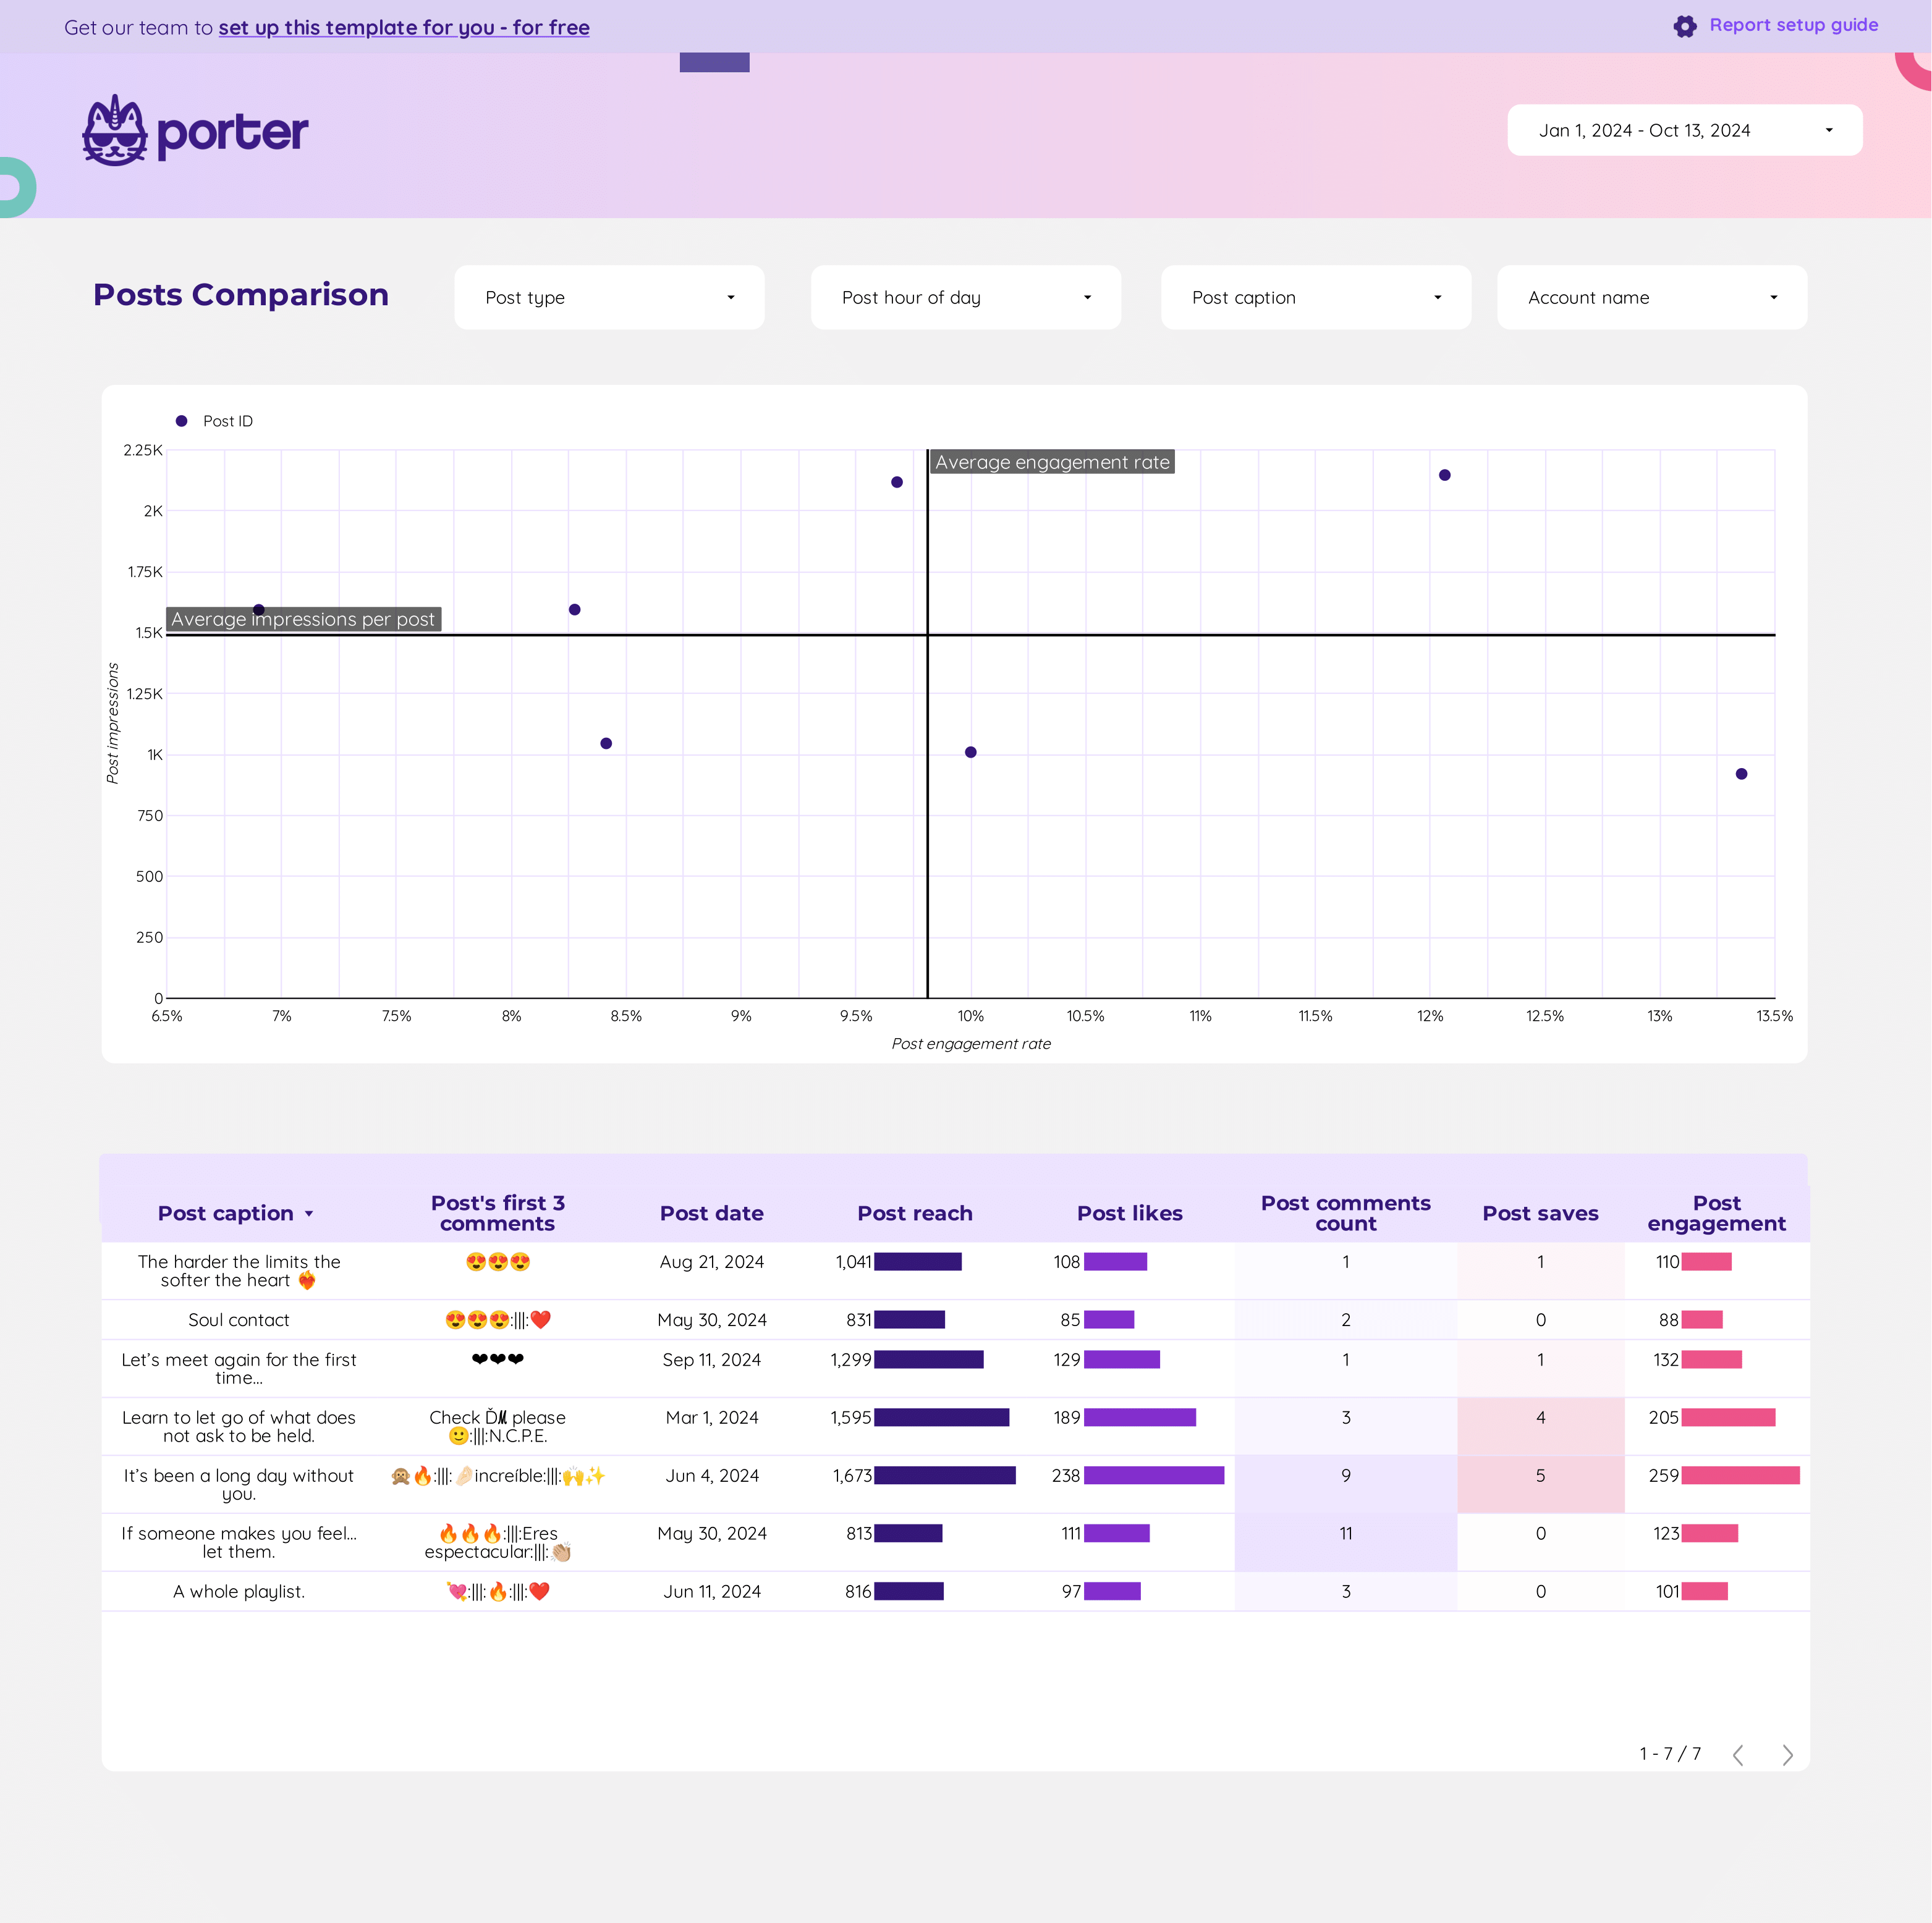
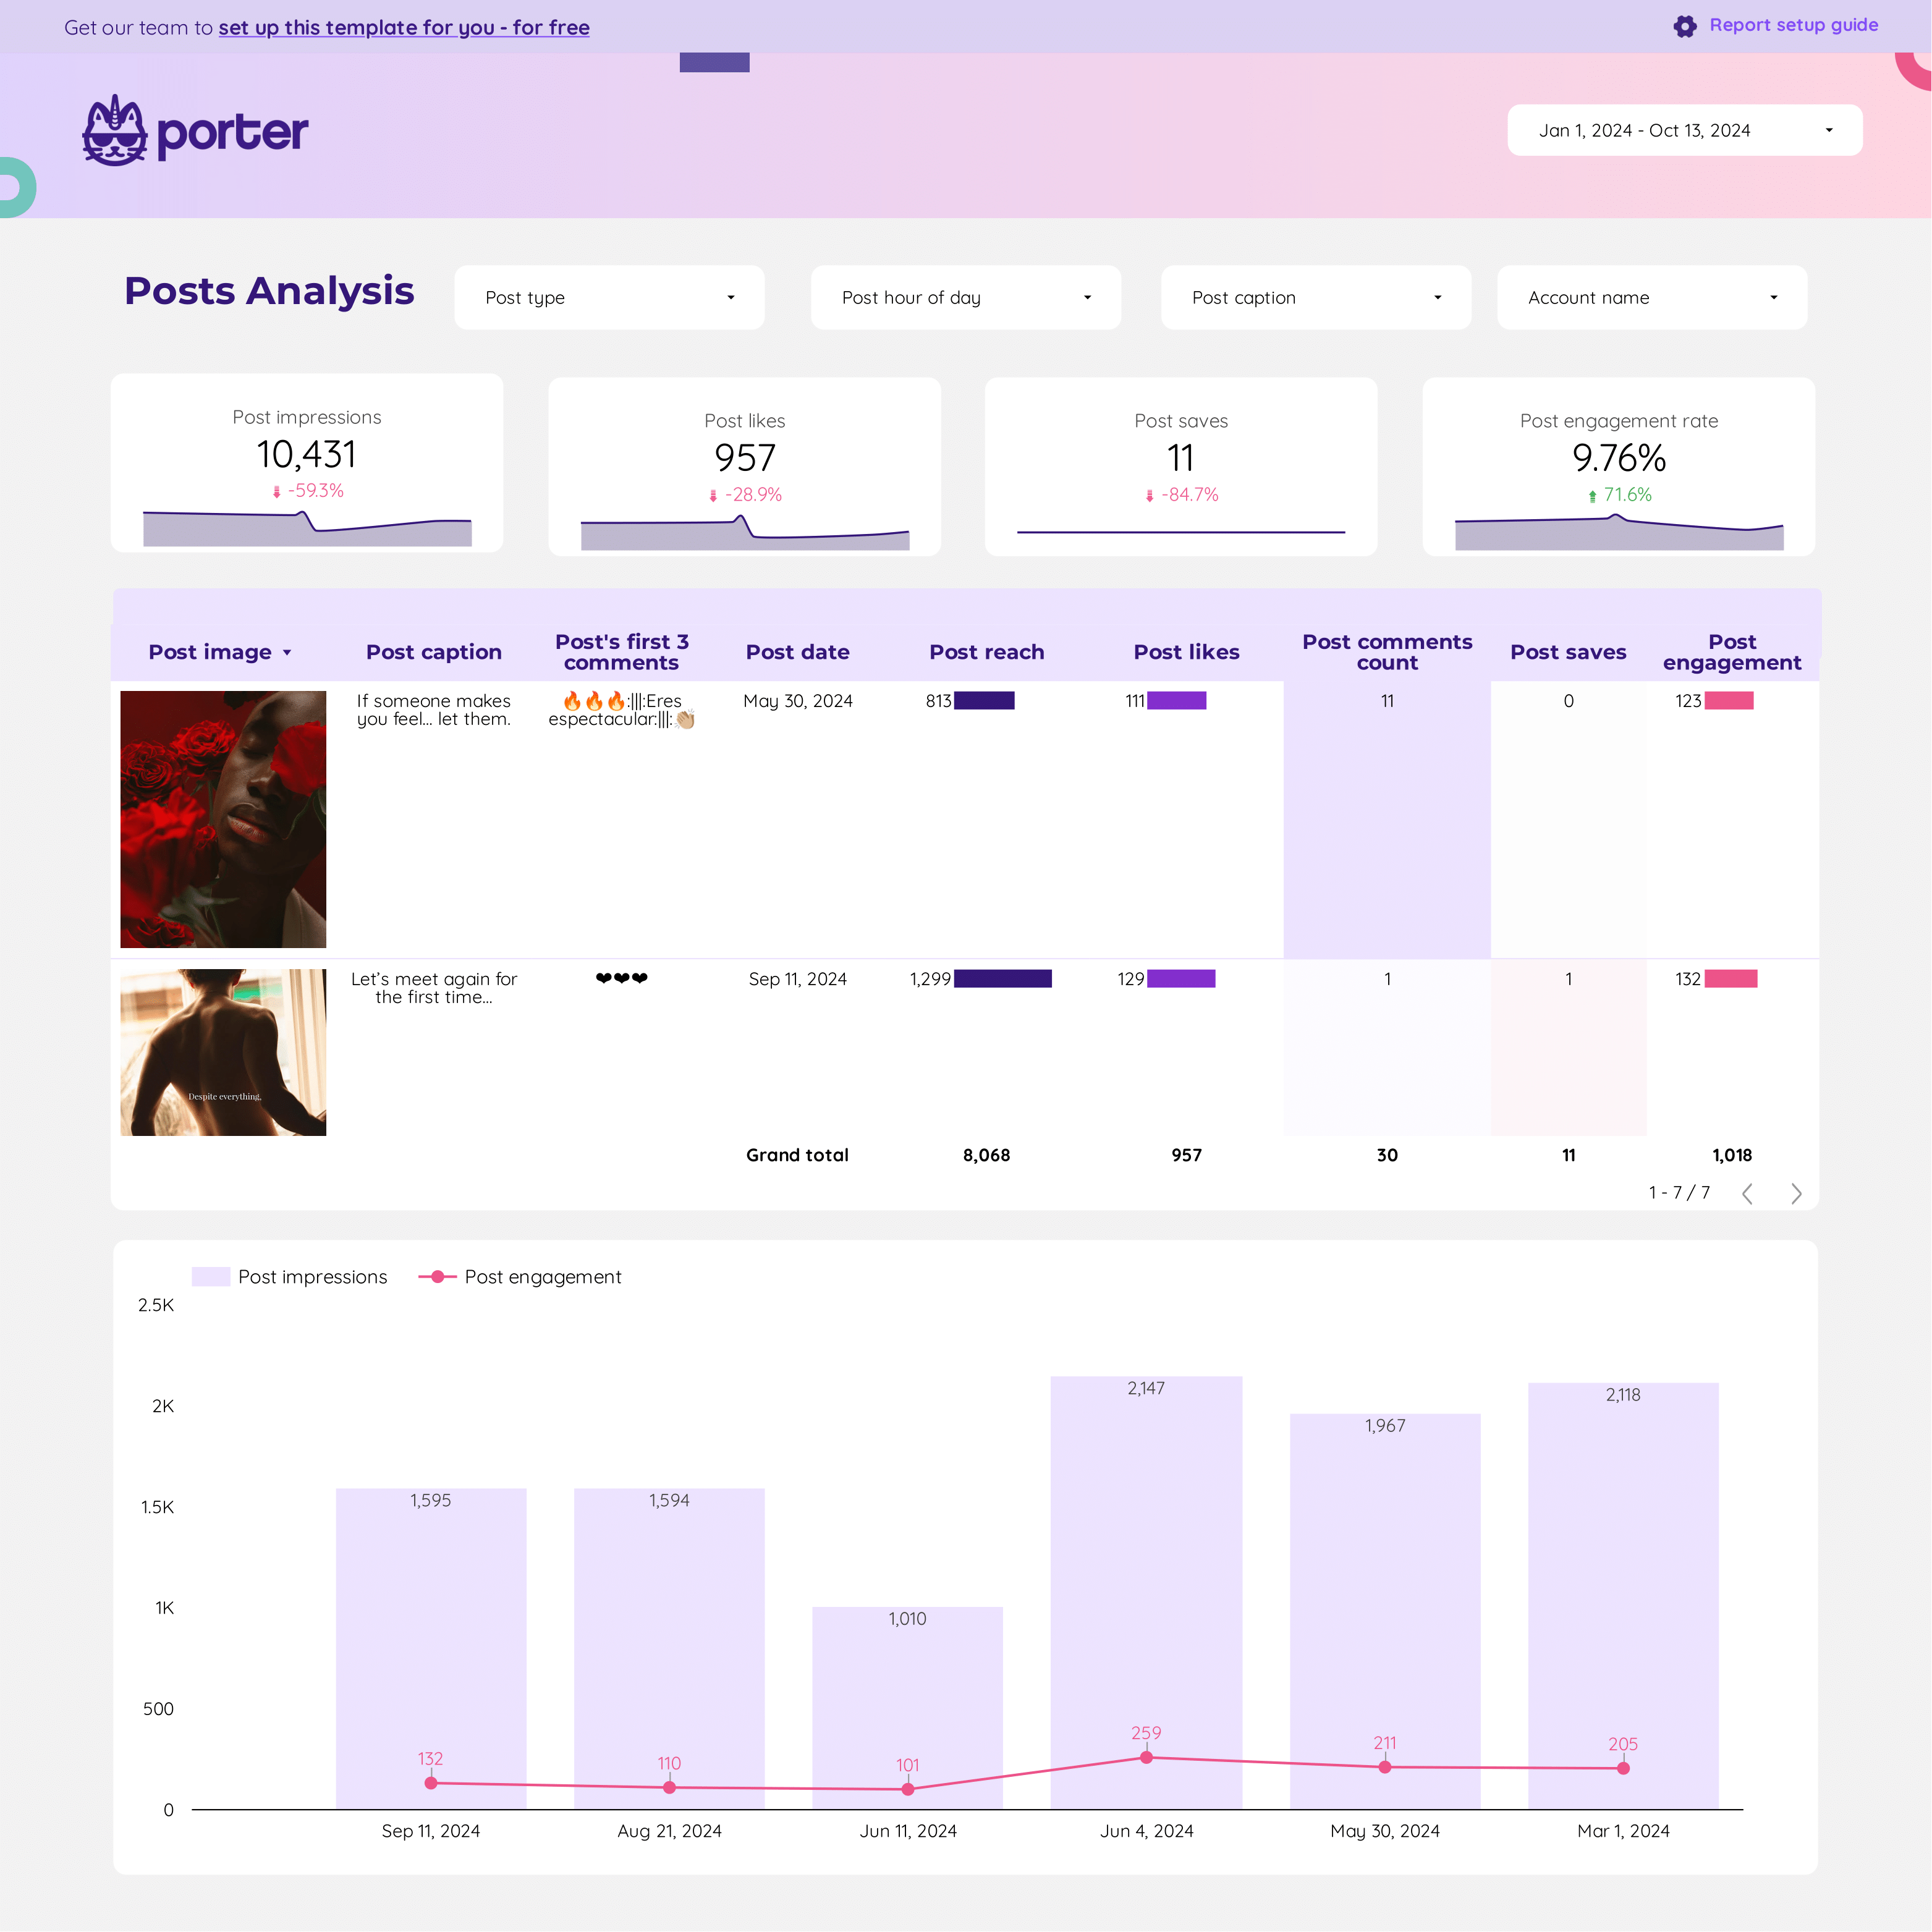
Content performance Dashboard template
The Content Performance Dashboard template integrates data from multiple social media platforms and analytics tools to provide a detailed overview of content metrics. This dashboard is designed for marketers and analysts who need to track and analyze content performance across various channels.
Data Sources:
- Google Analytics 4
- Instagram Insights
- Facebook Insights
- LinkedIn Pages
- Google Business Profile
- TikTok
Features:
- Aggregated metrics from multiple platforms
- Visual representation of engagement trends
- Comparative analysis of content performance
- Customizable views for specific social media channels
This dashboard template is essential for tracking social media content performance, providing insights into audience engagement, reach, and conversion metrics.
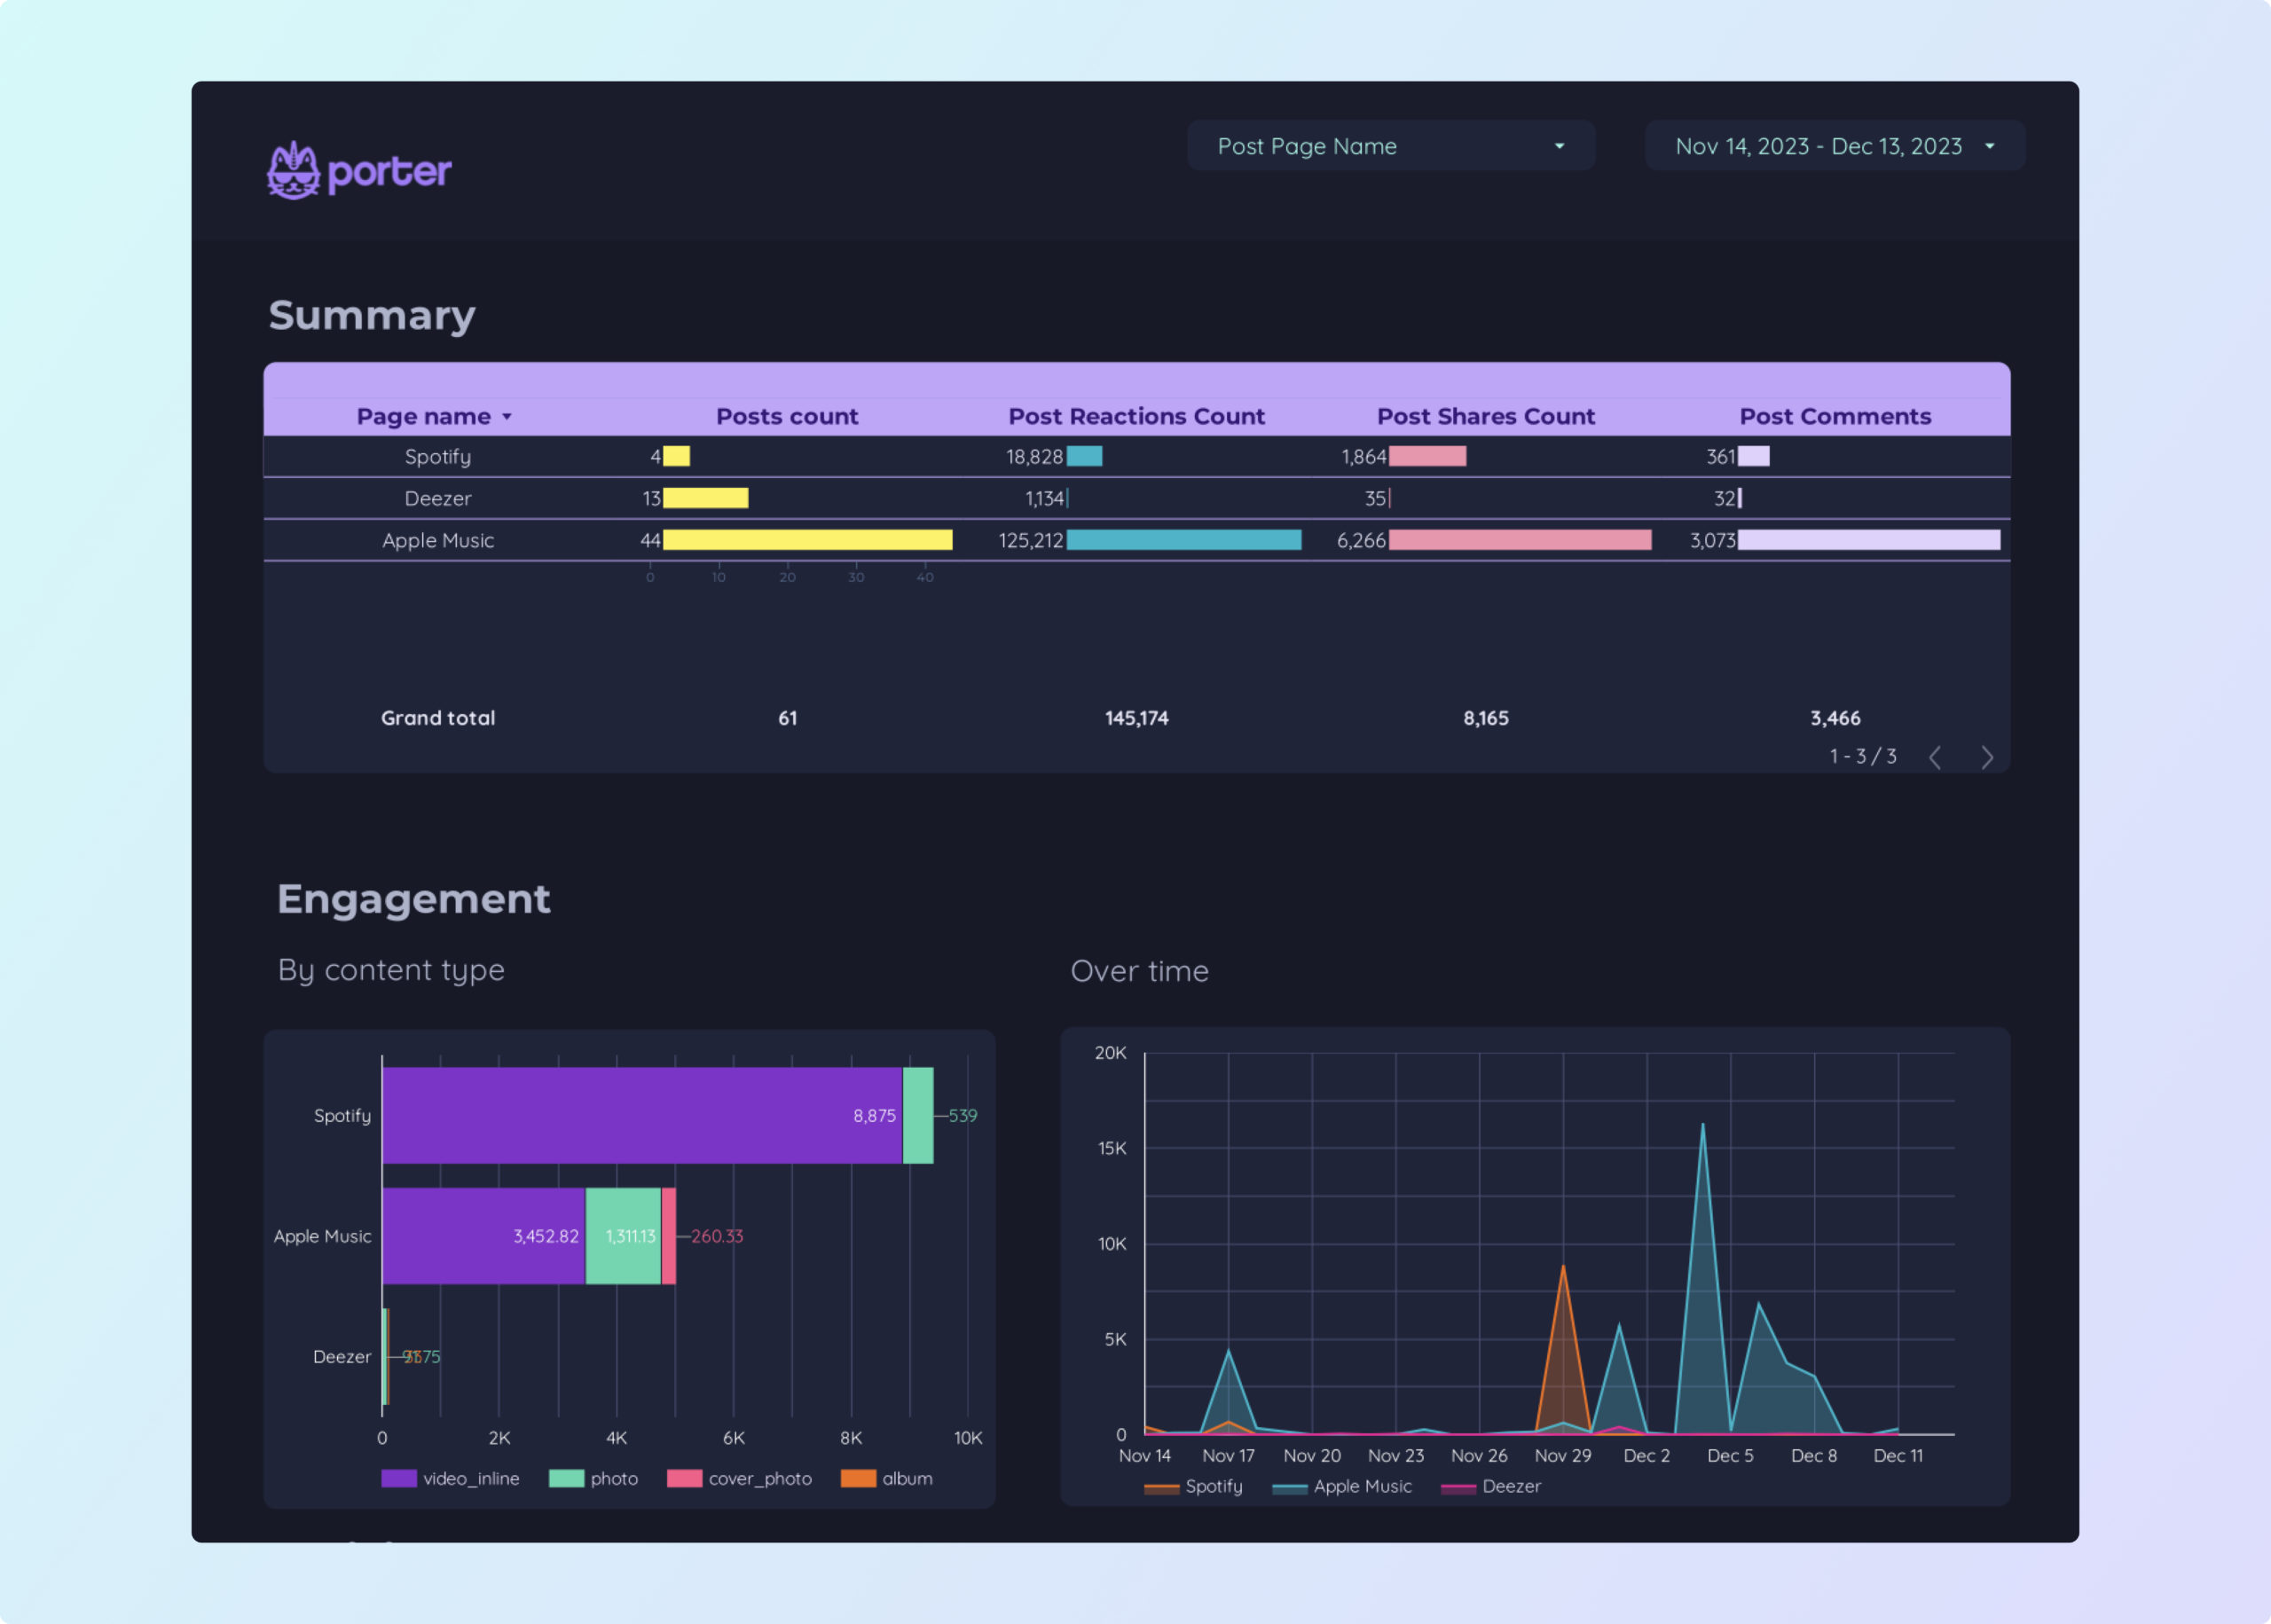
Facebook Insights competitors Dashboard template
The Facebook Insights Competitors Dashboard template provides a structured approach to analyzing your competitors’ performance on Facebook. This tool leverages Facebook Public Data to offer insights into various metrics.
With this dashboard, you can:
- Track engagement metrics such as likes, shares, and comments.
- Analyze audience demographics to understand the reach and influence of competitors.
- Monitor content performance to identify successful strategies.
Utilize this template to gain a competitive edge by understanding how your competitors interact with their audience and what content resonates most effectively.
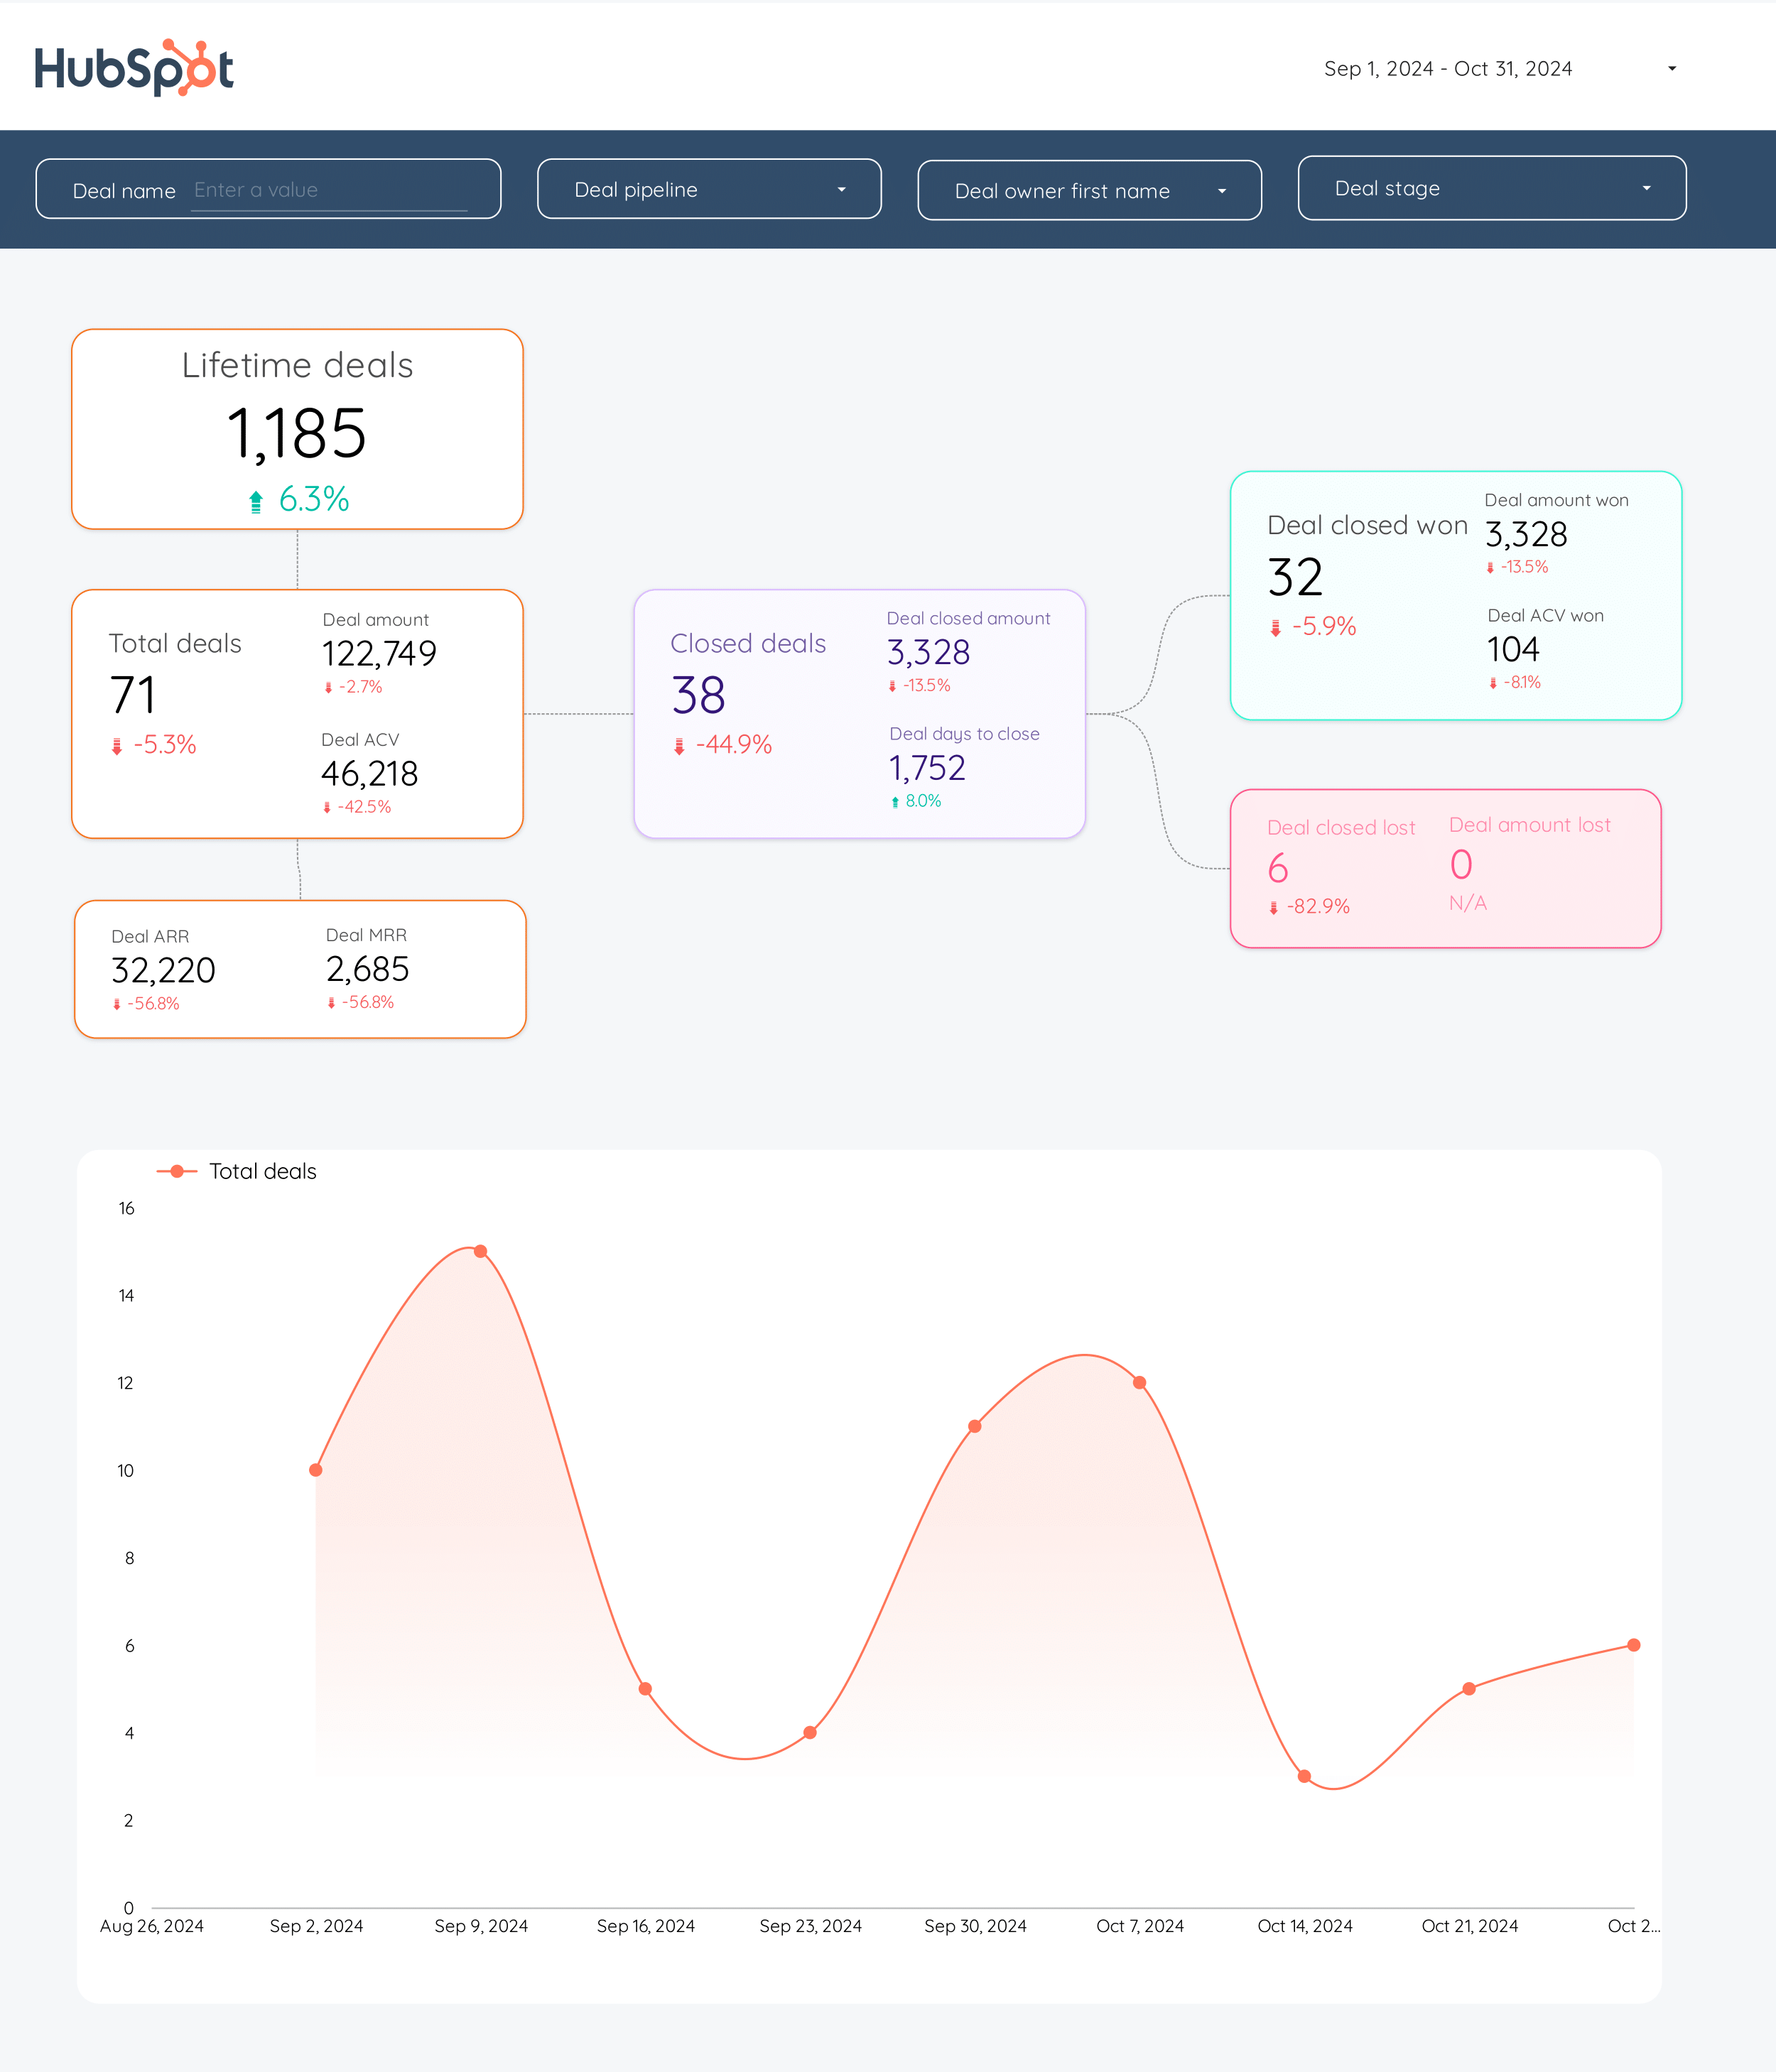
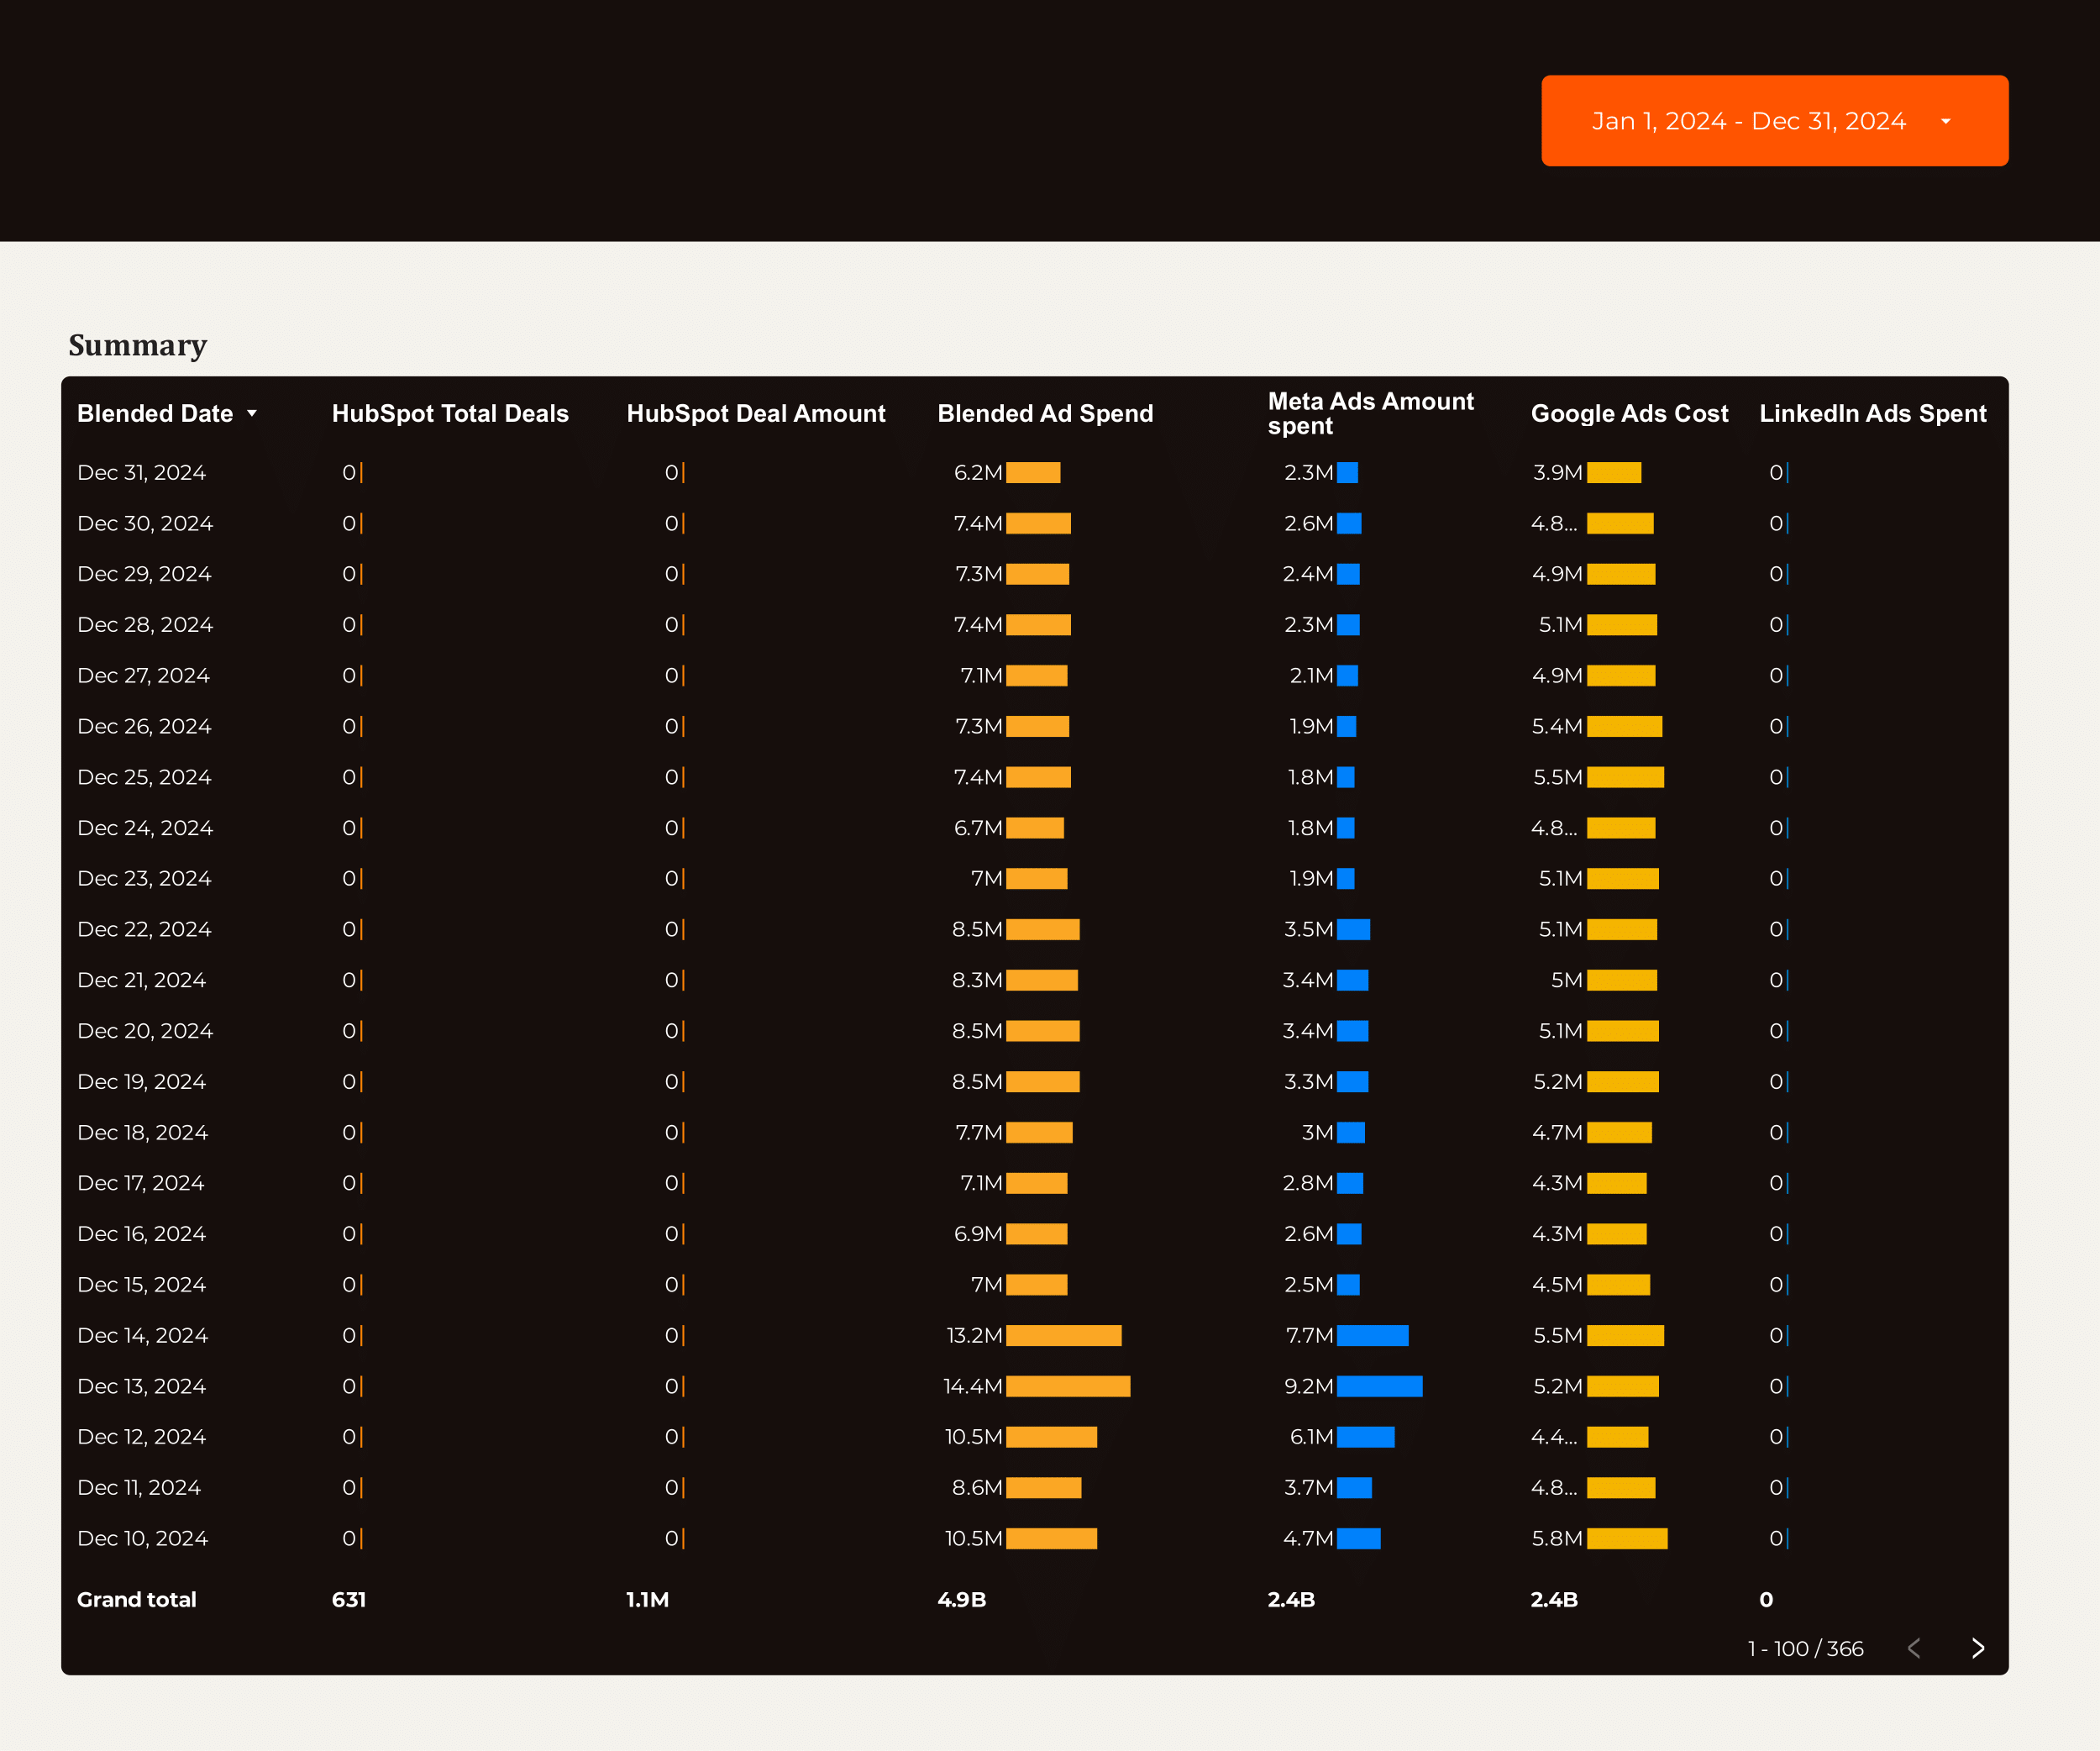
HubSpot Dashboard template
The HubSpot Dashboard Template is designed for B2B companies focusing on CRM and Email Marketing. This template provides a structured view of your marketing and sales data, enabling you to track and analyze your funnels and inbound marketing efforts effectively.
With this dashboard, you can:
- Monitor lead generation and conversion rates through detailed funnel analysis.
- Track email campaign performance metrics, including open rates and click-through rates.
- Analyze customer interactions and engagement within the HubSpot CRM.
Utilize this template to align your marketing strategies with your business objectives, ensuring a data-driven approach to inbound marketing.
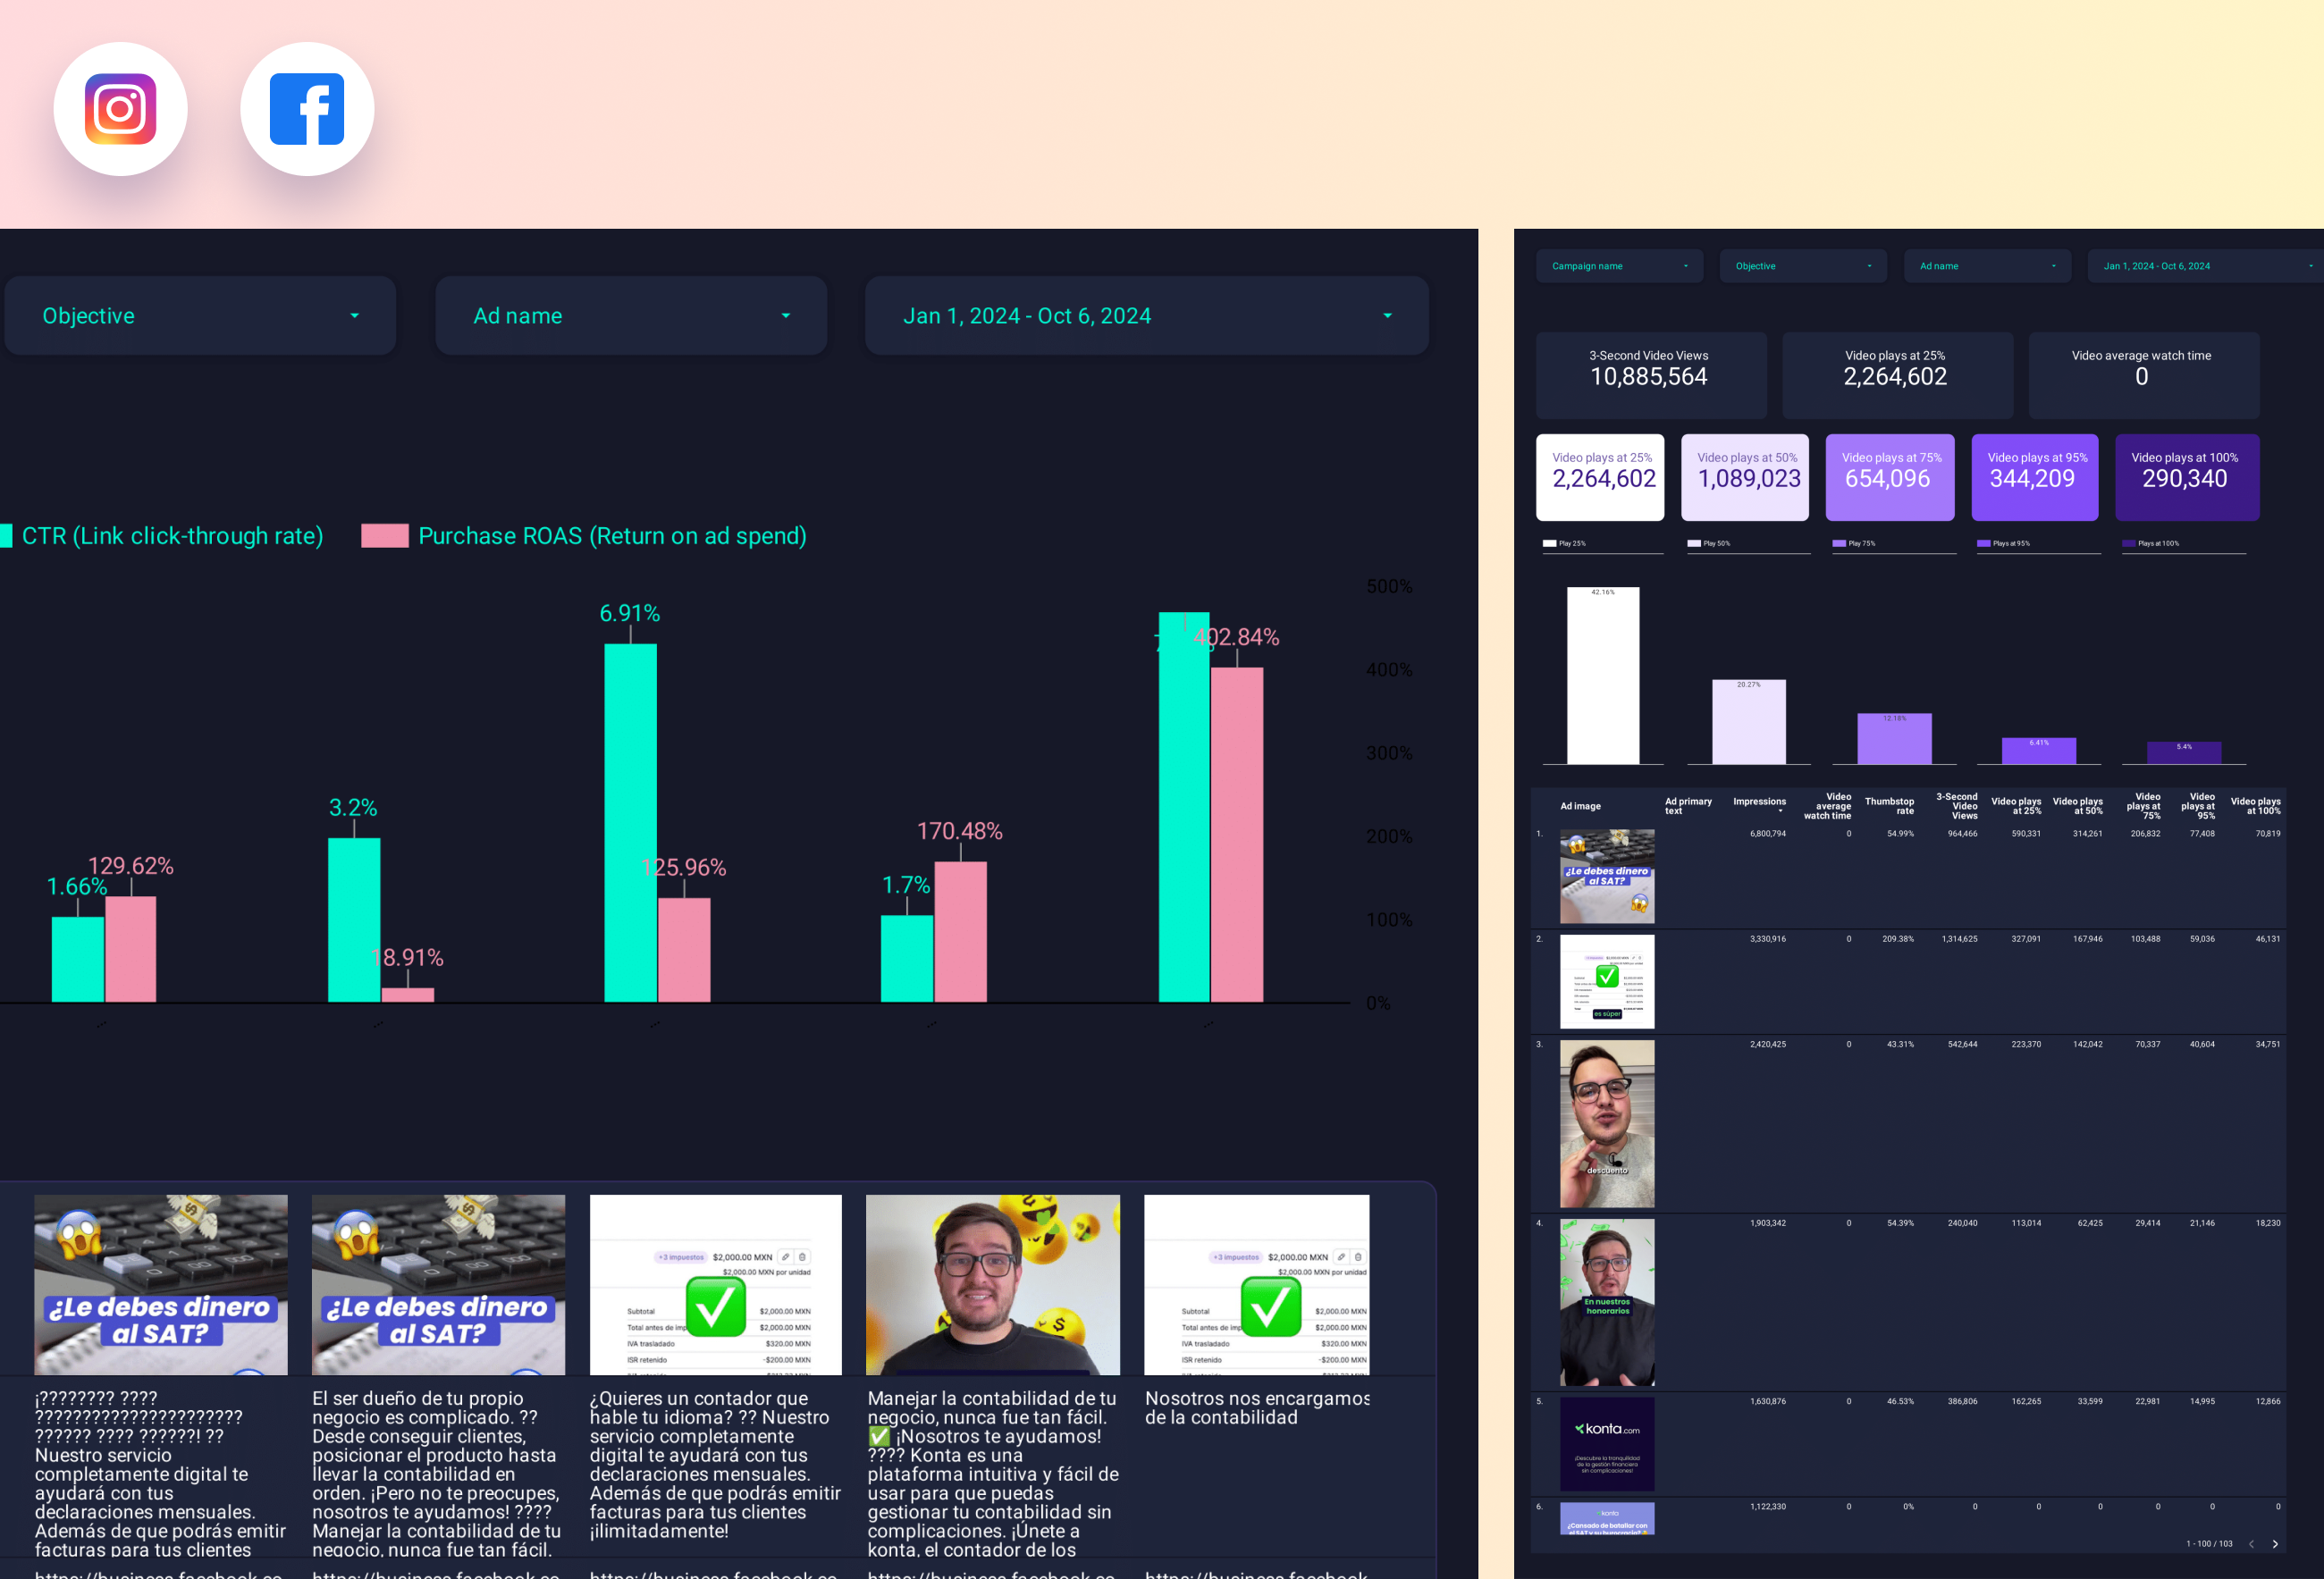
Paid media Creative performance Dashboard template
The Paid Media Creative Performance Dashboard template is designed for marketers managing campaigns across multiple platforms such as PPC, TikTok Ads, Google Ads, Facebook Ads, LinkedIn Ads, and Twitter Ads.
This dashboard provides a centralized view of your advertising efforts, allowing you to track and analyze performance metrics in real-time. It supports:
- Impressions and Clicks tracking for visibility and engagement analysis.
- Cost-per-click (CPC) and Cost-per-acquisition (CPA) metrics for budget management.
- Conversion rates to measure the effectiveness of your ad creatives.
- Platform-specific insights for TikTok, Google, Facebook, LinkedIn, and Twitter.
Utilize this dashboard to streamline your reporting process and make data-driven decisions for optimizing your ad campaigns.
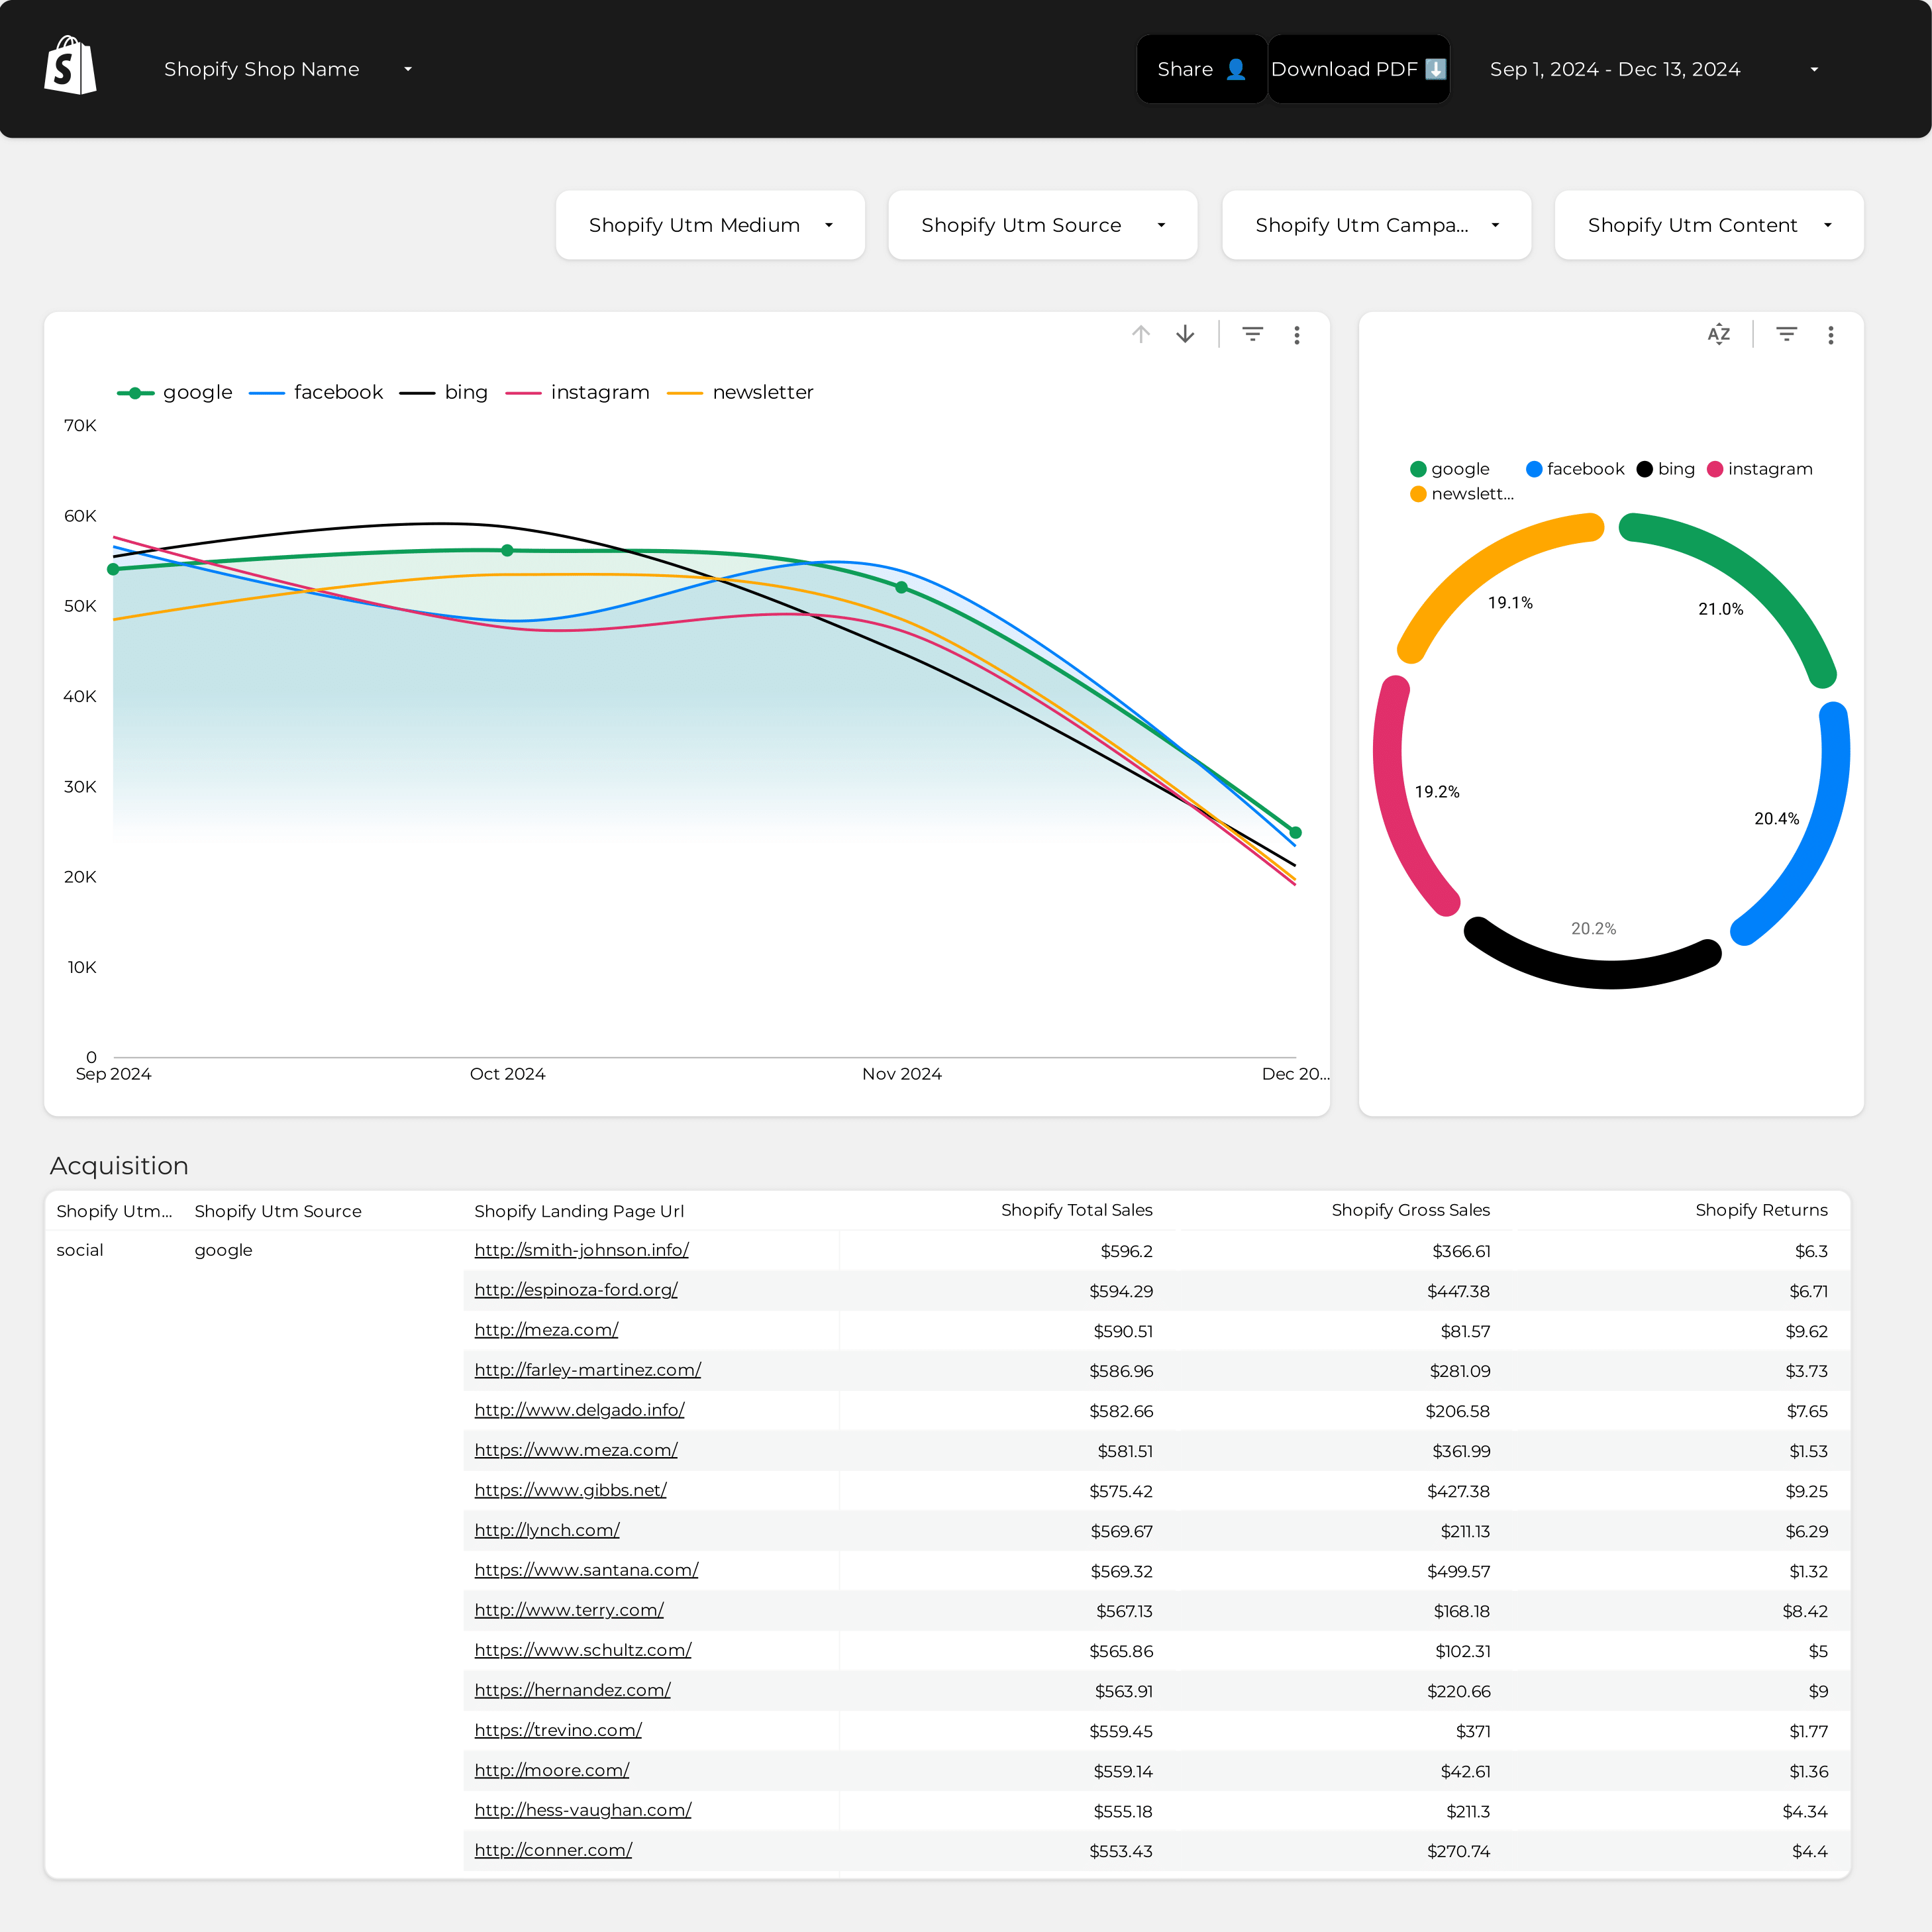
Shopify Attribution Dashboard template
The Shopify Attribution Dashboard template is designed for e-commerce businesses using Shopify to track and analyze their marketing efforts. This dashboard provides a detailed view of how different marketing channels contribute to sales and customer acquisition.
With this template, you can:
- Track PPC Campaigns: Monitor the performance of your pay-per-click campaigns across various platforms.
- Analyze Attribution Models: Understand the impact of different attribution models on your sales data.
- Visualize Customer Journeys: Gain insights into the paths customers take before making a purchase.
- Measure ROI: Calculate the return on investment for each marketing channel.
This dashboard integrates seamlessly with Shopify, providing real-time data and analytics to help you make informed decisions about your marketing strategies.
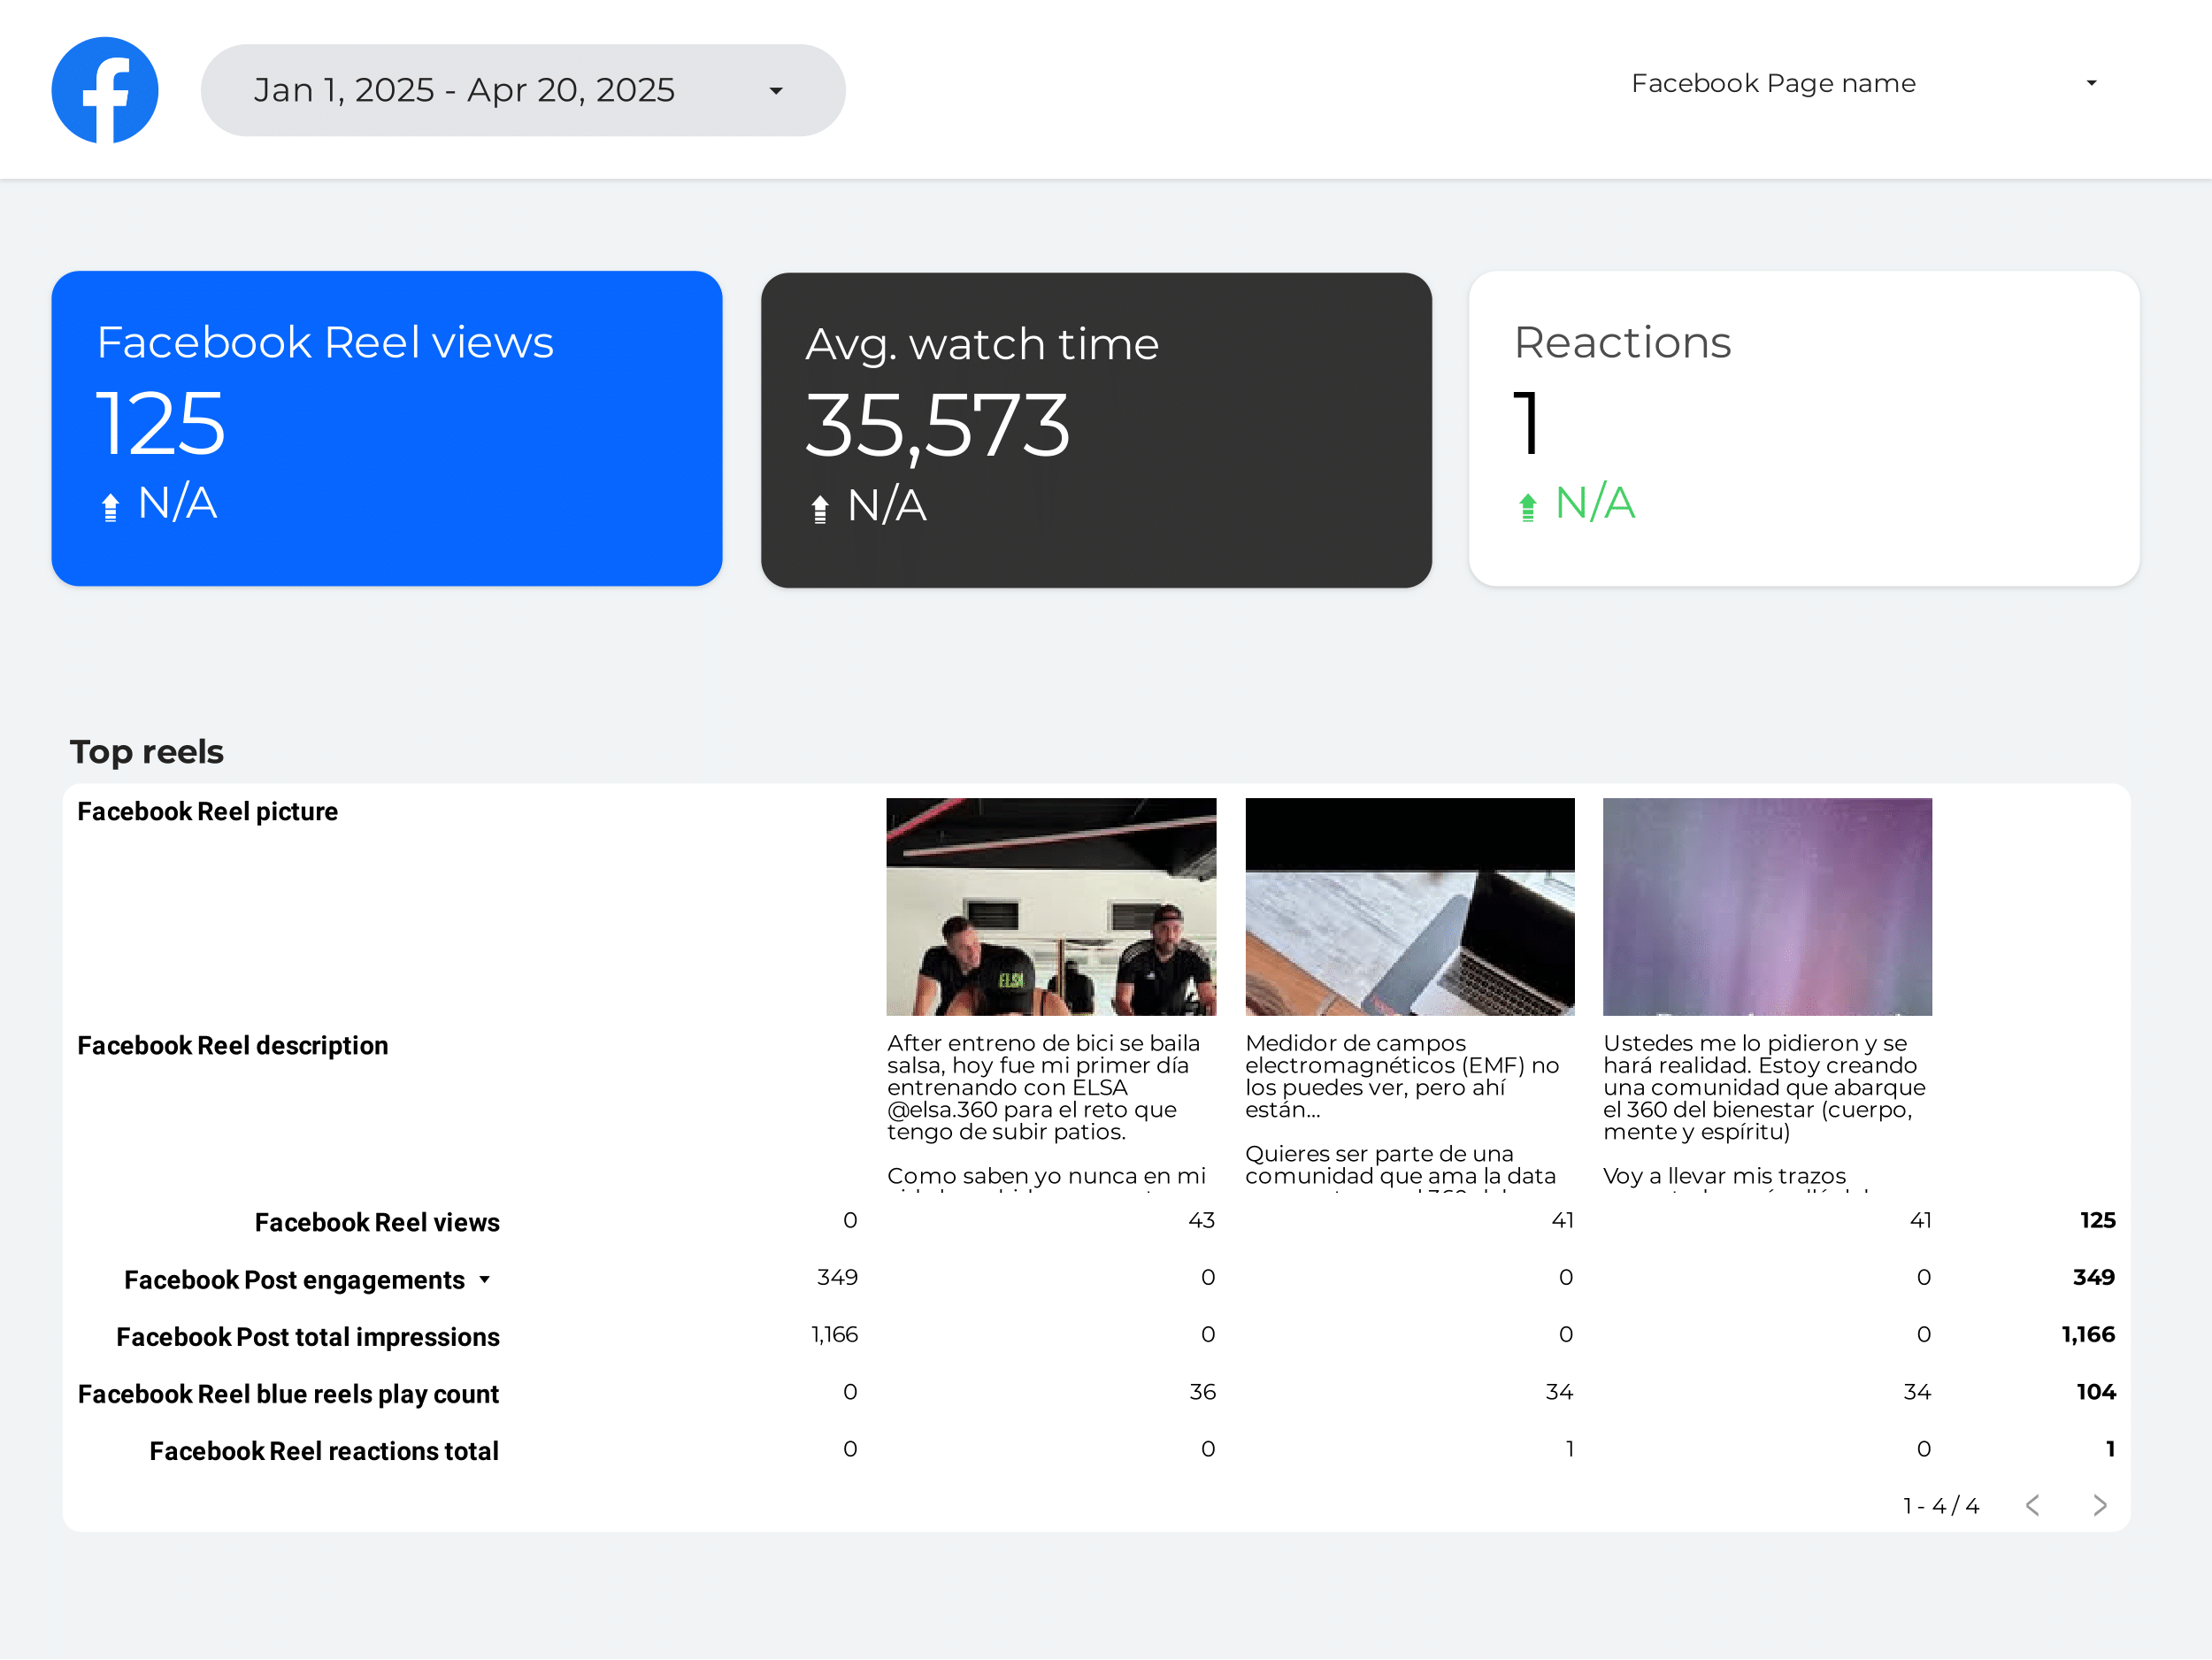
Facebook Insights dashboard example
Analyze key metrics with this Facebook Insights dashboard example. Track CTR, conversion rate, and engagement. Segment by age, gender, and location. View data by hour, day, or month. Perfect for social media marketers to optimize strategy and measure performance efficiently.
Lead generation dashboard example
Optimize your strategy with this lead generation dashboard example. Track conversion rates, cost per conversion, and ROI. Analyze B2B, CRM, Email Marketing, and Facebook Ads data. Segment by audience, demographics, and behavior. Measure sales qualified leads and CRM contact performance. Ideal for marketing teams seeking actionable insights and improved campaign performance.
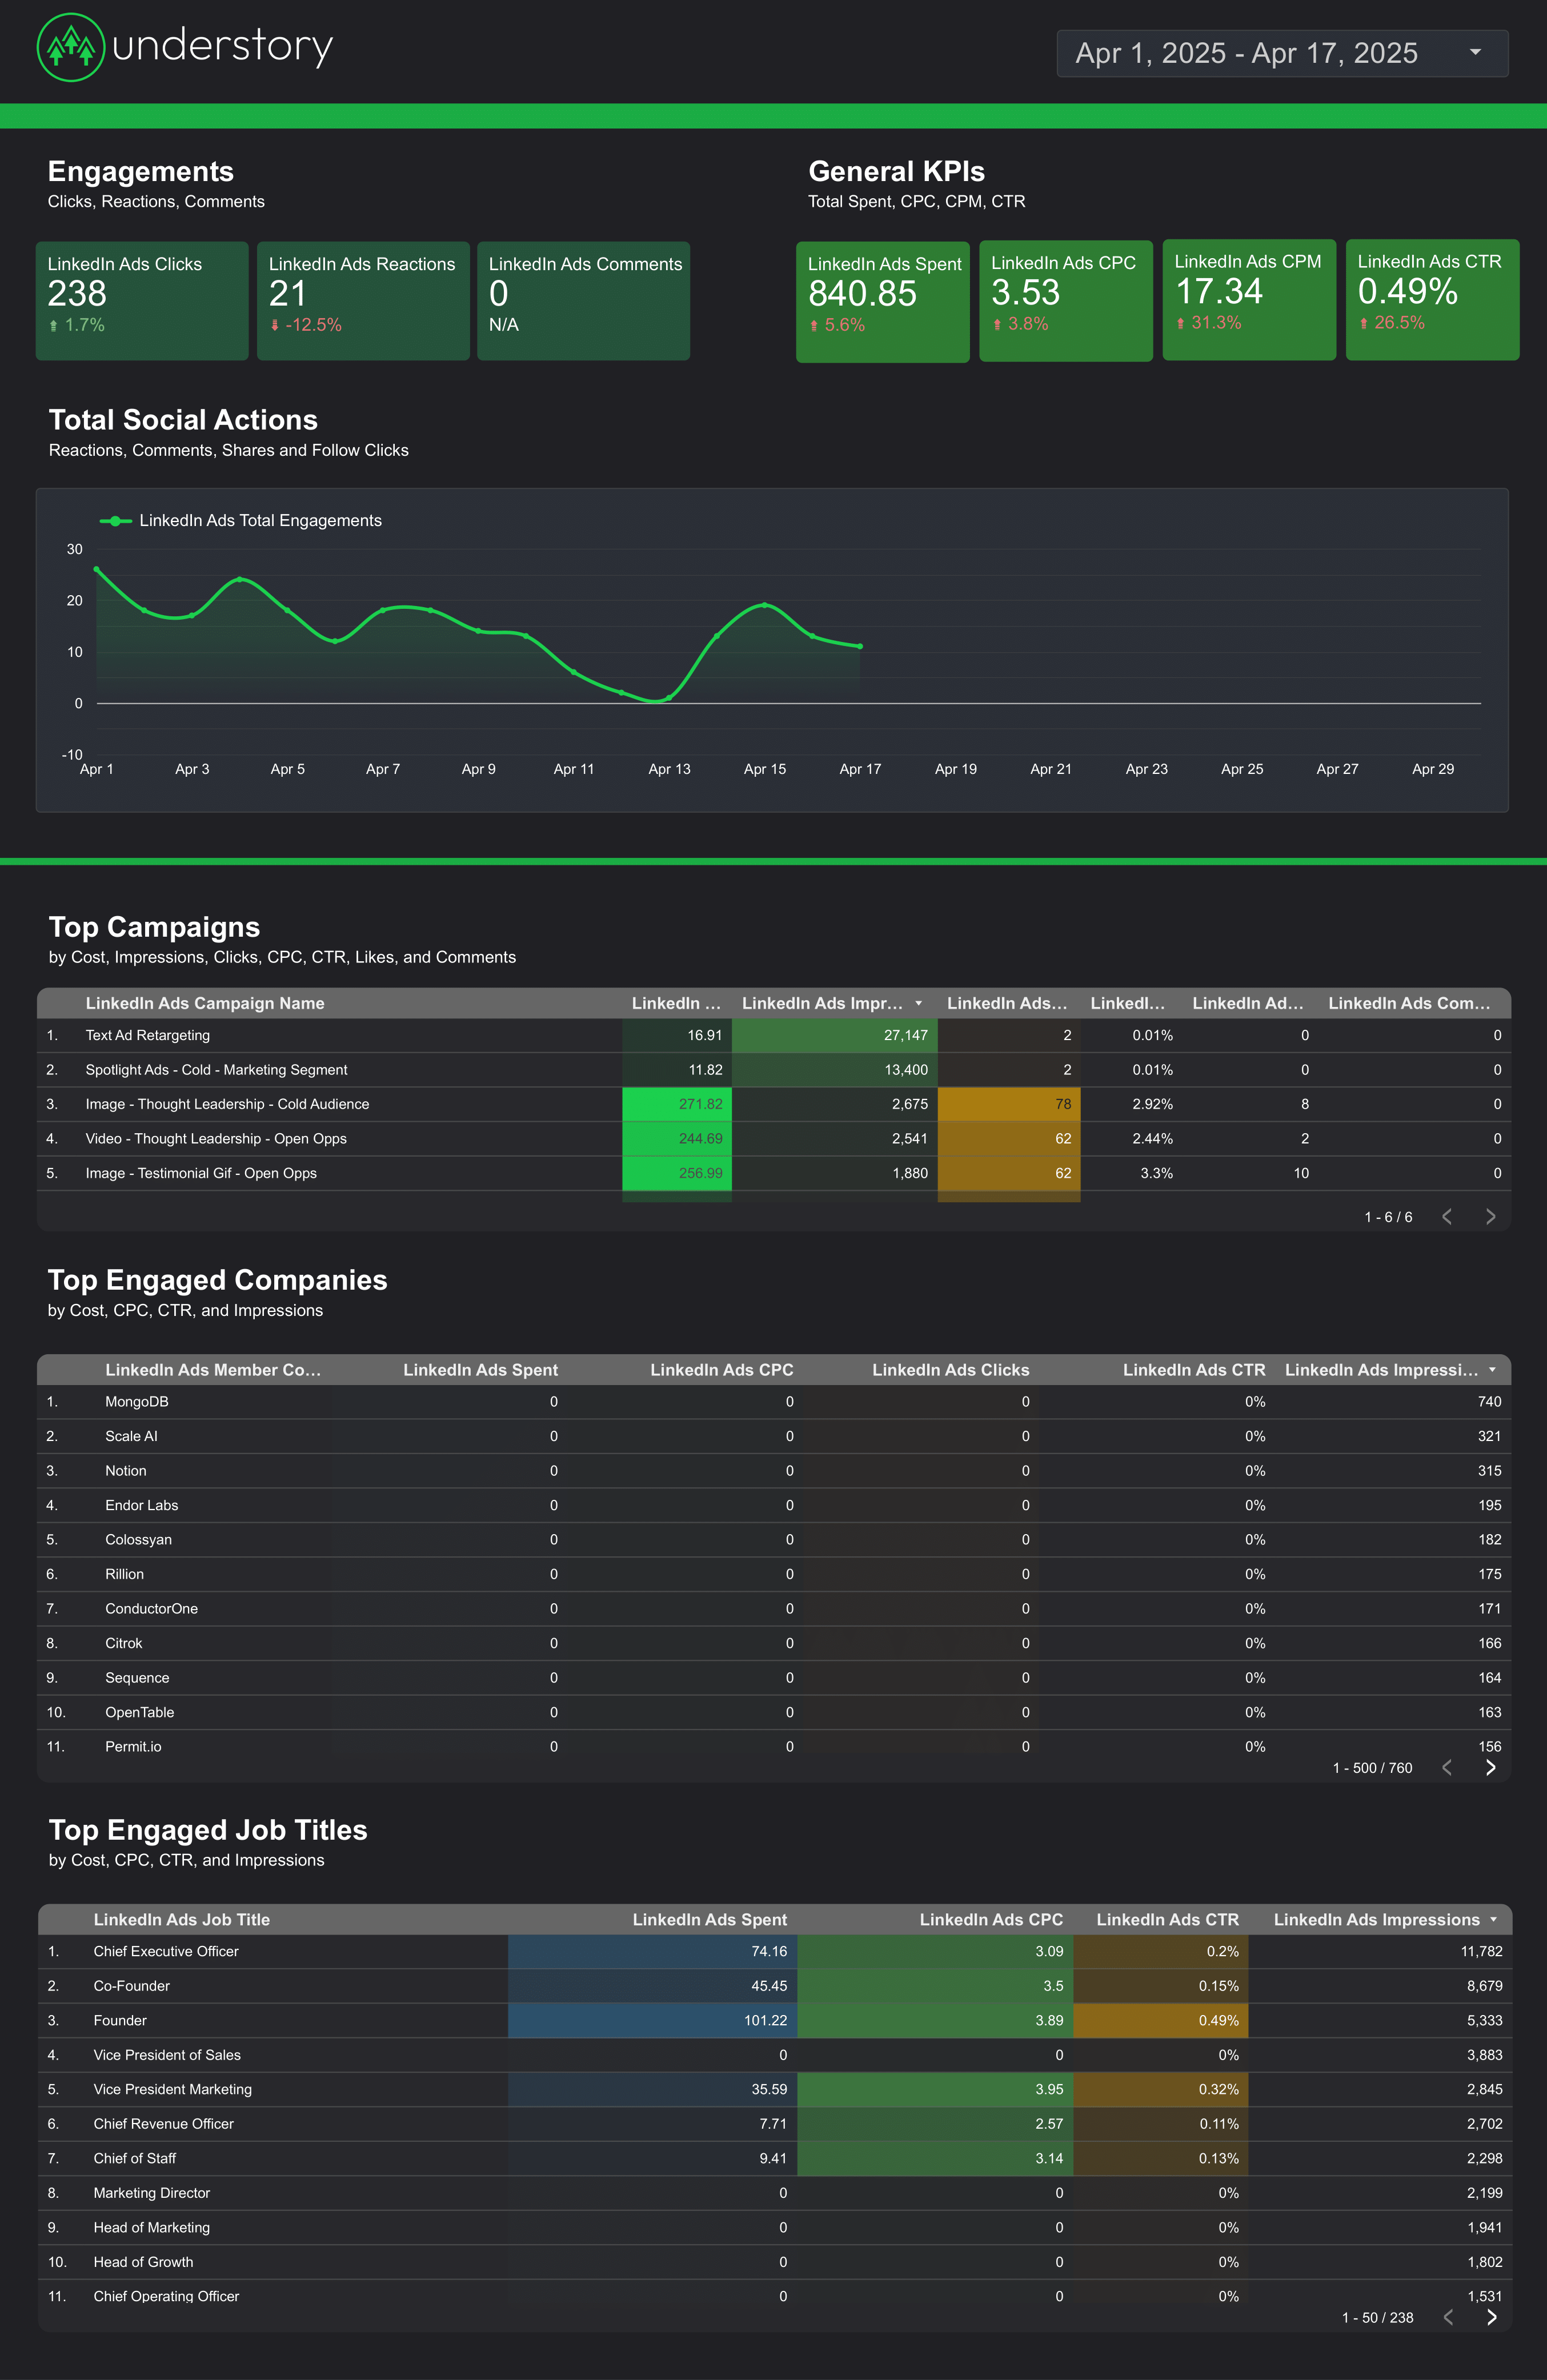
LinkedIn Ads dashboard example
Optimize your LinkedIn Ads strategy with this dashboard example. Track KPIs for B2B and SaaS lead generation. Analyze performance and consolidate data from LinkedIn Ads. Ideal for marketing teams focused on achieving specific goals and actionable insights.
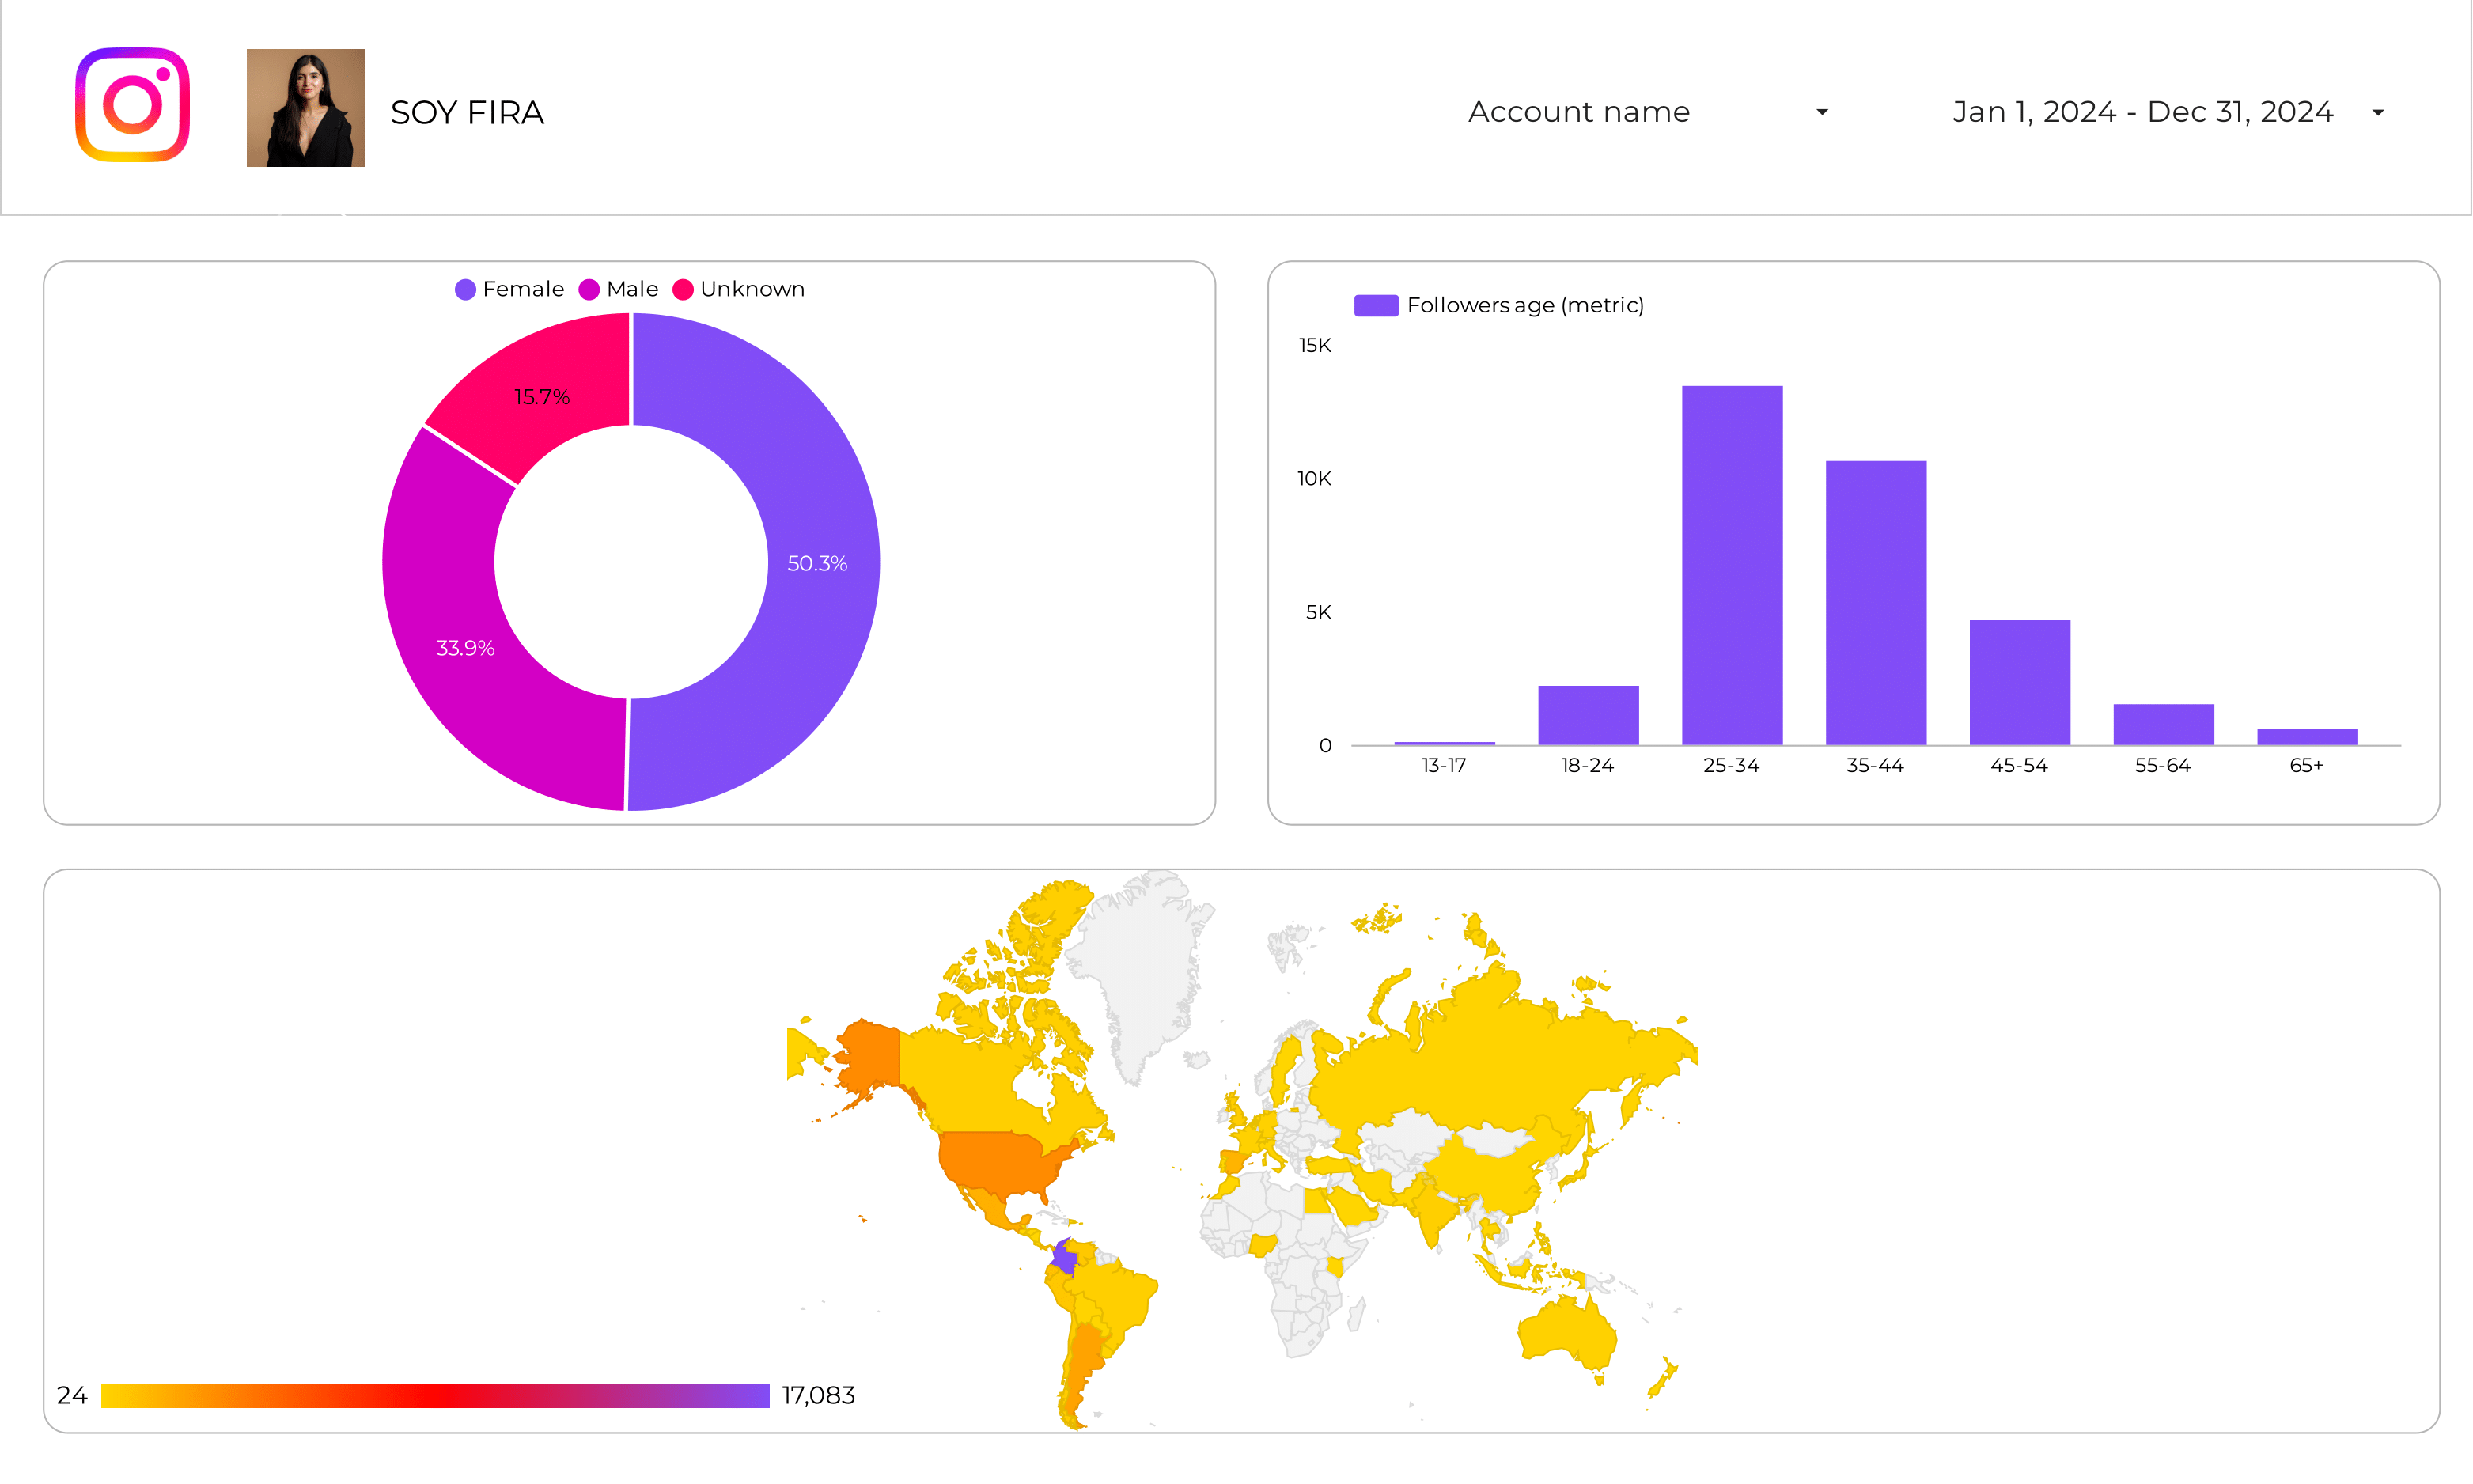
Modelo de relatório de KPIs de Instagram Insights para agências e equipes de marketing
Realiza un seguimiento de métricas clave con la plantilla de informe de KPIs de Instagram Insights. Analiza clics en el sitio web, visitas al perfil y engagement. Segmenta por campaña, ubicación y tiempo. Perfecto para que los marketers de redes sociales consoliden datos de Instagram Insights, optimizando la estrategia. Monitorea el rendimiento a través de demografías y objetivos para obtener insights accionables.