Free Linkedin report templates
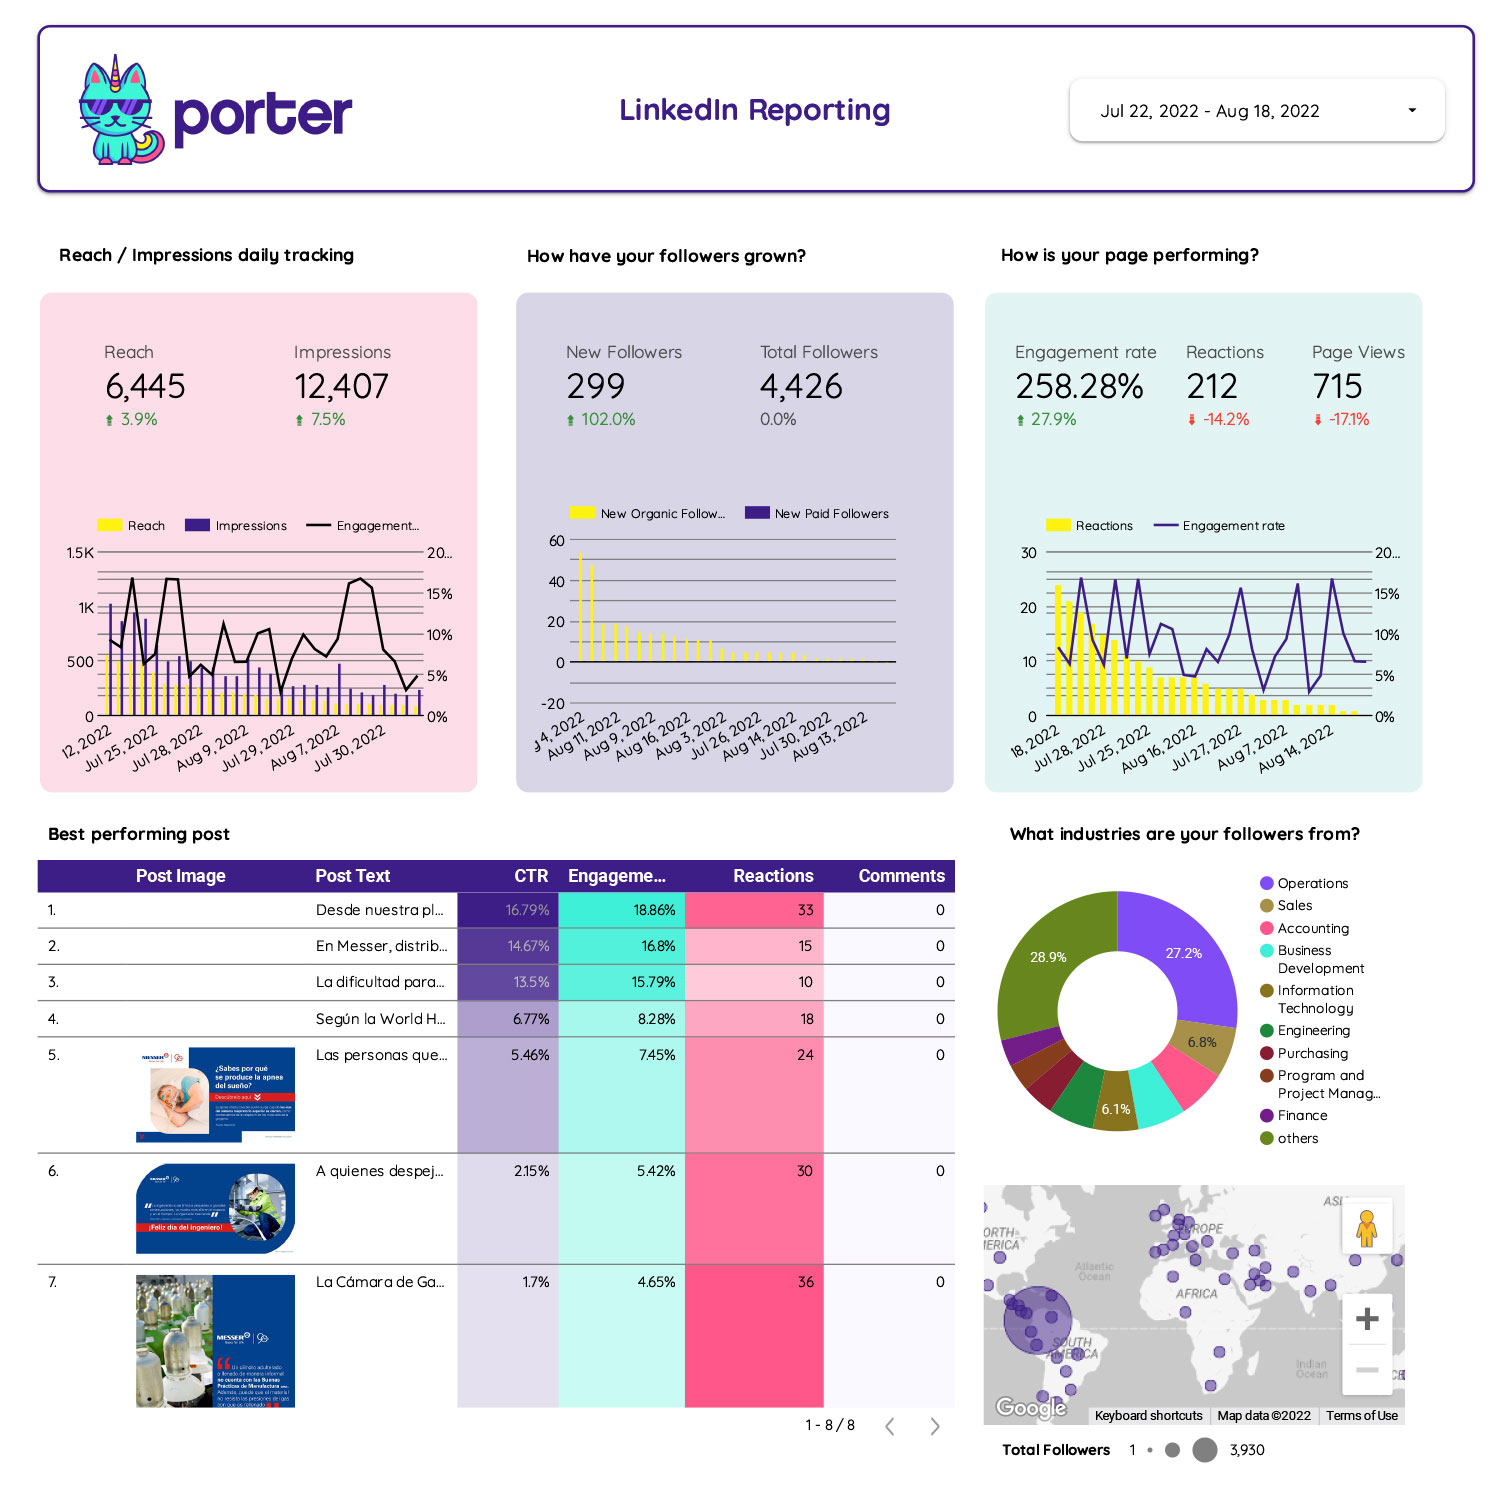
The LinkedIn reporting includes both organic data from LinkedIn Pages and Paid data from LinkedIn Ads.
The LinkedIn reporting includes both organic data from LinkedIn Pages and Paid data from LinkedIn Ads.

With two simple steps generate automatically a full report of your Instagram profile. Read and understand the performance of your content and how your audience is growing. Track your stories and conversion metrics in a Google Data Studio dashboard.
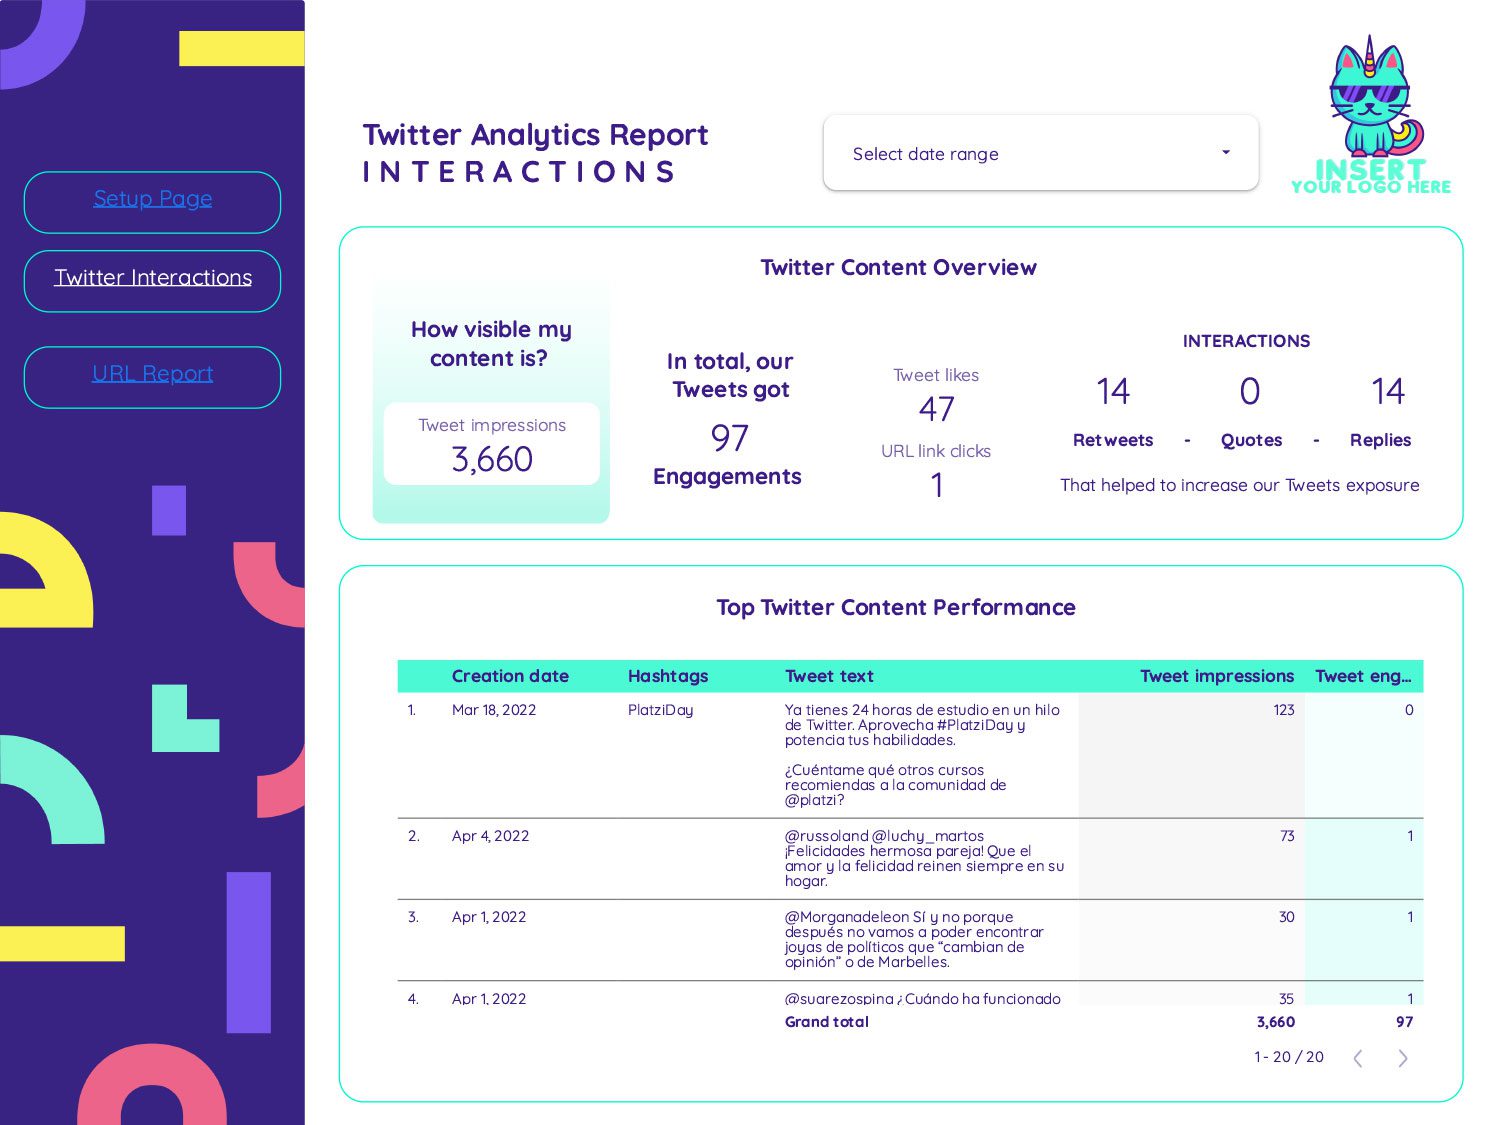
Home Twitter Analytics Twitter Analytics report template for Google Data Studio Automate your your Twitter reports on Google Data Studio to track followers, tweets, impressions,