





Trusted by 1,600+ marketing teams and agencies


What you can do with this cross-channel dashboard
Click a job to see its view on demo data, then paste its prompt into the same Claude chat.
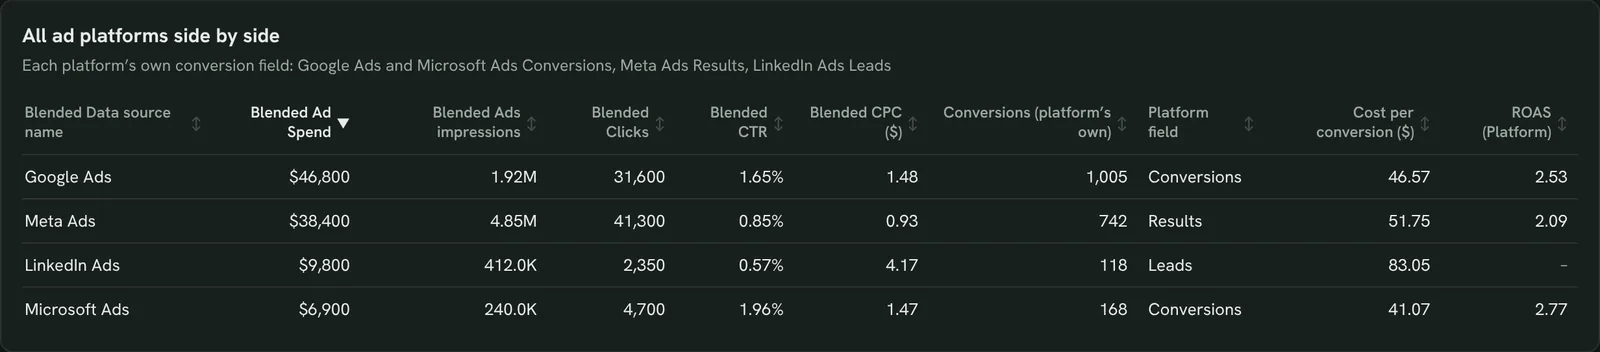
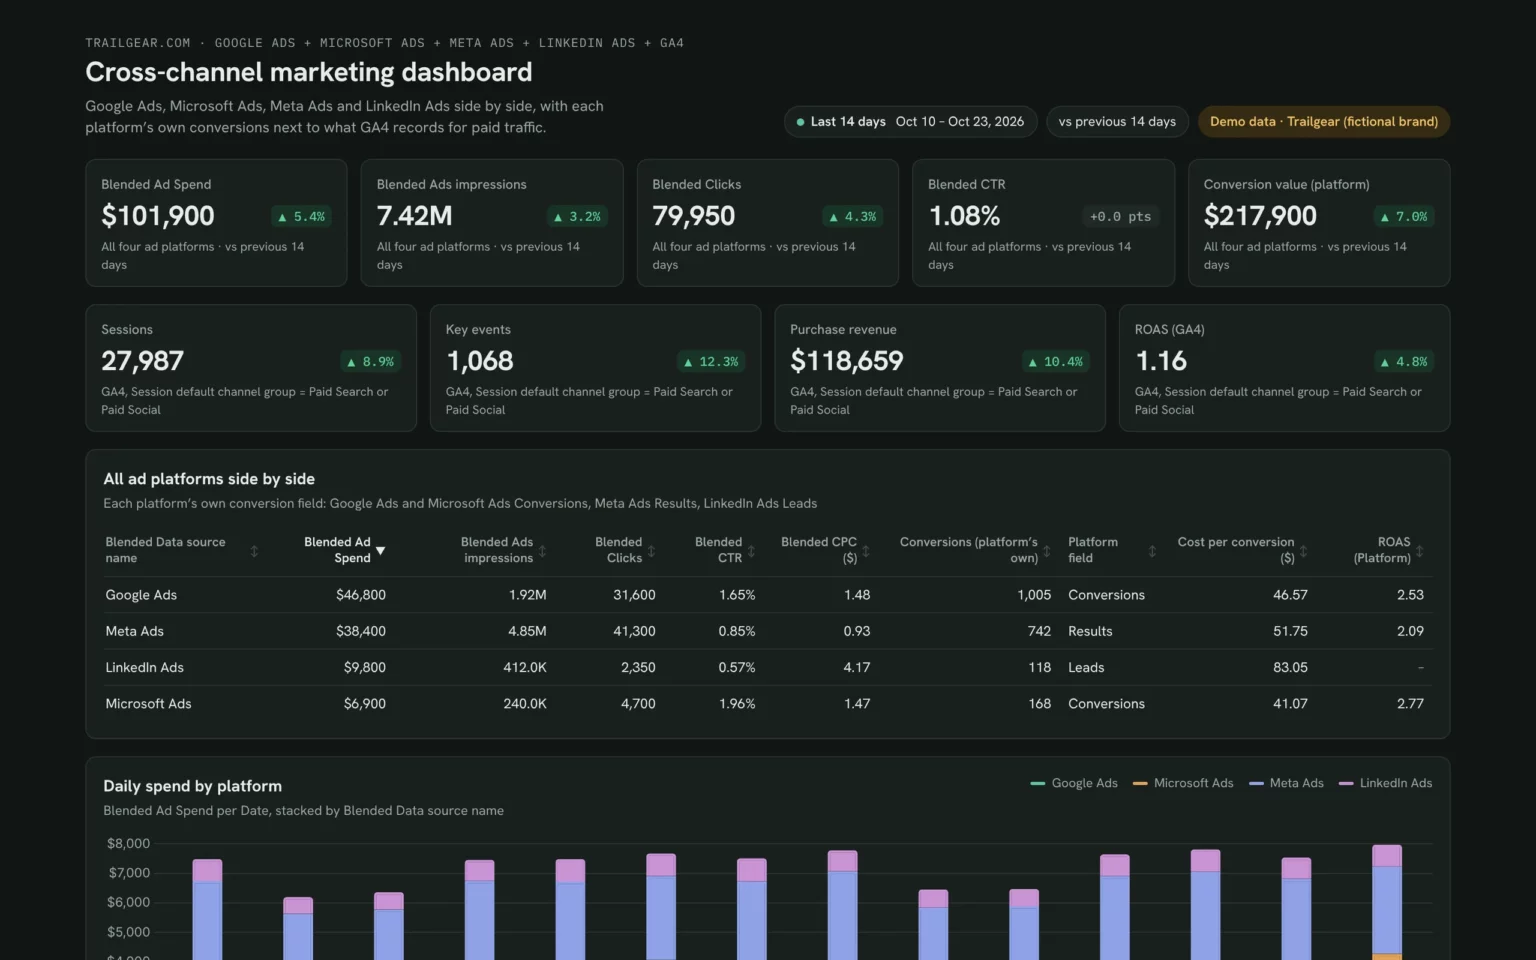
Compare every ad platform side by side
Spend, clicks, conversions, cost per conversion and ROAS for each platform in one table, so you stop switching between ad managers.
- Which platform has the lowest cost per conversion?
- Where did spend grow the most?
Show spend, clicks, CTR, CPC, each platform’s own conversions, cost per conversion and ROAS per ad platform for the last 14 days.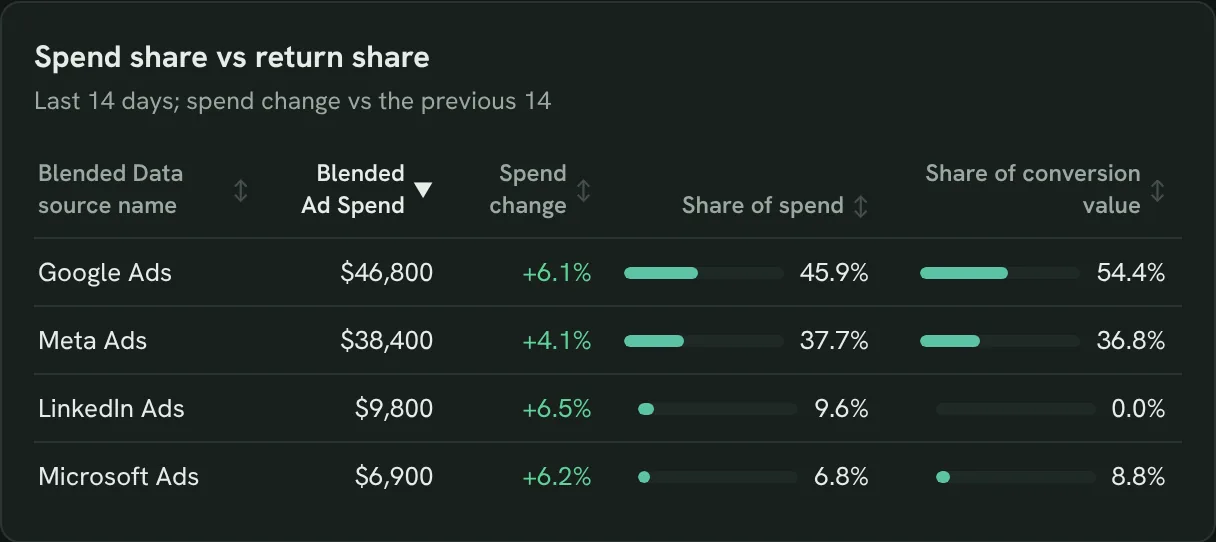
Decide where the next dollar goes
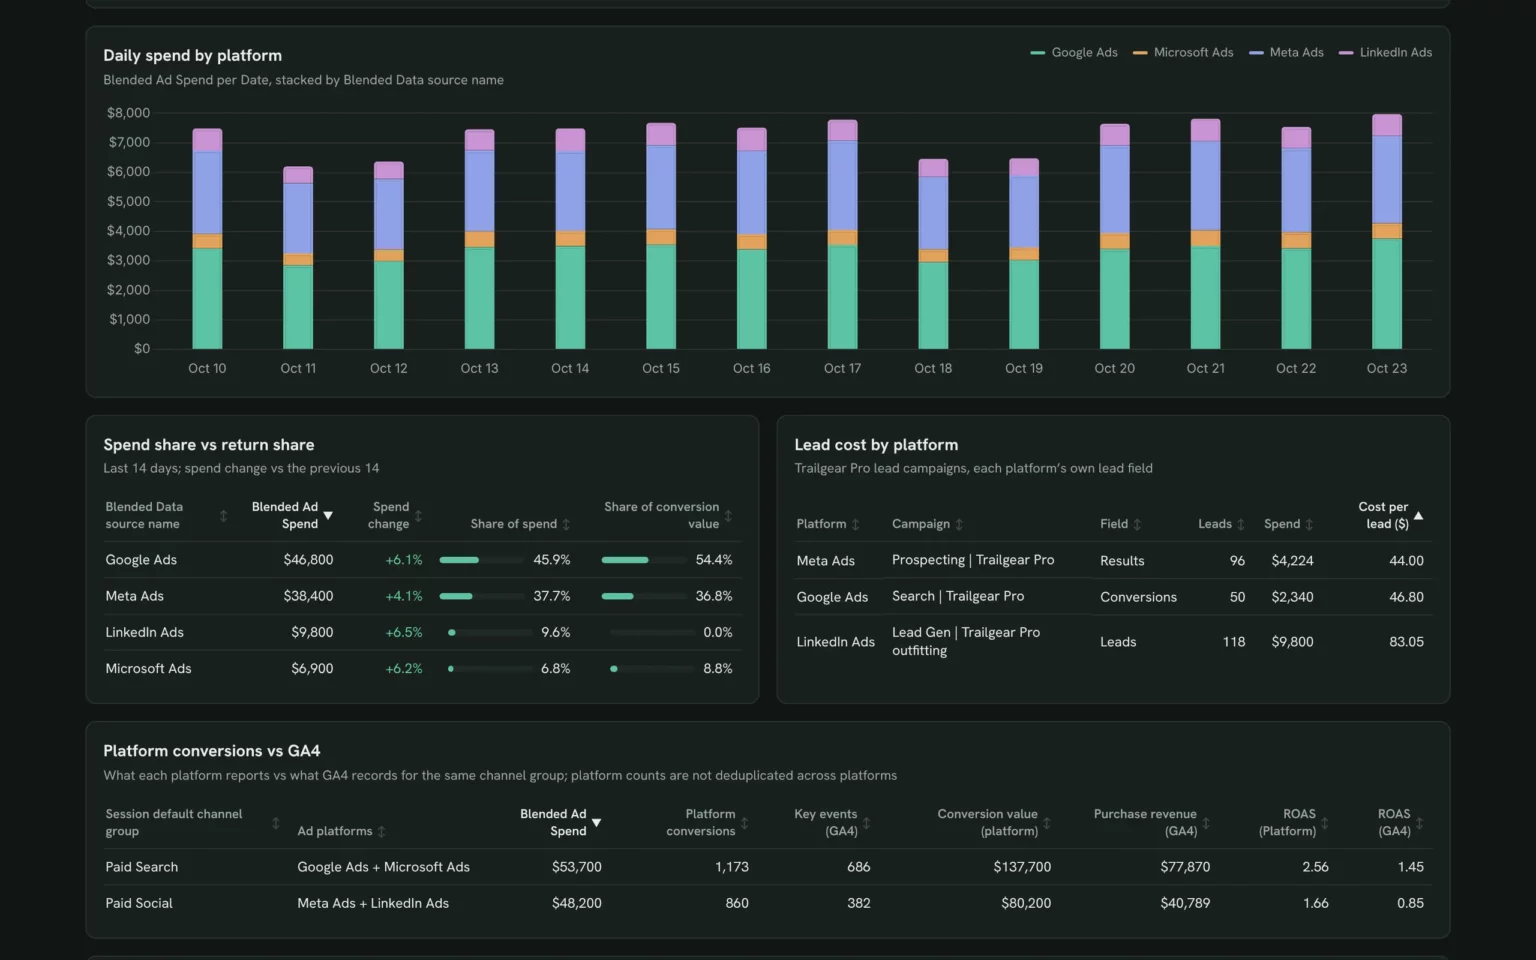
Each platform’s share of spend next to its share of conversion value, so you see which one returns more than it costs.
- Which platform takes more budget than it returns?
- Where should I move budget?
Show each ad platform’s spend, spend change, share of spend and share of conversion value for the last 14 days.
Check platform conversions against GA4
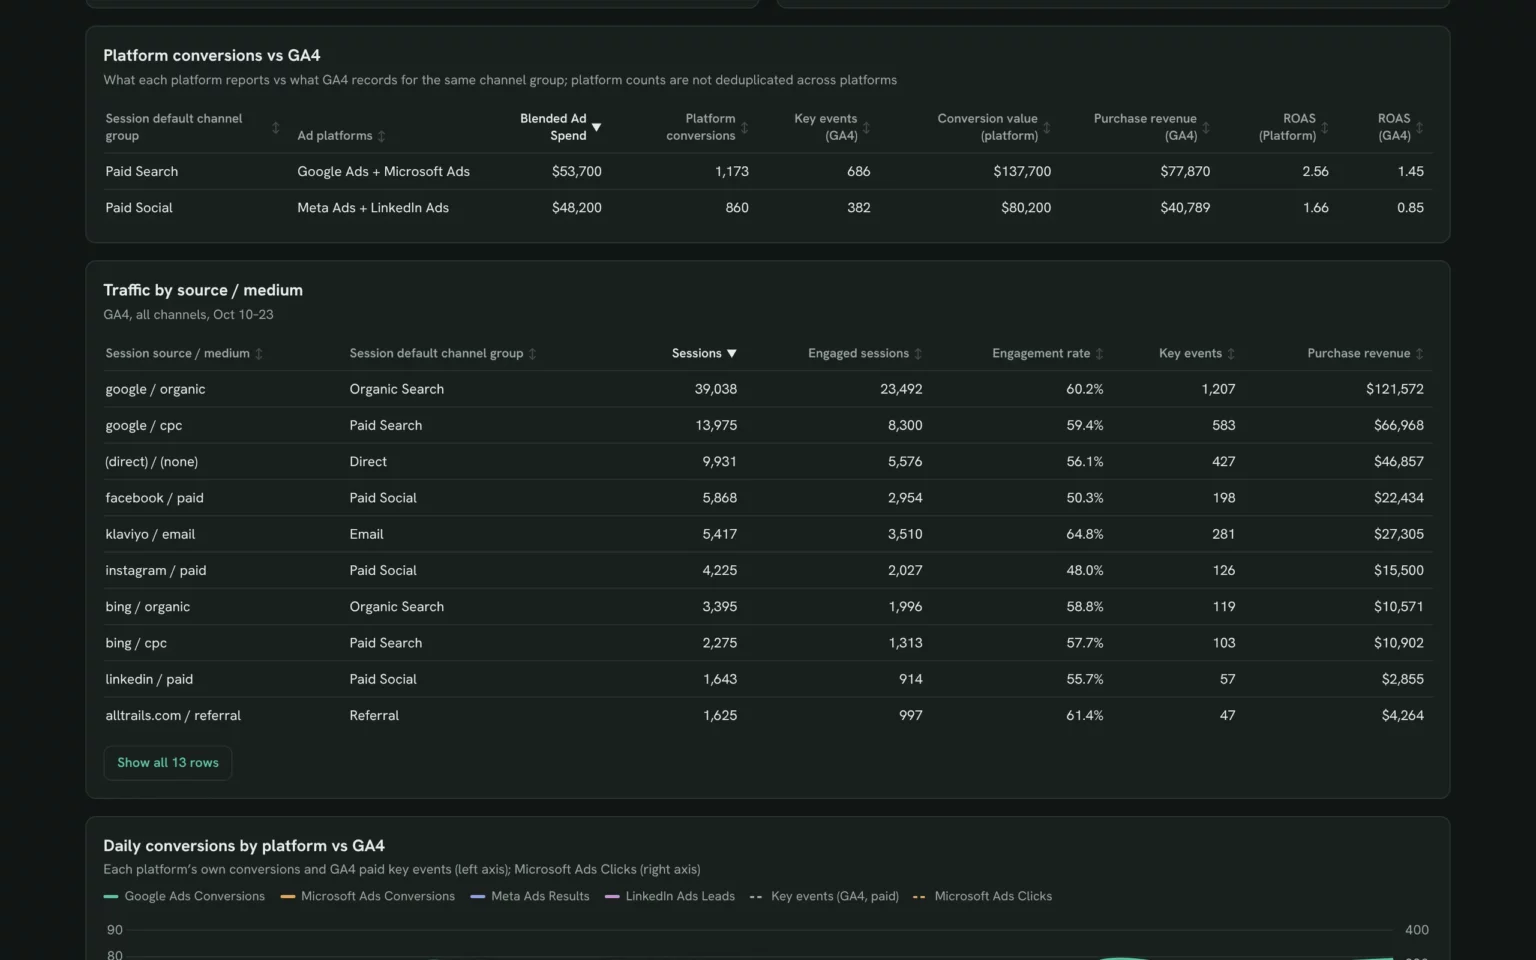
What the platforms report next to what GA4 records for the same paid traffic, so you know how much of each platform’s ROAS holds up.
- How far apart are platform conversions and GA4 key events?
- Is ROAS in GA4 lower than the platforms report?
For Paid Search and Paid Social, show platform spend, conversions and conversion value next to GA4 Key events and Purchase revenue, with ROAS from both.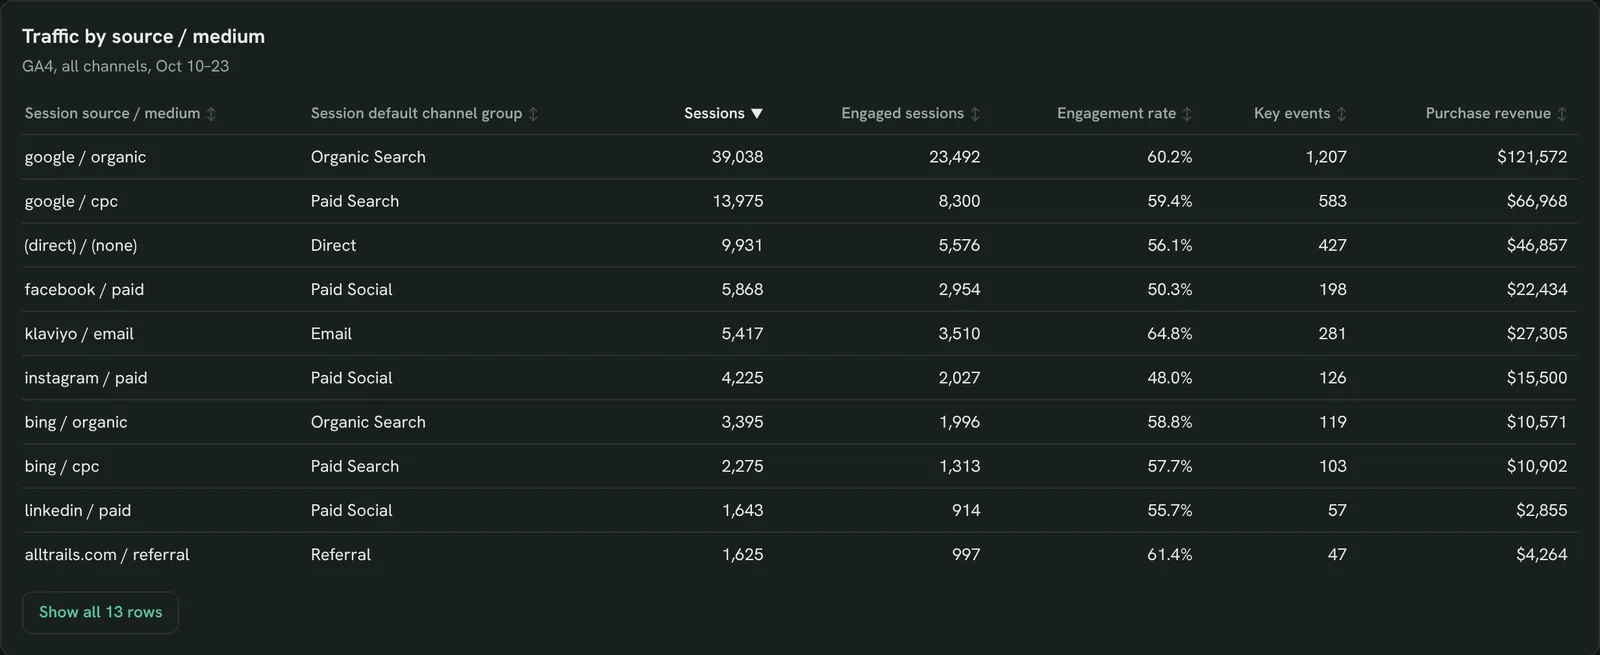
See which sources bring traffic that converts
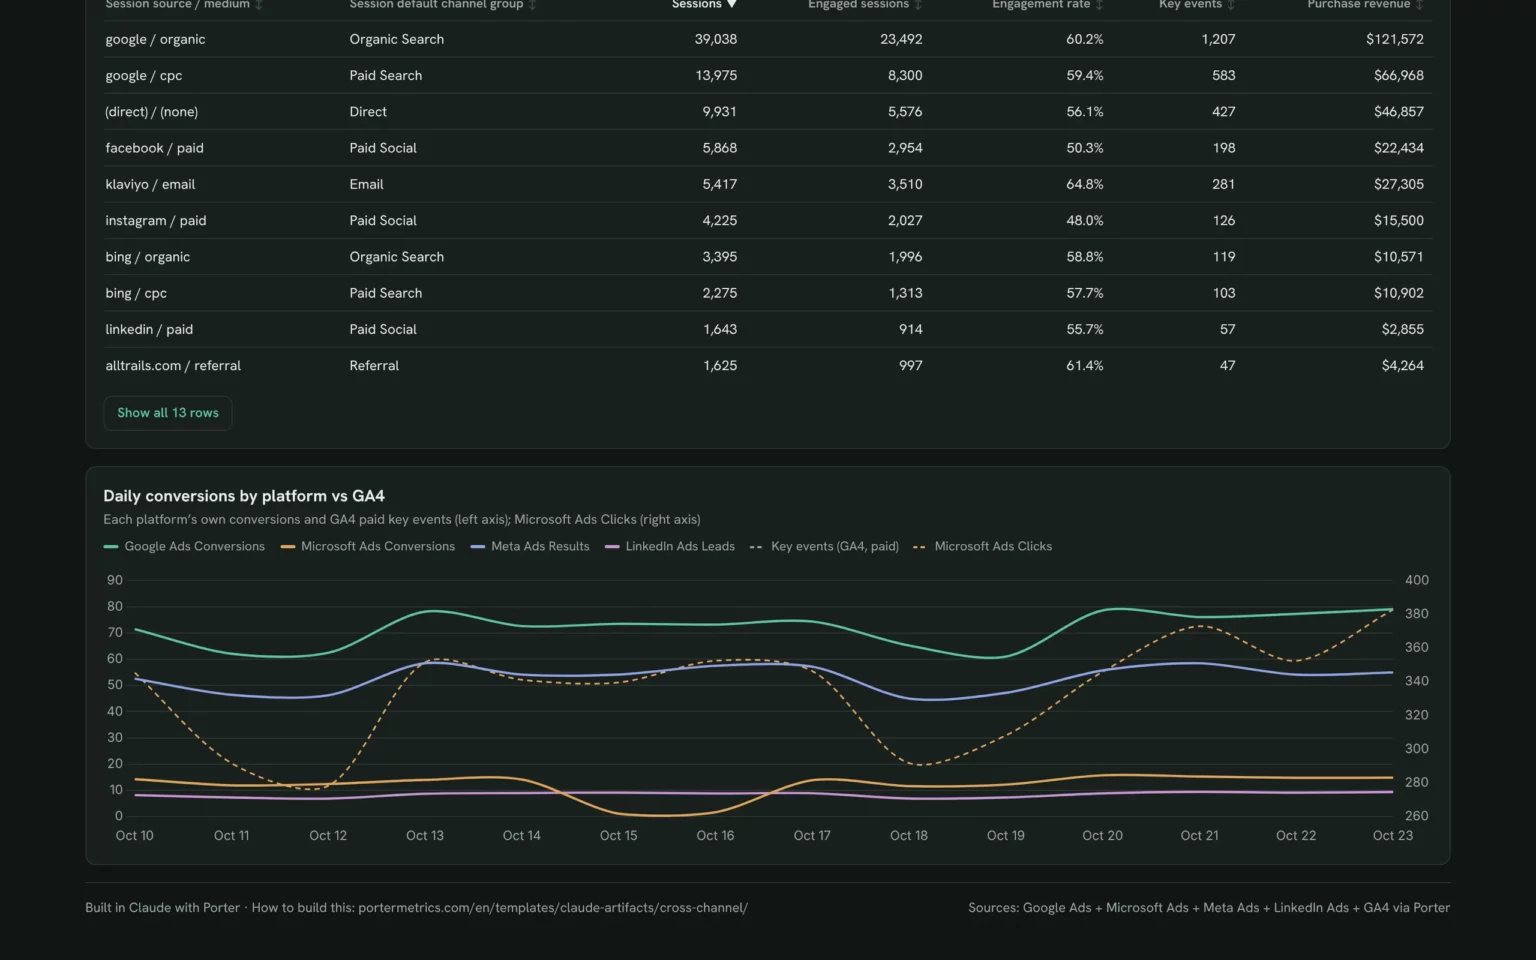
GA4 sessions, engagement, key events and revenue by source / medium, so paid traffic sits next to organic, email and referral.
- Which source / medium brings the most revenue?
- Which paid source has the weakest engagement?
Show GA4 Sessions, Engaged sessions, Engagement rate, Key events and Purchase revenue by Session source / medium for the last 14 days.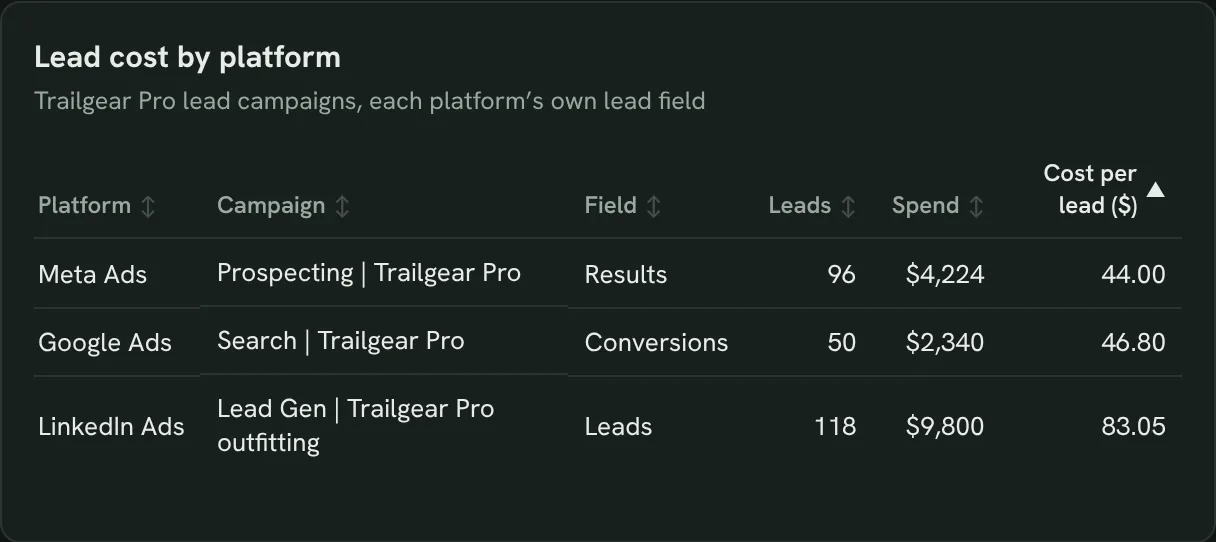
Compare lead cost across platforms
Leads and cost per lead from LinkedIn Ads, Meta Ads and Google Ads lead campaigns, so you know which platform brings leads cheapest.
- Which platform brings the cheapest leads?
- Is LinkedIn worth its higher cost per lead?
Show my lead campaigns on LinkedIn Ads, Meta Ads and Google Ads for the last 14 days with leads, spend and cost per lead.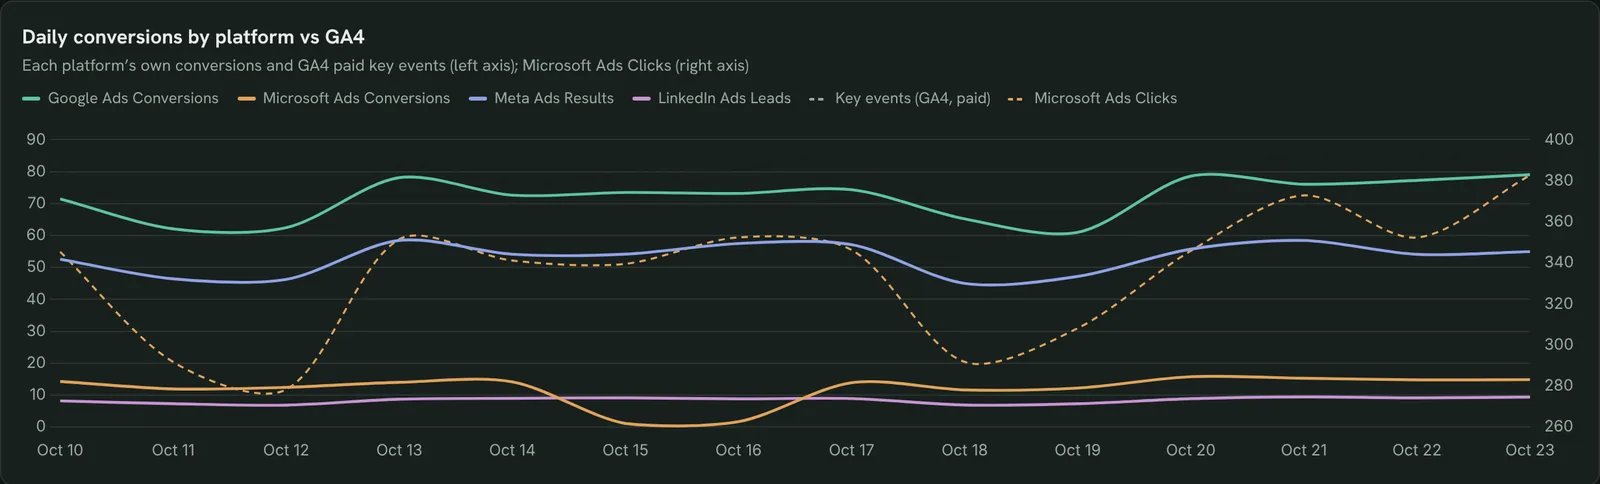
Catch a broken conversion tag
Daily conversions per platform next to GA4 key events, so a day when one platform drops to zero stands out.
- Did any platform stop reporting conversions?
- Do clicks hold when conversions drop?
Chart each ad platform’s daily conversions and GA4 paid key events for the last 14 days, and flag any day a platform drops more than 50%.How to set up the cross-channel dashboard in Claude
You need at least two ad platforms and GA4, a free Porter account and Claude Pro, Max, Team or Enterprise for Claude Dashboards. Setup takes about 10 minutes.
Connect your ad platforms and GA4 in Porter
Sign up free at Porter, open Data sources and connect Google Ads, Microsoft Ads, Meta Ads, LinkedIn Ads and Google Analytics 4. The Google Ads to Claude tutorial and the LinkedIn Ads to Claude tutorial show each click.
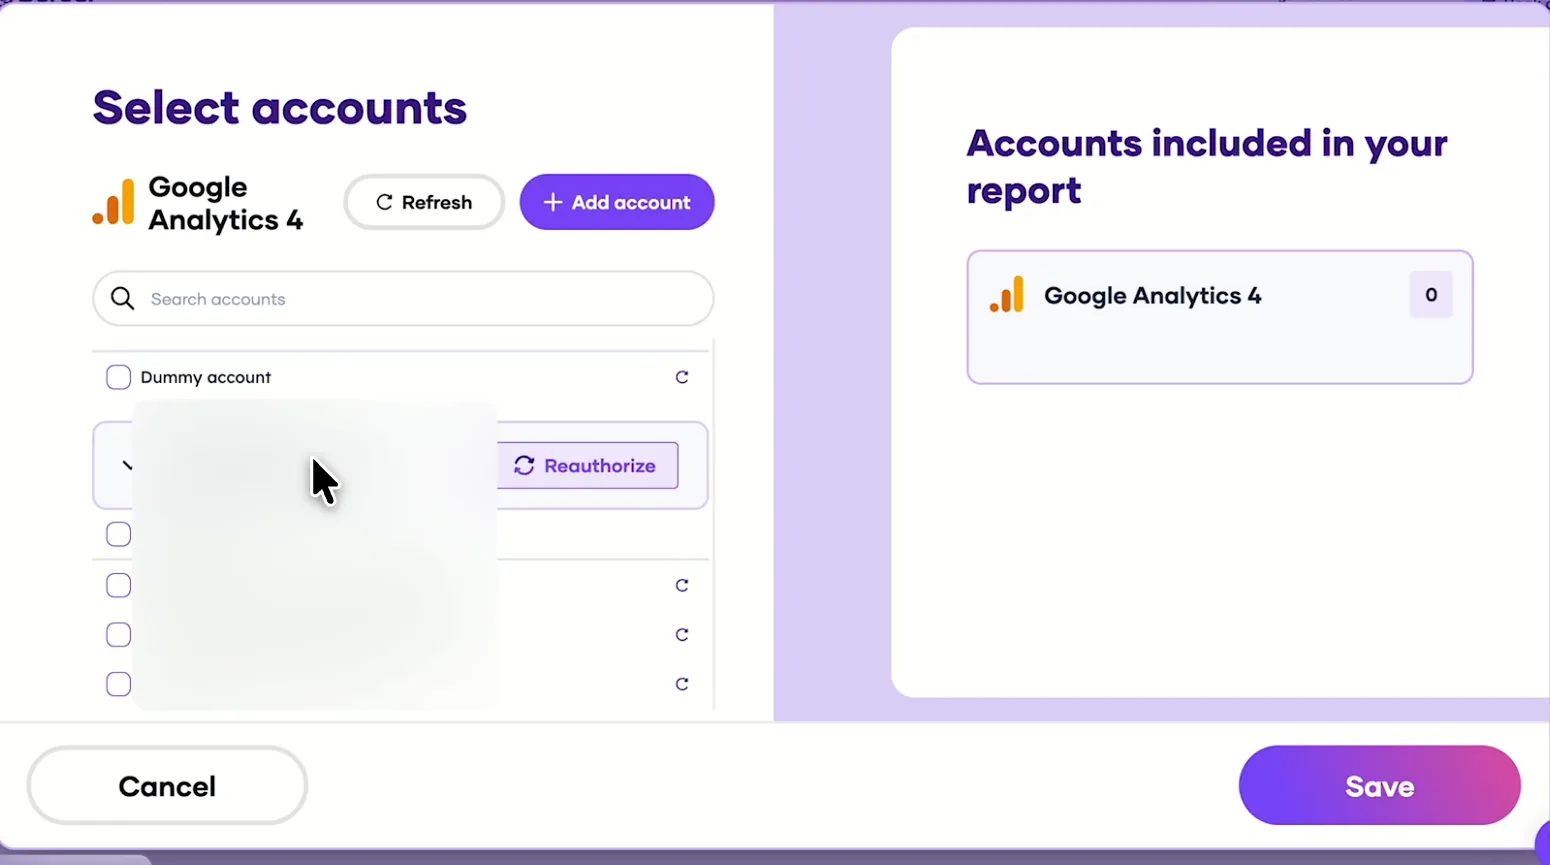
Pick the GA4 property Claude can read, then add each ad account the same way. Add Porter to Claude
In Claude, go to Customize → Connectors → Add custom connector, paste https://mcp.portermetrics.com/mcp and name it Porter Metrics. Click Continue, then sign in to Porter and allow access.
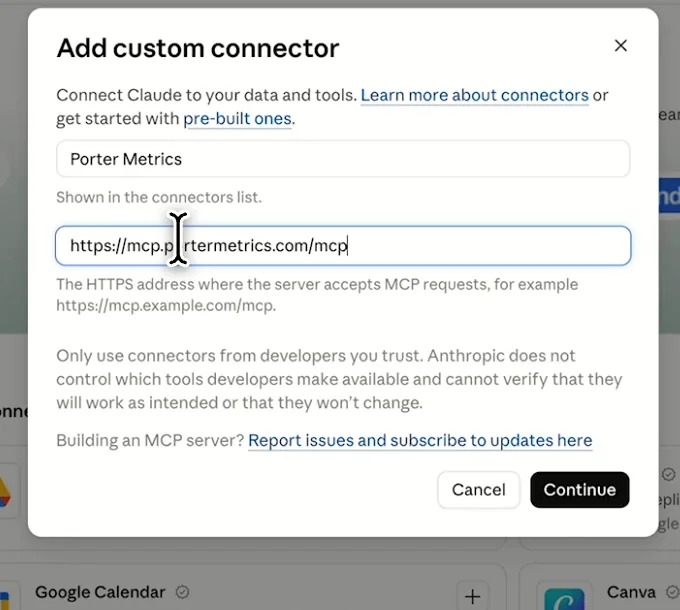
In Claude: Customize, Connectors, Add custom connector, then paste Porter’s MCP URL Paste the install prompt
Open a new chat in Claude, paste this prompt and replace [brand]. Platforms you don’t run are left out.
Install promptDuplicate this Claude dashboard template and keep its layout, views and styling: https://claude.ai/artifact/49eyFANktuqeKPYxq8fSAf Then rebuild it with my own data through Porter: a cross-channel marketing dashboard for [brand] for the last 14 days from all my connected ad platforms and GA4: KPI cards for ad spend, clicks, CTR, conversion value and GA4 paid sessions, key events and revenue against the previous 14 days; a table with every platform side by side, using each platform’s own conversion field; daily spend by platform; share of spend vs share of conversion value; cost per lead by platform; platform conversions vs GA4 by channel group; GA4 traffic by source / medium; and daily conversions per platform vs GA4. Open in Claude with this prompt

The first thing Claude builds: spend, clicks and conversion value across your ad platforms. Demo data shown.
How to use the Google Ads MCP in Claude (no code)
Cross-channel dashboard fields and data
The template reads spend, clicks and conversions from each ad platform and sessions, key events and revenue from GA4, lined up by date.
Top 5 cross-channel KPIs to watch
Trailgear demo data · last 14 days vs the 14 before
- Cost per conversion$50.12−0.4%
Compare it per platform, using each platform’s own conversion field, before comparing totals.
- Ad spend$101,900+5.4%
Read each platform’s share of spend next to its share of return, not on its own.
- ROAS (Platform)2.14+1.5%
Check it against ROAS in GA4. A wide gap means the platforms count the same sales.
- Paid sessions (GA4)27,987+8.9%
Paid sessions up and key events flat? Check the landing pages before the bids.
- Paid key events (GA4)1,068+12.3%
A platform whose conversions drop while GA4 key events hold has a tracking problem, not a demand problem.
How the numbers are calculated
- Ad spend
- Google Ads Cost + Microsoft Ads Spend + Meta Ads Amount spent + LinkedIn Ads Spent.
- Cost per conversion
- Each platform’s spend ÷ its own conversion field: Conversions, Results or Leads.
- ROAS (Platform)
- The conversion value each platform reports ÷ its spend.
- ROAS (GA4)
- GA4 Purchase revenue from Paid Search and Paid Social ÷ ad spend.
- Share of return
- A platform’s conversion value ÷ conversion value across all platforms.
Metrics
 Cost
- Conversions
- Conversions value
 Spend
- Conversions
 Amount spent
- Results
- Purchase conversion value
 Spent
- Leads
 Sessions
- Engagement rate
- Key events
- Purchase revenue
Dimensions
- Date
- Session default channel group
- Session source / medium
- Campaign
See all fields:Google Ads · 1,042 fieldsMeta Ads · 1,378 fieldsLinkedIn Ads · 226 fieldsMicrosoft Ads · 412 fieldsGoogle Analytics 4 · 285 fields
What makes this cross-channel dashboard different
What no single ad manager or GA4 shows on one screen.
Every platform in one table
Google Ads, Microsoft Ads, Meta Ads and LinkedIn Ads share one set of columns.
Each platform’s own conversions
Results, Conversions and Leads stay labelled, so you don’t add up numbers that mean different things.
Platforms checked against GA4
See each platform’s ROAS next to ROAS in GA4 for the same traffic.
Days that cover the same hours
Porter lines up each platform’s time zone, so daily totals match.
Ask where to move budget
See one platform’s CPA rise, then ask Claude in the same chat which campaign caused it.
Shared without ad account access
Publish it in Porter and send a link, PDF or Monday email, with your logo.
What the dashboard includes
- Nine KPI cards for spend, clicks, conversion value and GA4 paid traffic
- Every ad platform side by side
- Daily spend by platform
- Share of spend vs share of return
- Cost per lead by platform
- Platform conversions vs GA4 and traffic by source / medium
- A daily tracking check per platform
Related dashboard templates
 Claude
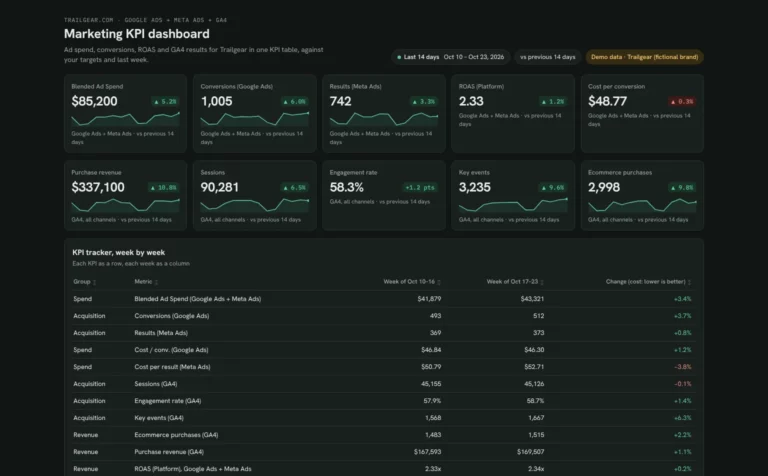
Marketing KPI dashboard template
Track ad spend, conversions and revenue week by week against your targets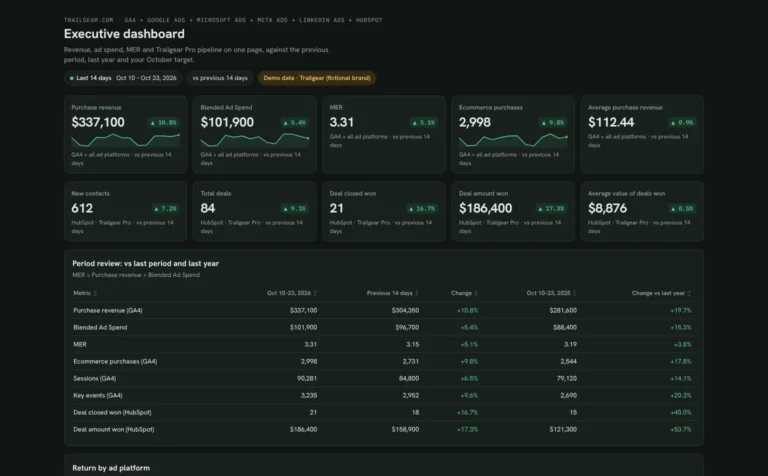 Claude

Executive dashboard template
Show leadership revenue, ad spend, MER and pipeline on one page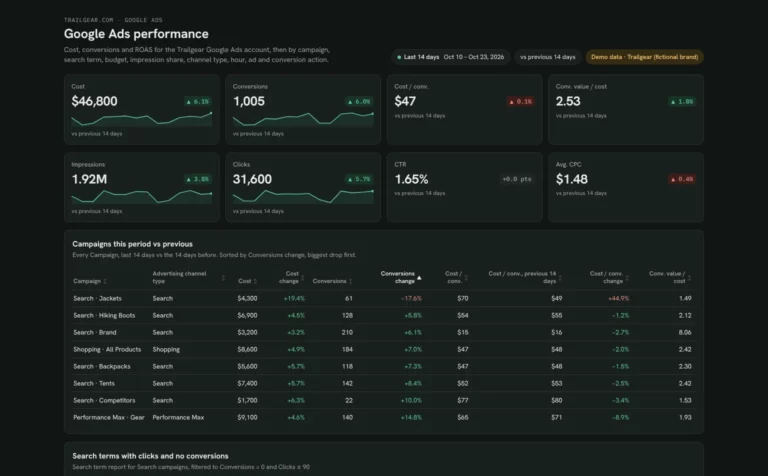 Claude
Google Ads dashboard template
Find search terms that waste spend and see which campaigns are limited by budget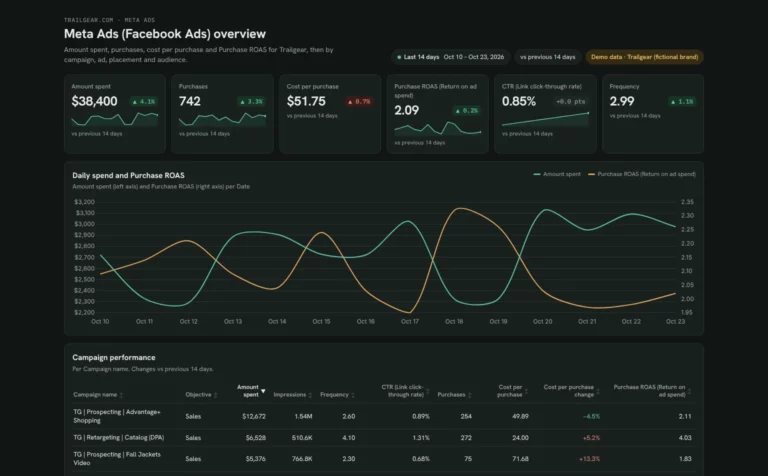 Claude
Meta Ads dashboard template
Track Meta Ads spend, ROAS and cost per purchase by campaign, ad and placement, and catch ad fatigue earlyBrowse more Claude dashboard templates
By data source
Google AdsGoogle Ads dashboardROAS dashboardSEO marketing dashboardPPC dashboardSEM dashboard
Meta AdsMeta Ads dashboard
LinkedIn AdsLinkedIn Ads dashboard
Microsoft AdsMicrosoft Ads dashboard
GA4Google Analytics dashboardGA4 SEO dashboardSEO dashboardMonthly SEO dashboardClient SEO dashboard
By use case: Marketing overview
Marketing dashboardMarketing KPI dashboardExecutive dashboard
 Data Studio
 ChatGPT
Get your free cross-channel dashboard
Sign up free, connect your ad platforms and GA4 and paste the prompt. Your own data fills the same layout as the demo.
Free plan · 14-day trial · No card needed