




Best Free Quarterly Report Templates for Data Studio (2026)
Free quarterly marketing report templates for Data Studio. Summarize Q1-Q4 performance with professional quarterly business reviews.
Conecte seus dados grátis →Última atualização: Abril 2026
Browse 30 Quarterly Report Templates for Data Studio
Escolha da nossa biblioteca de modelos gratuitos e white-label de quarterly templates. Cada modelo acompanha o funil completo: visibilidade (impressões, alcance), engajamento (CTR, interações) e conversão (leads, receita). Organizados seguindo o SUMAS framework com segmentação por canal, campanha, audiência e período.
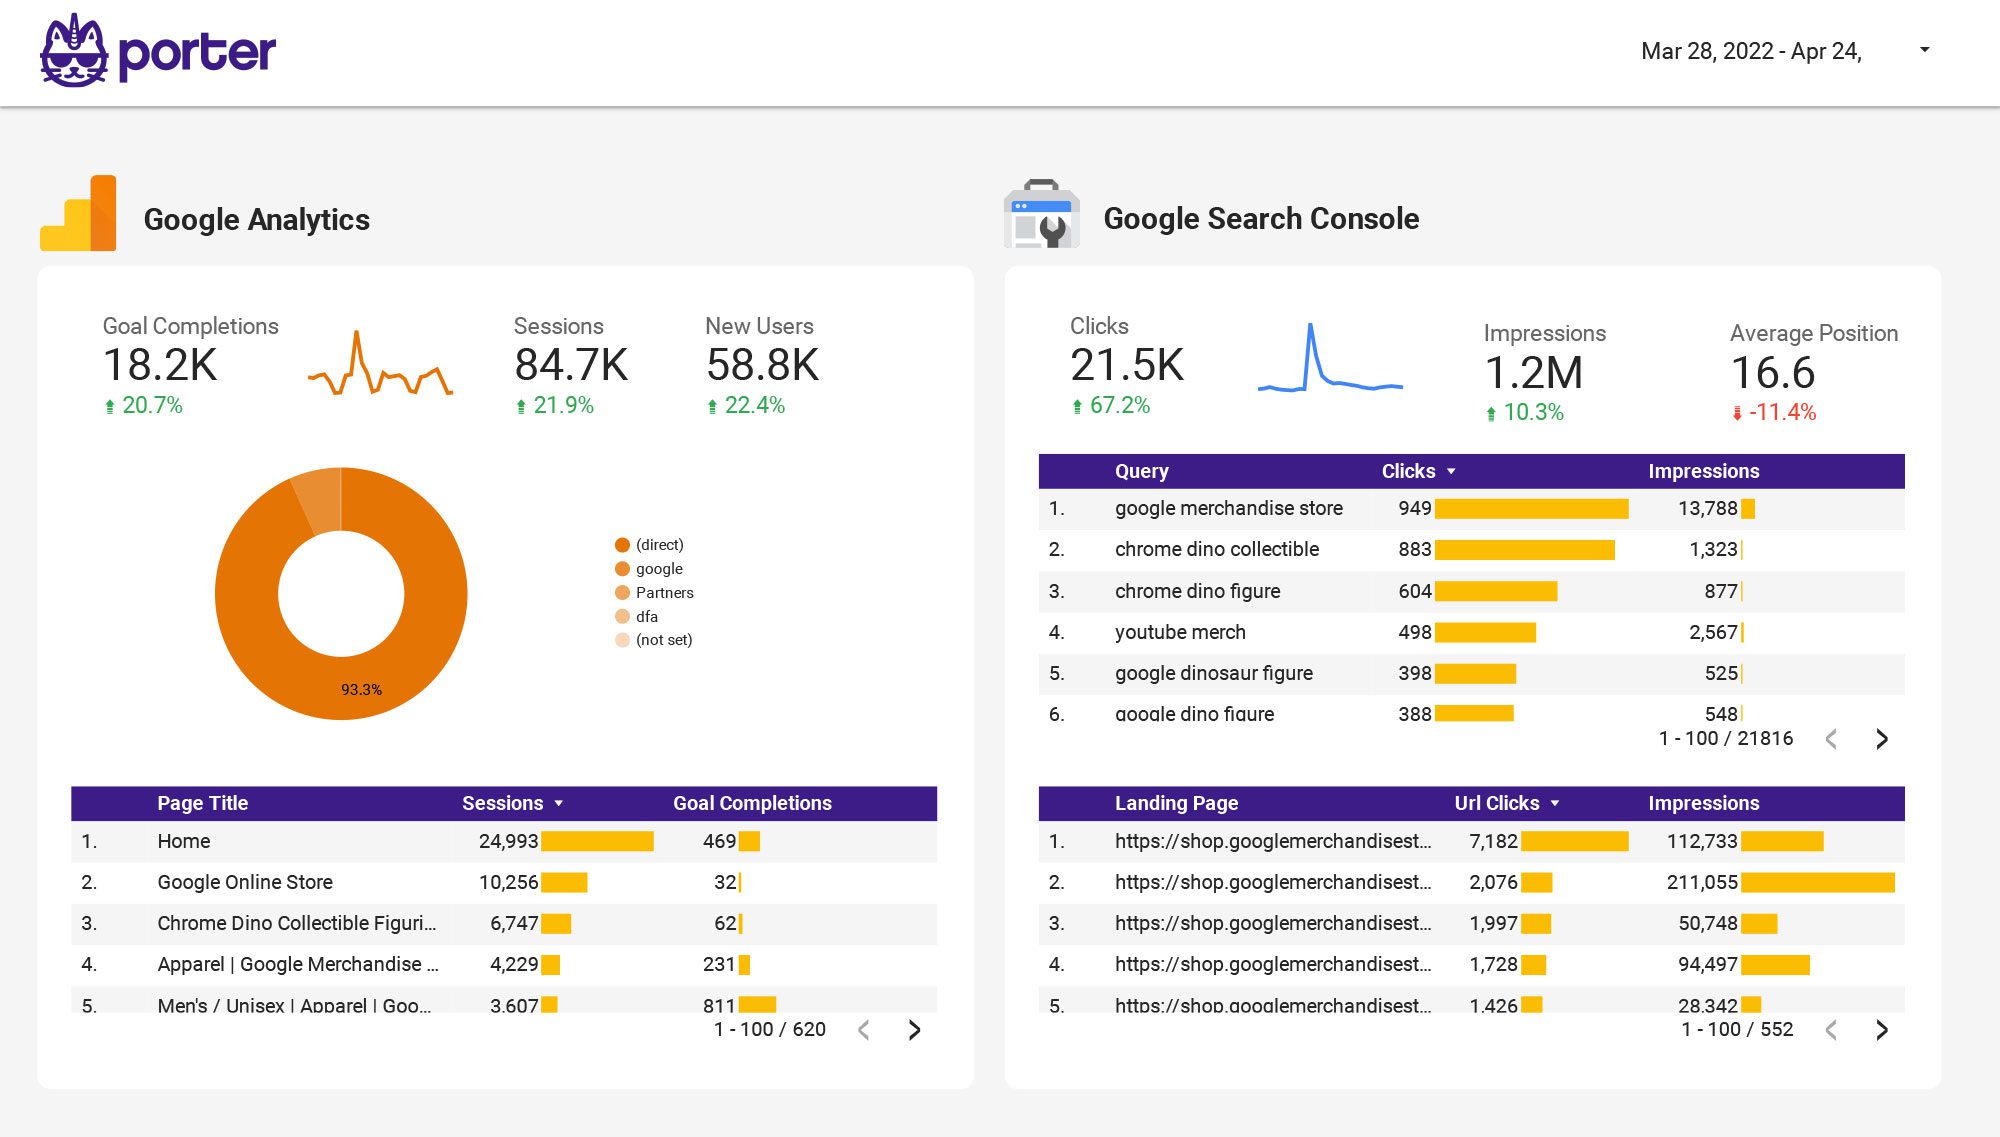
Multi-channel Marketing performance Report template for Data Studio by Porter
Acompanhe impressions across channels → CTR by channel, engagement rate → cross-channel conversions, ROI. Segmente por channel, campaign, date.

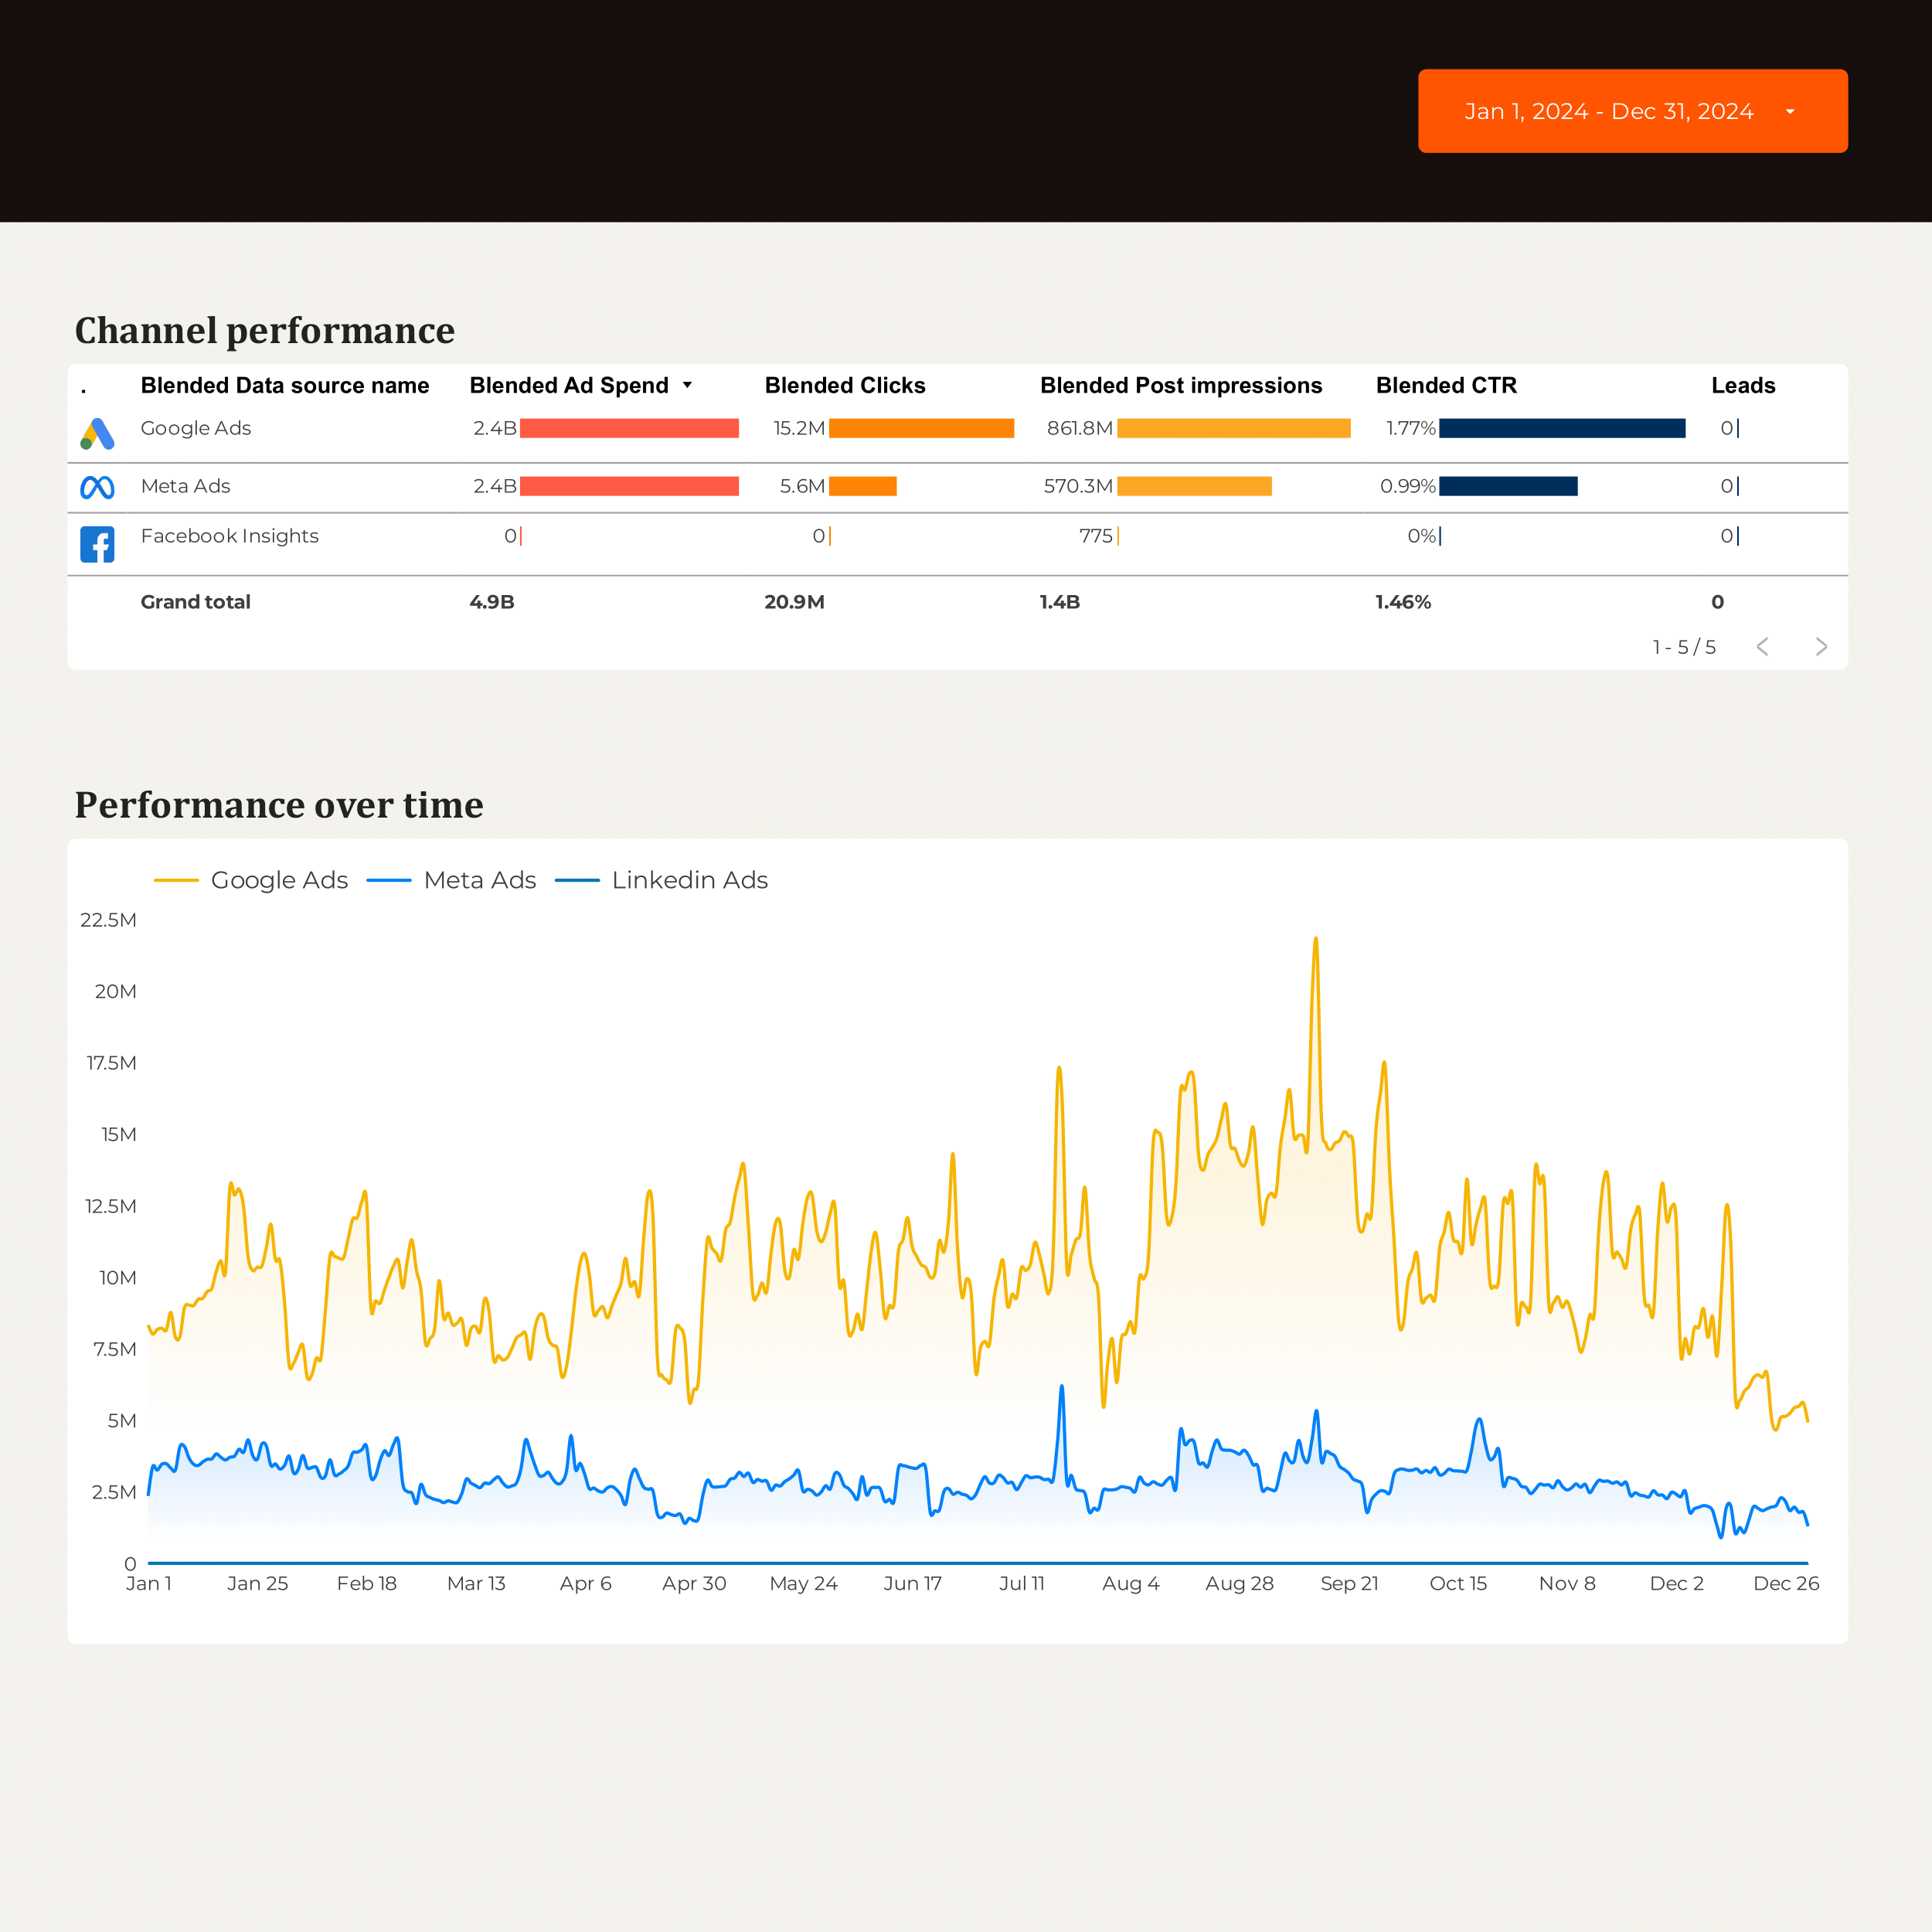
B2B Marketing performance Report template for Data Studio by Porter
Acompanhe account reach, impressions → engagement by account → MQLs, SQLs, pipeline contribution. Segmente por account, campaign, stage.
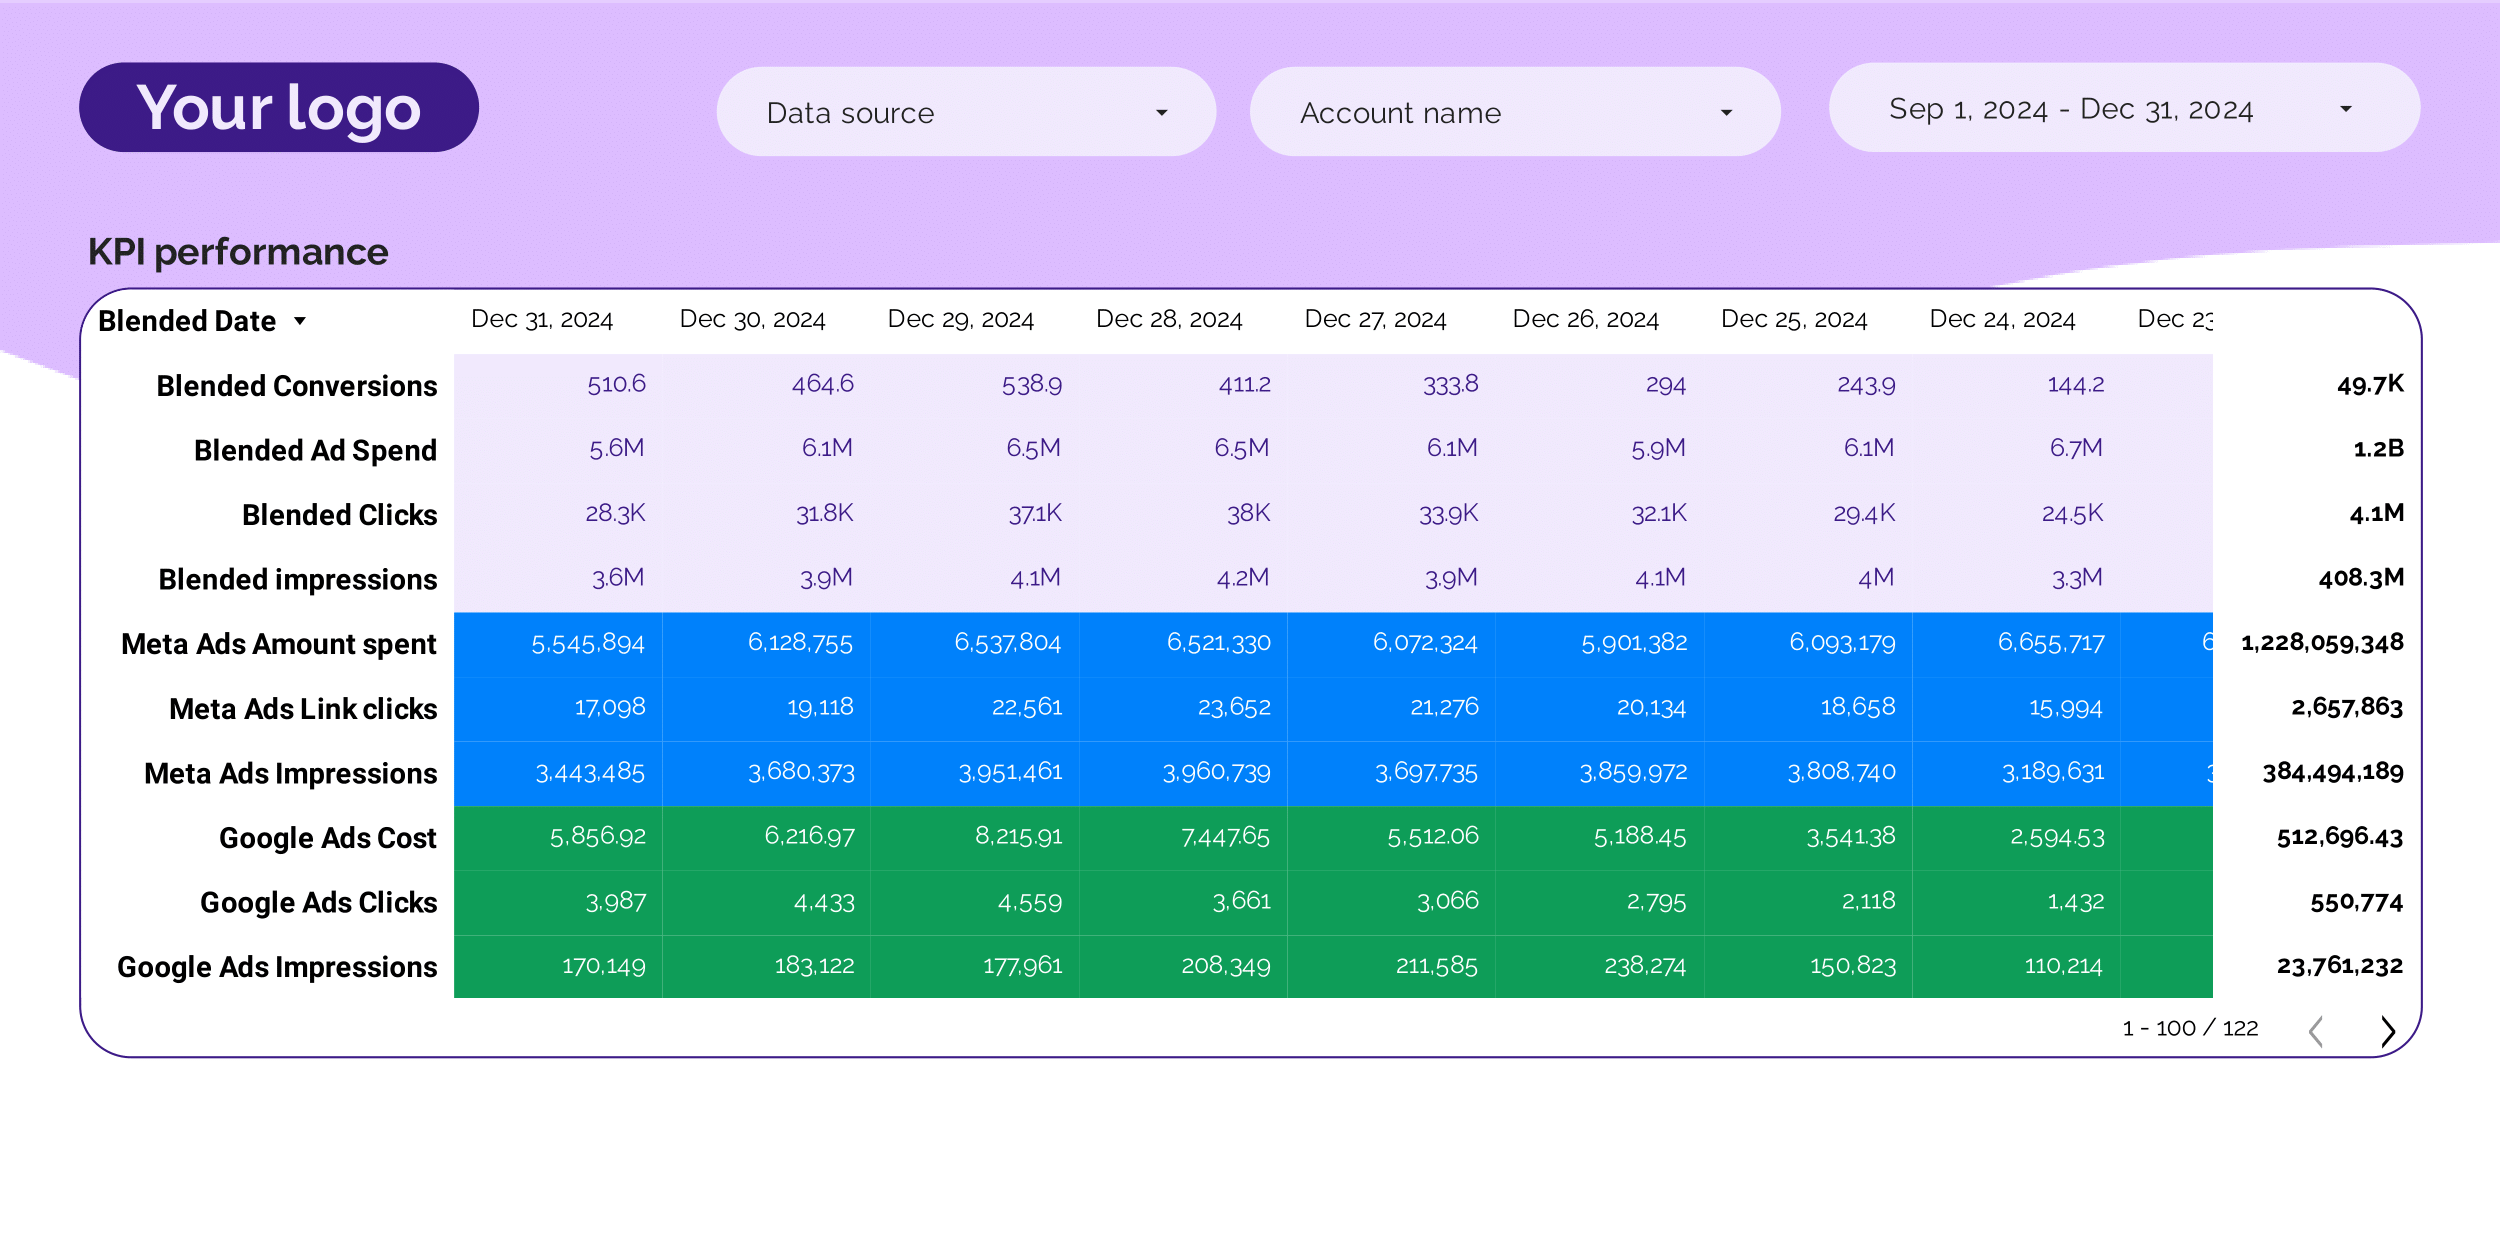
PPC KPIs Report template for Data Studio by Porter
Acompanhe impression trends vs target → CTR vs benchmark, CPC tracking → ROAS attainment, CPA vs target. Segmente por KPI, platform, campaign.
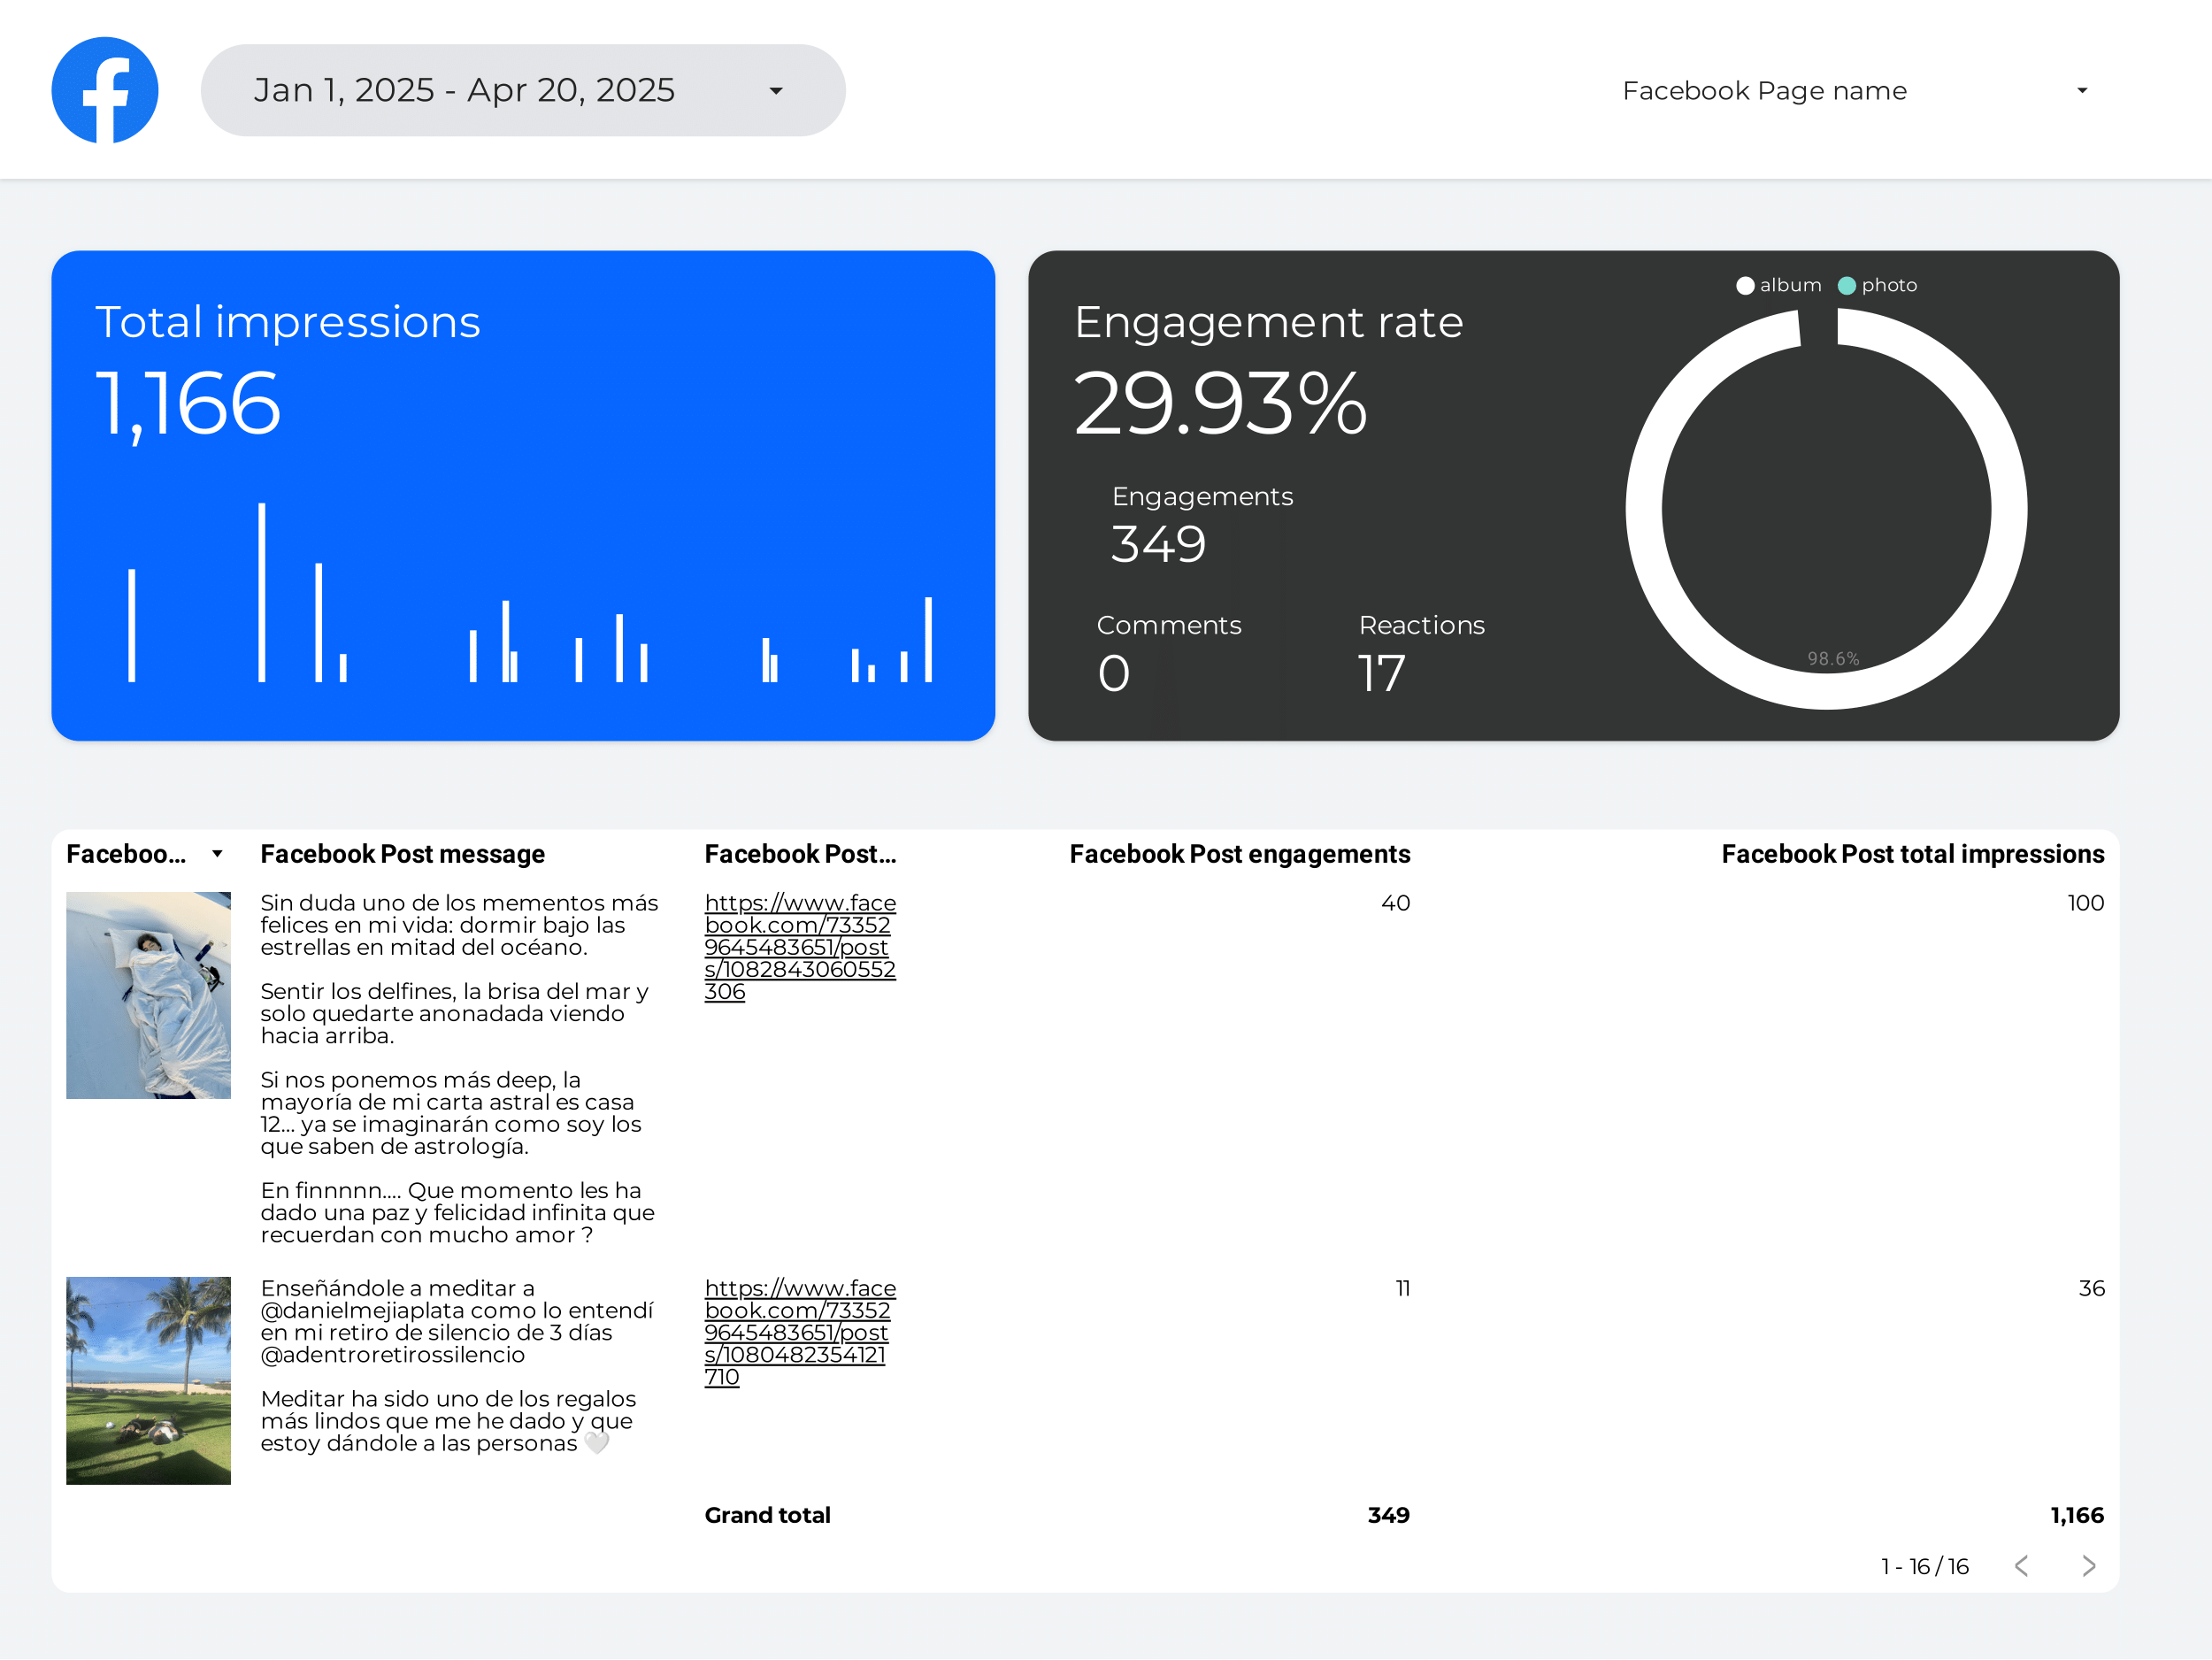
Creator marketing Report template for Data Studio by Porter
Acompanhe creator reach, impressions → engagement per creator, saves → conversions per creator, ROI. Segmente por creator, platform.
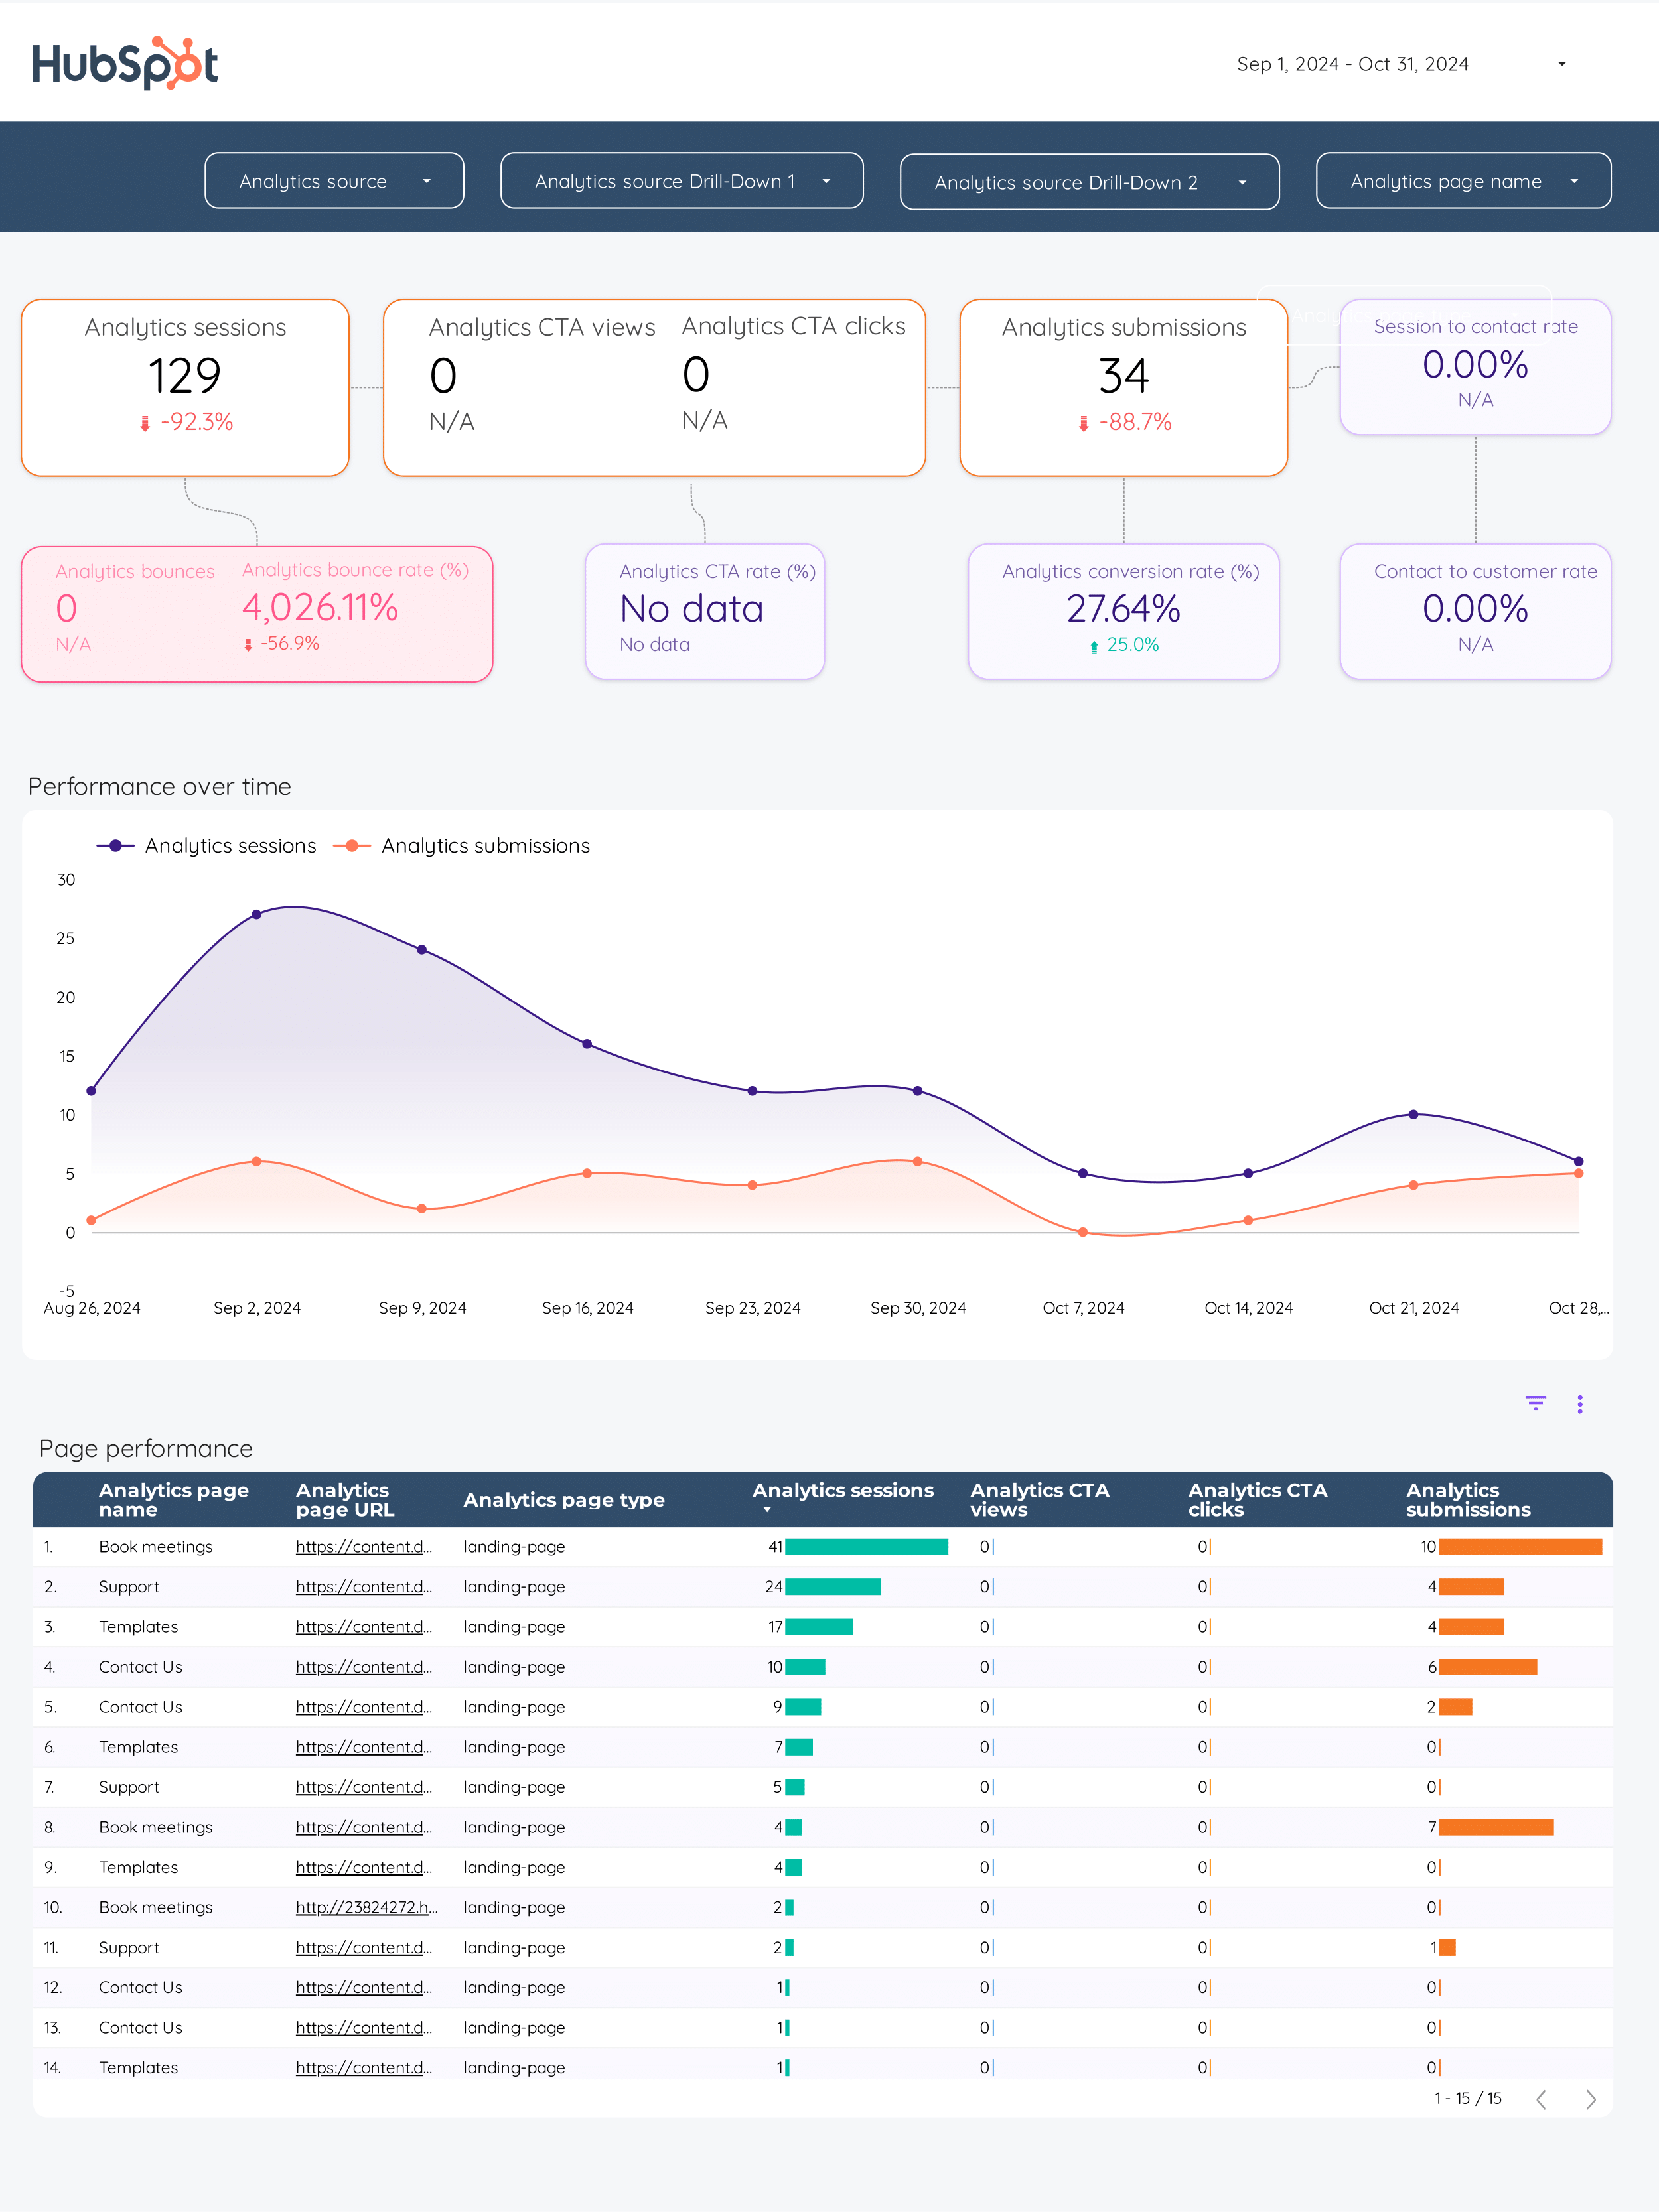
Inbound marketing Report template for Data Studio by Porter
Acompanhe blog traffic, social reach → content downloads, form views → MQLs, SQLs, pipeline generated. Segmente por content asset, channel, stage.
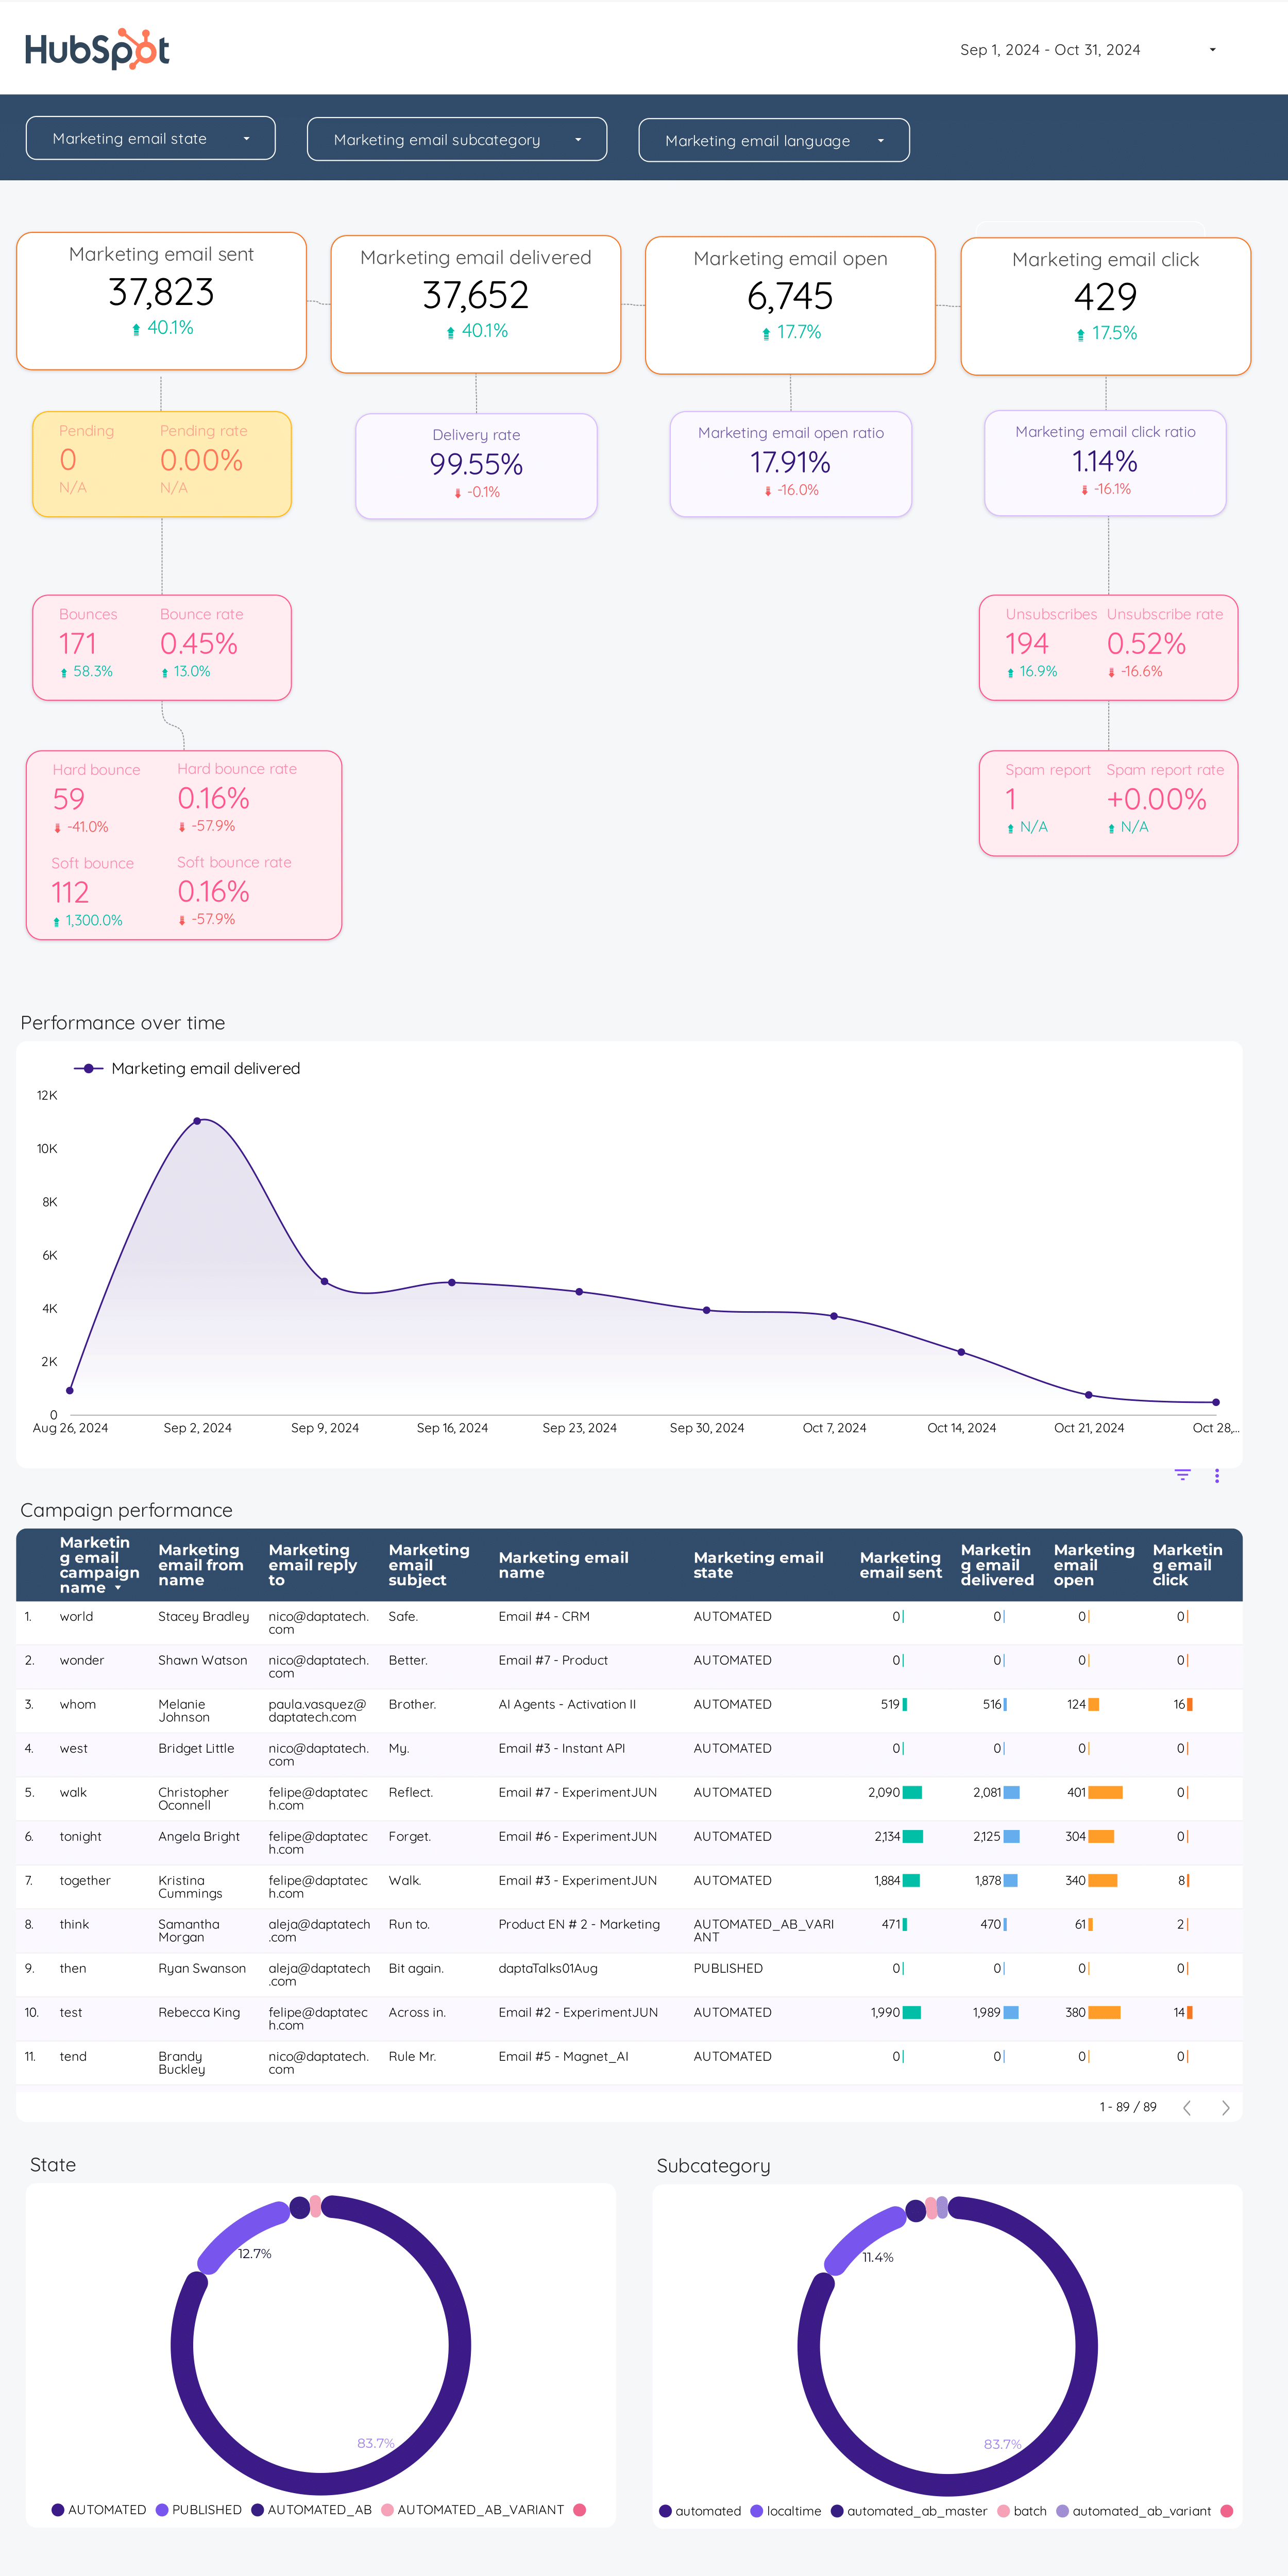
Email marketing Report template for Data Studio by Porter
Acompanhe emails sent, deliverability → open rate, CTR, unsubscribes → email revenue, conversion. Segmente por campaign, segment, time.
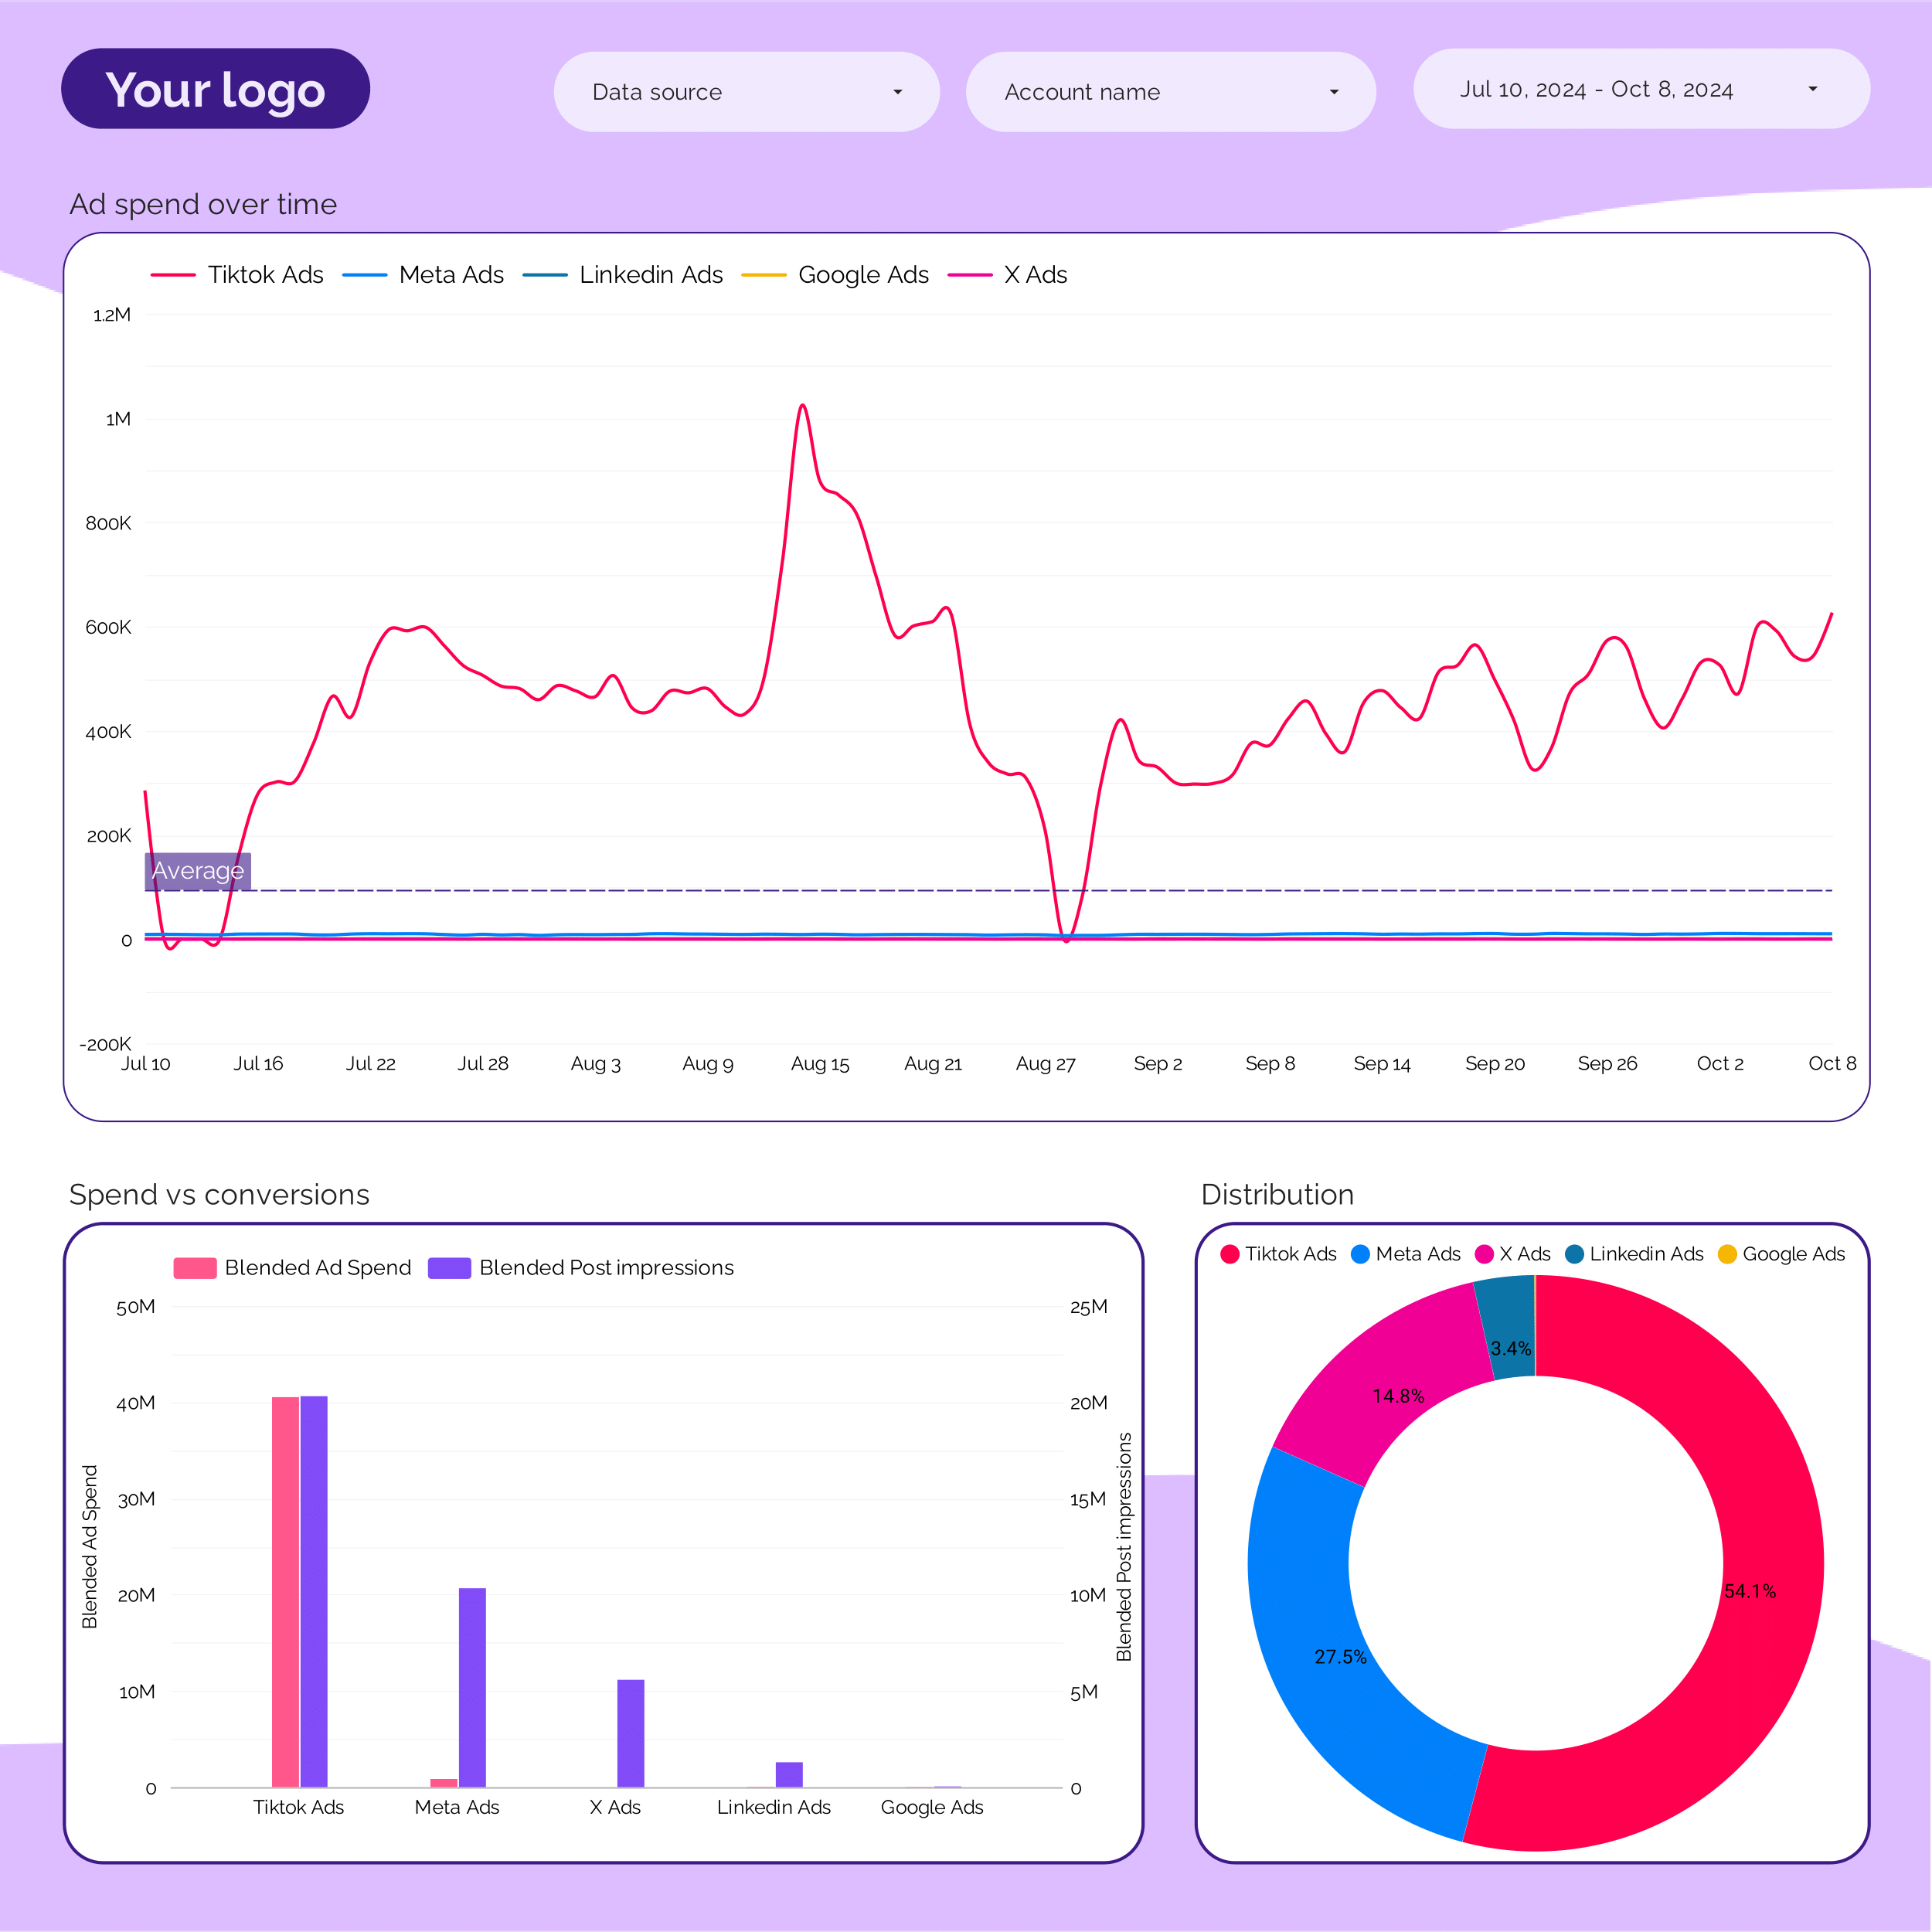
Marketing Ad spend Report template for Data Studio by Porter
Acompanhe spend distribution, budget allocation → efficiency (CPC, CPM by channel) → ROAS by channel, blended CPA. Segmente por channel, campaign, period.
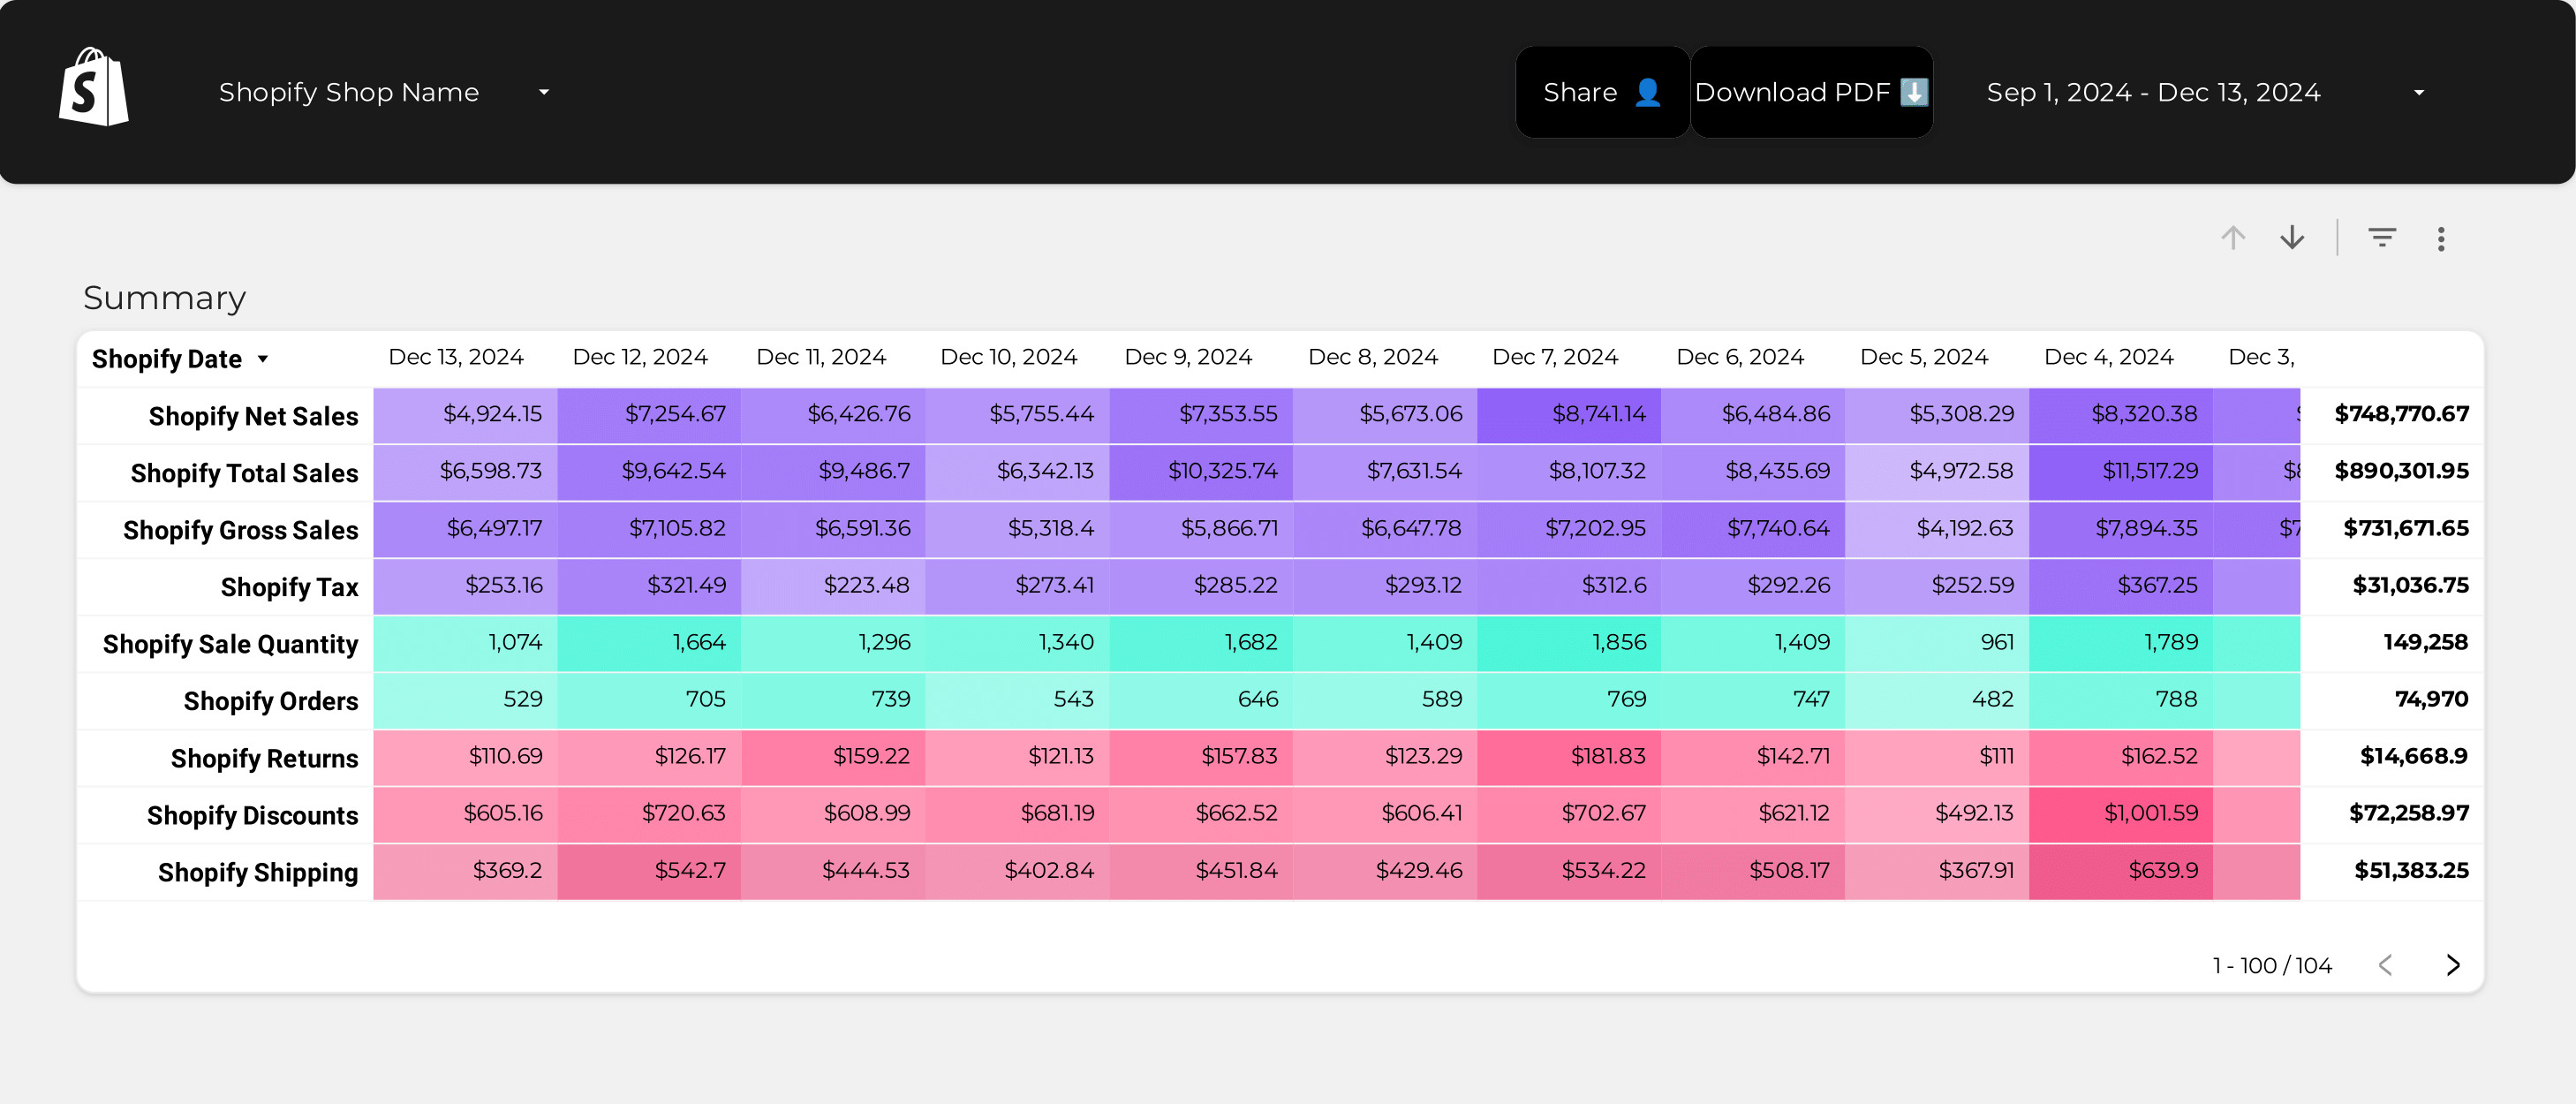
Shopify KPIs Report template for Data Studio by Porter
Acompanhe store traffic, impressions → add-to-cart rate, time on site → revenue, AOV, conversion target. Segmente por product, collection.
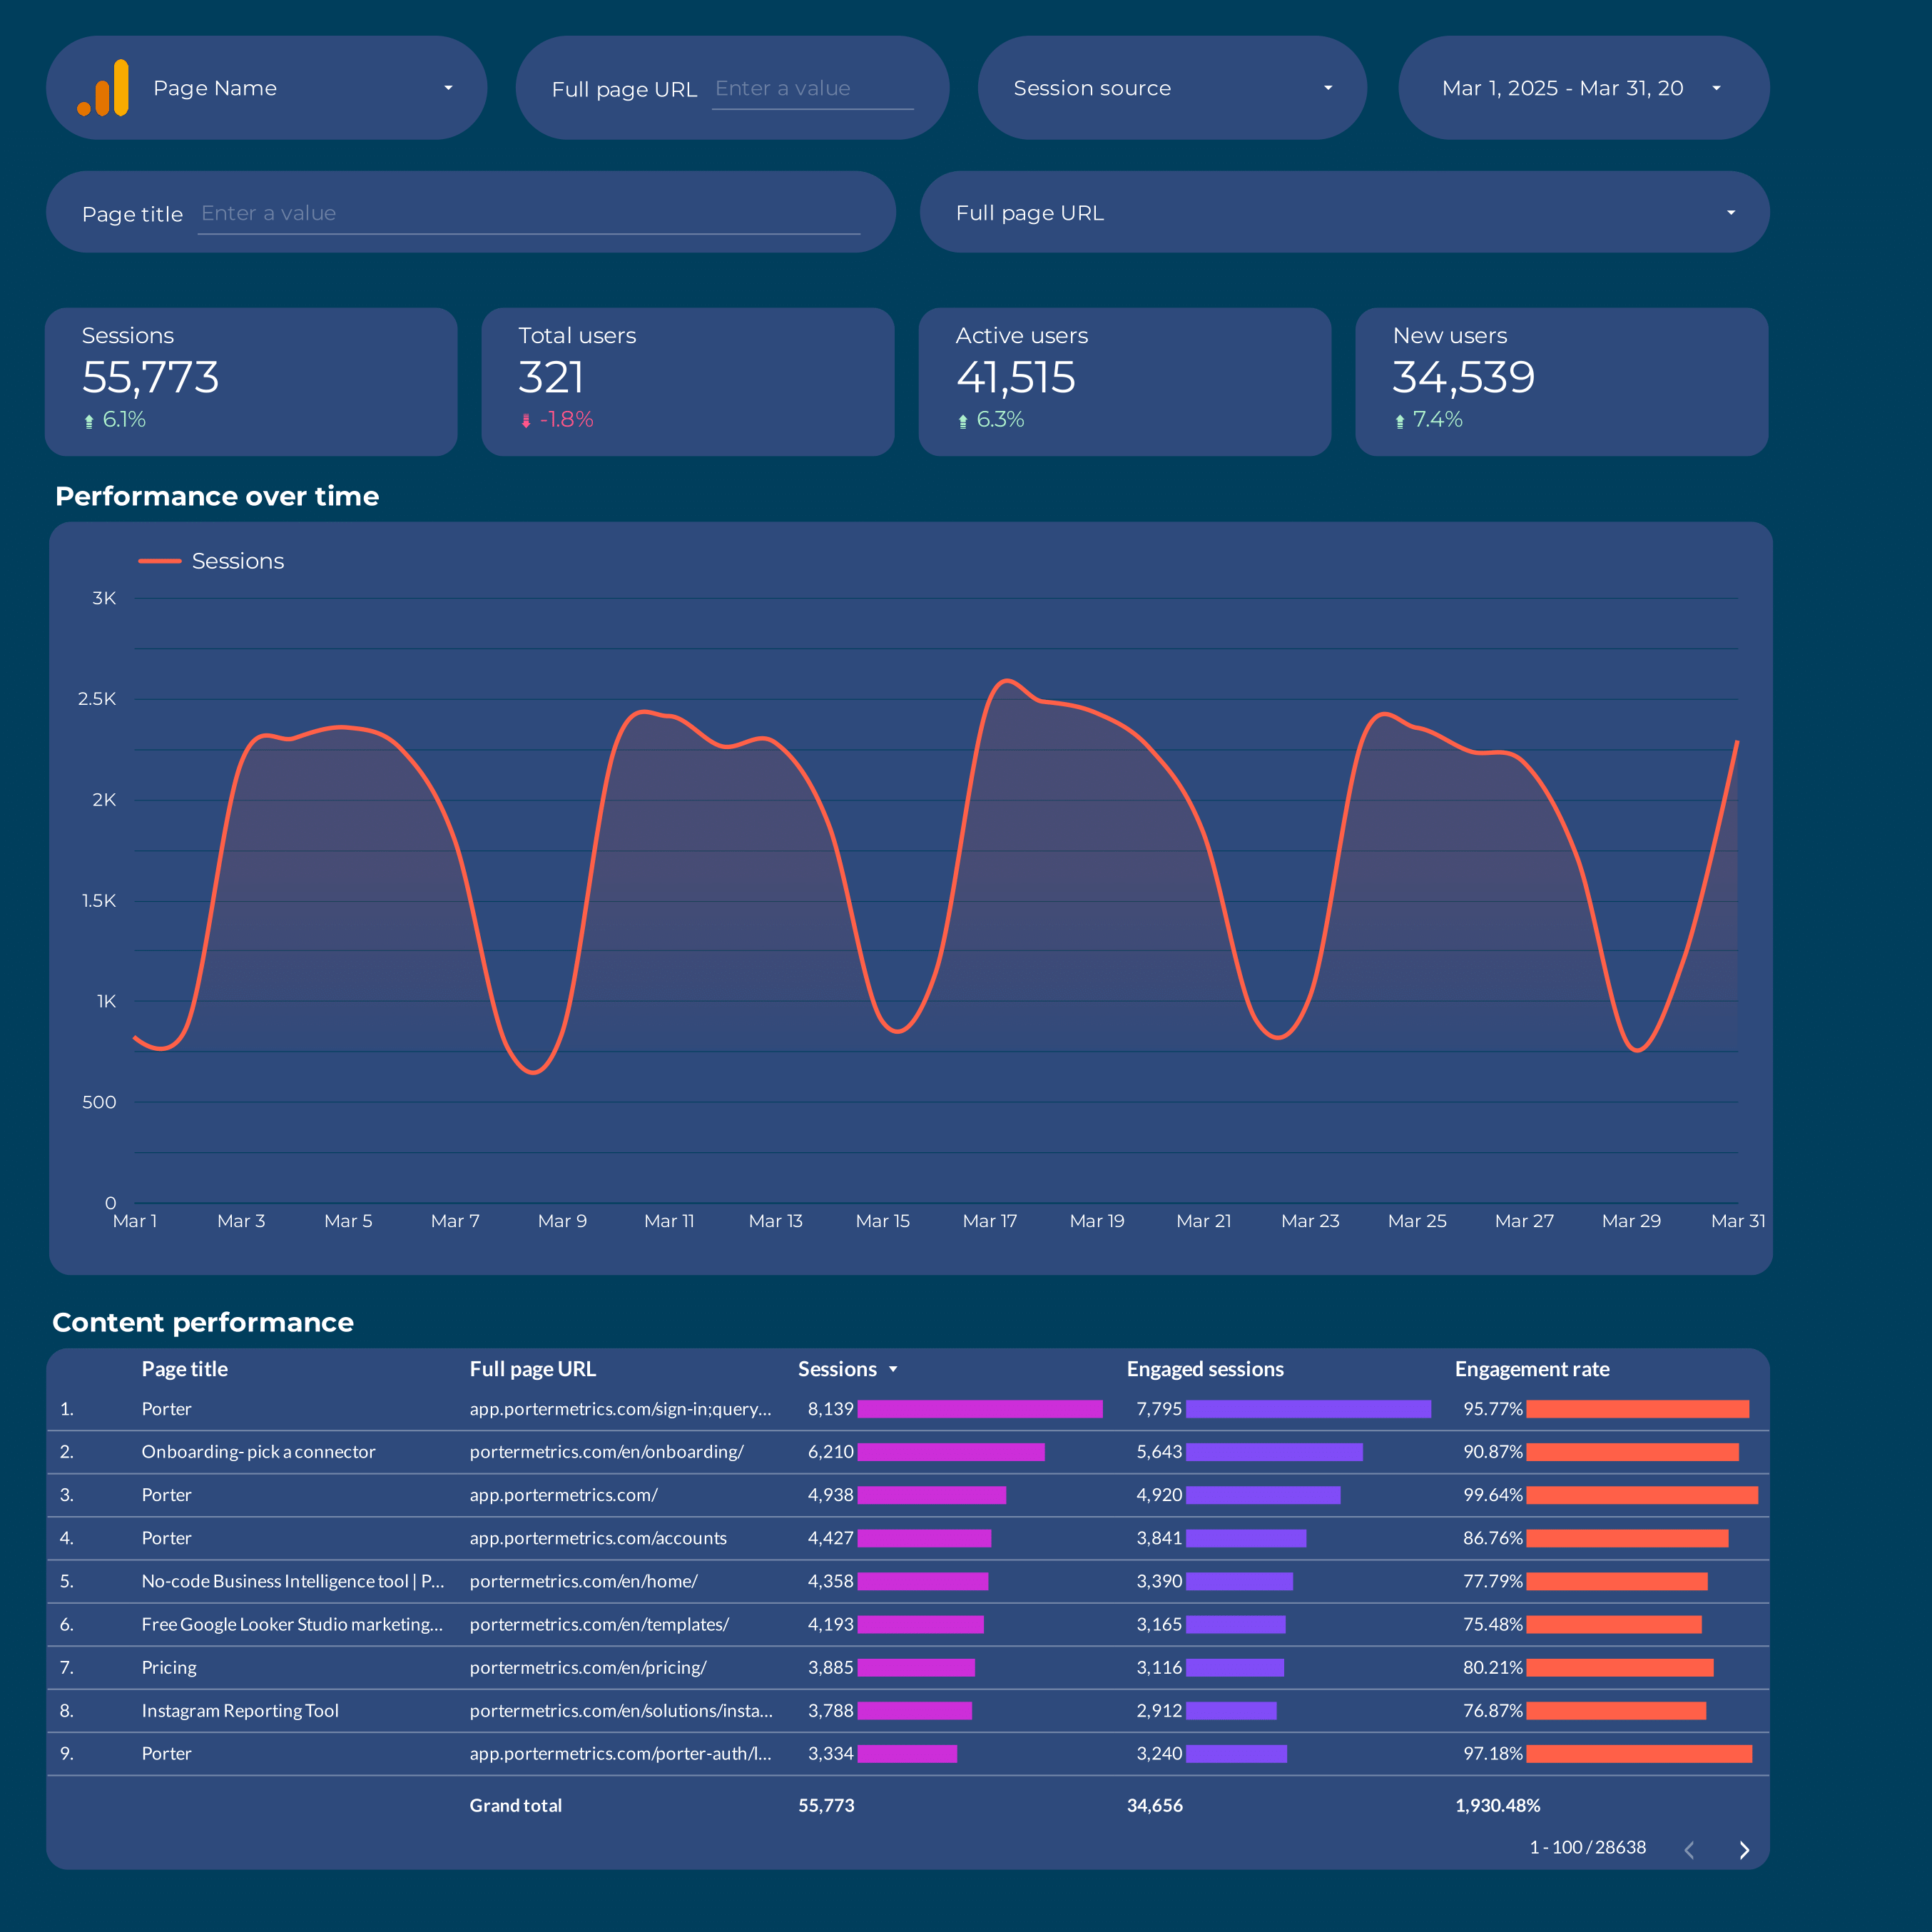
Content marketing Report template for Data Studio by Porter
Acompanhe page views, organic impressions → time on page, scroll depth, shares → content conversions, lead captures. Segmente por content type, topic, channel.
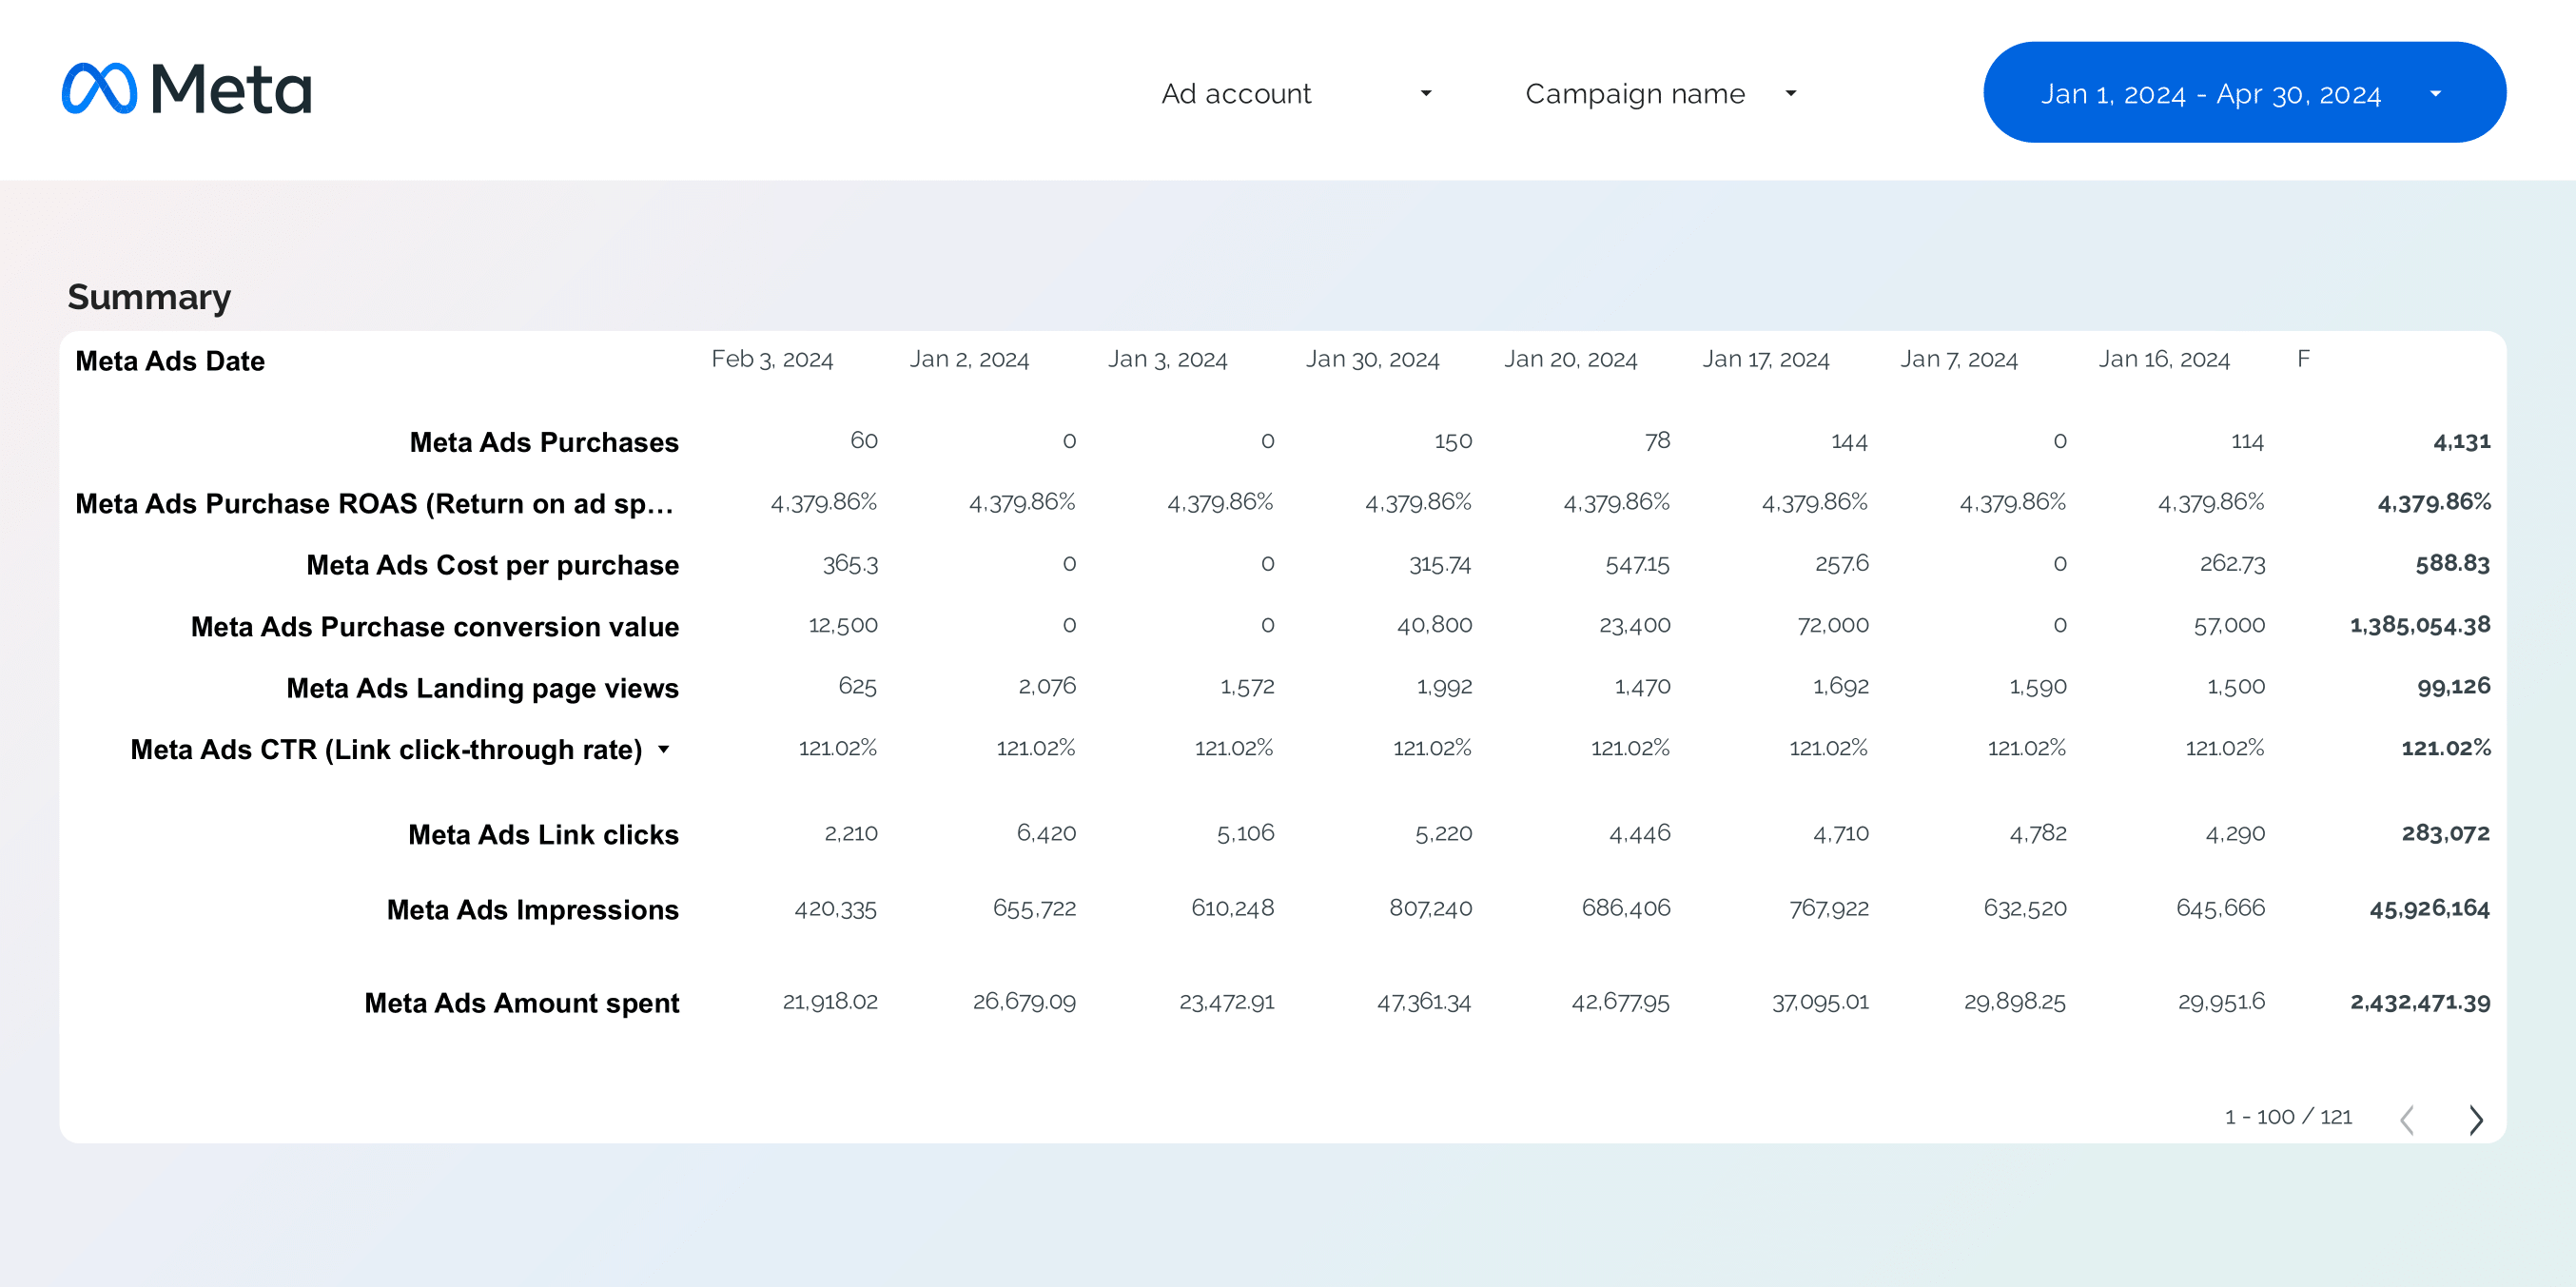
Facebook Ads KPI tracker Report template for Data Studio by Porter
Acompanhe reach trends, impressions → CTR, CPC pacing → KPI attainment, ROAS vs target. Segmente por KPI, campaign, period.
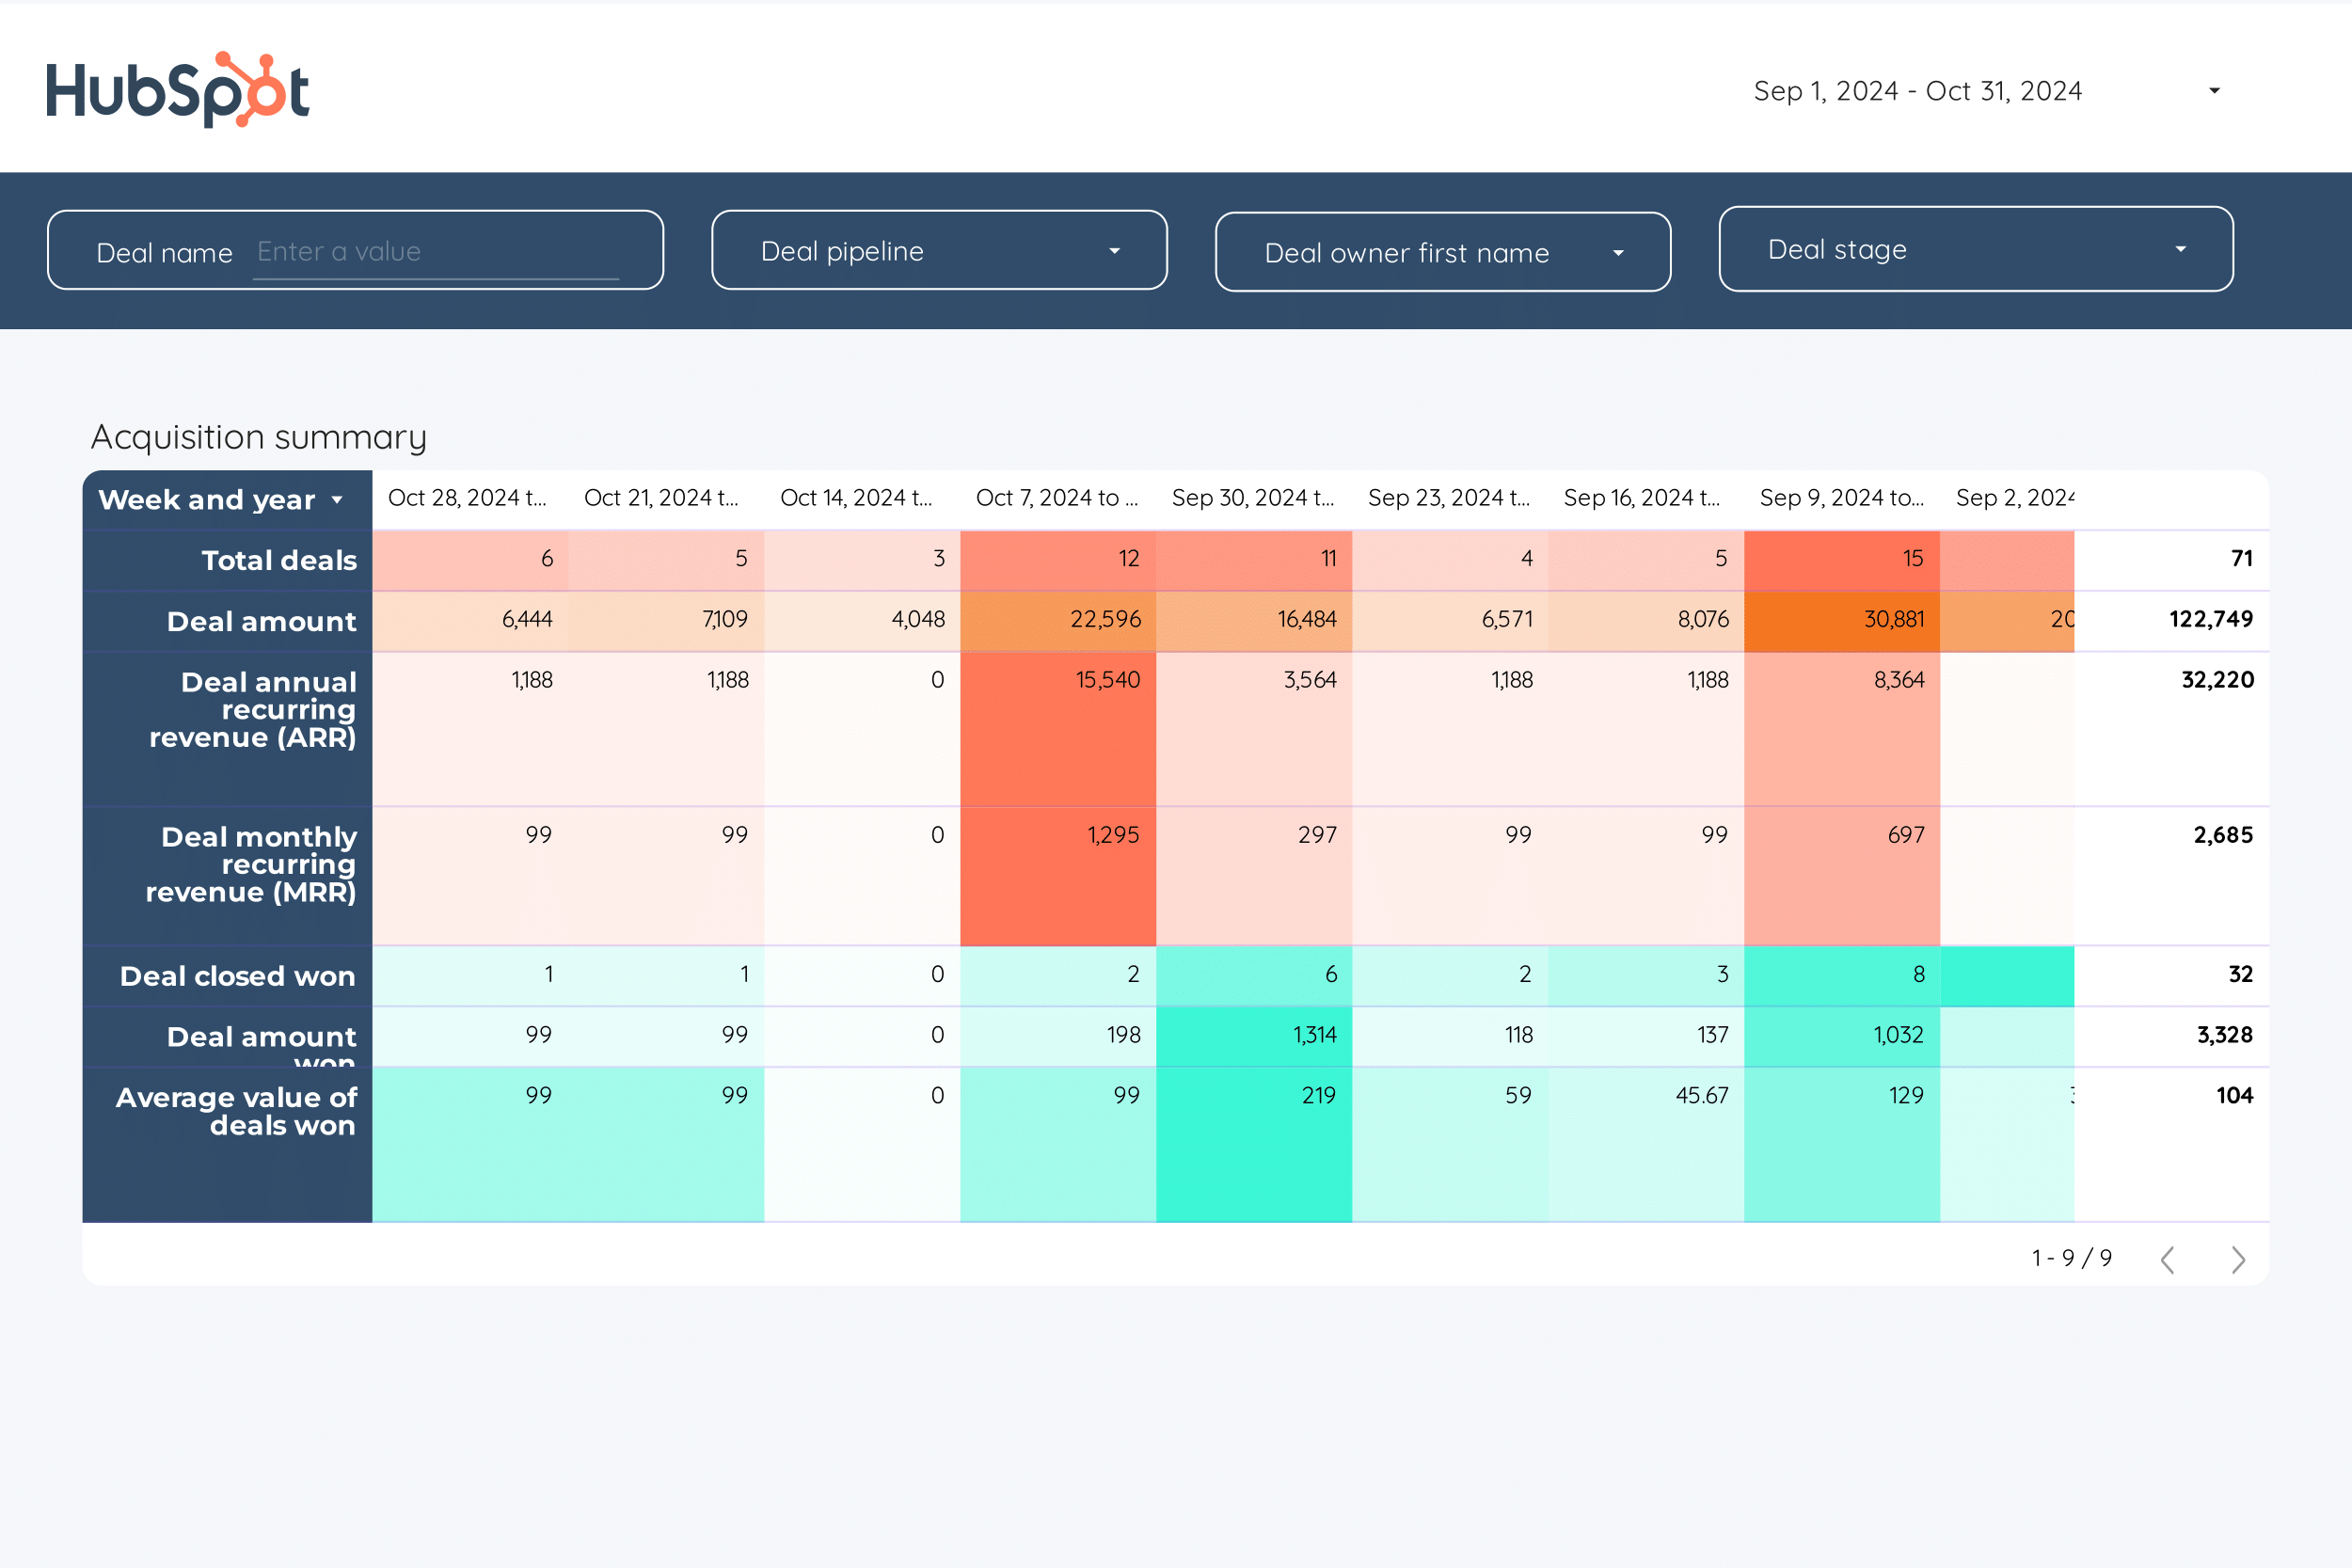
B2B KPI tracker Report template for Data Studio by Porter
Acompanhe account reach, ad impressions → content engagement, demo requests → pipeline value, deal velocity. Segmente por account tier, channel.
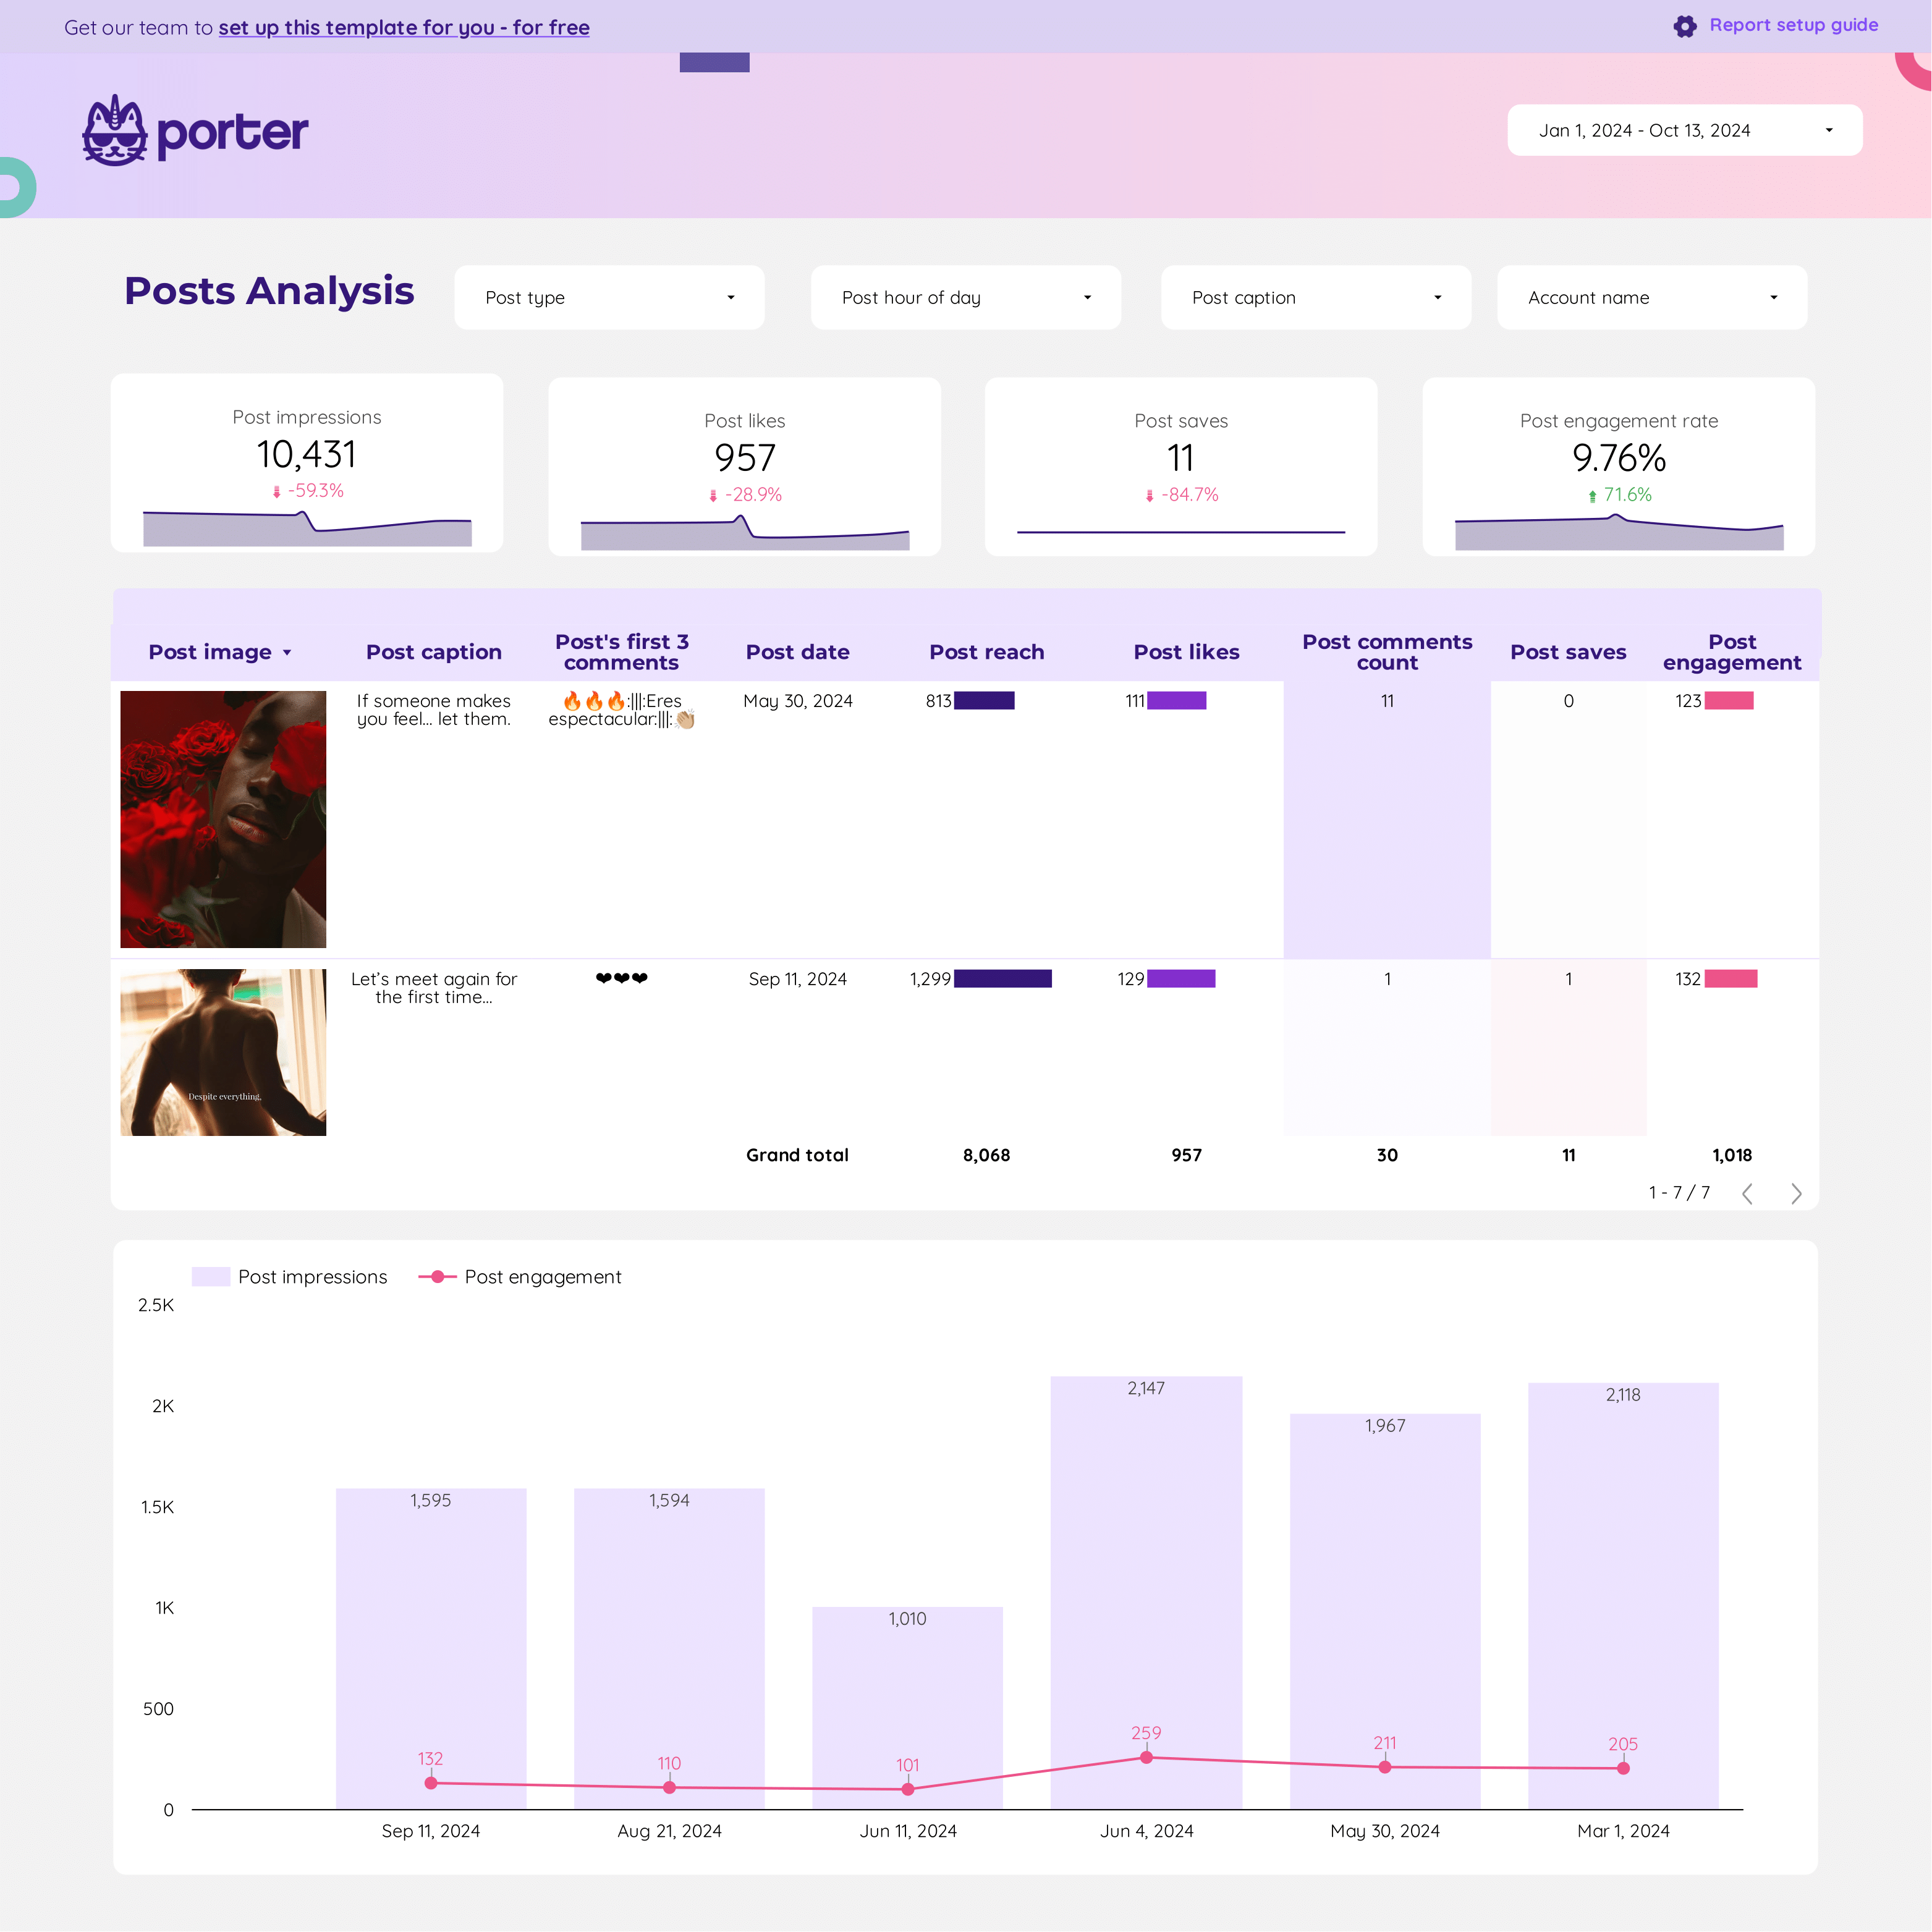
Instagram Insights KPIs Report template for Data Studio by Porter
Acompanhe follower growth, reach trends → engagement rate vs target → profile actions, website clicks. Segmente por KPI, period, post type.
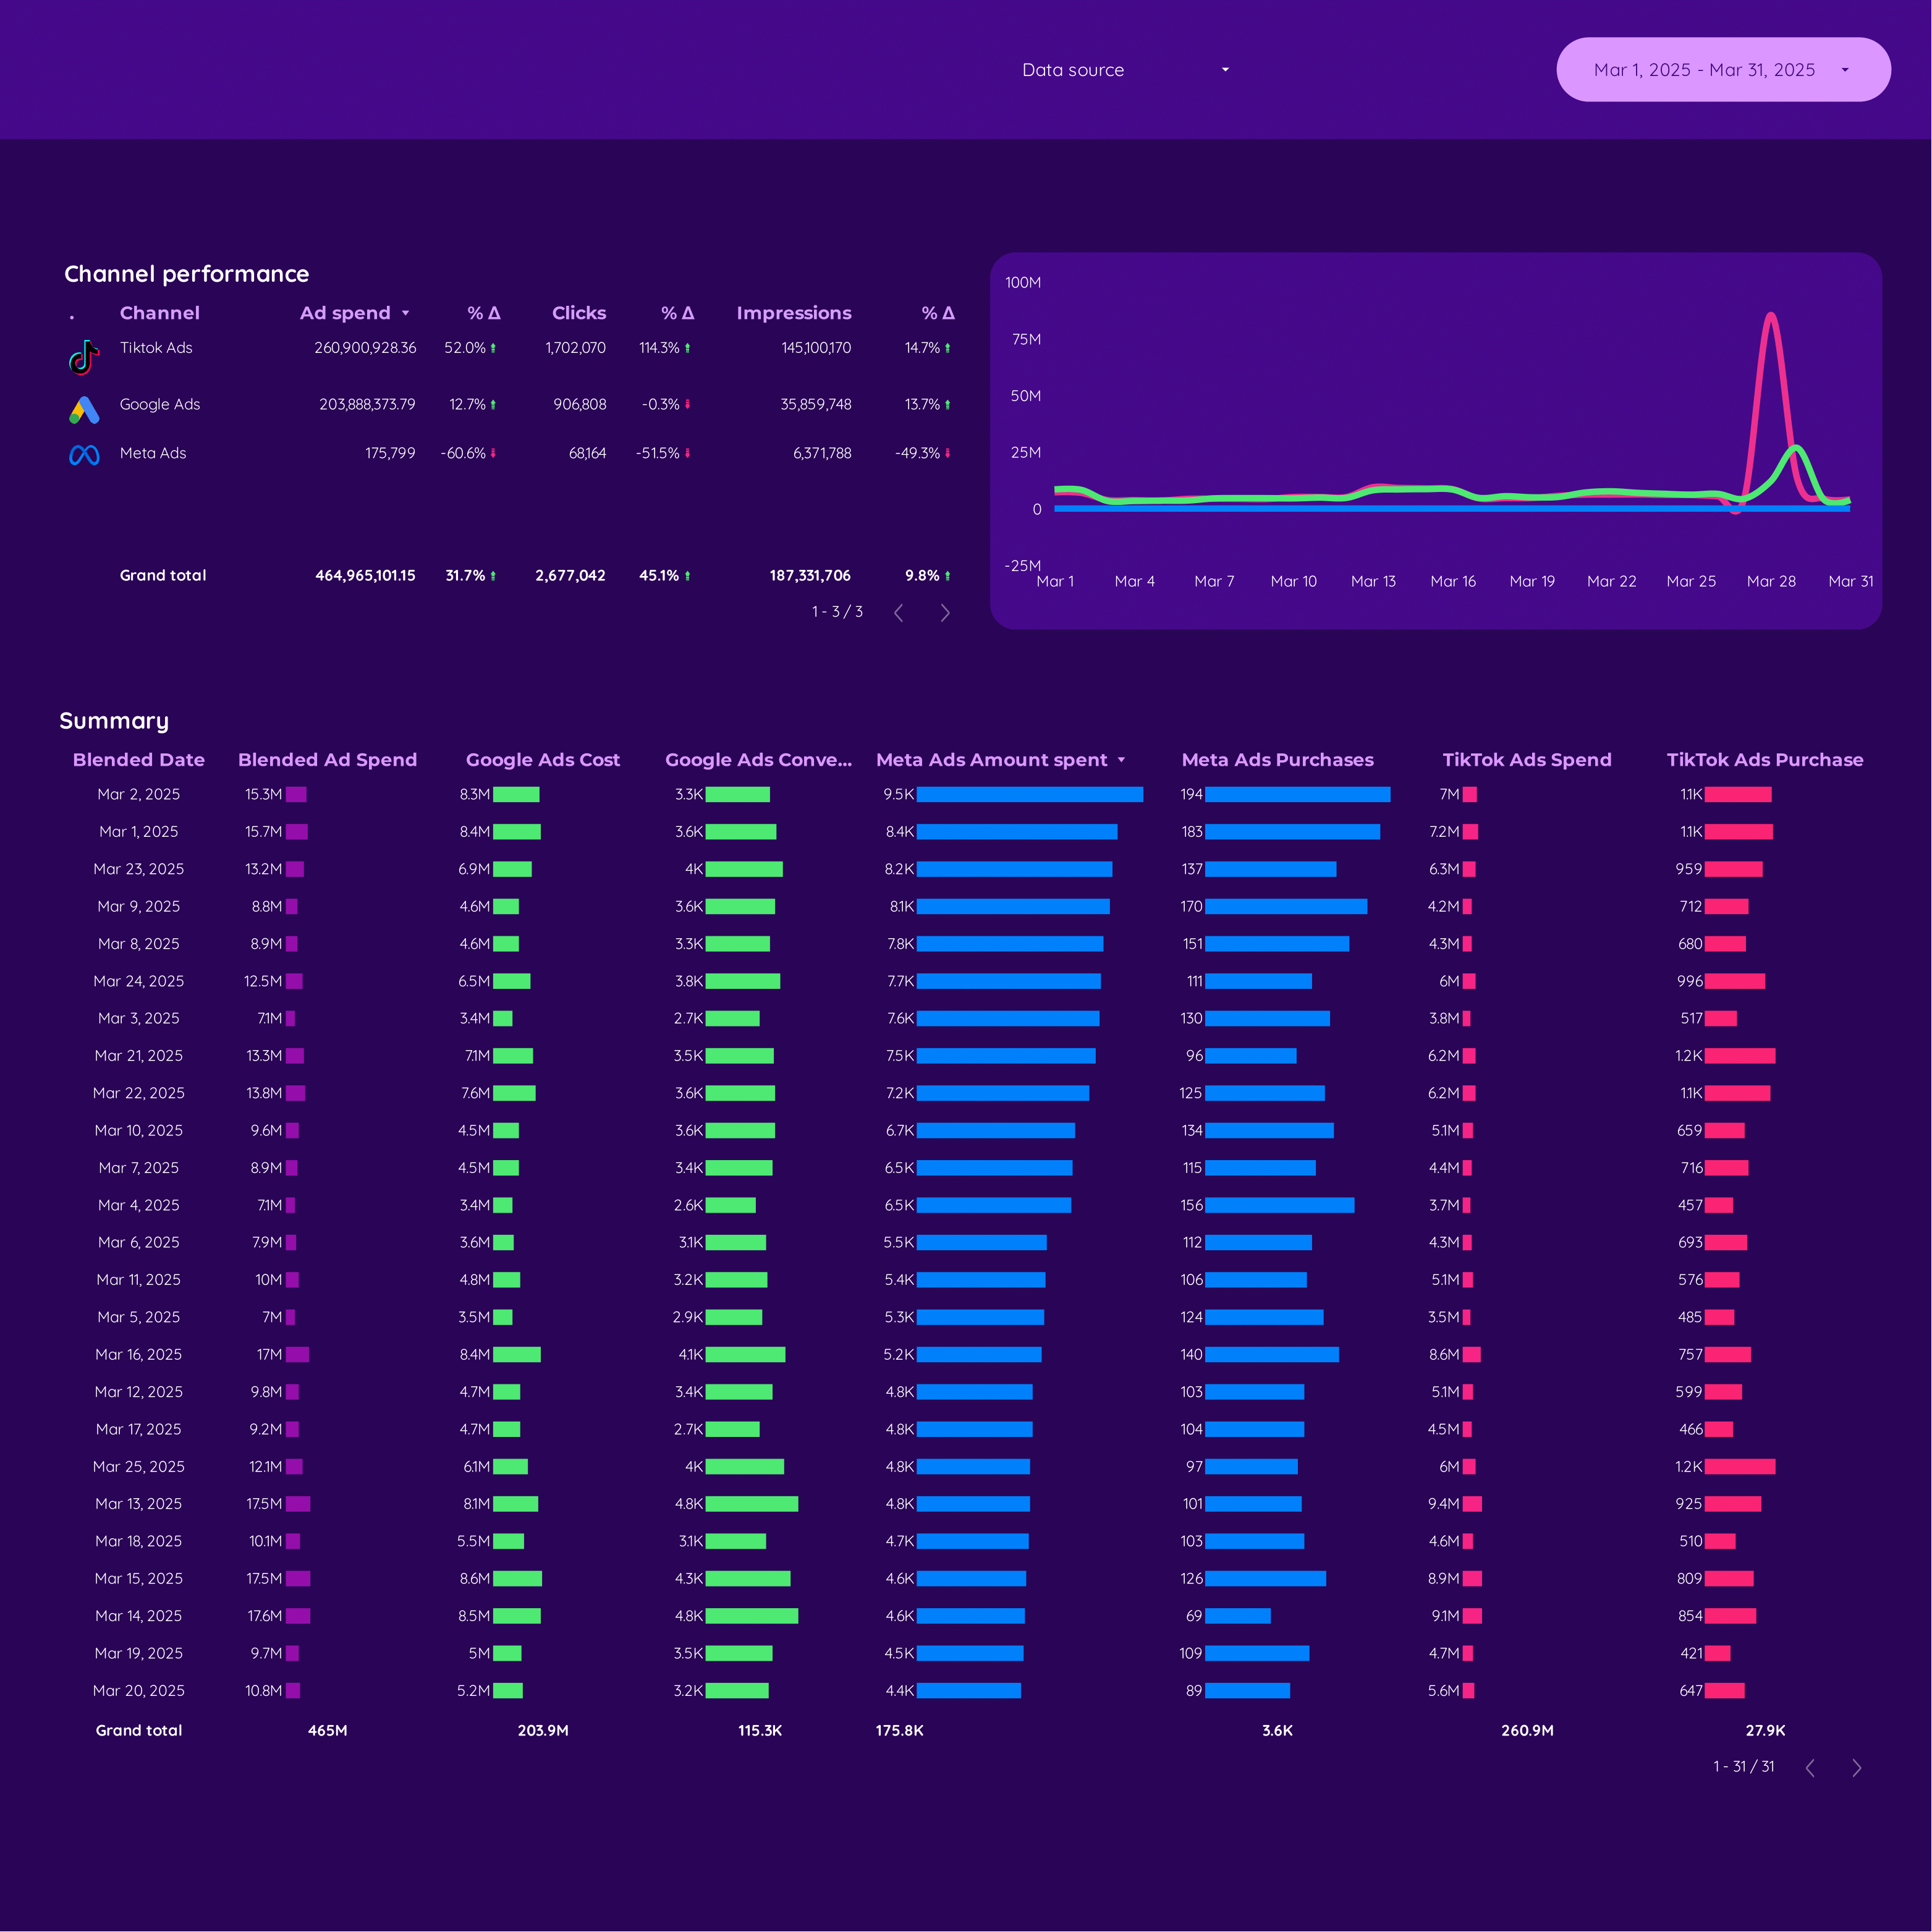
Cross-channel Report template for Data Studio by Porter
Acompanhe unified impressions, reach → cross-platform CTR comparison → attributed conversions, blended ROAS. Segmente por platform, campaign, audience.
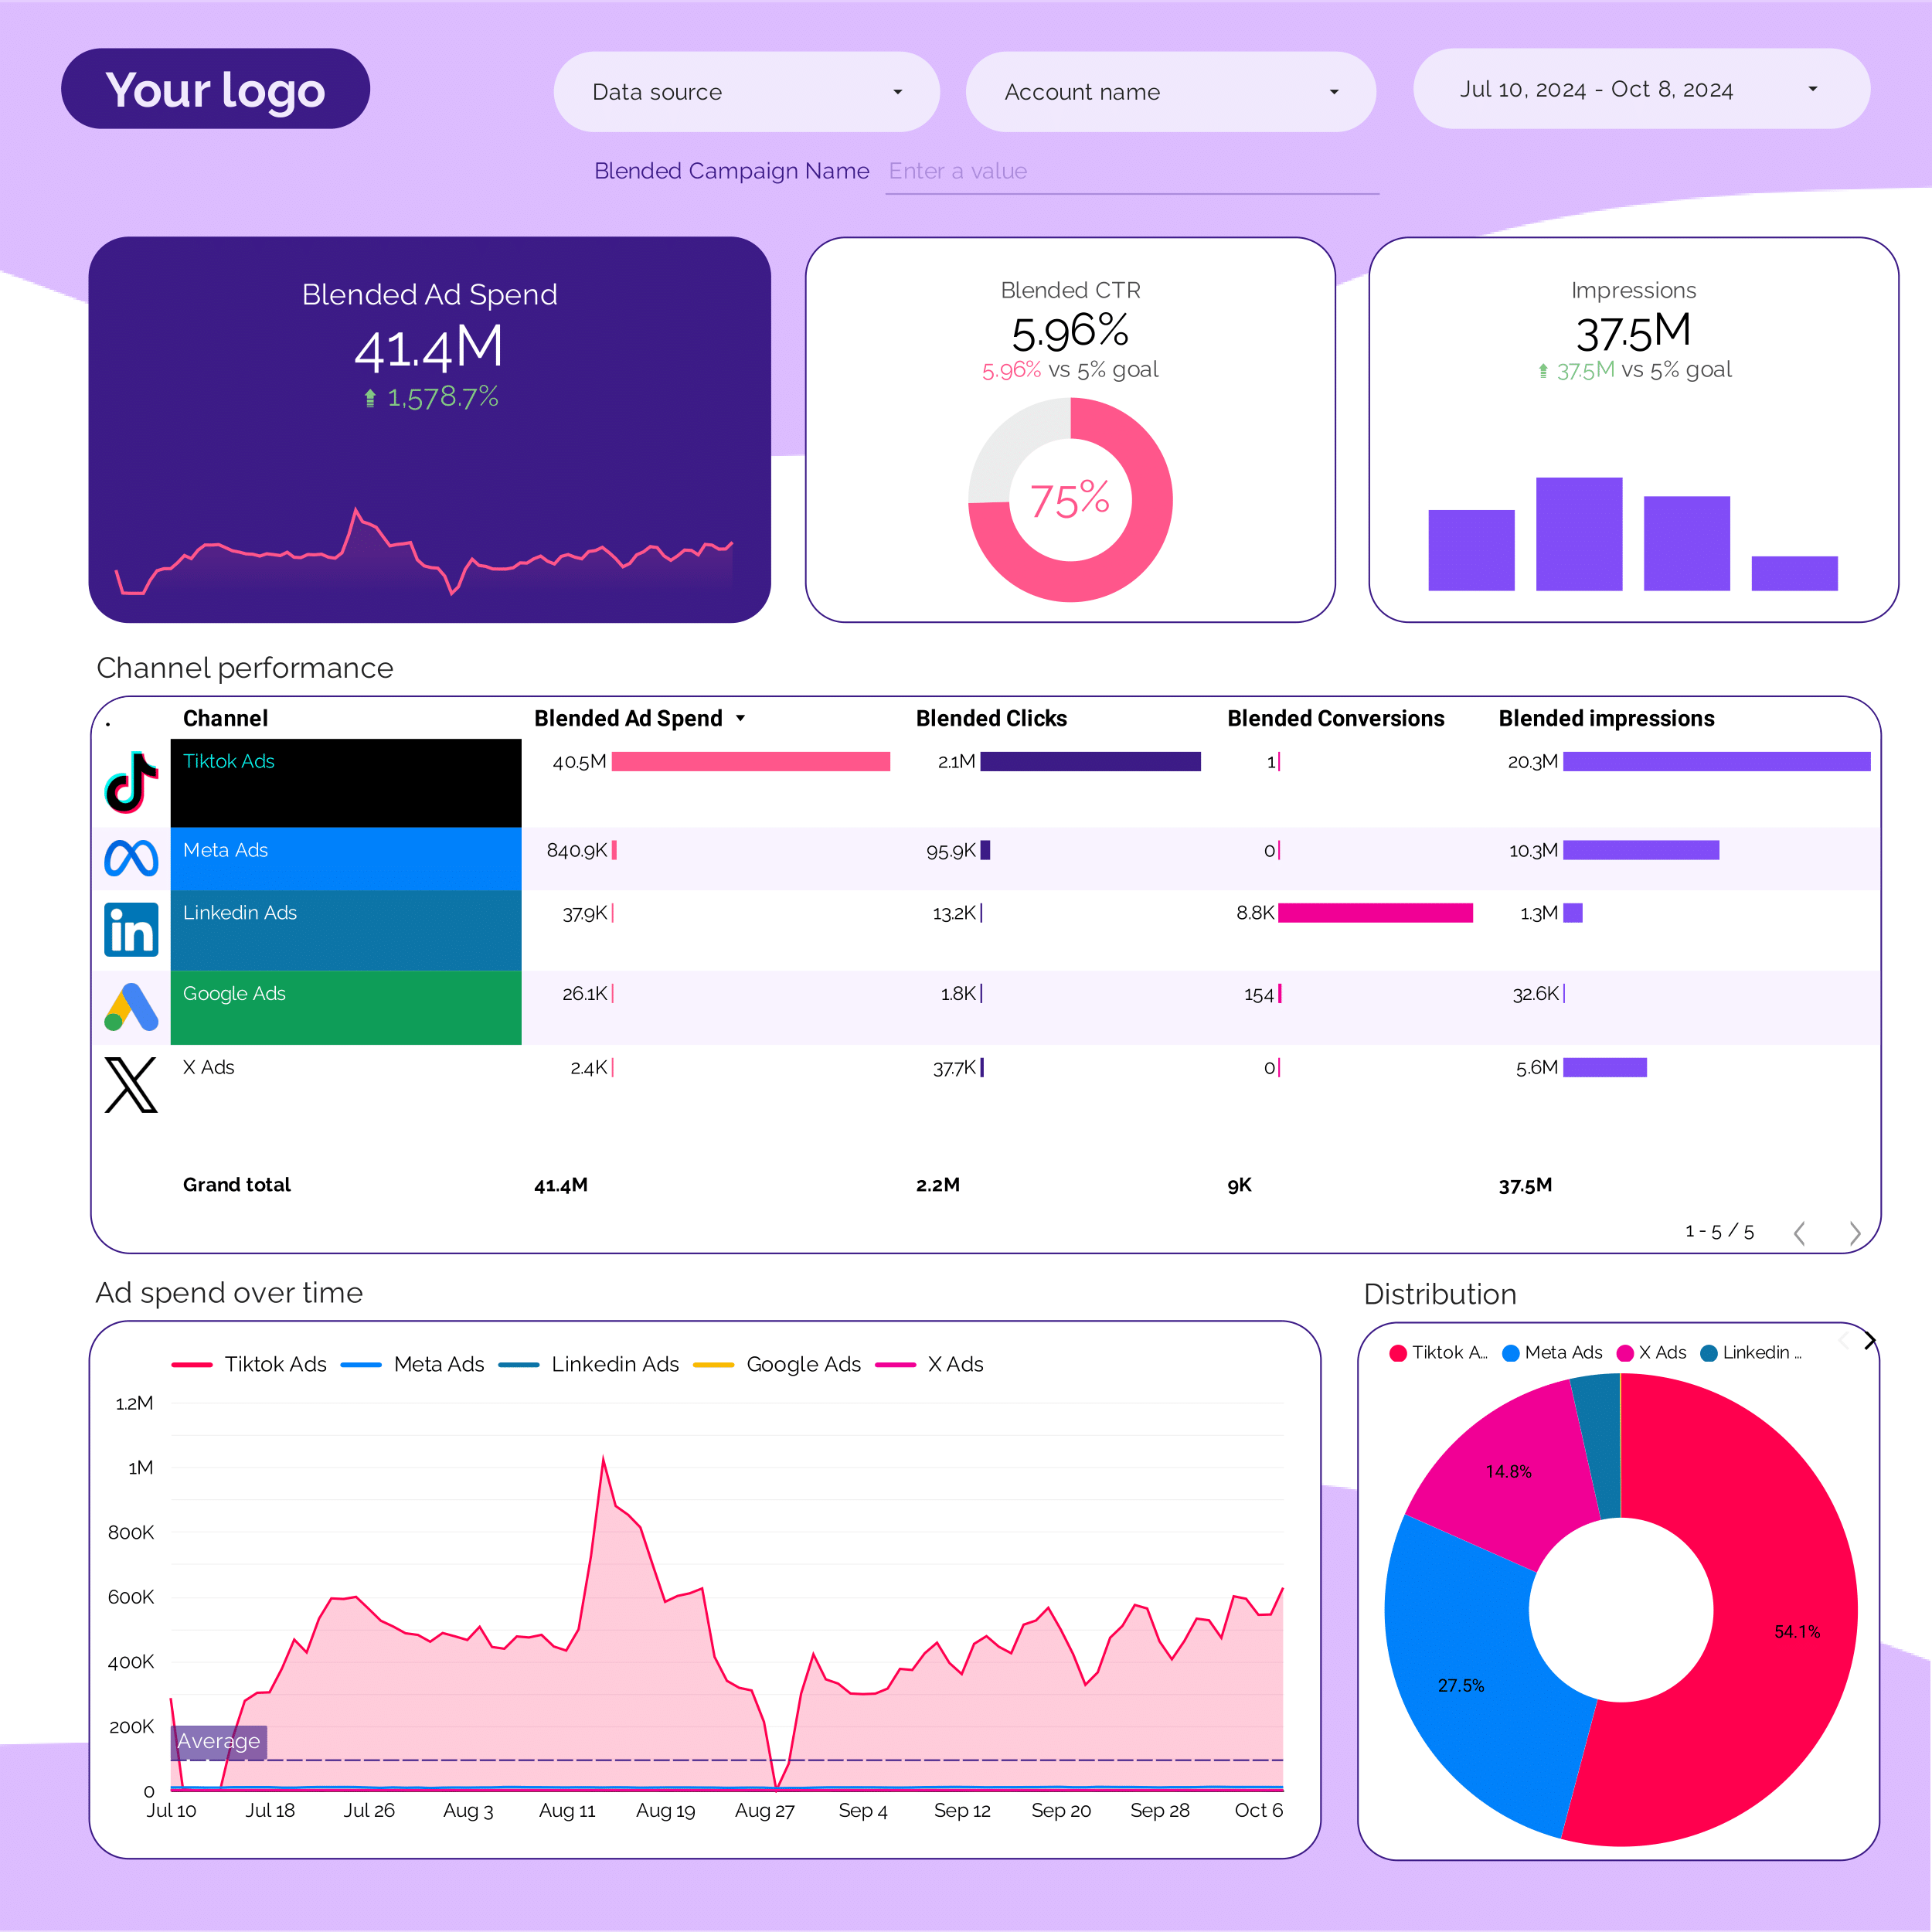
PPC multi-channel Report template for Data Studio by Porter
Acompanhe cross-platform impressions → CTR comparison by platform → blended ROAS, CPA by platform. Segmente por platform, campaign type.
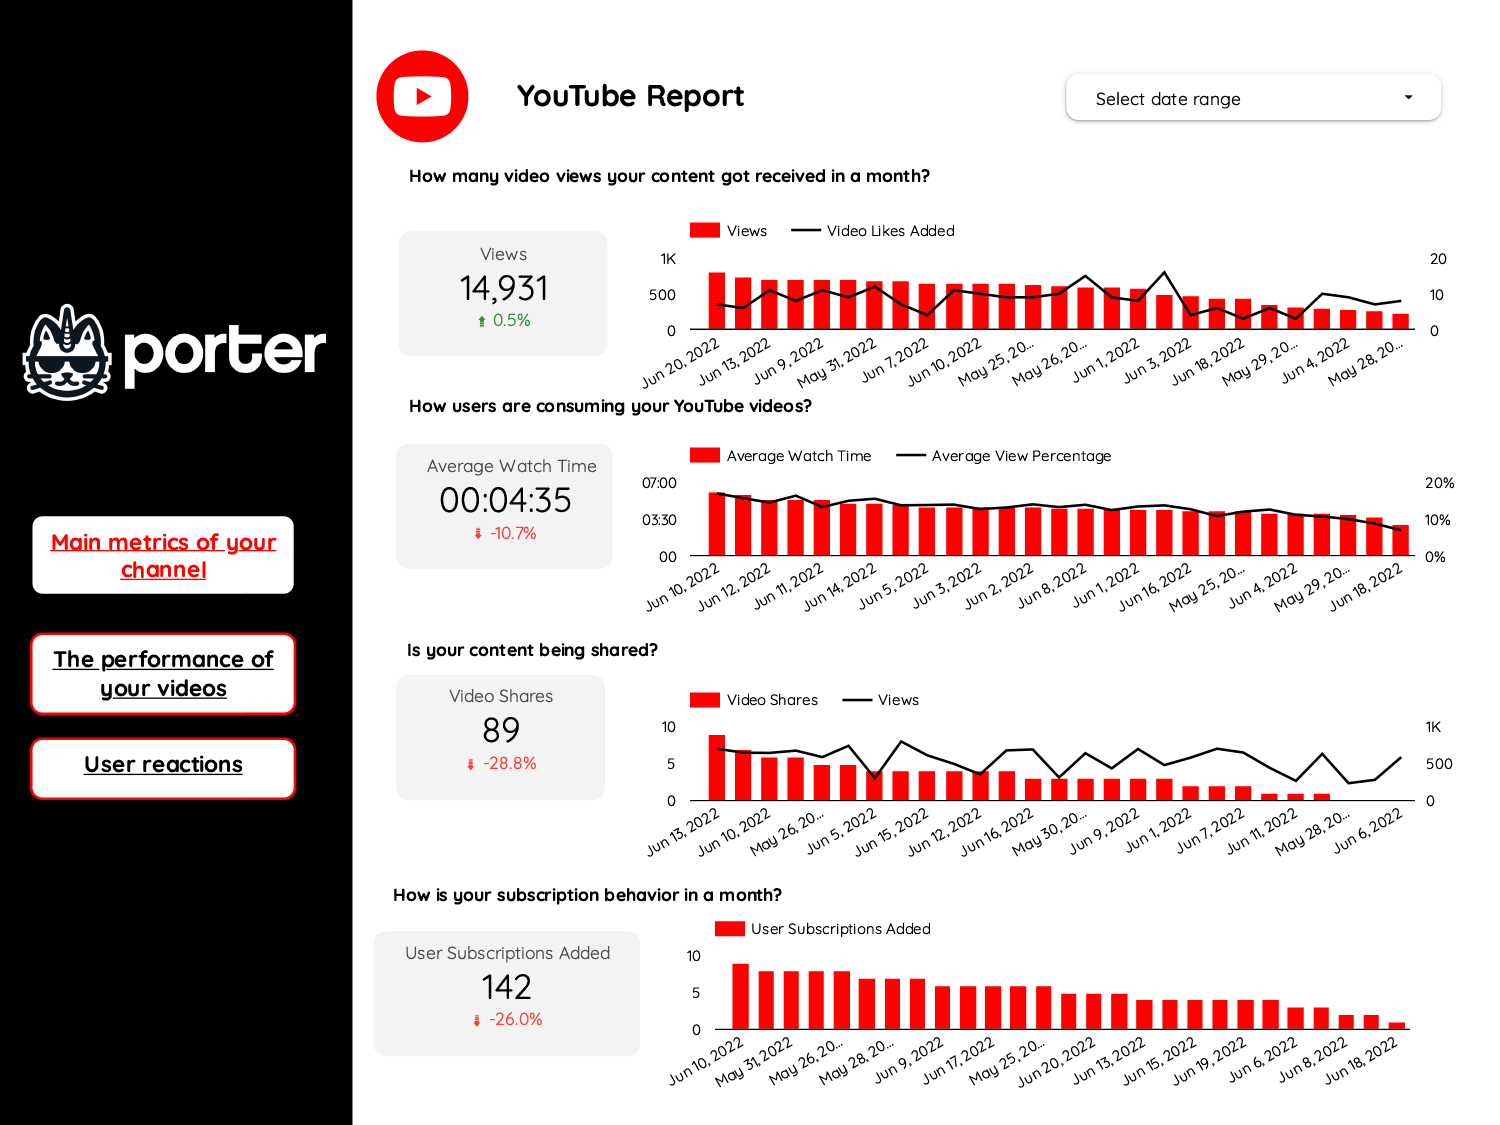
Video marketing Report template for Data Studio by Porter
Acompanhe video views, reach → watch time, completion rate → CTA clicks, subscriber growth. Segmente por platform, video type.
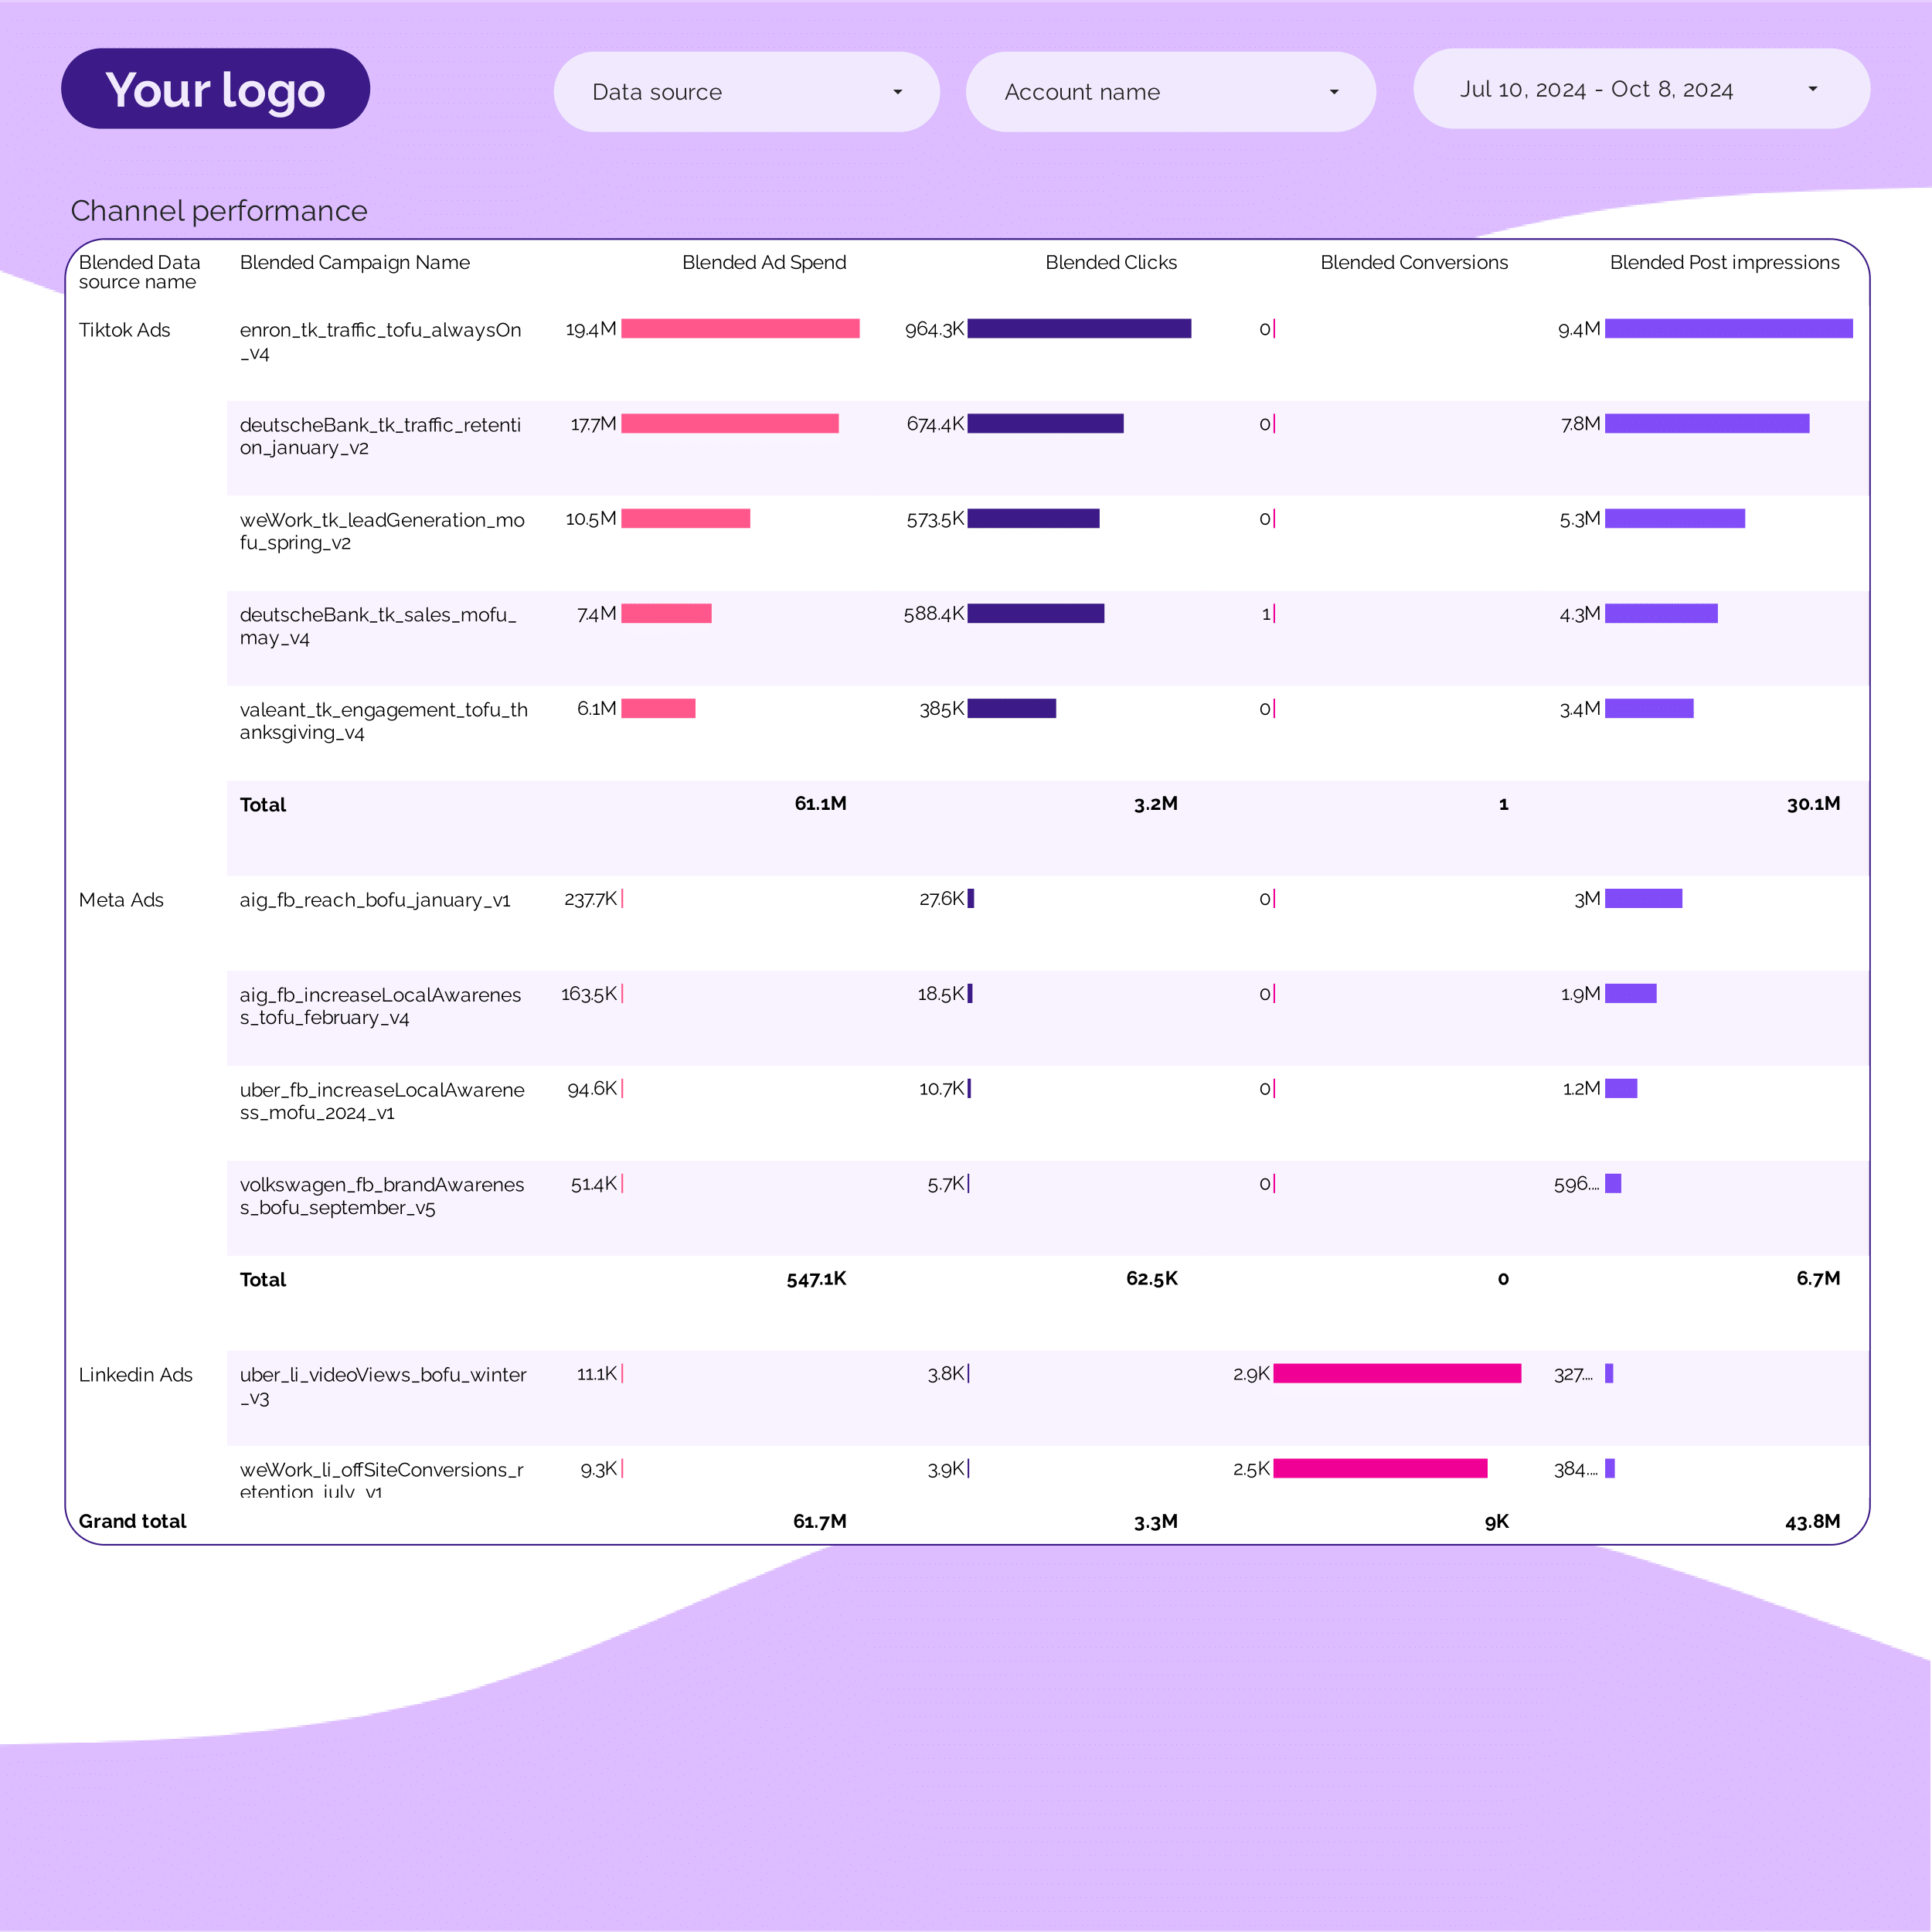
PPC Campaign performance Report template for Data Studio by Porter
Acompanhe campaign impressions, SOV → CTR, CPC per campaign → ROAS, conversions per campaign. Segmente por campaign, ad group, date.
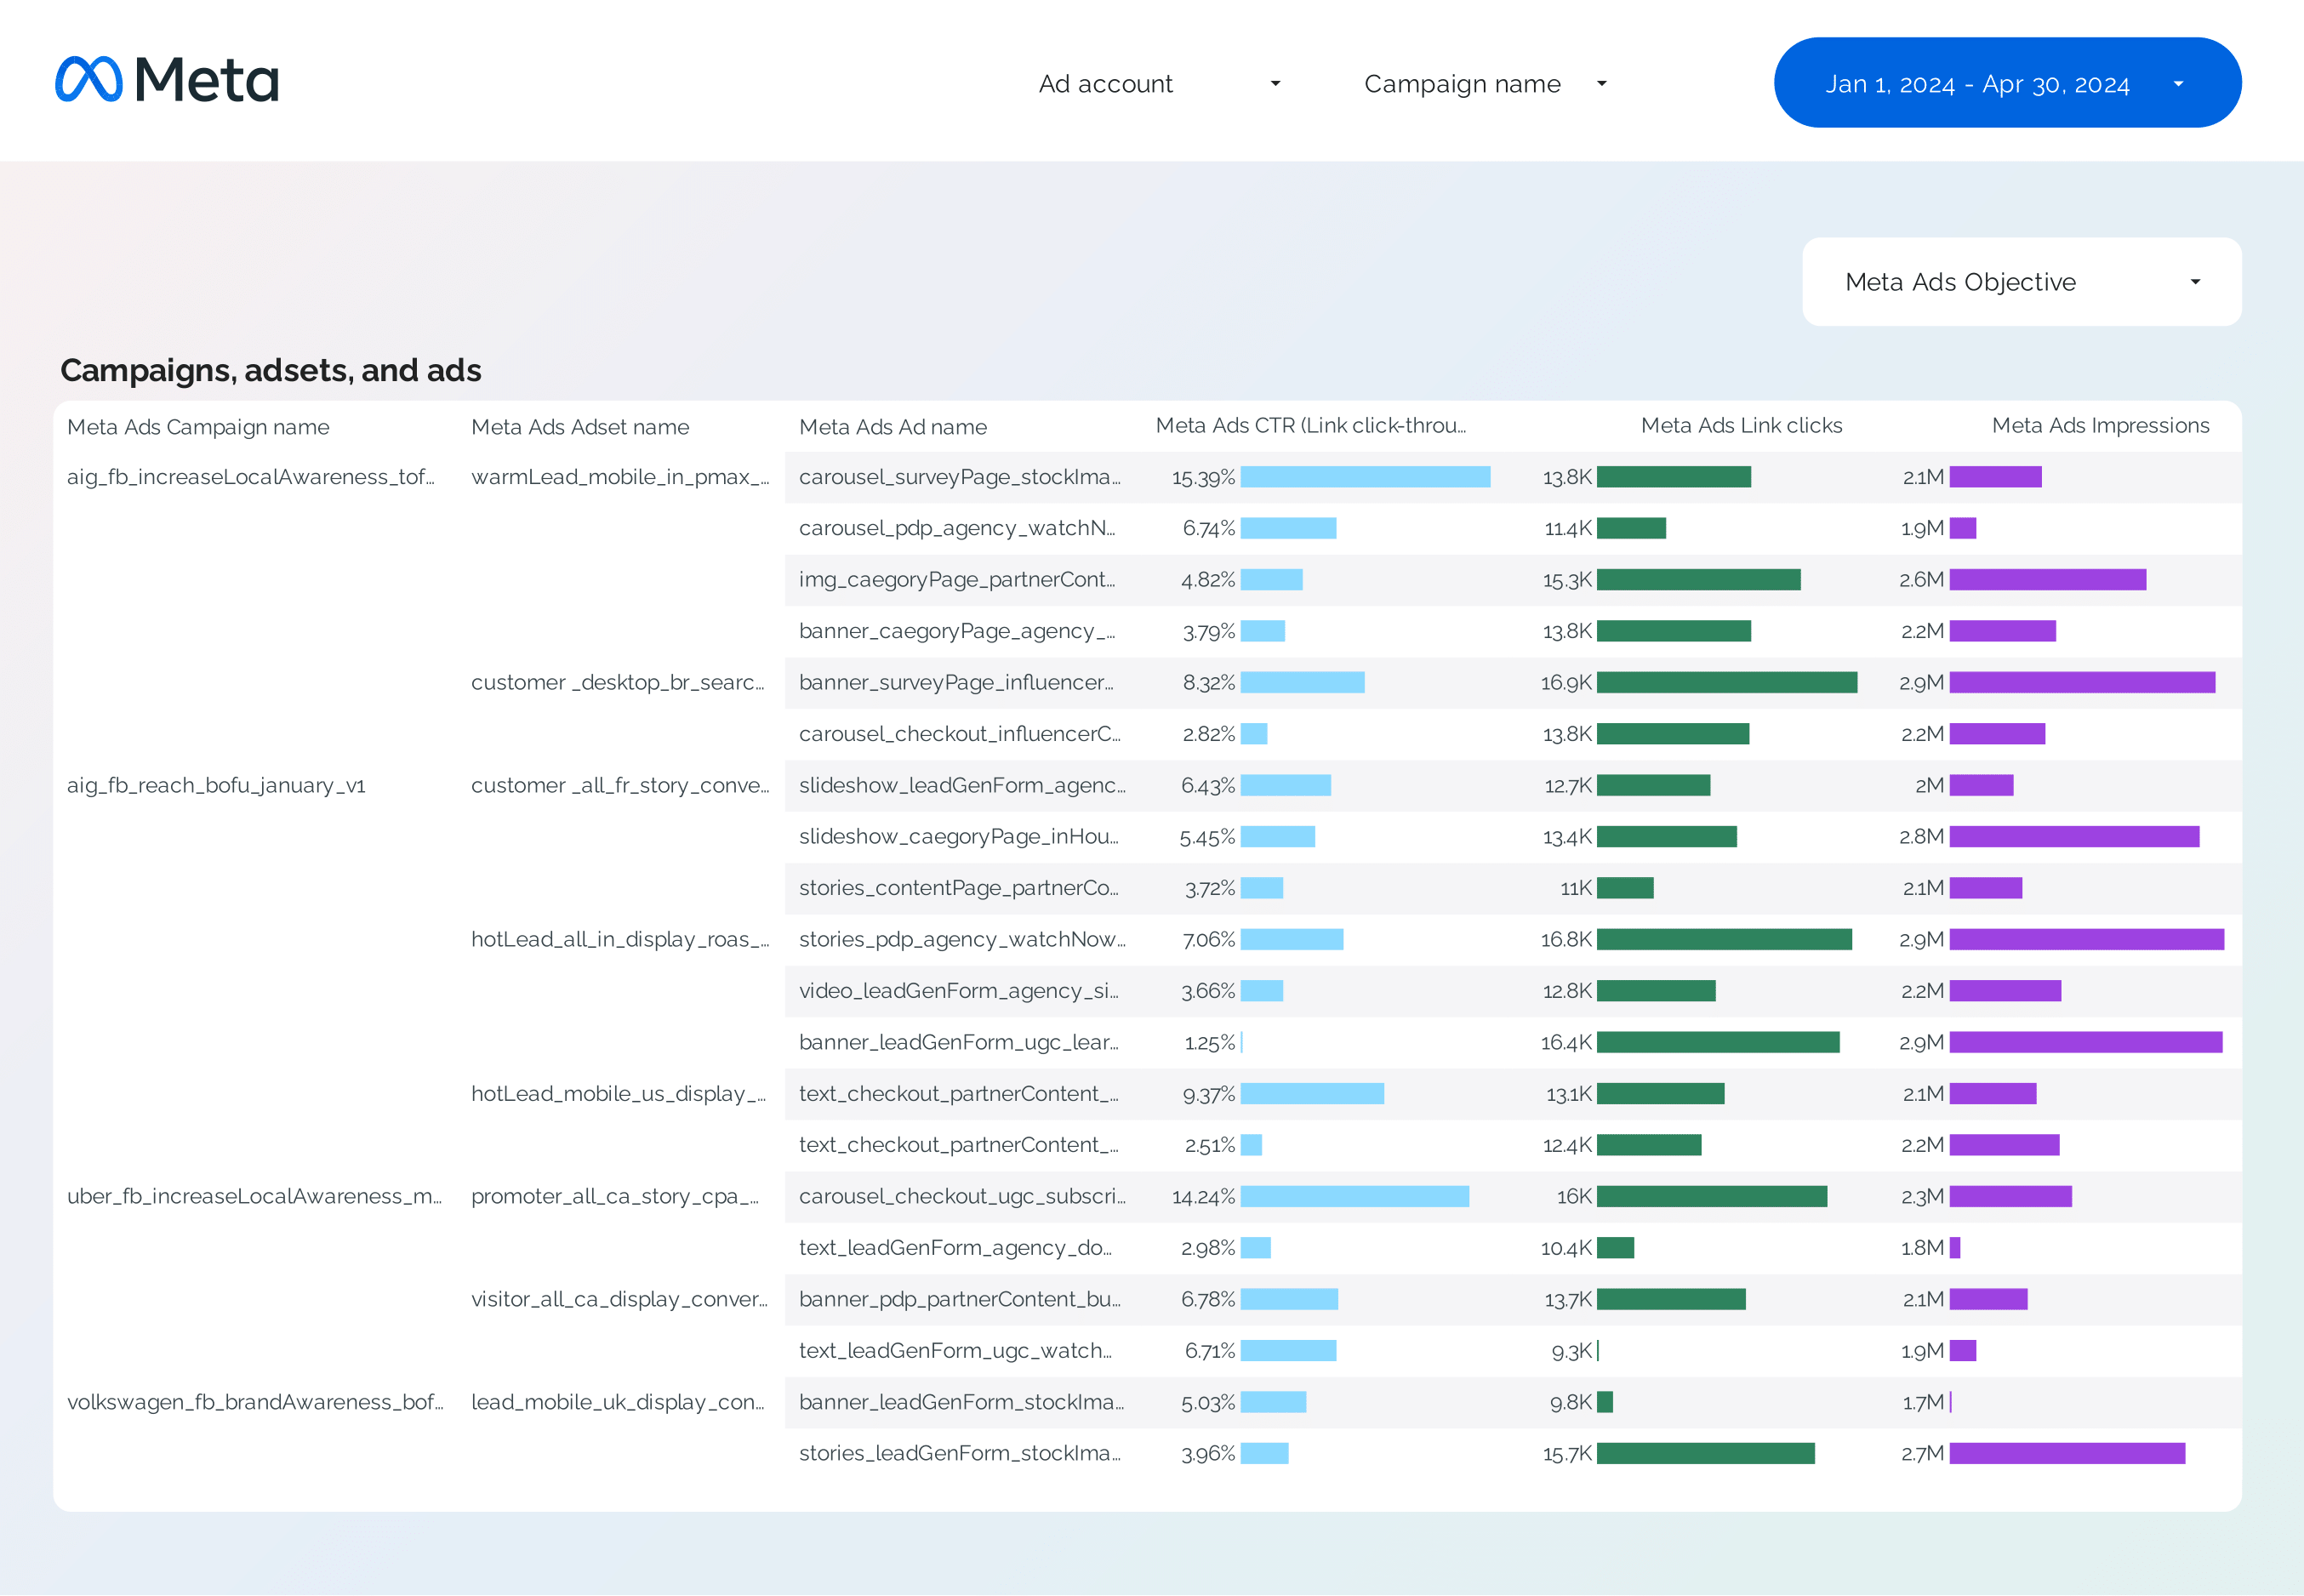
Facebook Ads Campaign performance Report template for Data Studio by Porter
Acompanhe campaign reach, impressions → CTR, CPC by campaign → ROAS, CPA per campaign. Segmente por campaign, objective, audience.
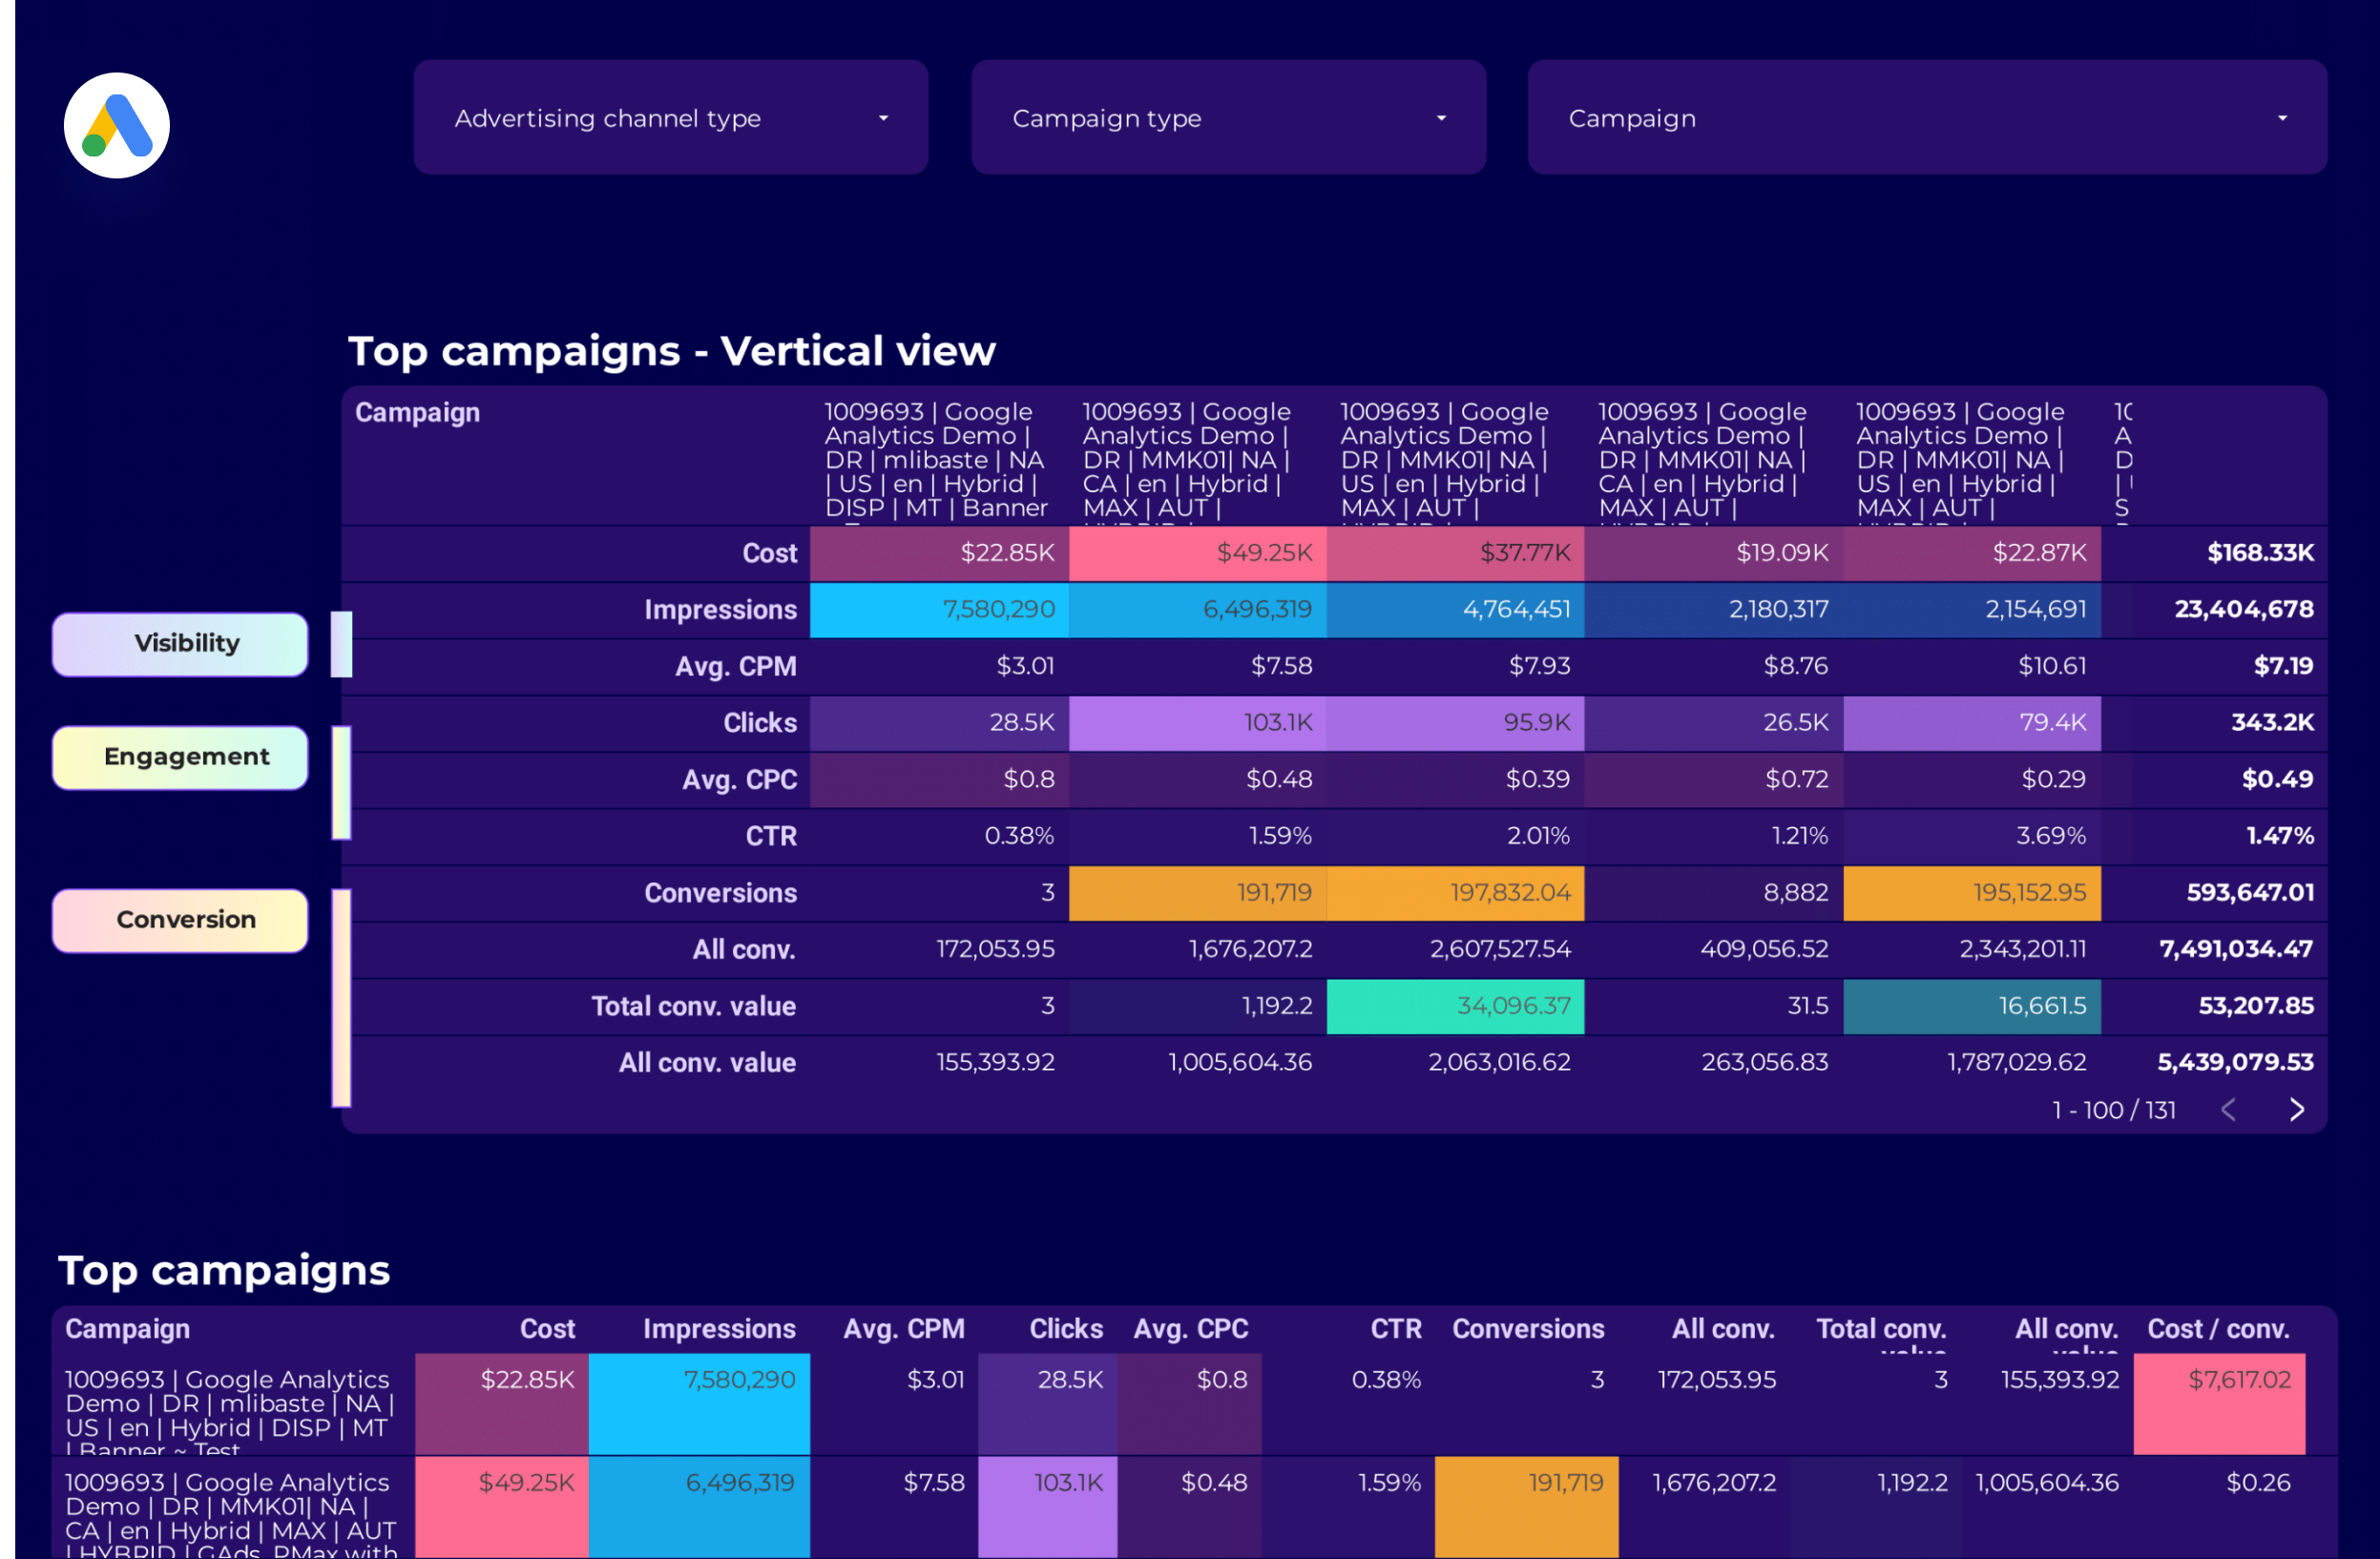
Google Ads Campaign performance Report template for Data Studio by Porter
Acompanhe campaign impressions, reach → CTR, CPC by campaign → ROAS, conversions per campaign. Segmente por campaign, network, device.
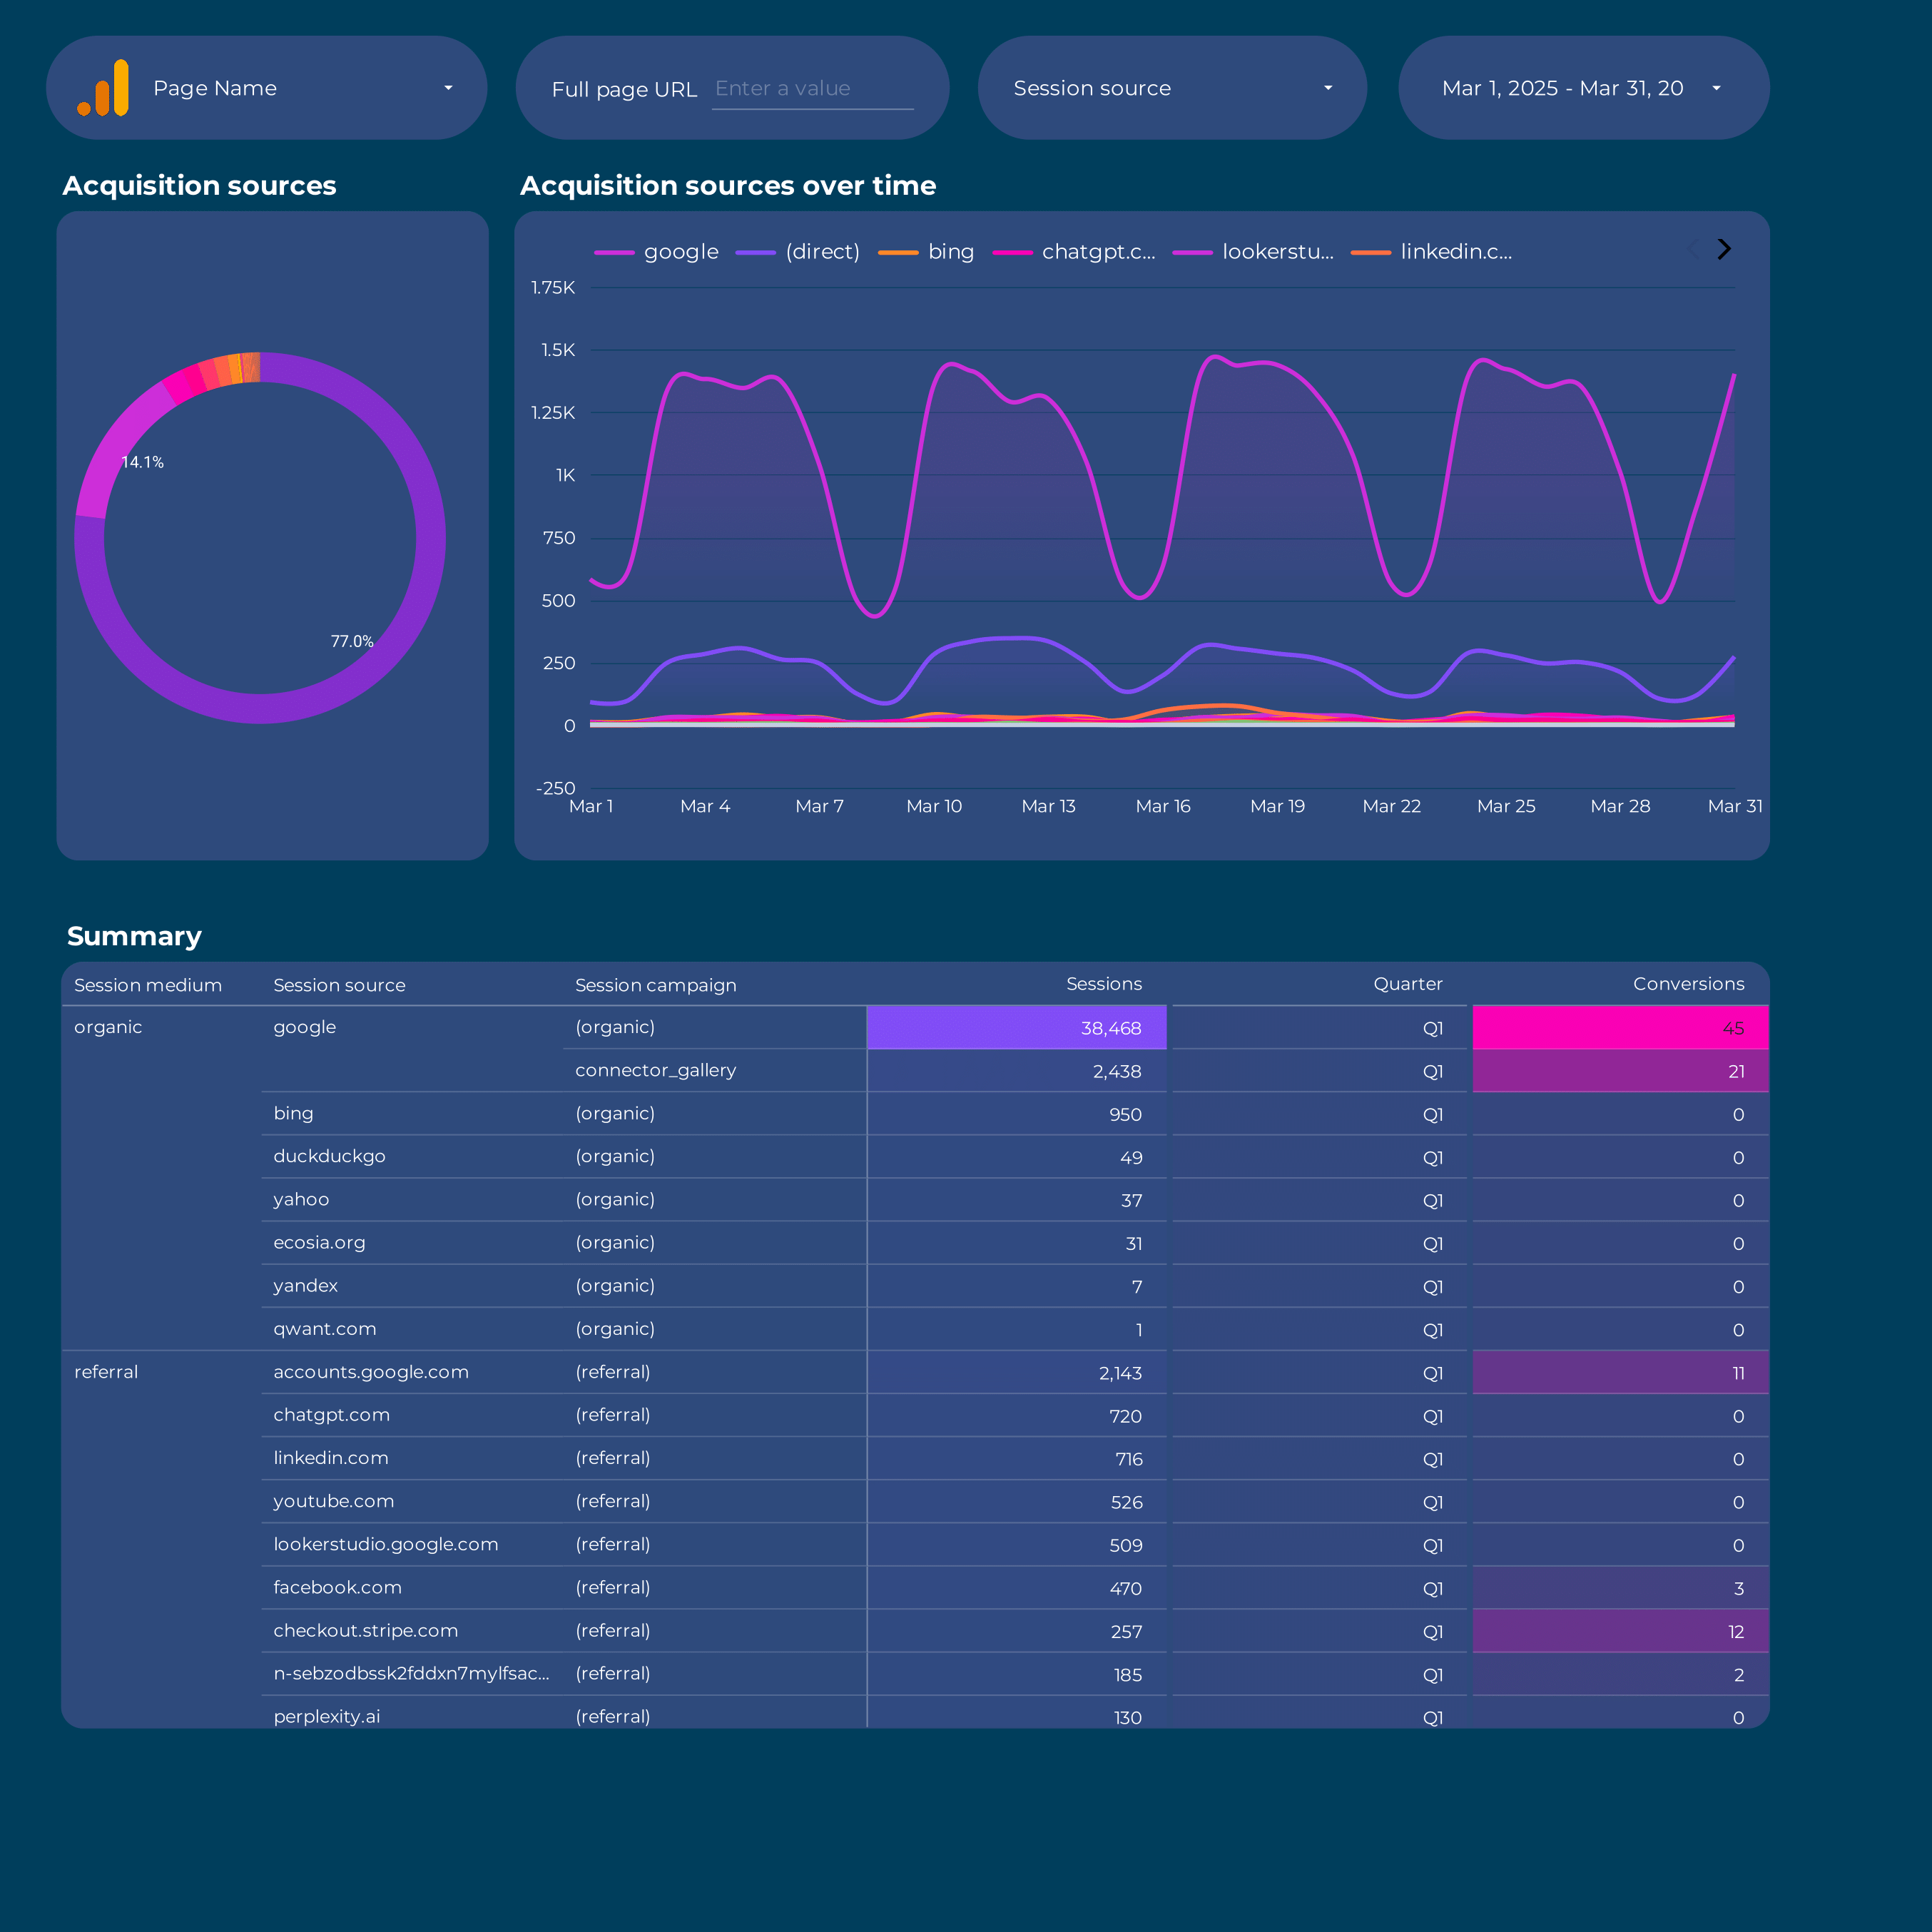
Google Analytics 4 acquisition Report template for Data Studio by Porter
Acompanhe sessions, new users by source → engagement rate, events/session → conversions by channel, revenue. Segmente por source/medium, campaign, landing page.
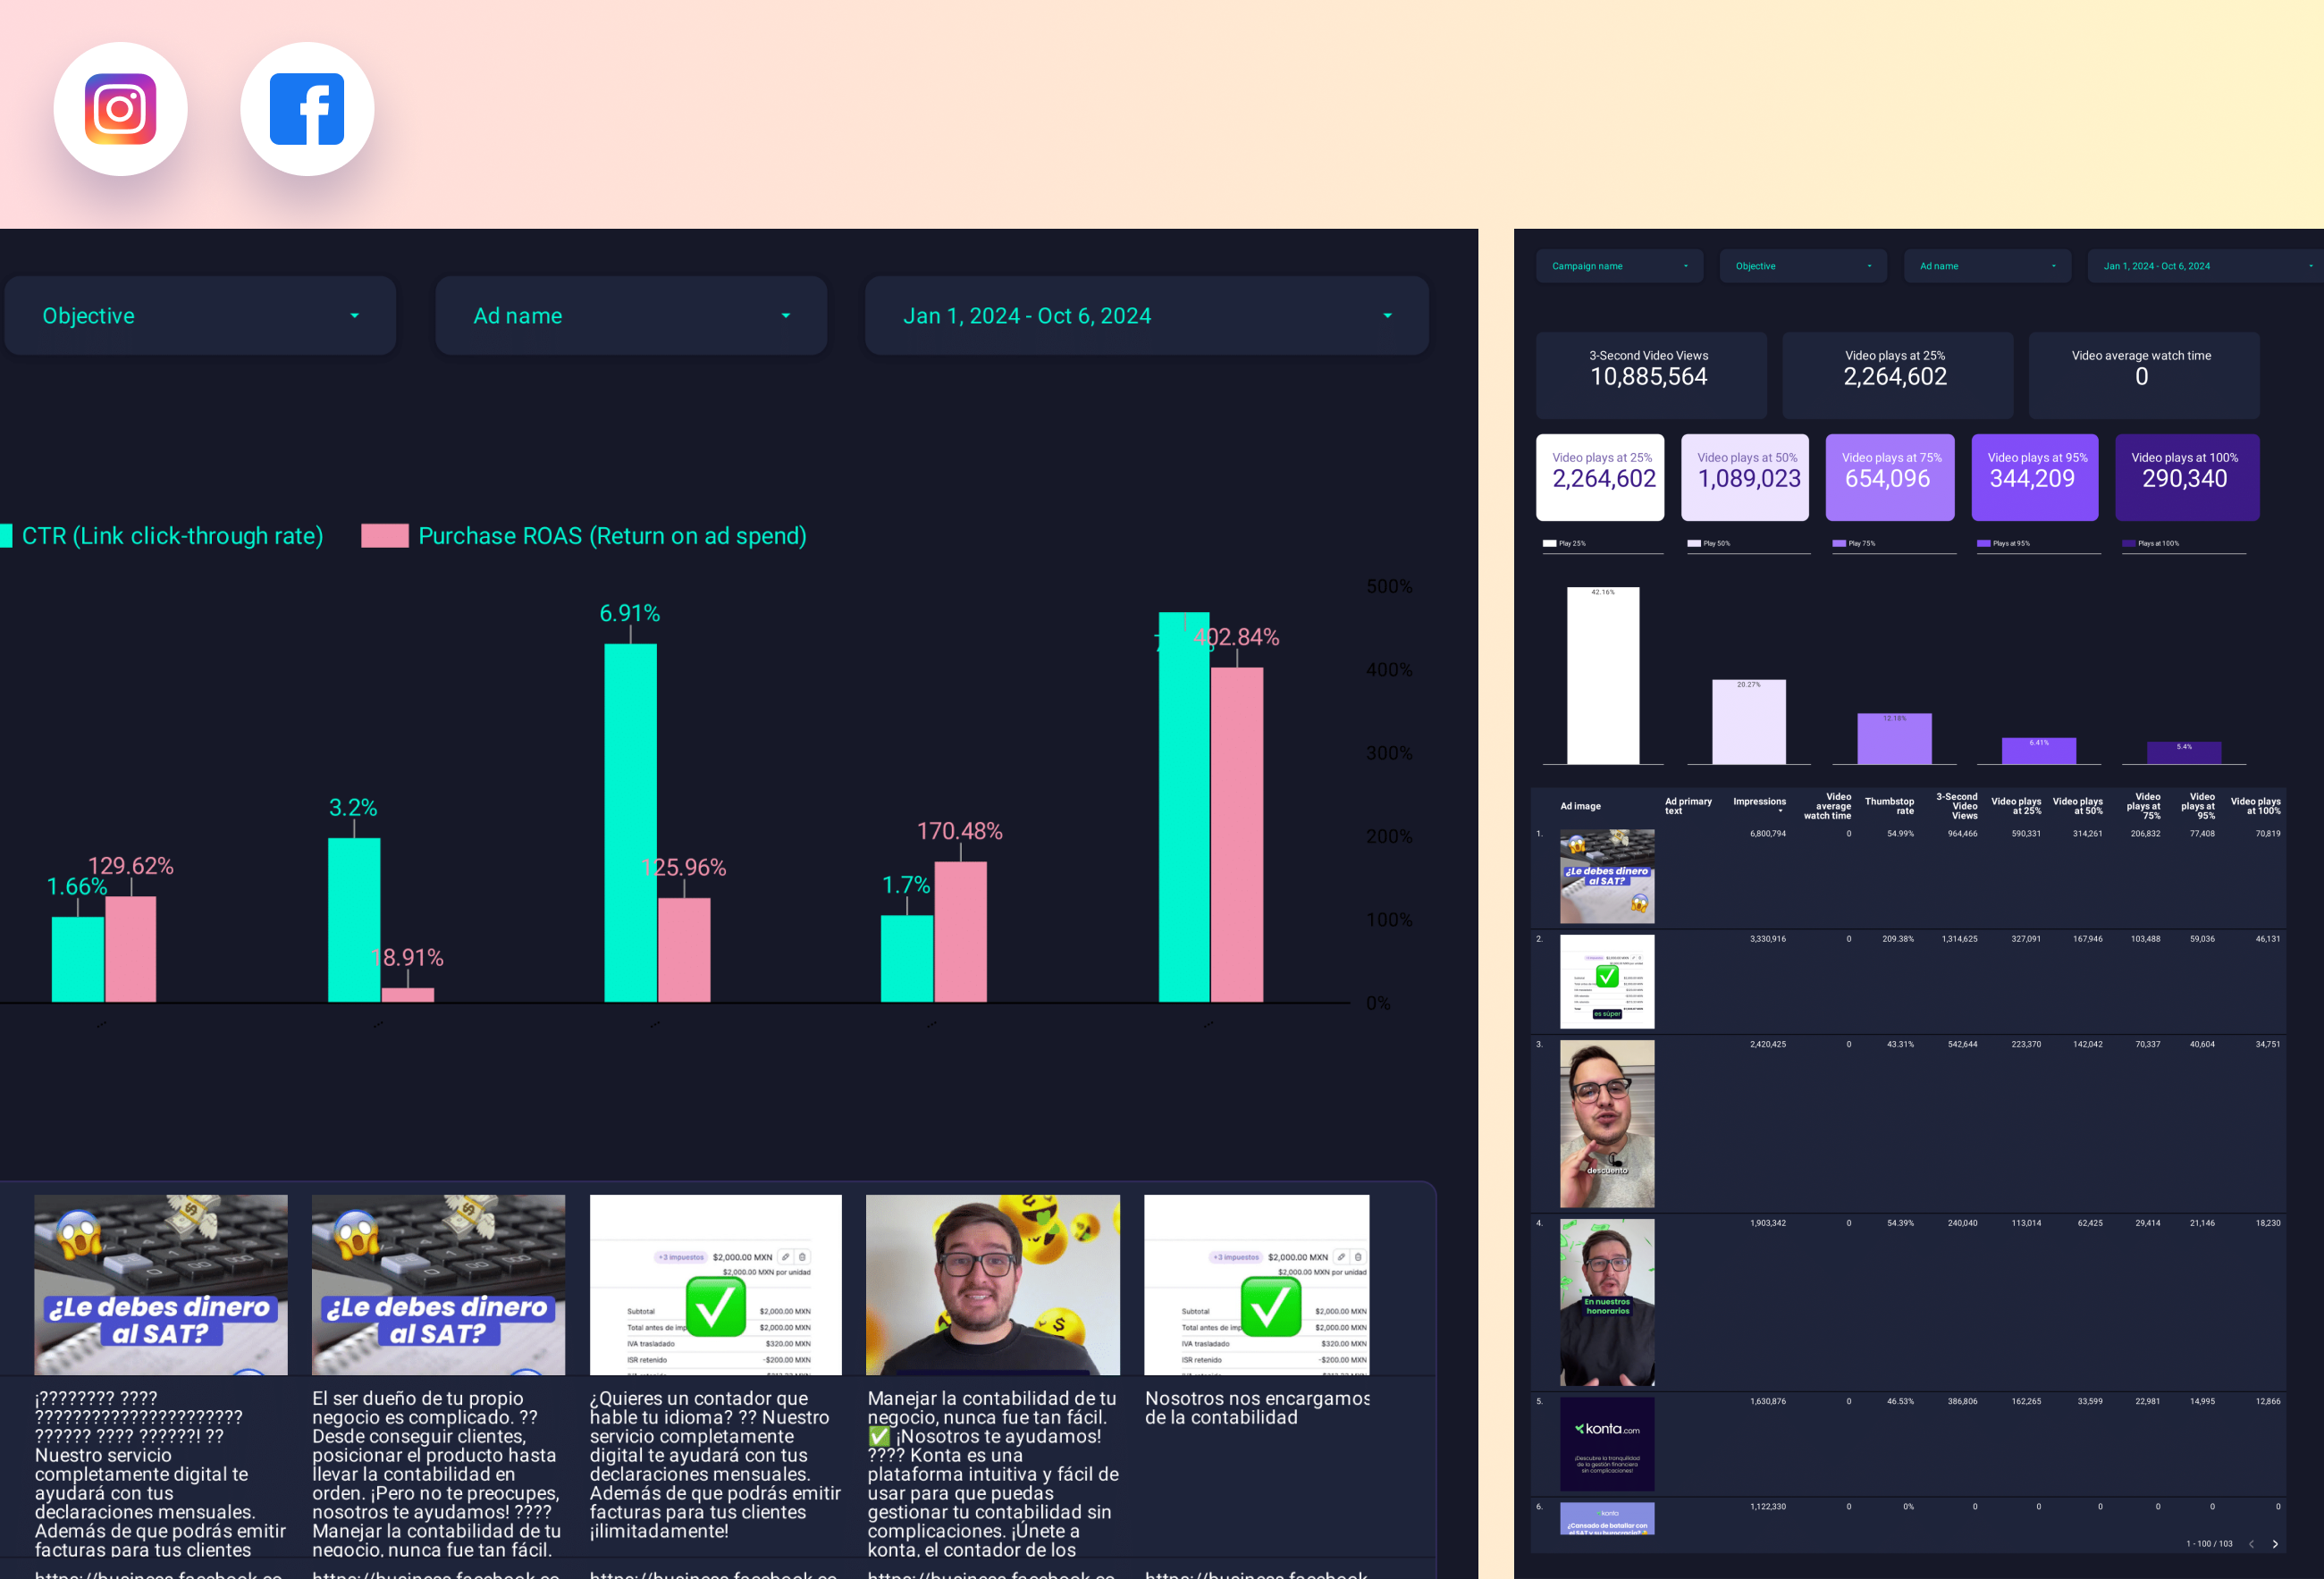
Paid media Creative performance Report template for Data Studio by Porter
Acompanhe creative reach, frequency → CTR, view rate by creative → ROAS per creative, CPA. Segmente por creative format, platform.
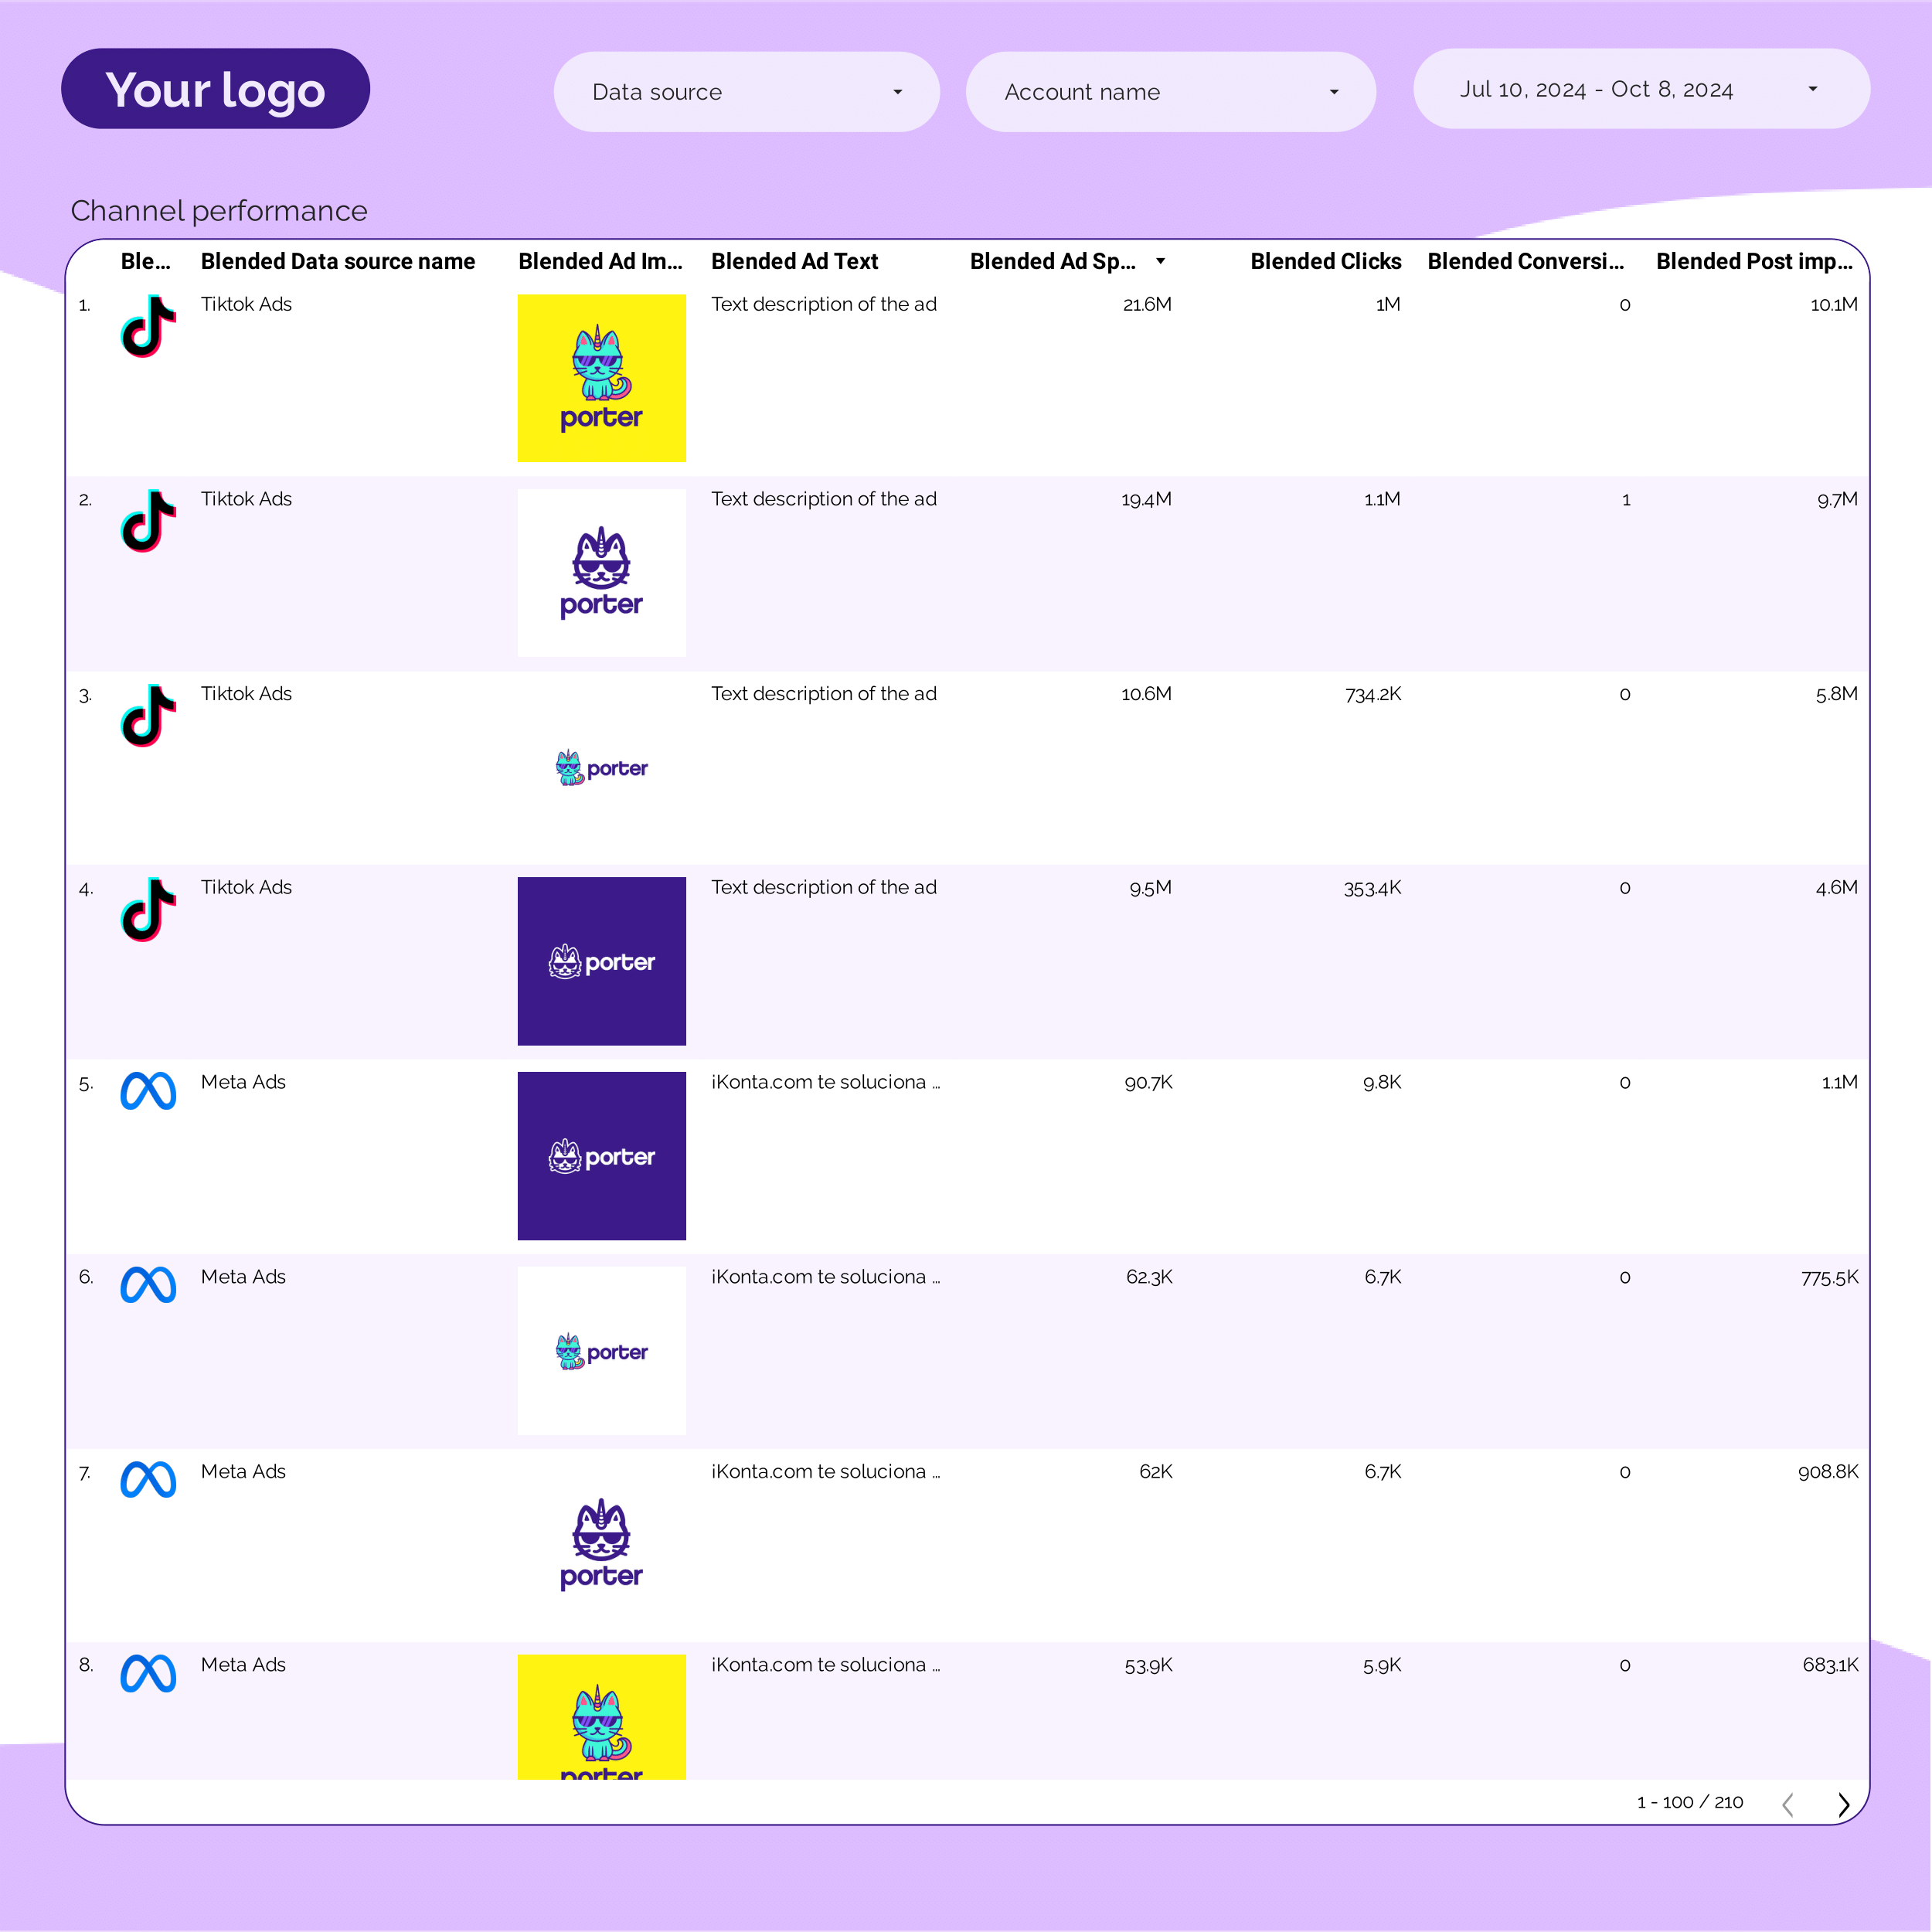
PPC Creative performance Report template for Data Studio by Porter
Acompanhe creative impressions, frequency → CTR by creative, hook rate → ROAS per creative variant. Segmente por creative, format, copy.
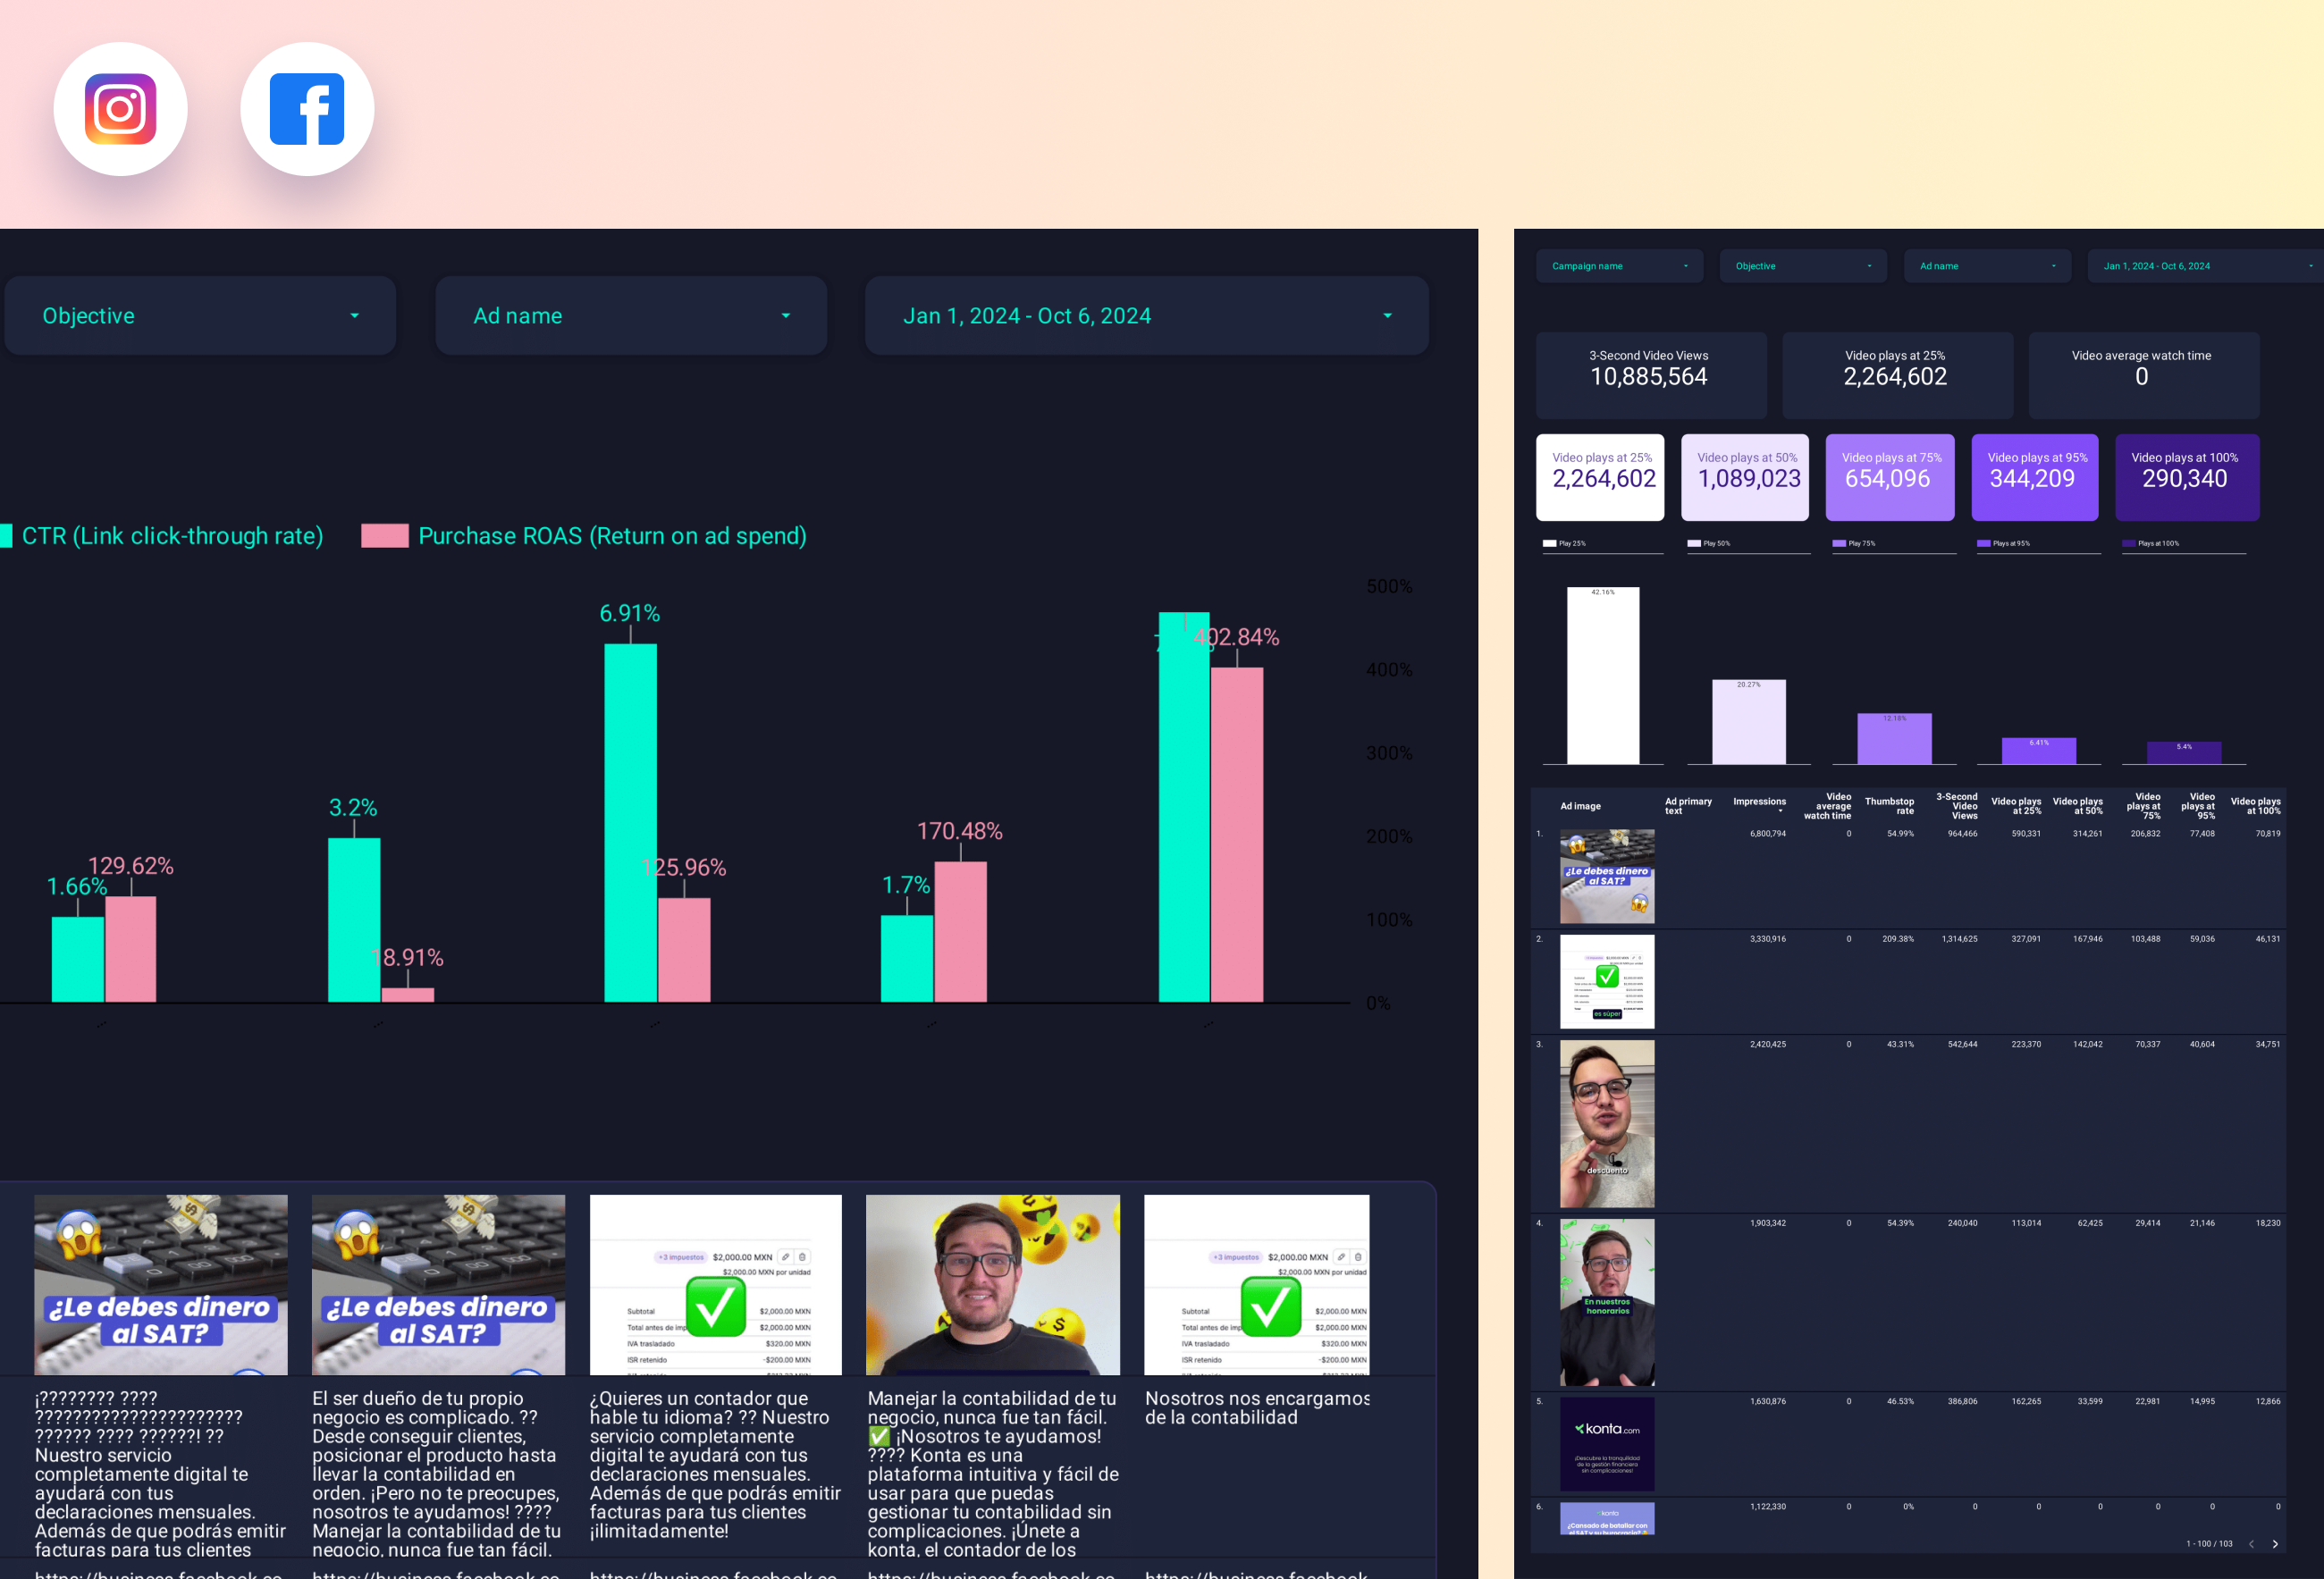
Facebook Ads Creative performance Report template for Data Studio by Porter
Acompanhe ad impressions by creative → CTR, hook rate, hold rate → ROAS per creative, CPA. Segmente por creative format, copy.
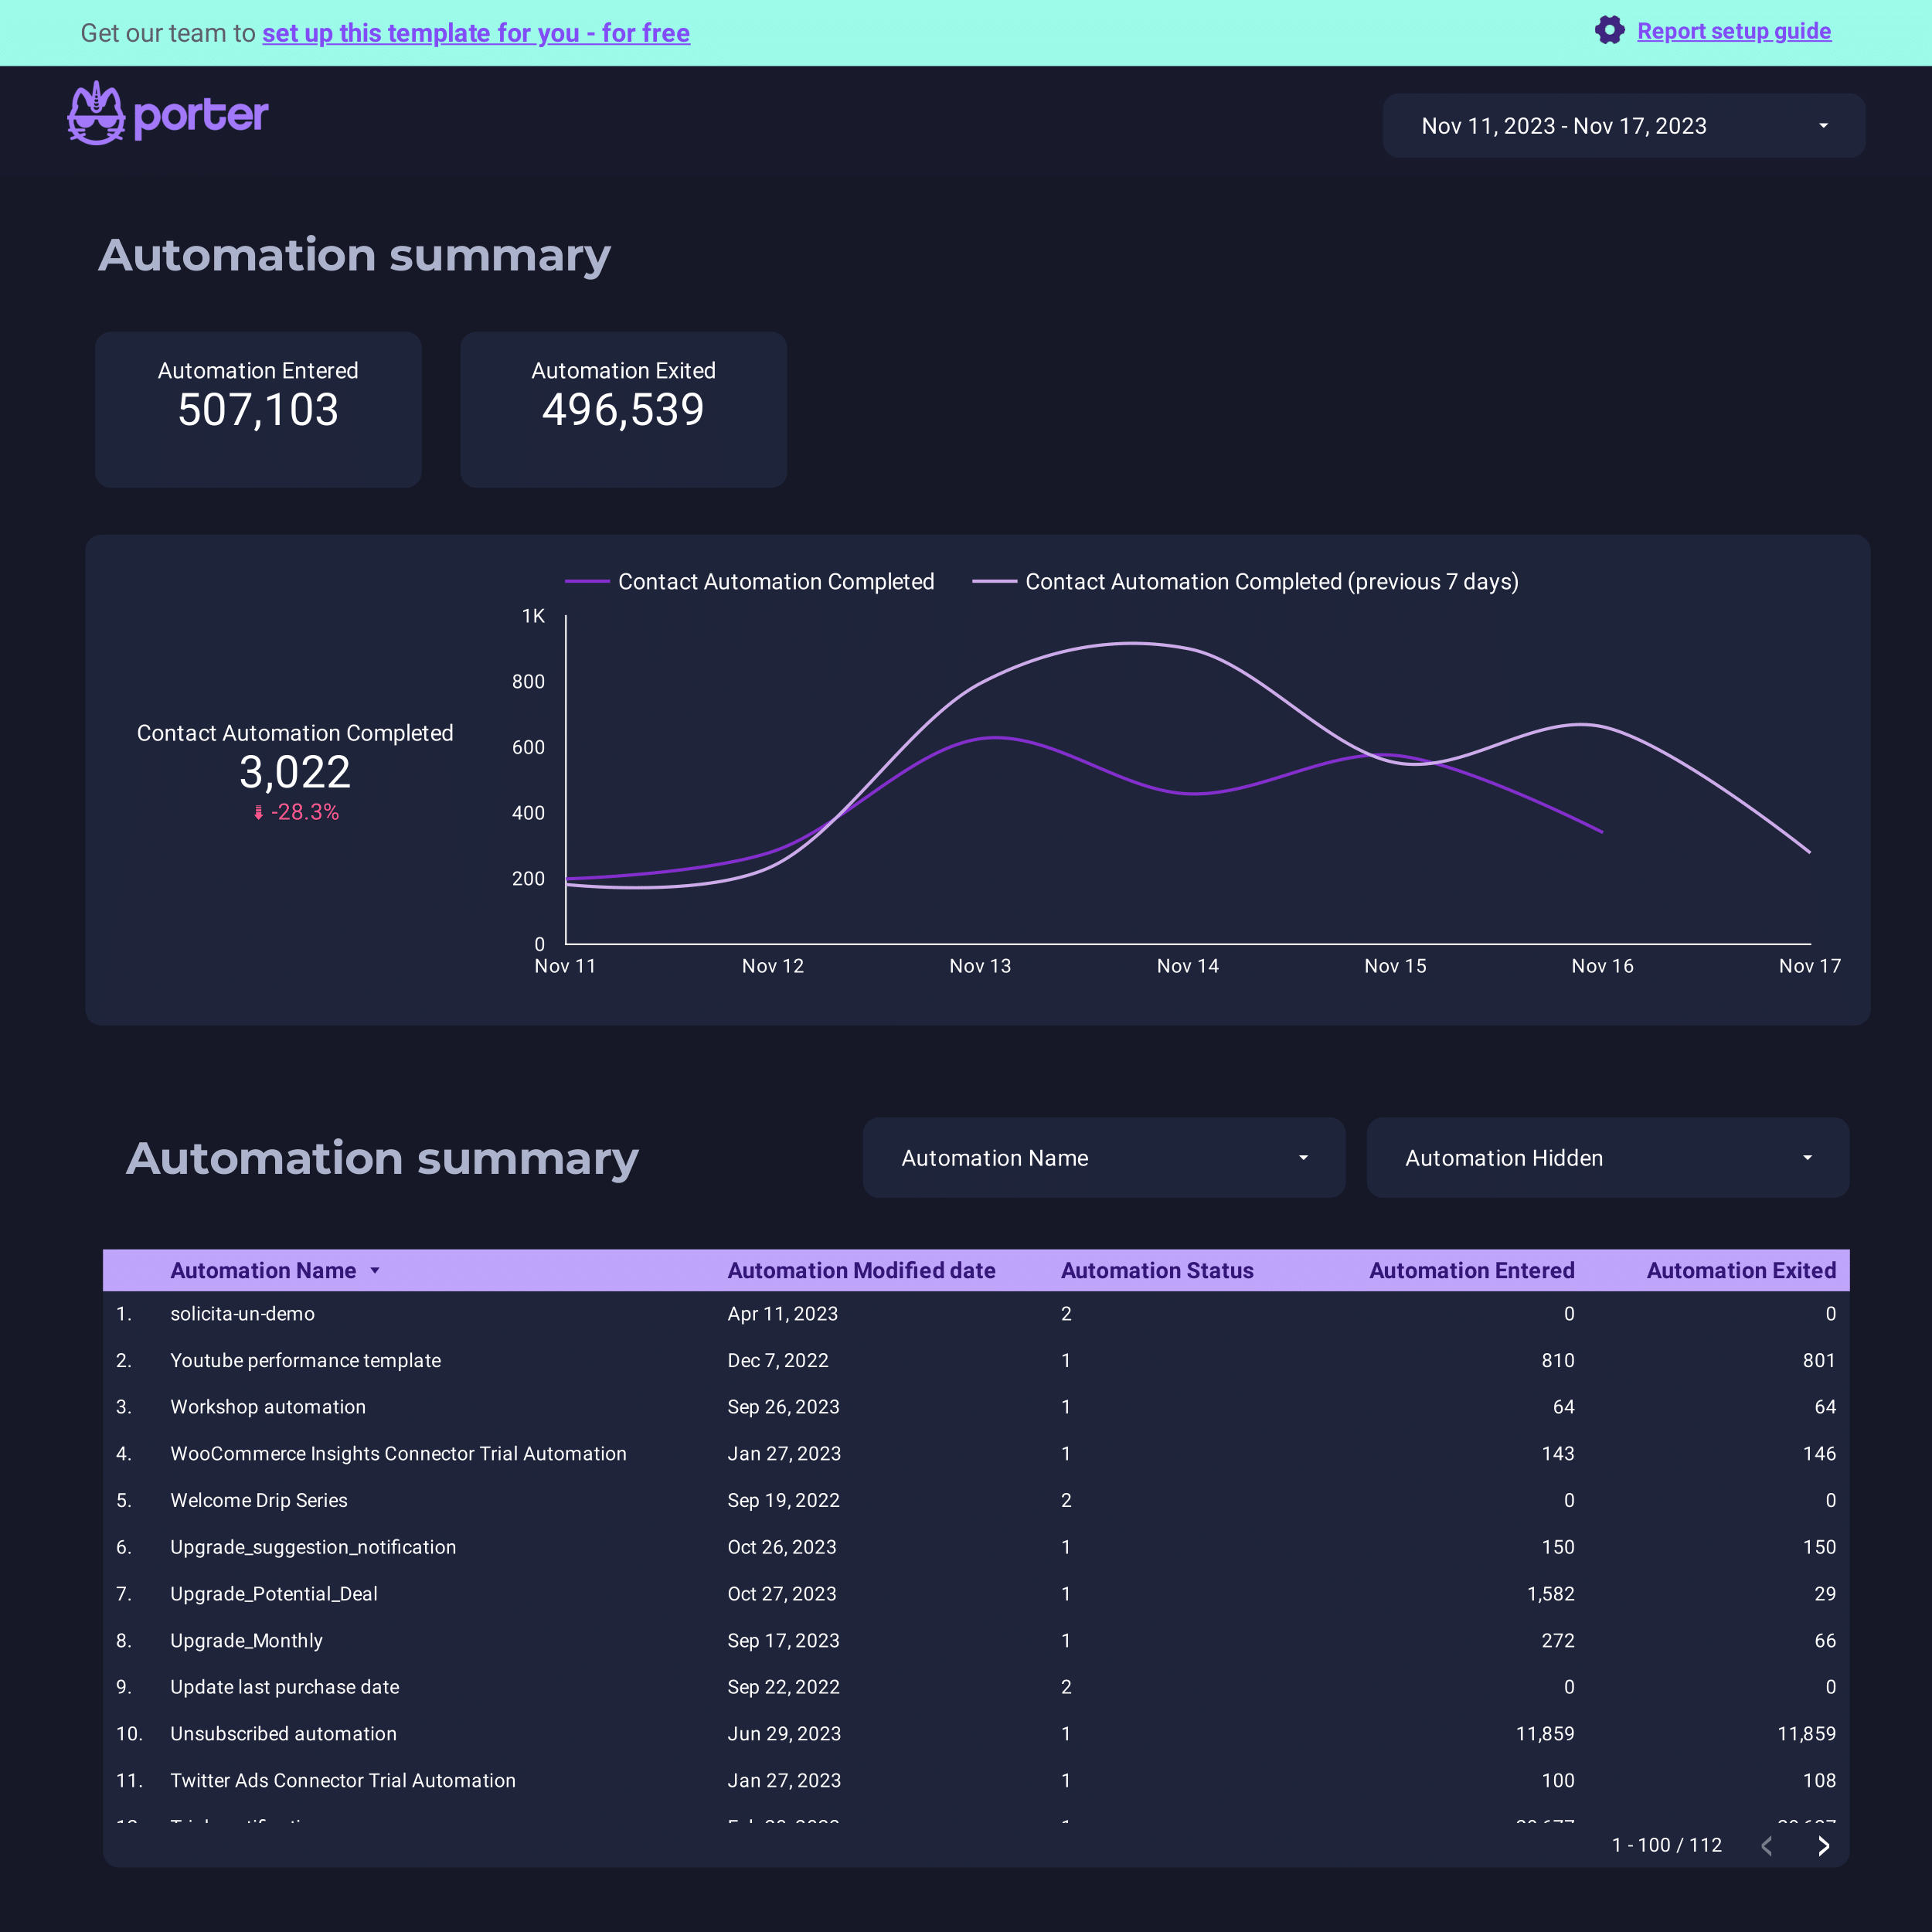
ActiveCampaign Report template for Data Studio by Porter
Acompanhe contacts, email deliverability → open rate, click rate → conversion events, deals. Segmente por automation, list, campaign.
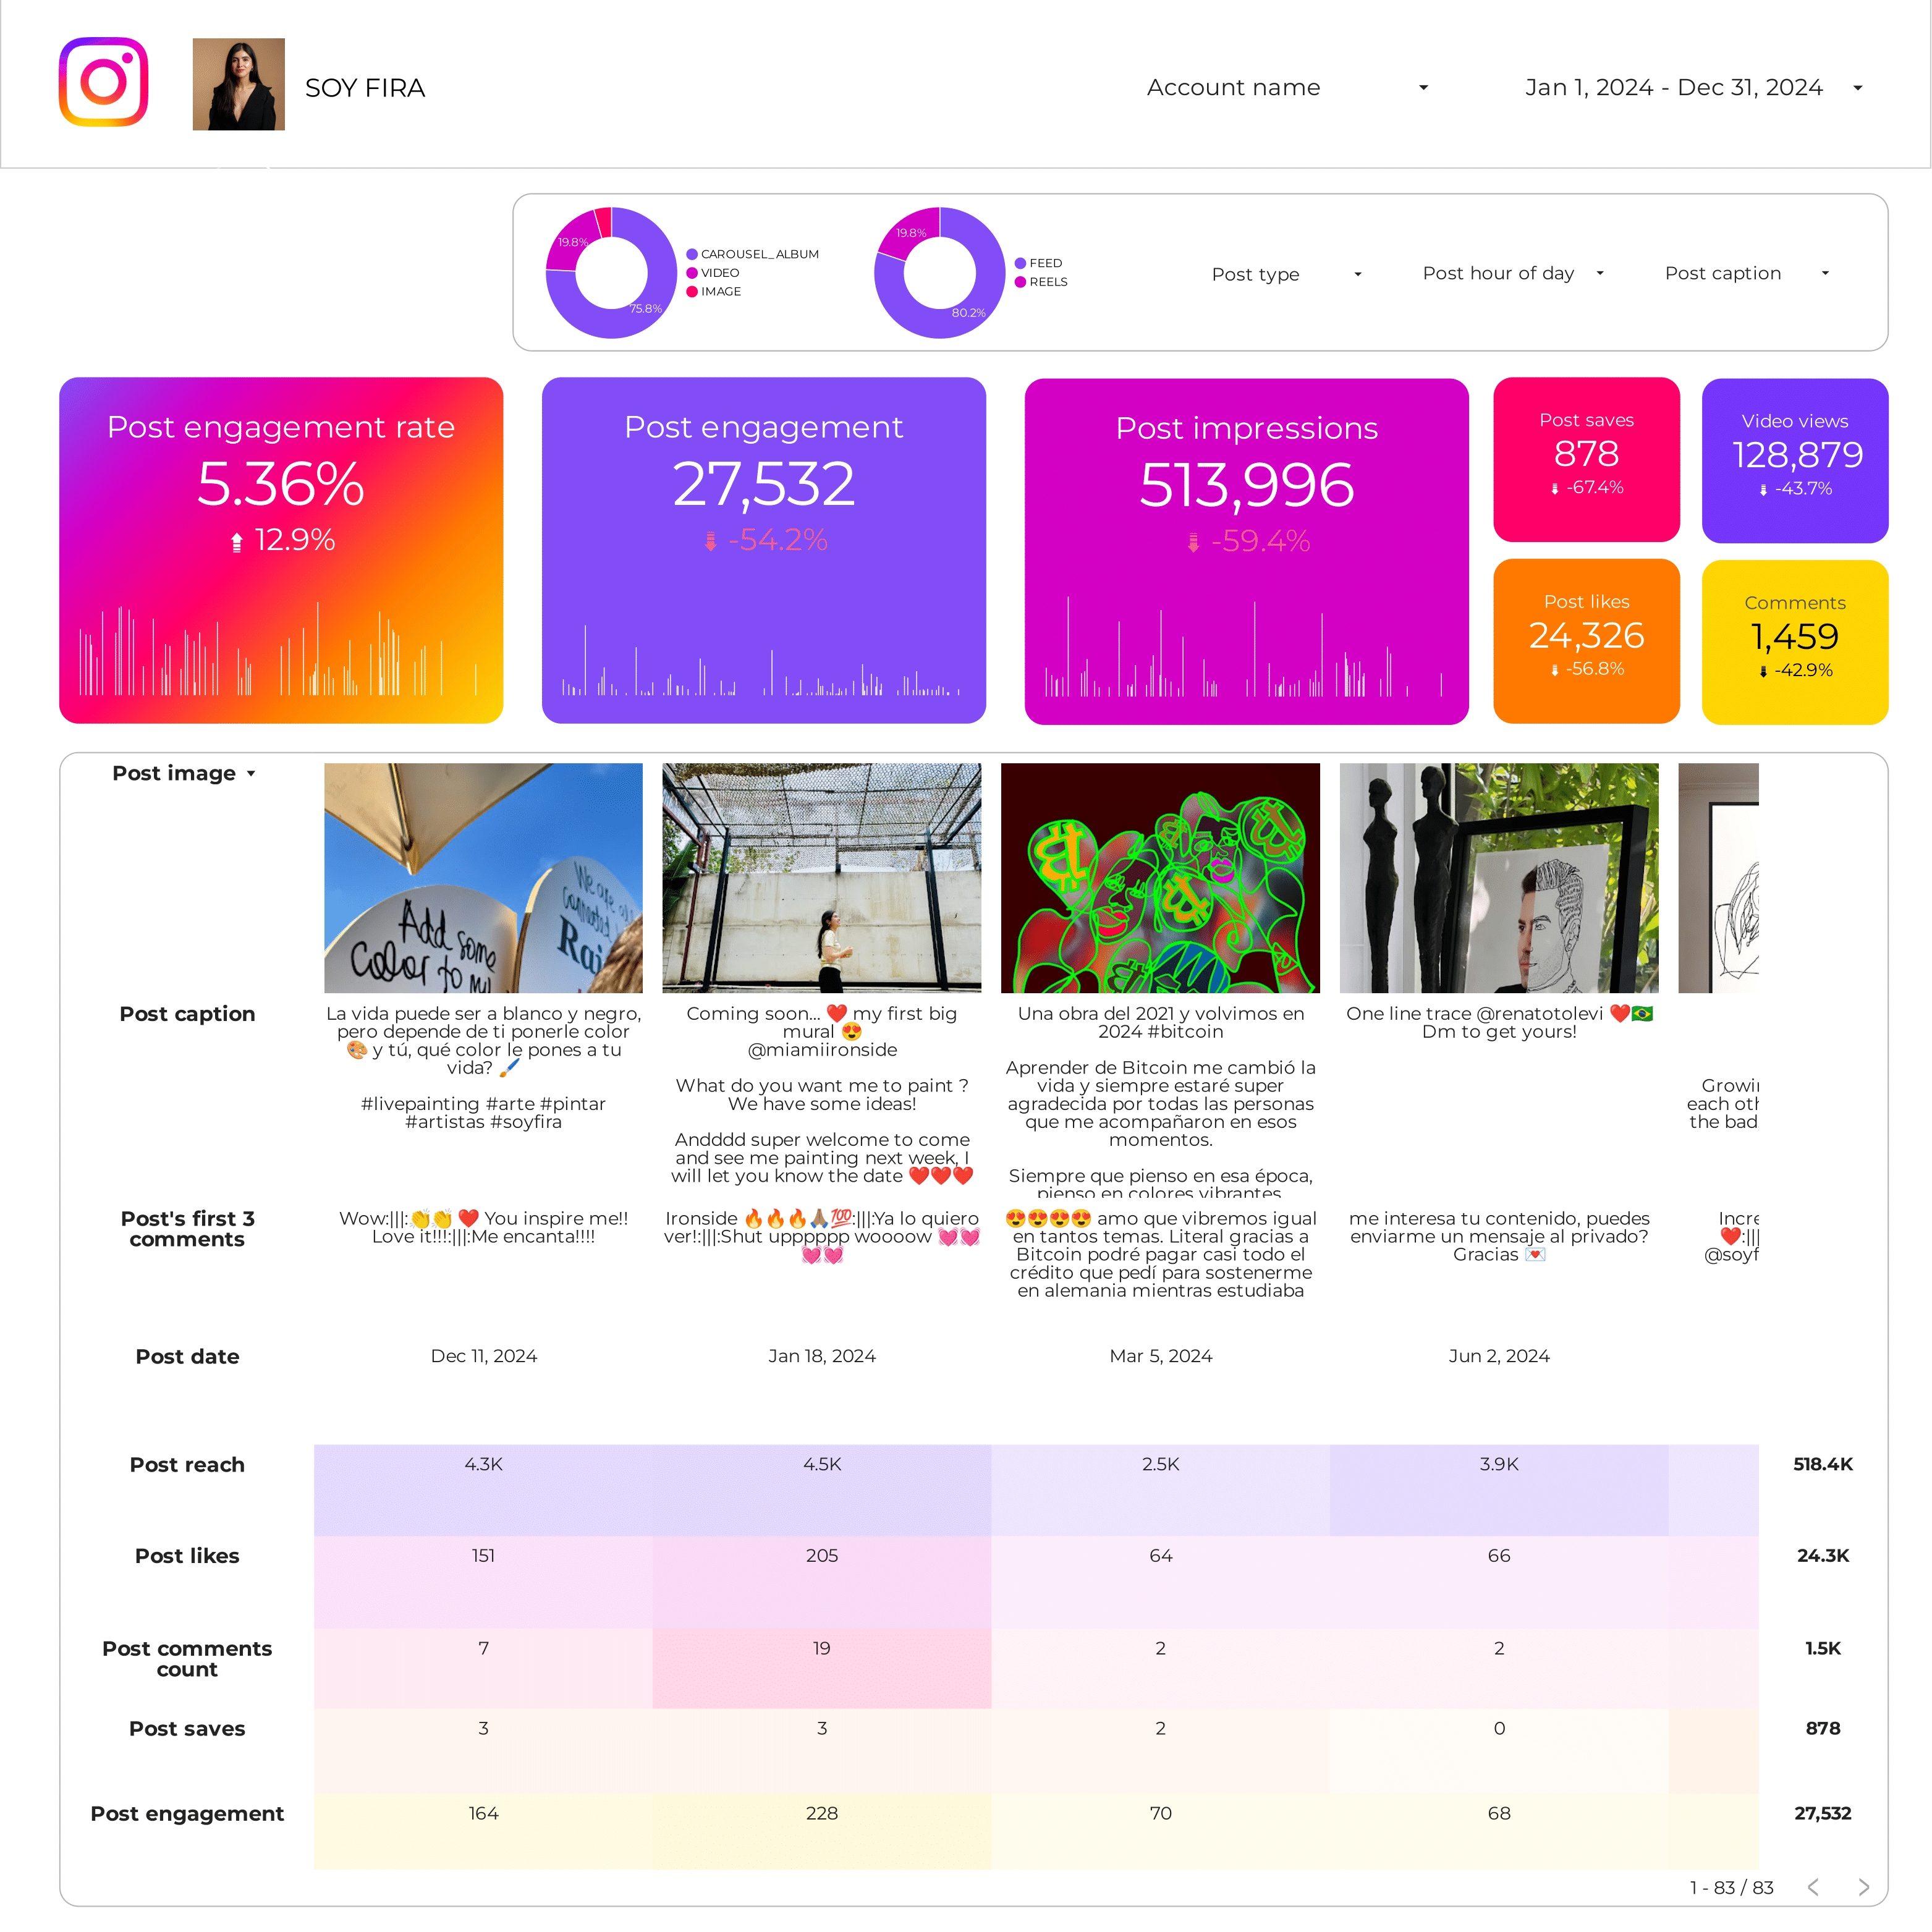
Instagram Insights Post performance Report template for Data Studio by Porter
Acompanhe post reach, impressions → likes, comments, saves per post → CTR to profile, website taps. Segmente por post format, topic, time.
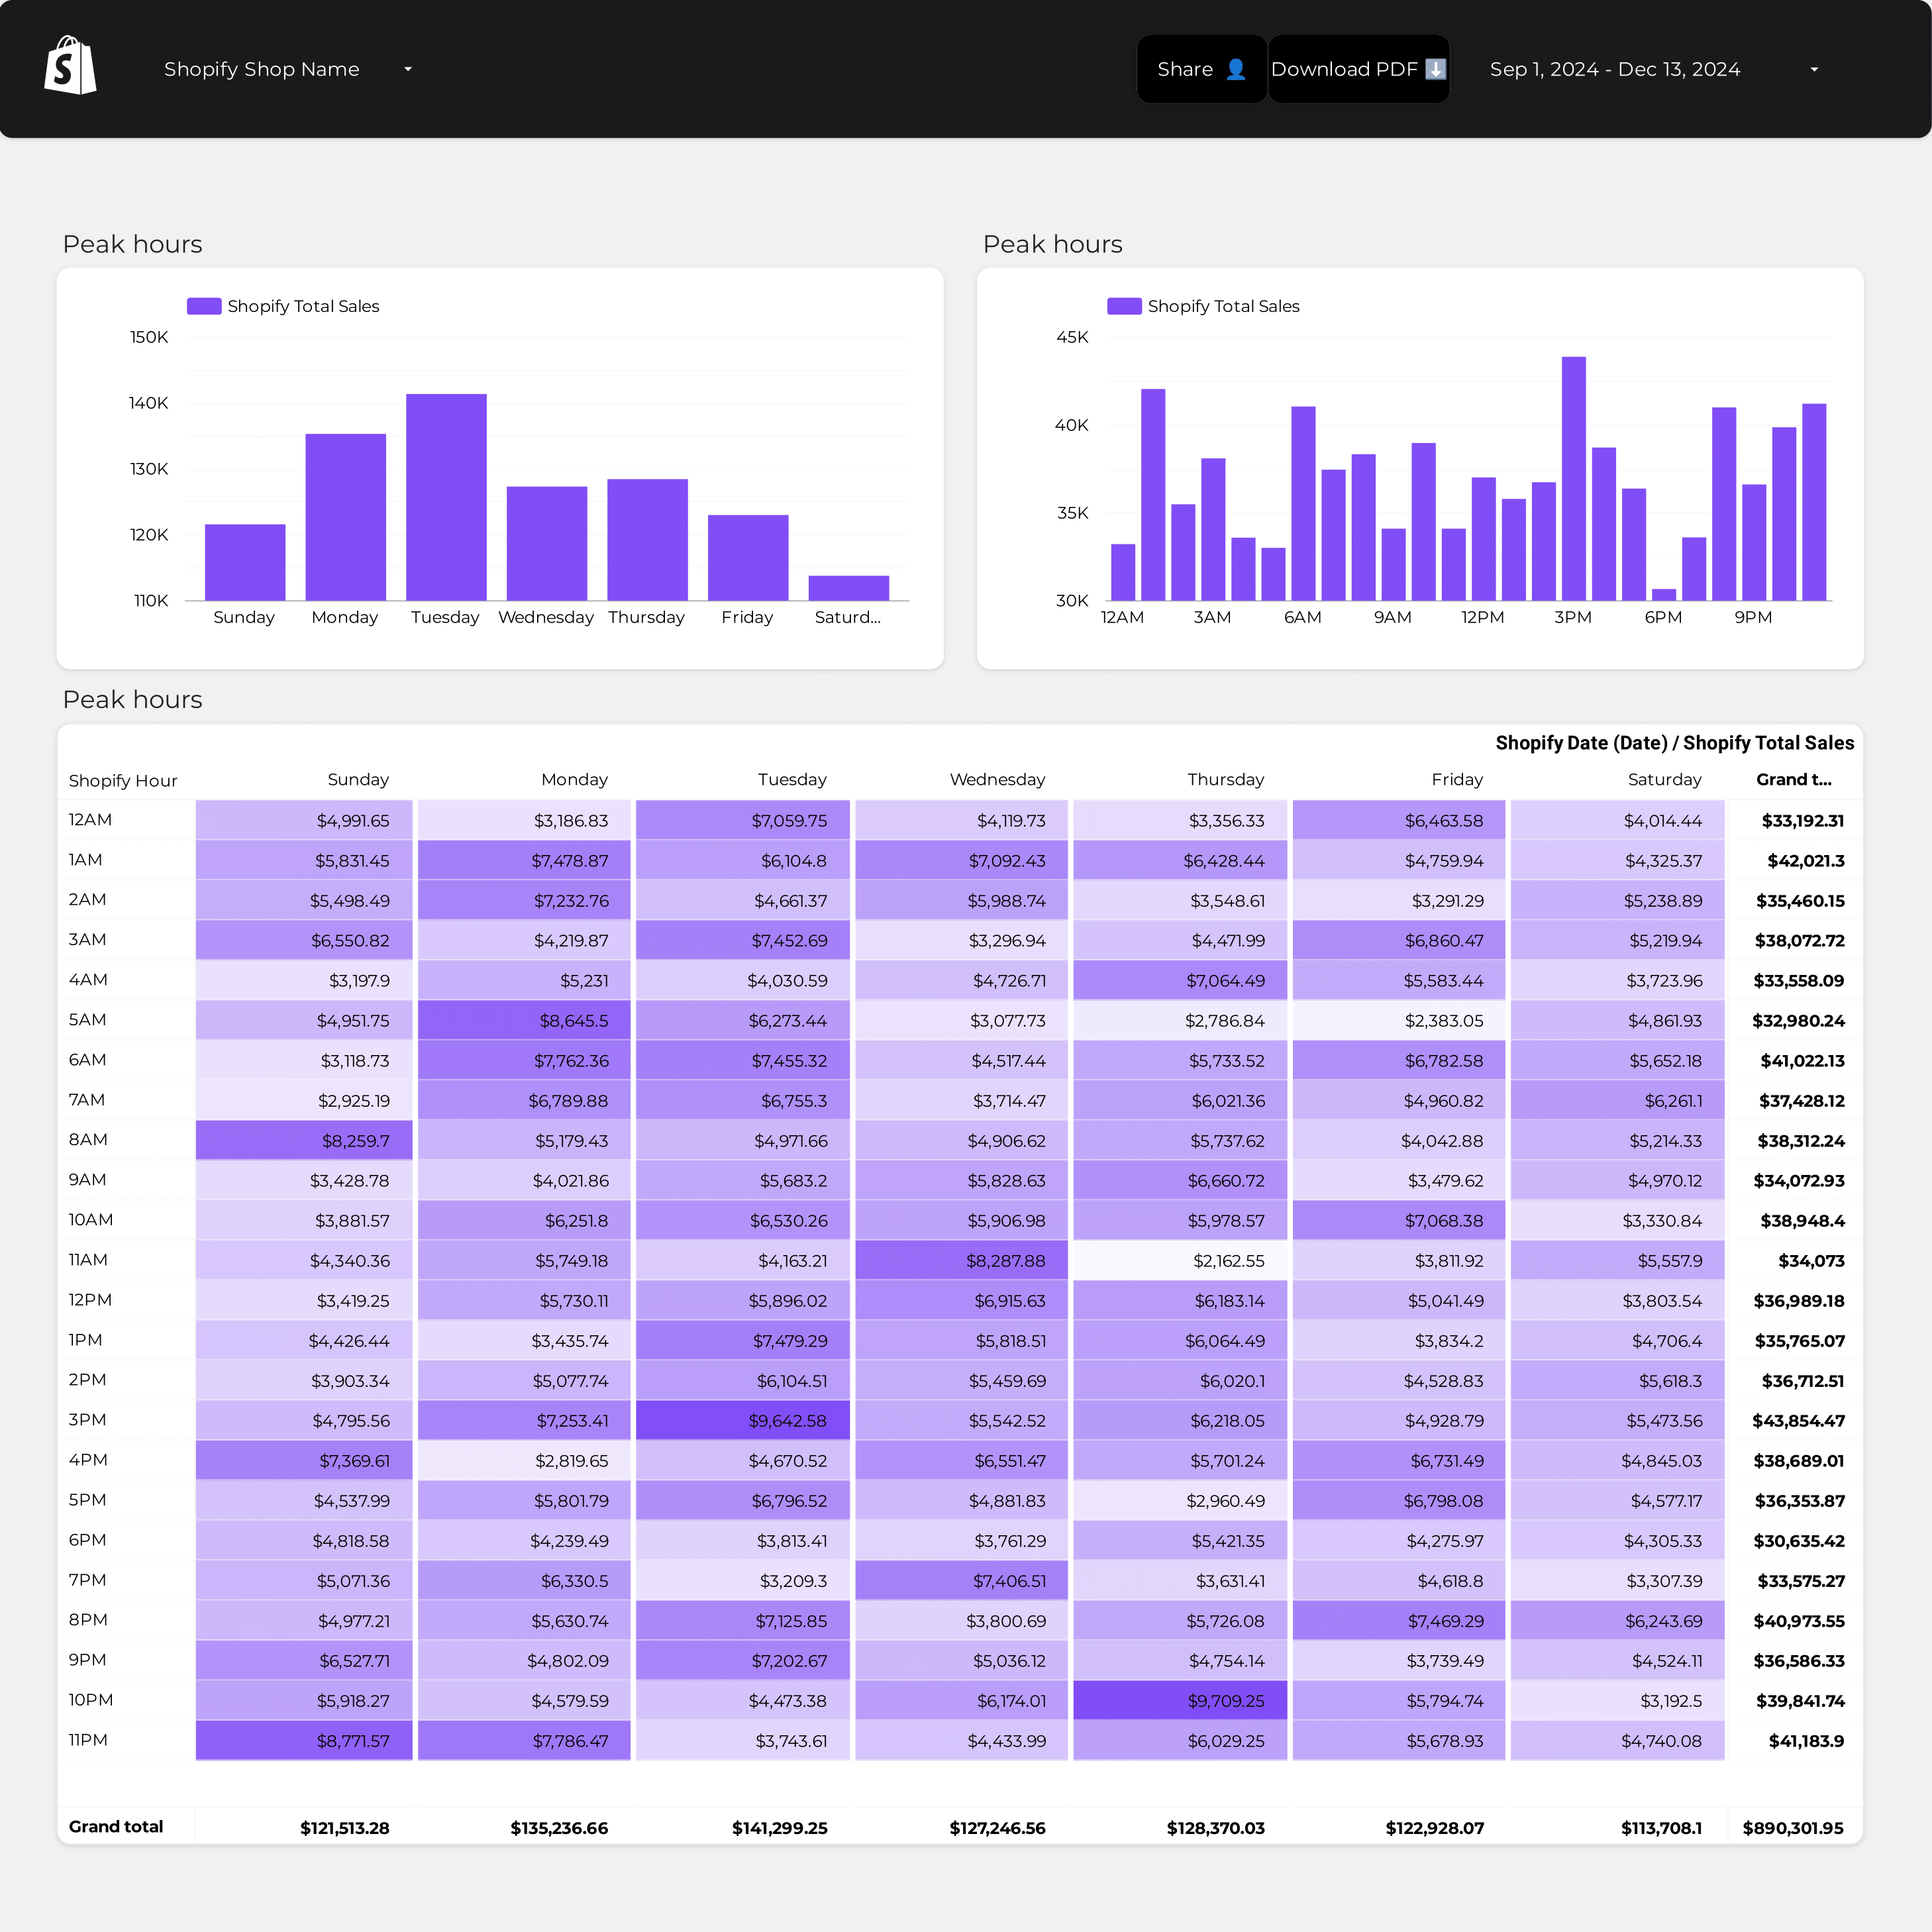
Shopify Store performance Report template for Data Studio by Porter
Acompanhe store sessions, product views → add-to-cart rate, abandonment → orders, revenue, conversion. Segmente por product, source, device.
ActiveCampaign Report template for Data Studio by Porter
Acompanhe contacts, email deliverability → open rate, click rate → conversion events, deals. Segmente por automation, list, campaign.
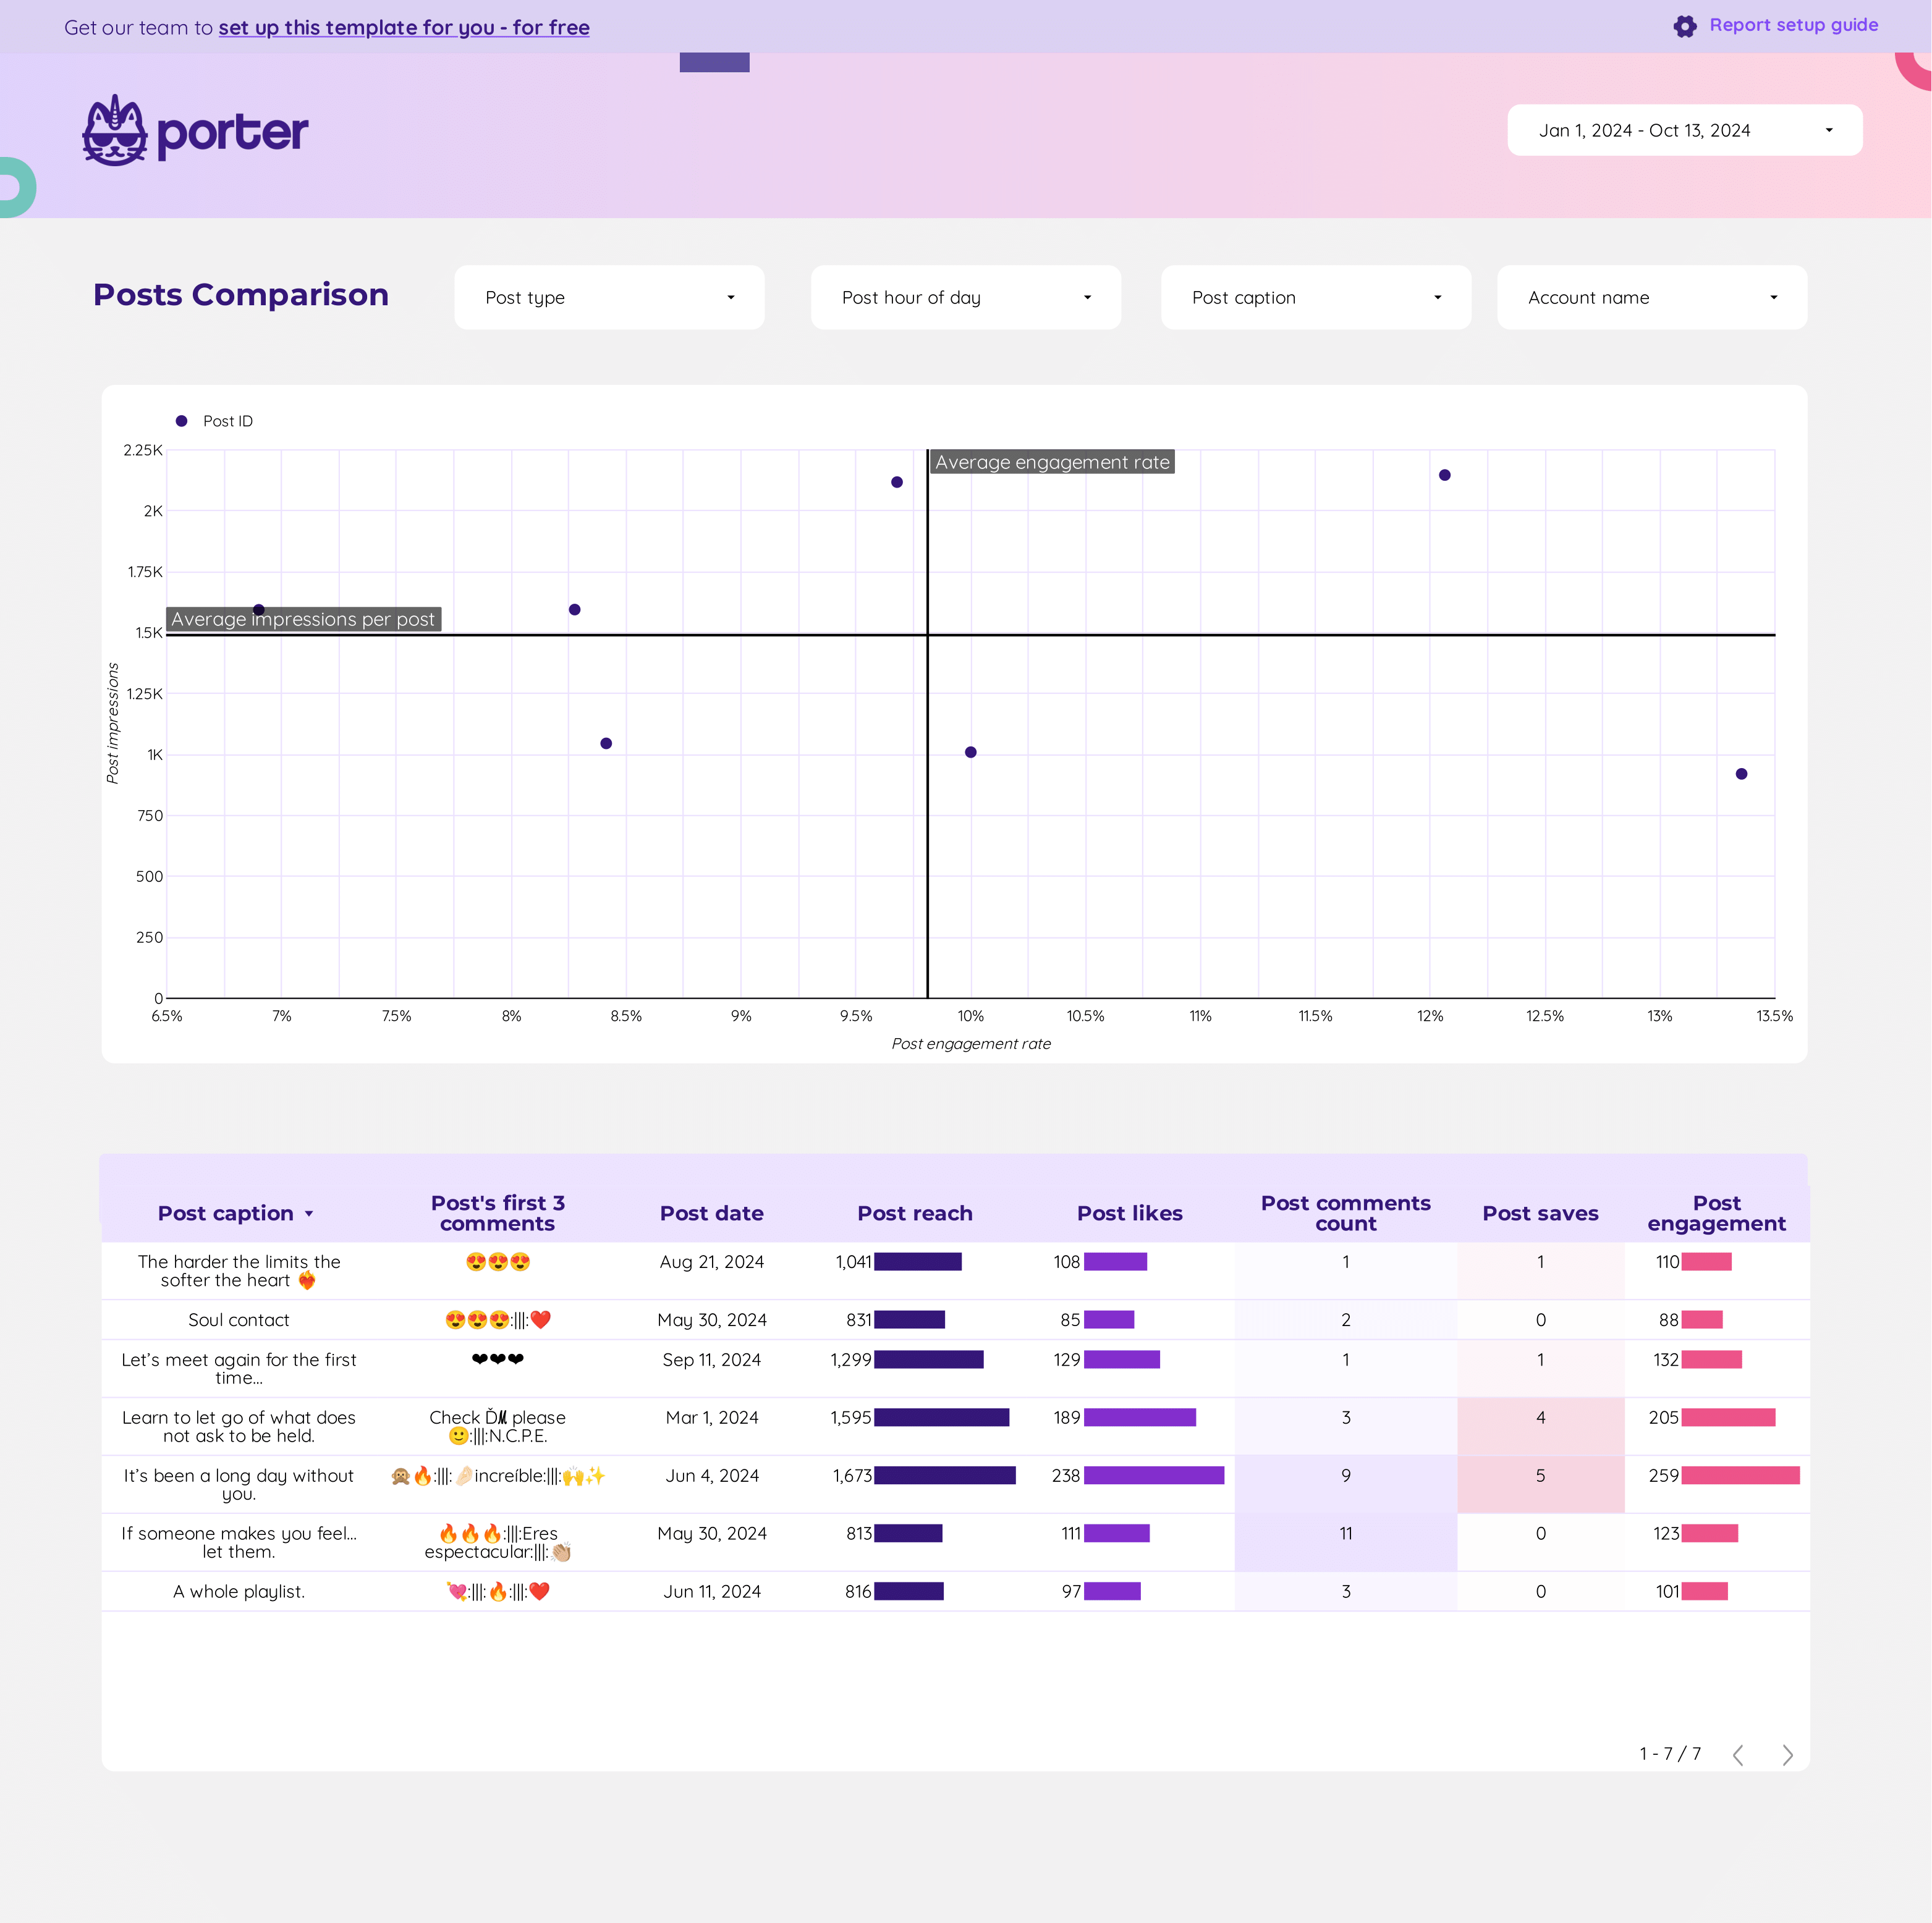
Content performance Report template for Data Studio by Porter
Acompanhe post reach, impressions → engagement rate, shares, saves → click-through rate, content ROI. Segmente por format, topic, platform.
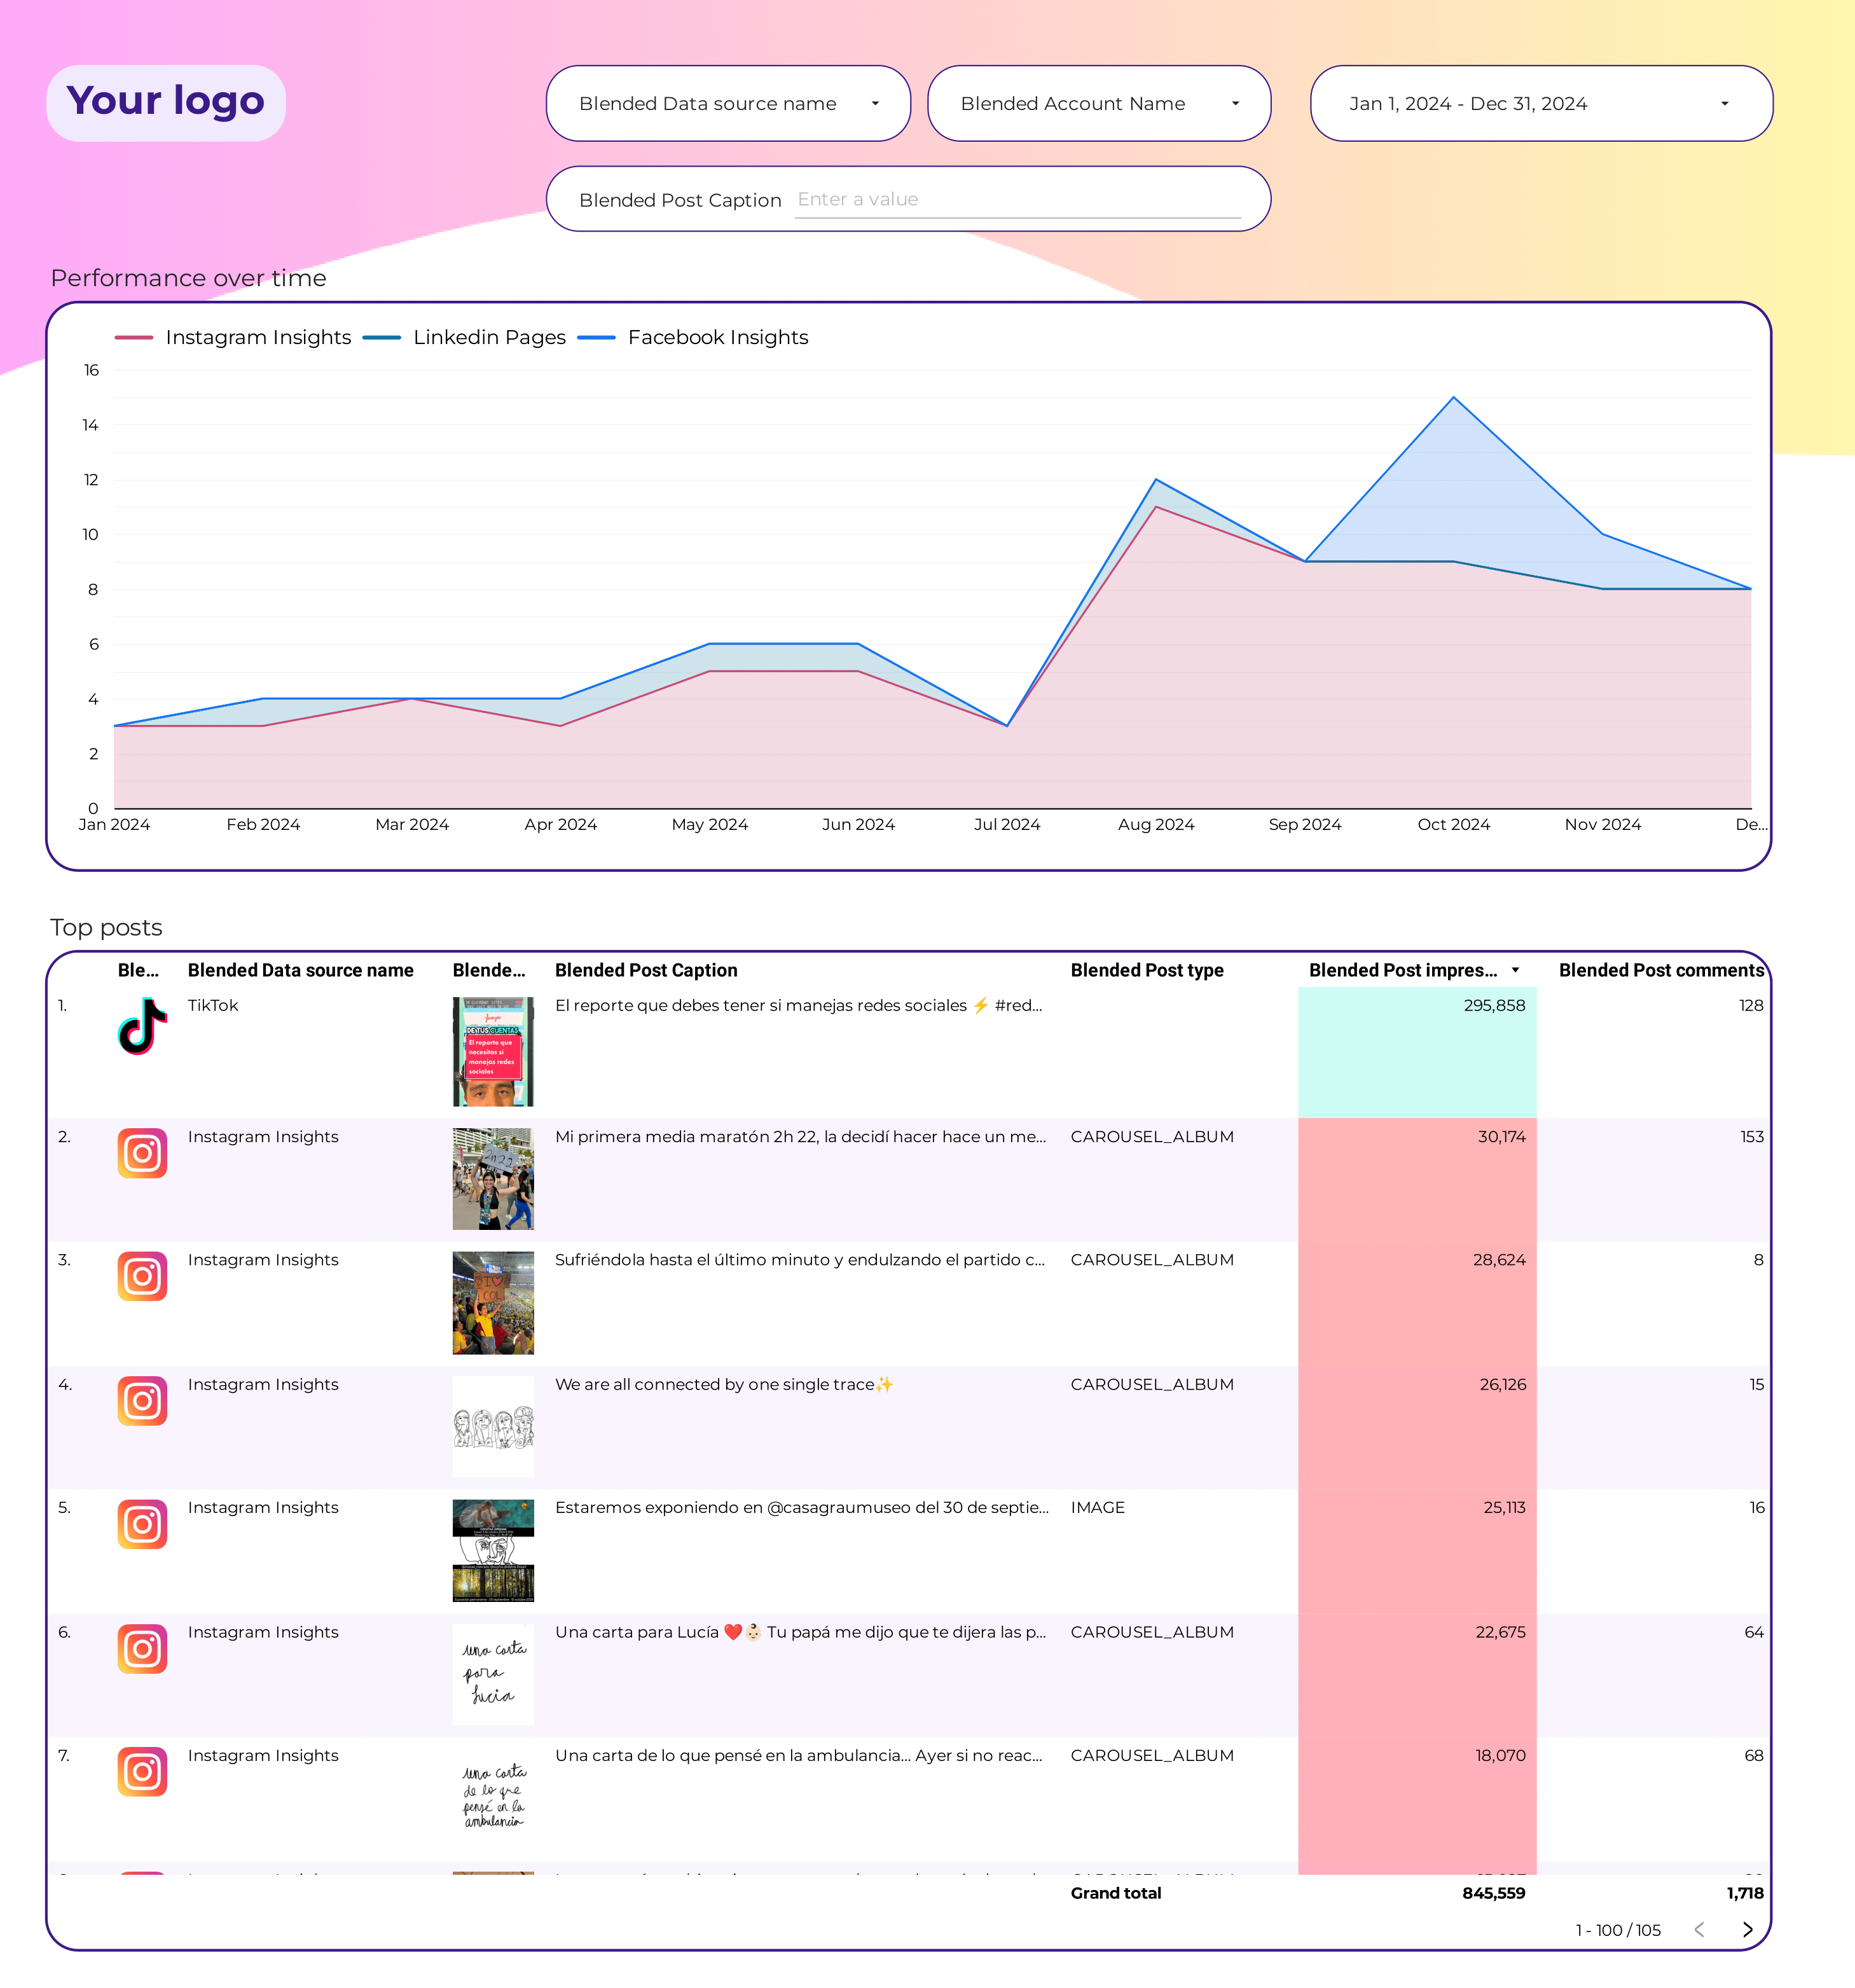
Social Media Post performance Report template for Data Studio by Porter
Acompanhe post reach, impressions → engagement per post → clicks per post, conversions. Segmente por format, topic, time.
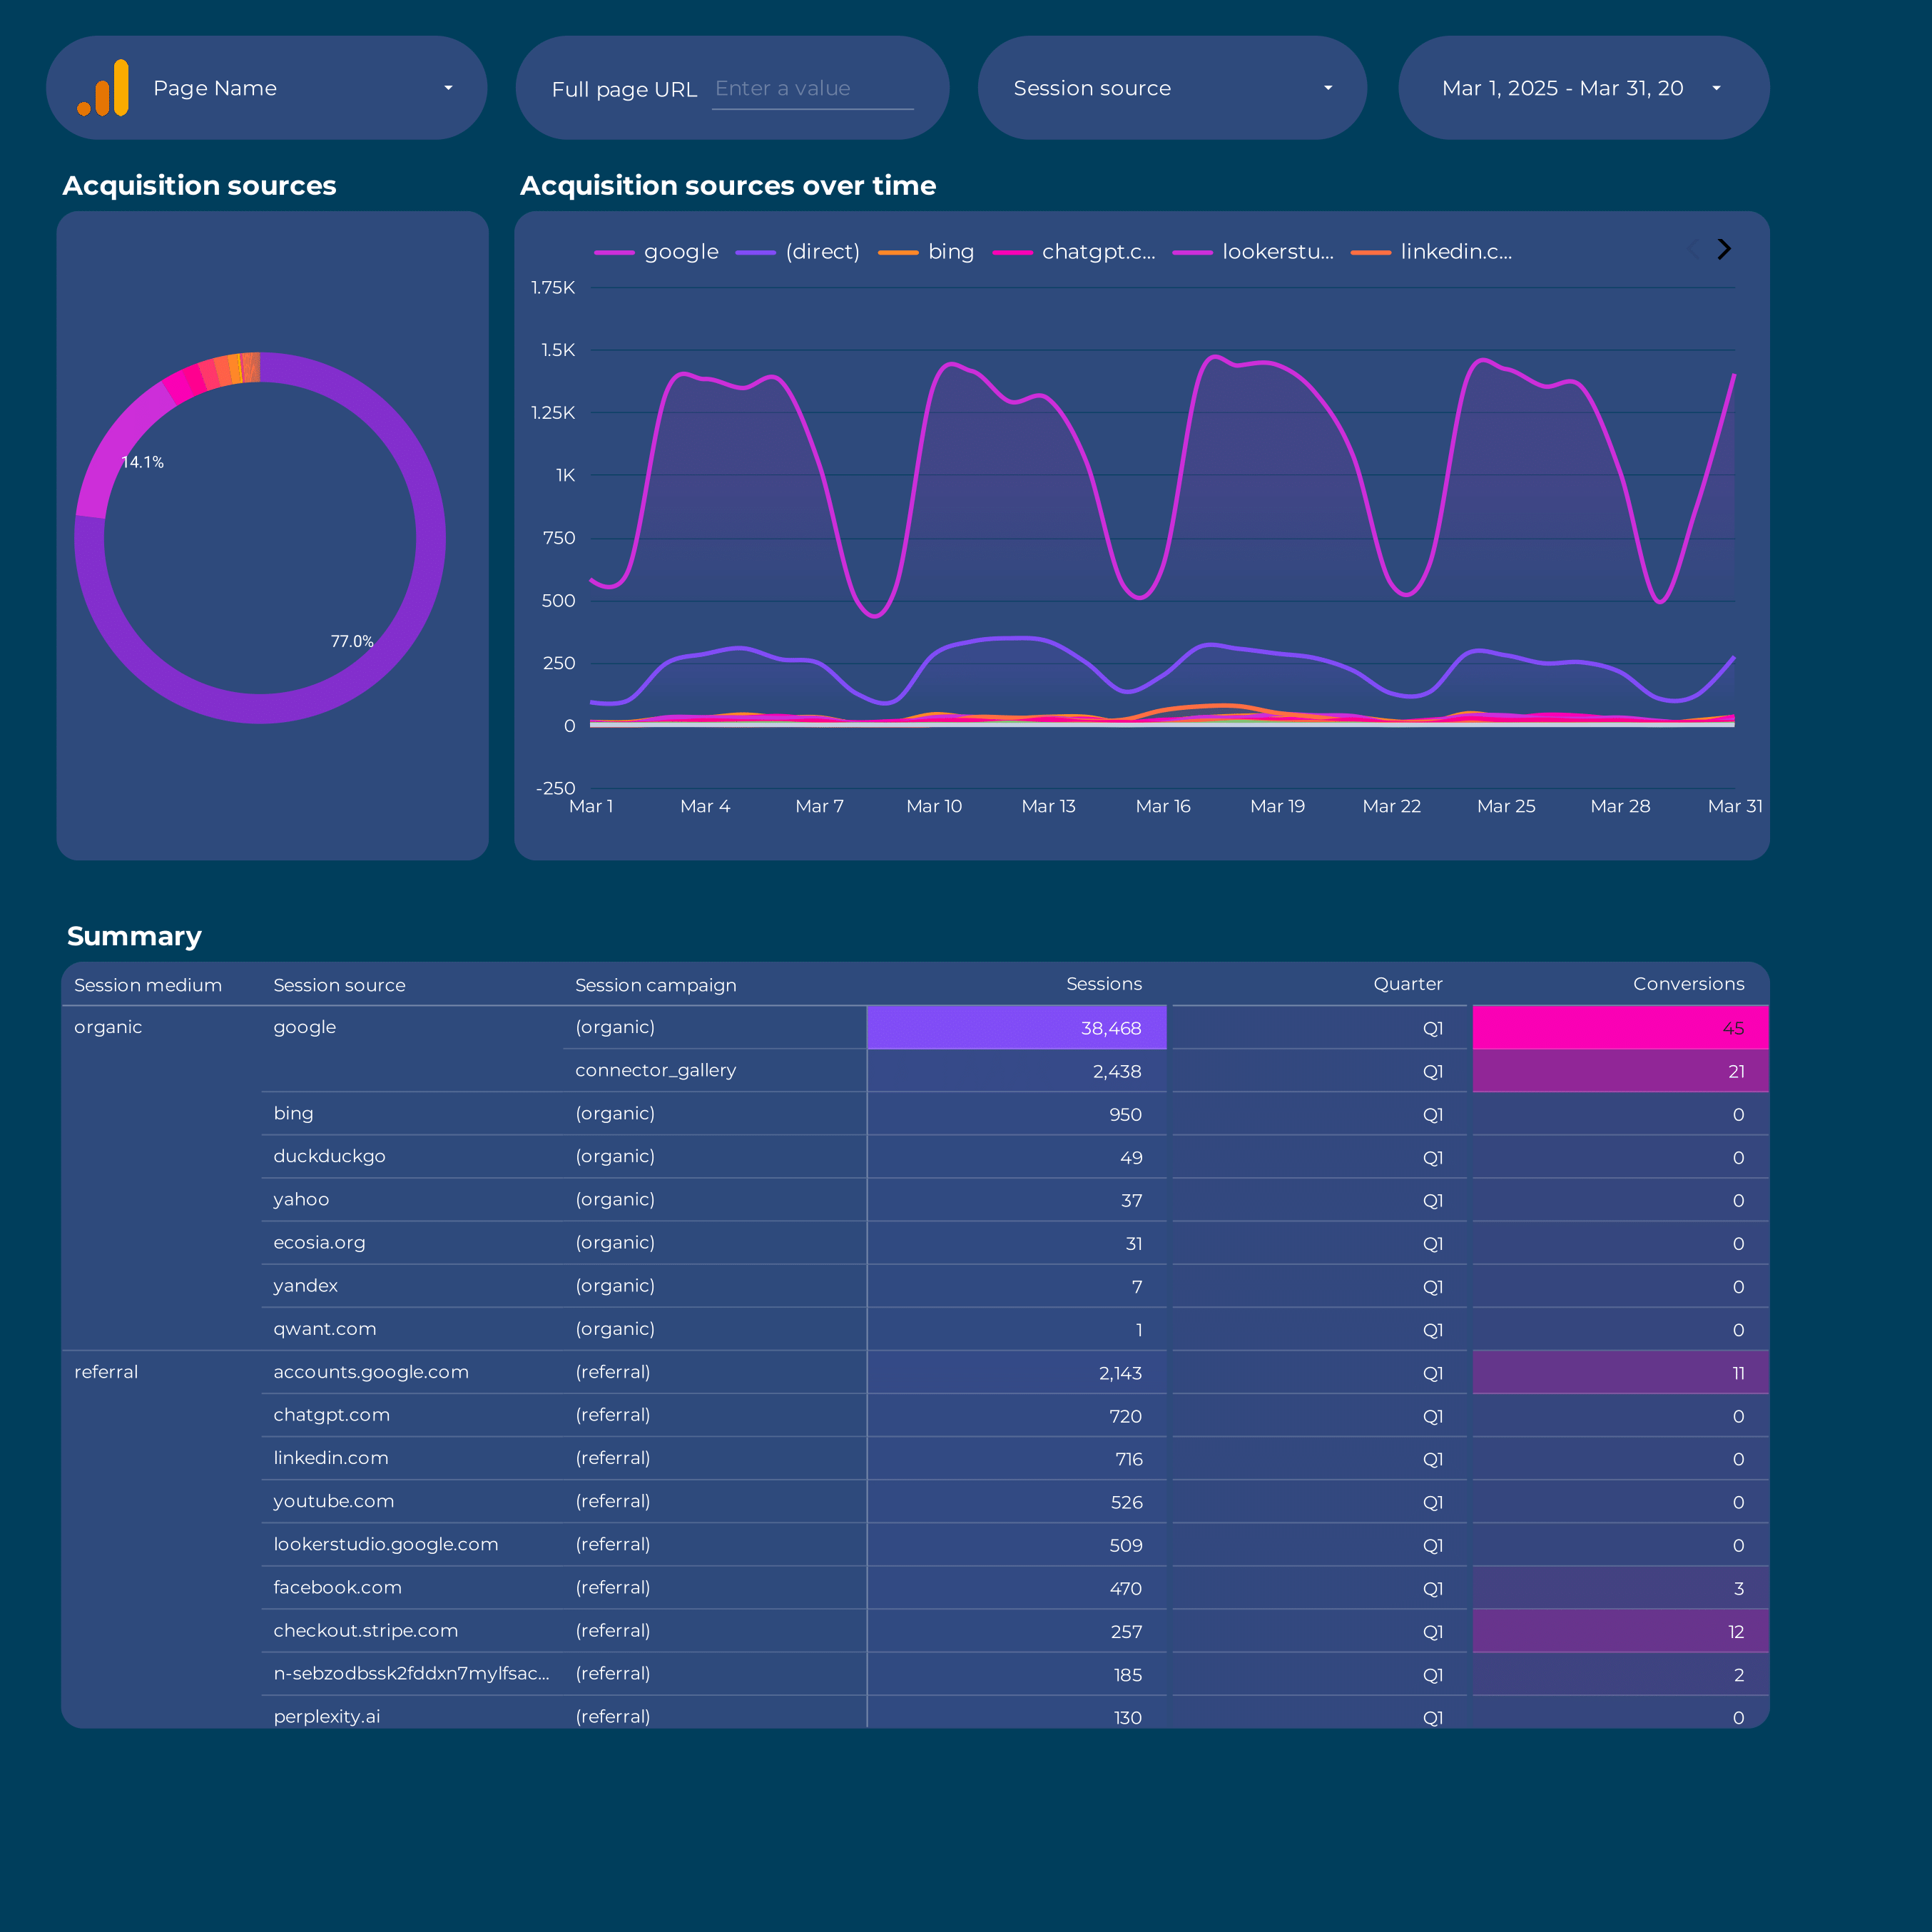
Acquisition Report template for Data Studio by Porter
Acompanhe sessions, new users by source → engagement rate, events/session → conversions by channel, revenue. Segmente por source/medium, campaign, landing page.
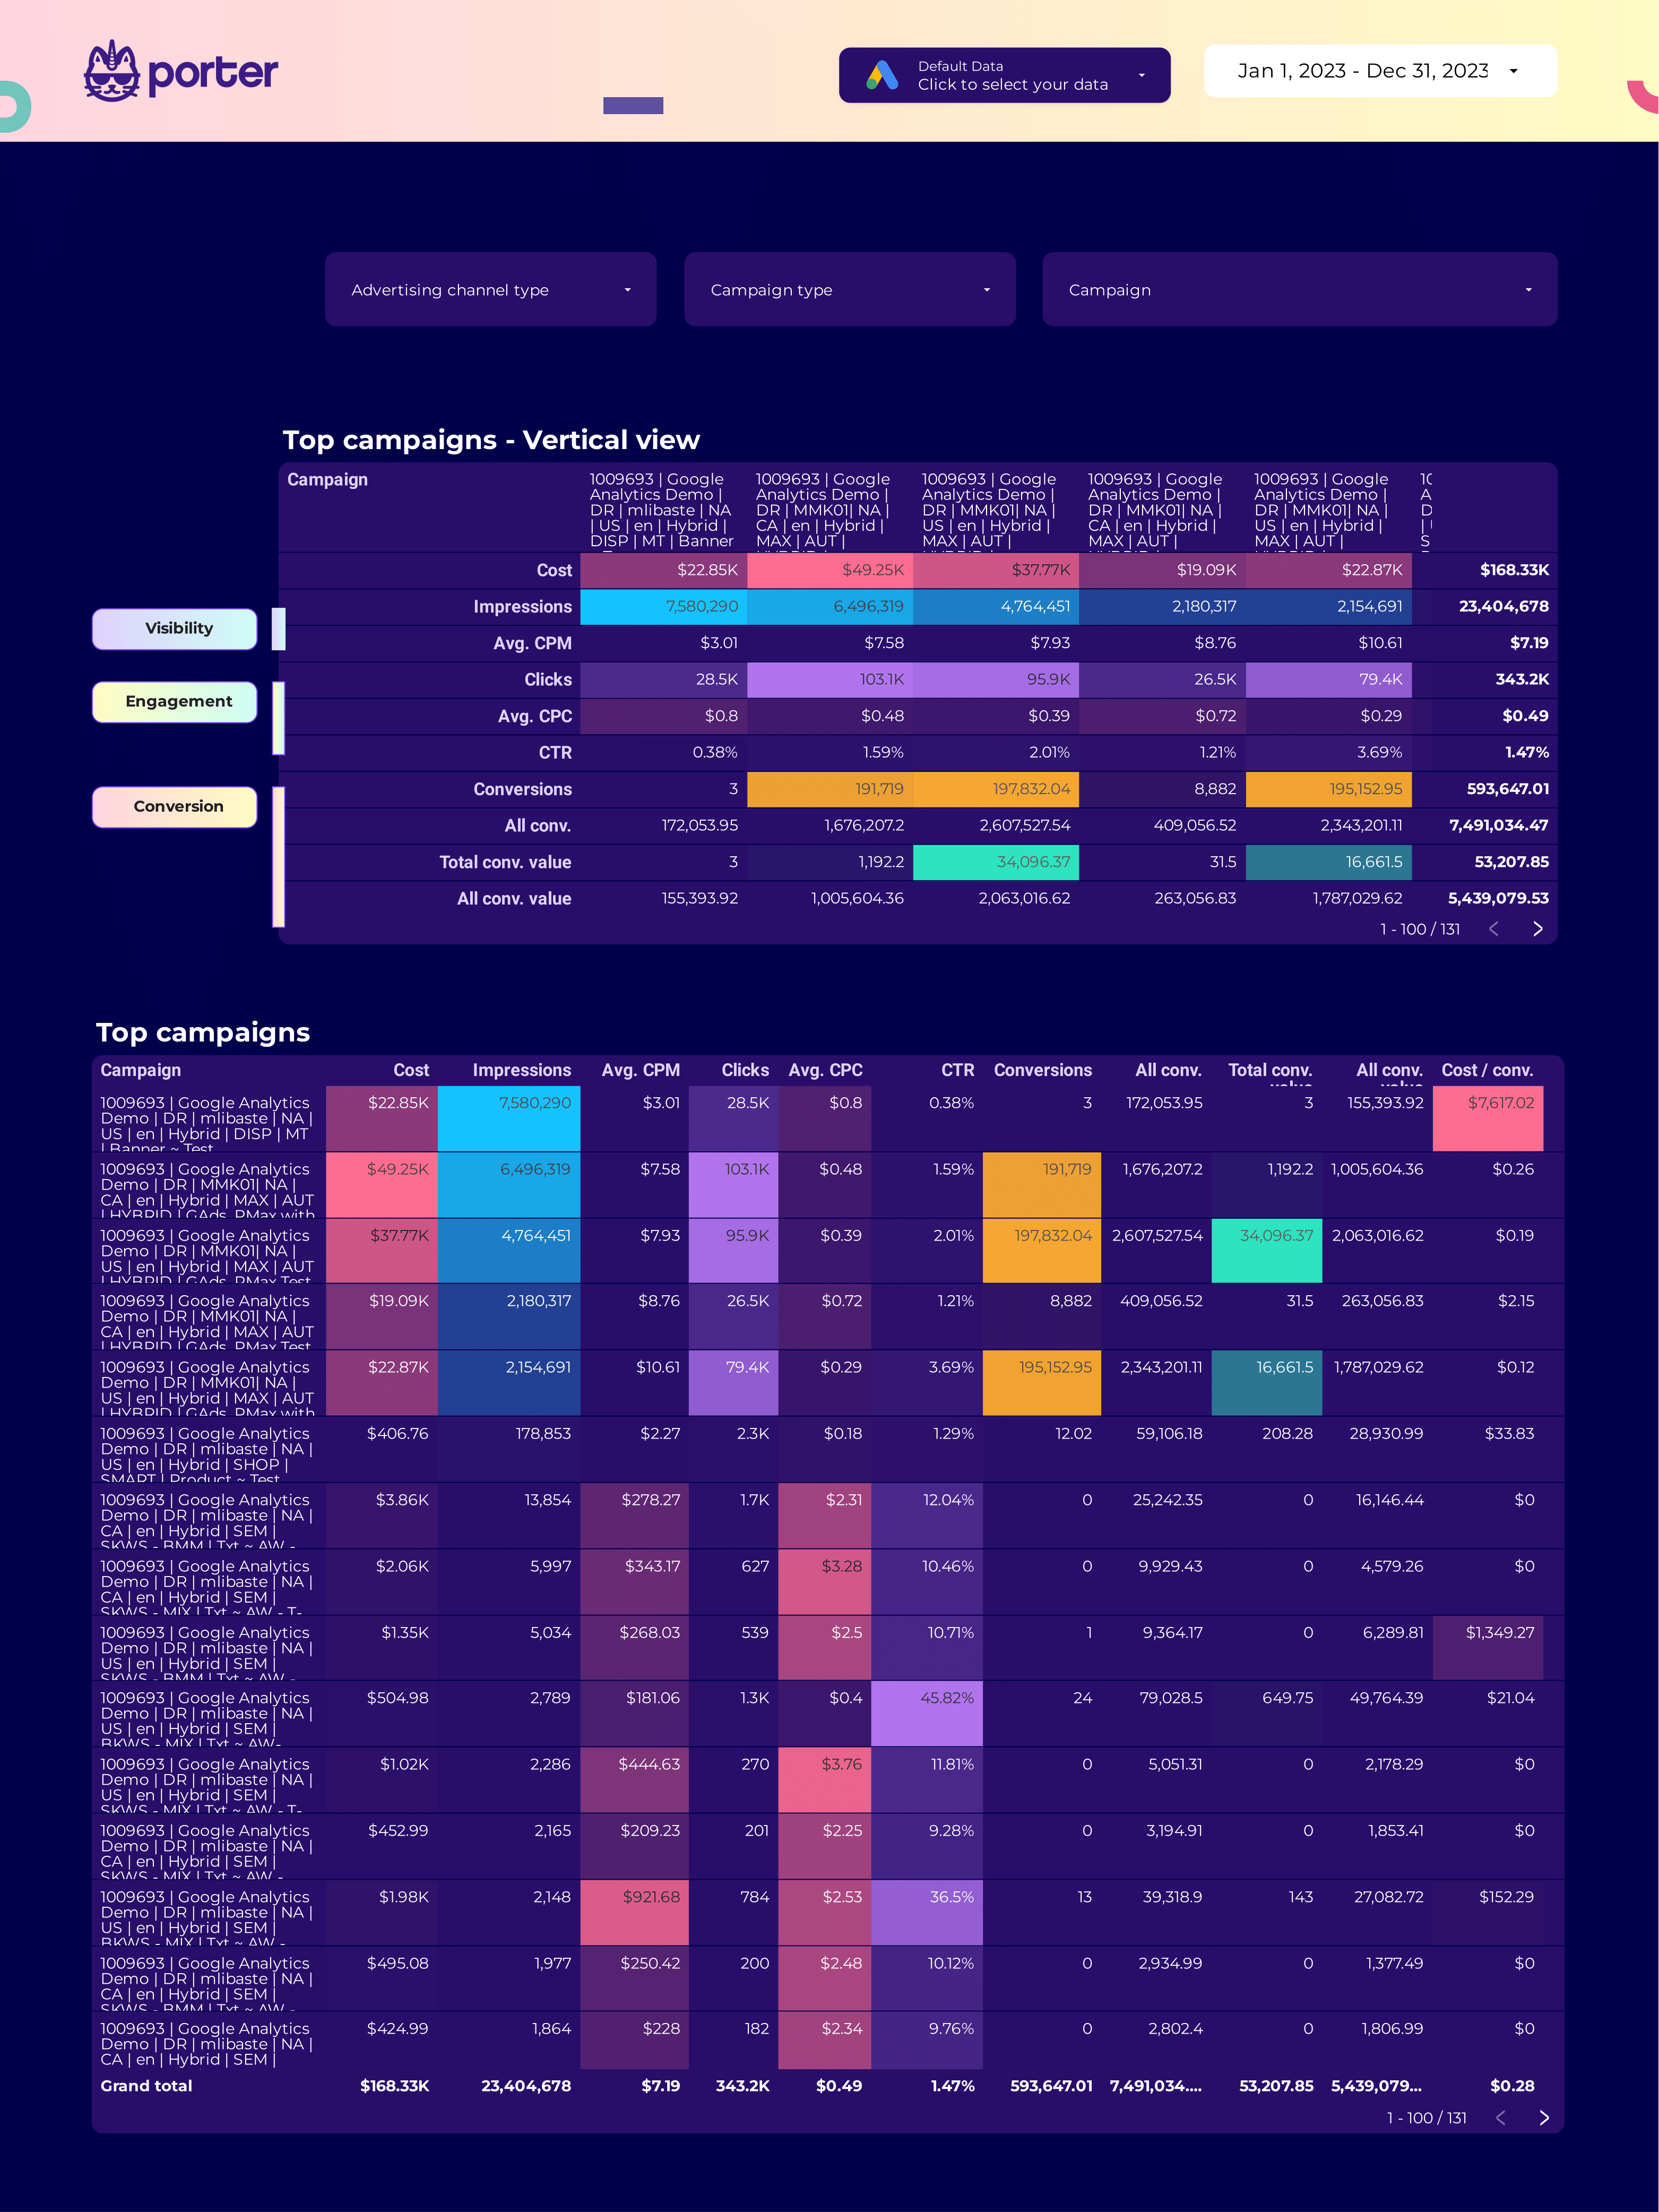
SEM Report template for Data Studio by Porter
Acompanhe search impression share, ad rank → CTR, CPC, quality score → conversions, ROAS, CPA. Segmente por keyword, match type, device.
What is a quarterly report dashboard on Data Studio?
A quarterly report dashboard on Data Studio summarizes your marketing performance over a 3-month period for stakeholder reviews, QBRs, and board presentations. It pulls data from all your channels into a professional quarterly summary.
These free quarterly dashboard templates for Data Studio connect to your data sources and update automatically. Customize any template with your branding, metrics, and filters to create professional quarterly reports in minutes.
Automate your QBRs: Porter Metrics connects your data so quarterly reports build themselves.
Why use this dashboard?
Quarter-over-quarter
Compare Q1 vs. Q2, this year vs. last year automatically.
Executive summary
High-level KPIs for stakeholders: revenue, ROI, growth, pipeline.
Automated delivery
Schedule quarterly reports to arrive at the end of each quarter.
PDF export
Export professional quarterly reports as PDFs for board meetings.
How to build this dashboard

Connect Meta Ads and Google Ads to Data Studio
Porter Metrics
How To Design Marketing Reports on Data Studio
Porter MetricsKey metrics
Revenue
- Total revenue — quarterly total
- QoQ growth — quarter comparison
- YoY growth — annual comparison
- Forecast — next quarter
Marketing
- Total spend — investment
- ROAS — overall return
- Leads generated — pipeline input
- Conversions — goal completions
Channels
- Top channel — best performer
- Channel mix — attribution
- Organic growth — SEO progress
- Paid efficiency — ad performance
Goals
- Targets met — completion rate
- KPI trends — direction
- Wins — successes
- Action items — next steps
Quarterly Dashboard Best Practices
Follow these proven practices to get the most from your quarterly dashboard on Data Studio:
- Focus on actionable metrics — Acompanhe leading indicators you can influence (like content published, ad spend, engagement rate) alongside lagging indicators (revenue, conversions) that show results.
- Segmente your data — Break down quarterly metrics by channel, campaign, audience, or time period. Aggregated data hides insights; segmented data reveals opportunities.
- Set up automated reporting — Schedule weekly or monthly reports to stakeholders. Consistent reporting builds trust and keeps teams aligned on quarterly goals.
- Compare time periods — Use month-over-month and year-over-year comparisons to account for seasonality and measure real growth in your quarterly performance.
- Keep it visual — Use charts for trends, scorecards for KPIs, and tables for detailed breakdowns. The right visualization makes complex quarterly data easy to understand.
Build your quarterly report today
Connect your data and generate professional quarterly reviews automatically. Get started for free →