

Best Free Data Analytics Dashboard Templates for Data Studio (2026)
Free data analytics dashboard templates for Google Data Studio. Visualize marketing data, track KPIs, and build custom analytics reports. Built for analysts and marketing teams.
Conecta tus datos gratis →Última actualización: Abril 2026
Browse 29 Data Analytics Report Templates for Data Studio
Choose from our library of free, white-label data analytics templates. Cada plantilla mide el embudo completo: visibilidad (impresiones, alcance), engagement (CTR, interacciones) y conversión (leads, ingresos). Organizadas siguiendo el SUMAS framework con segmentación por canal, campaña, audiencia y período.
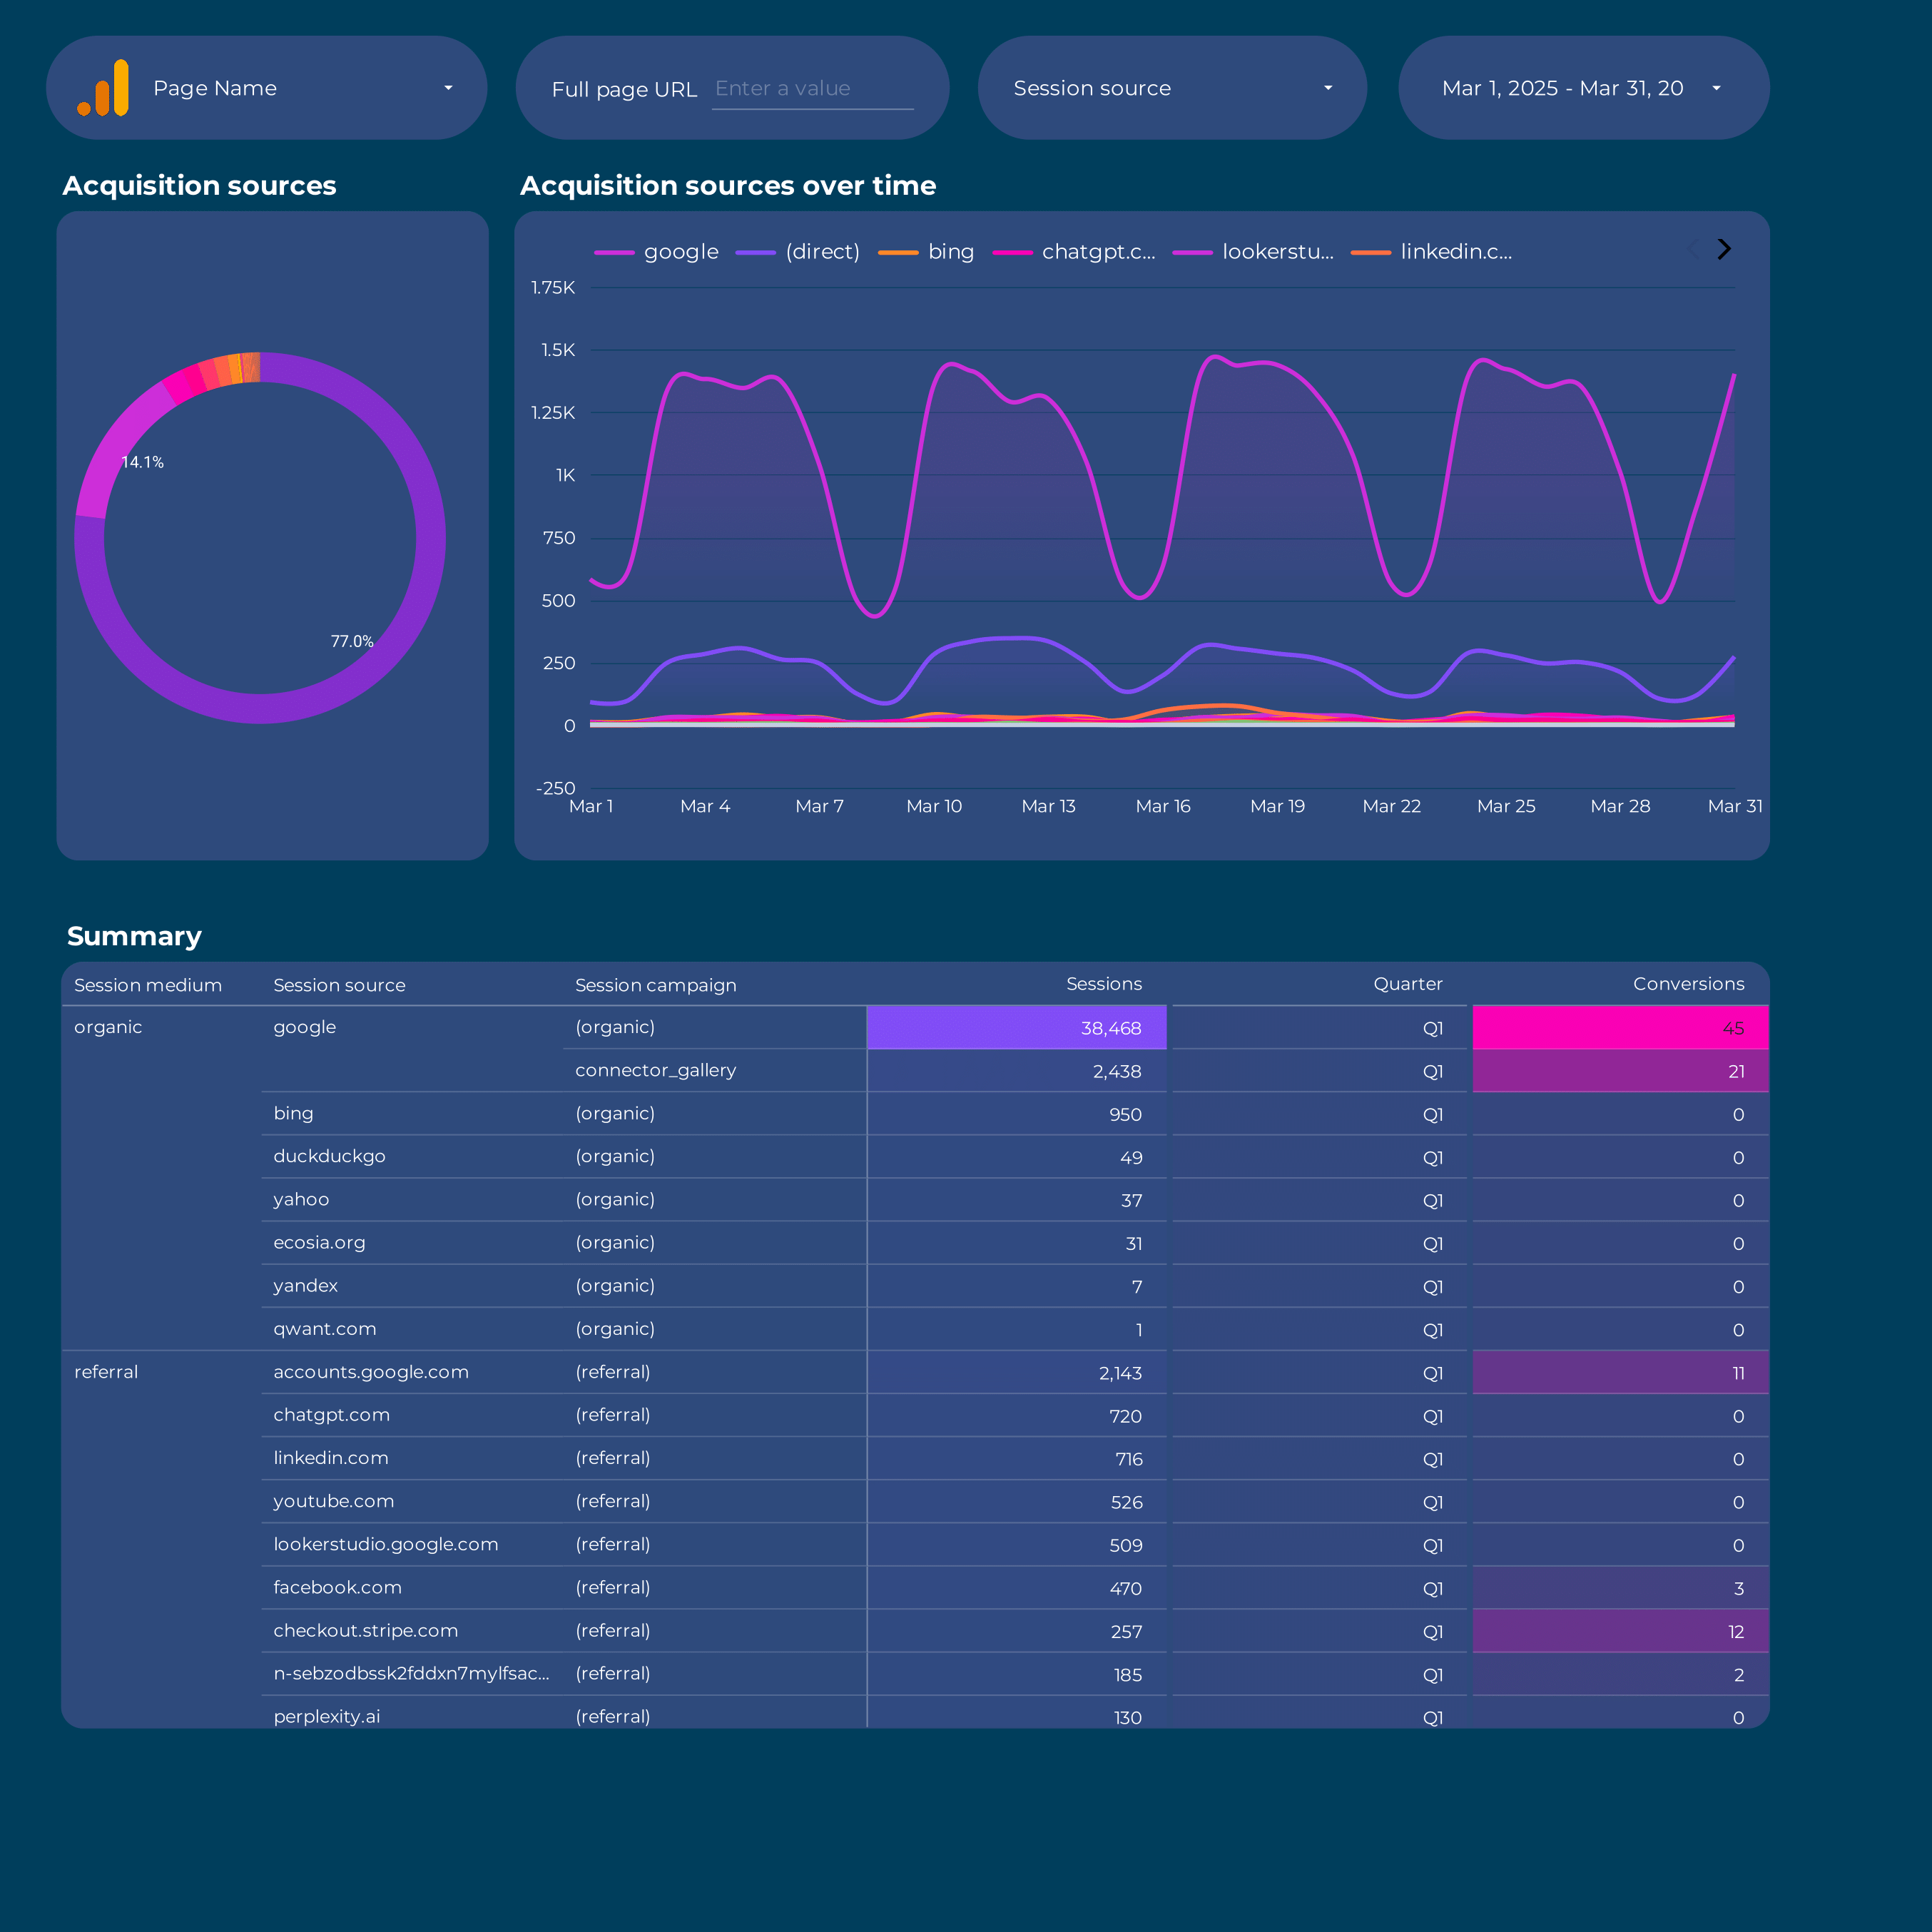
Google Analytics 4 acquisition Report template for Data Studio by Porter
Mide sessions, new users by source → engagement rate, events/session → conversions by channel, revenue. Segmenta por source/medium, campaign, landing page.
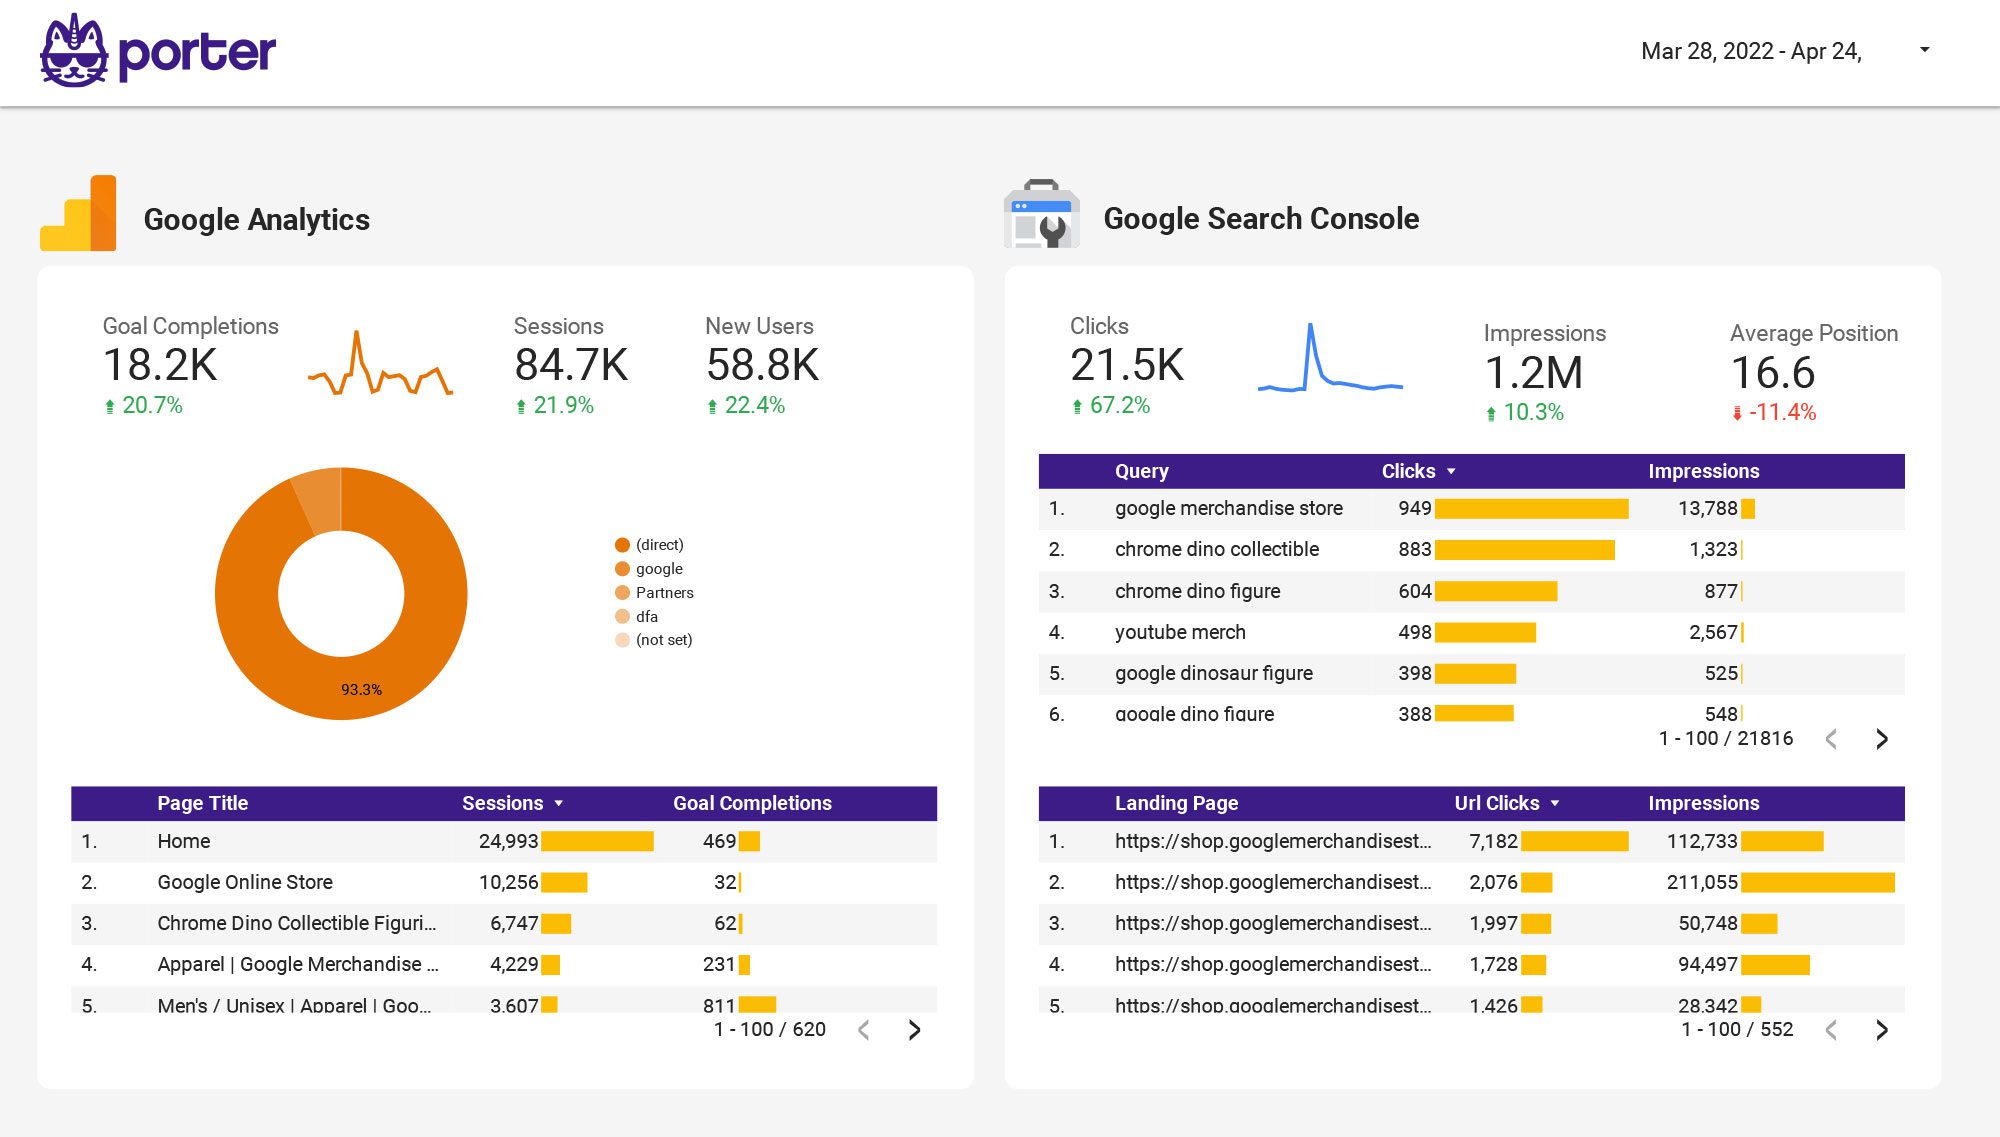
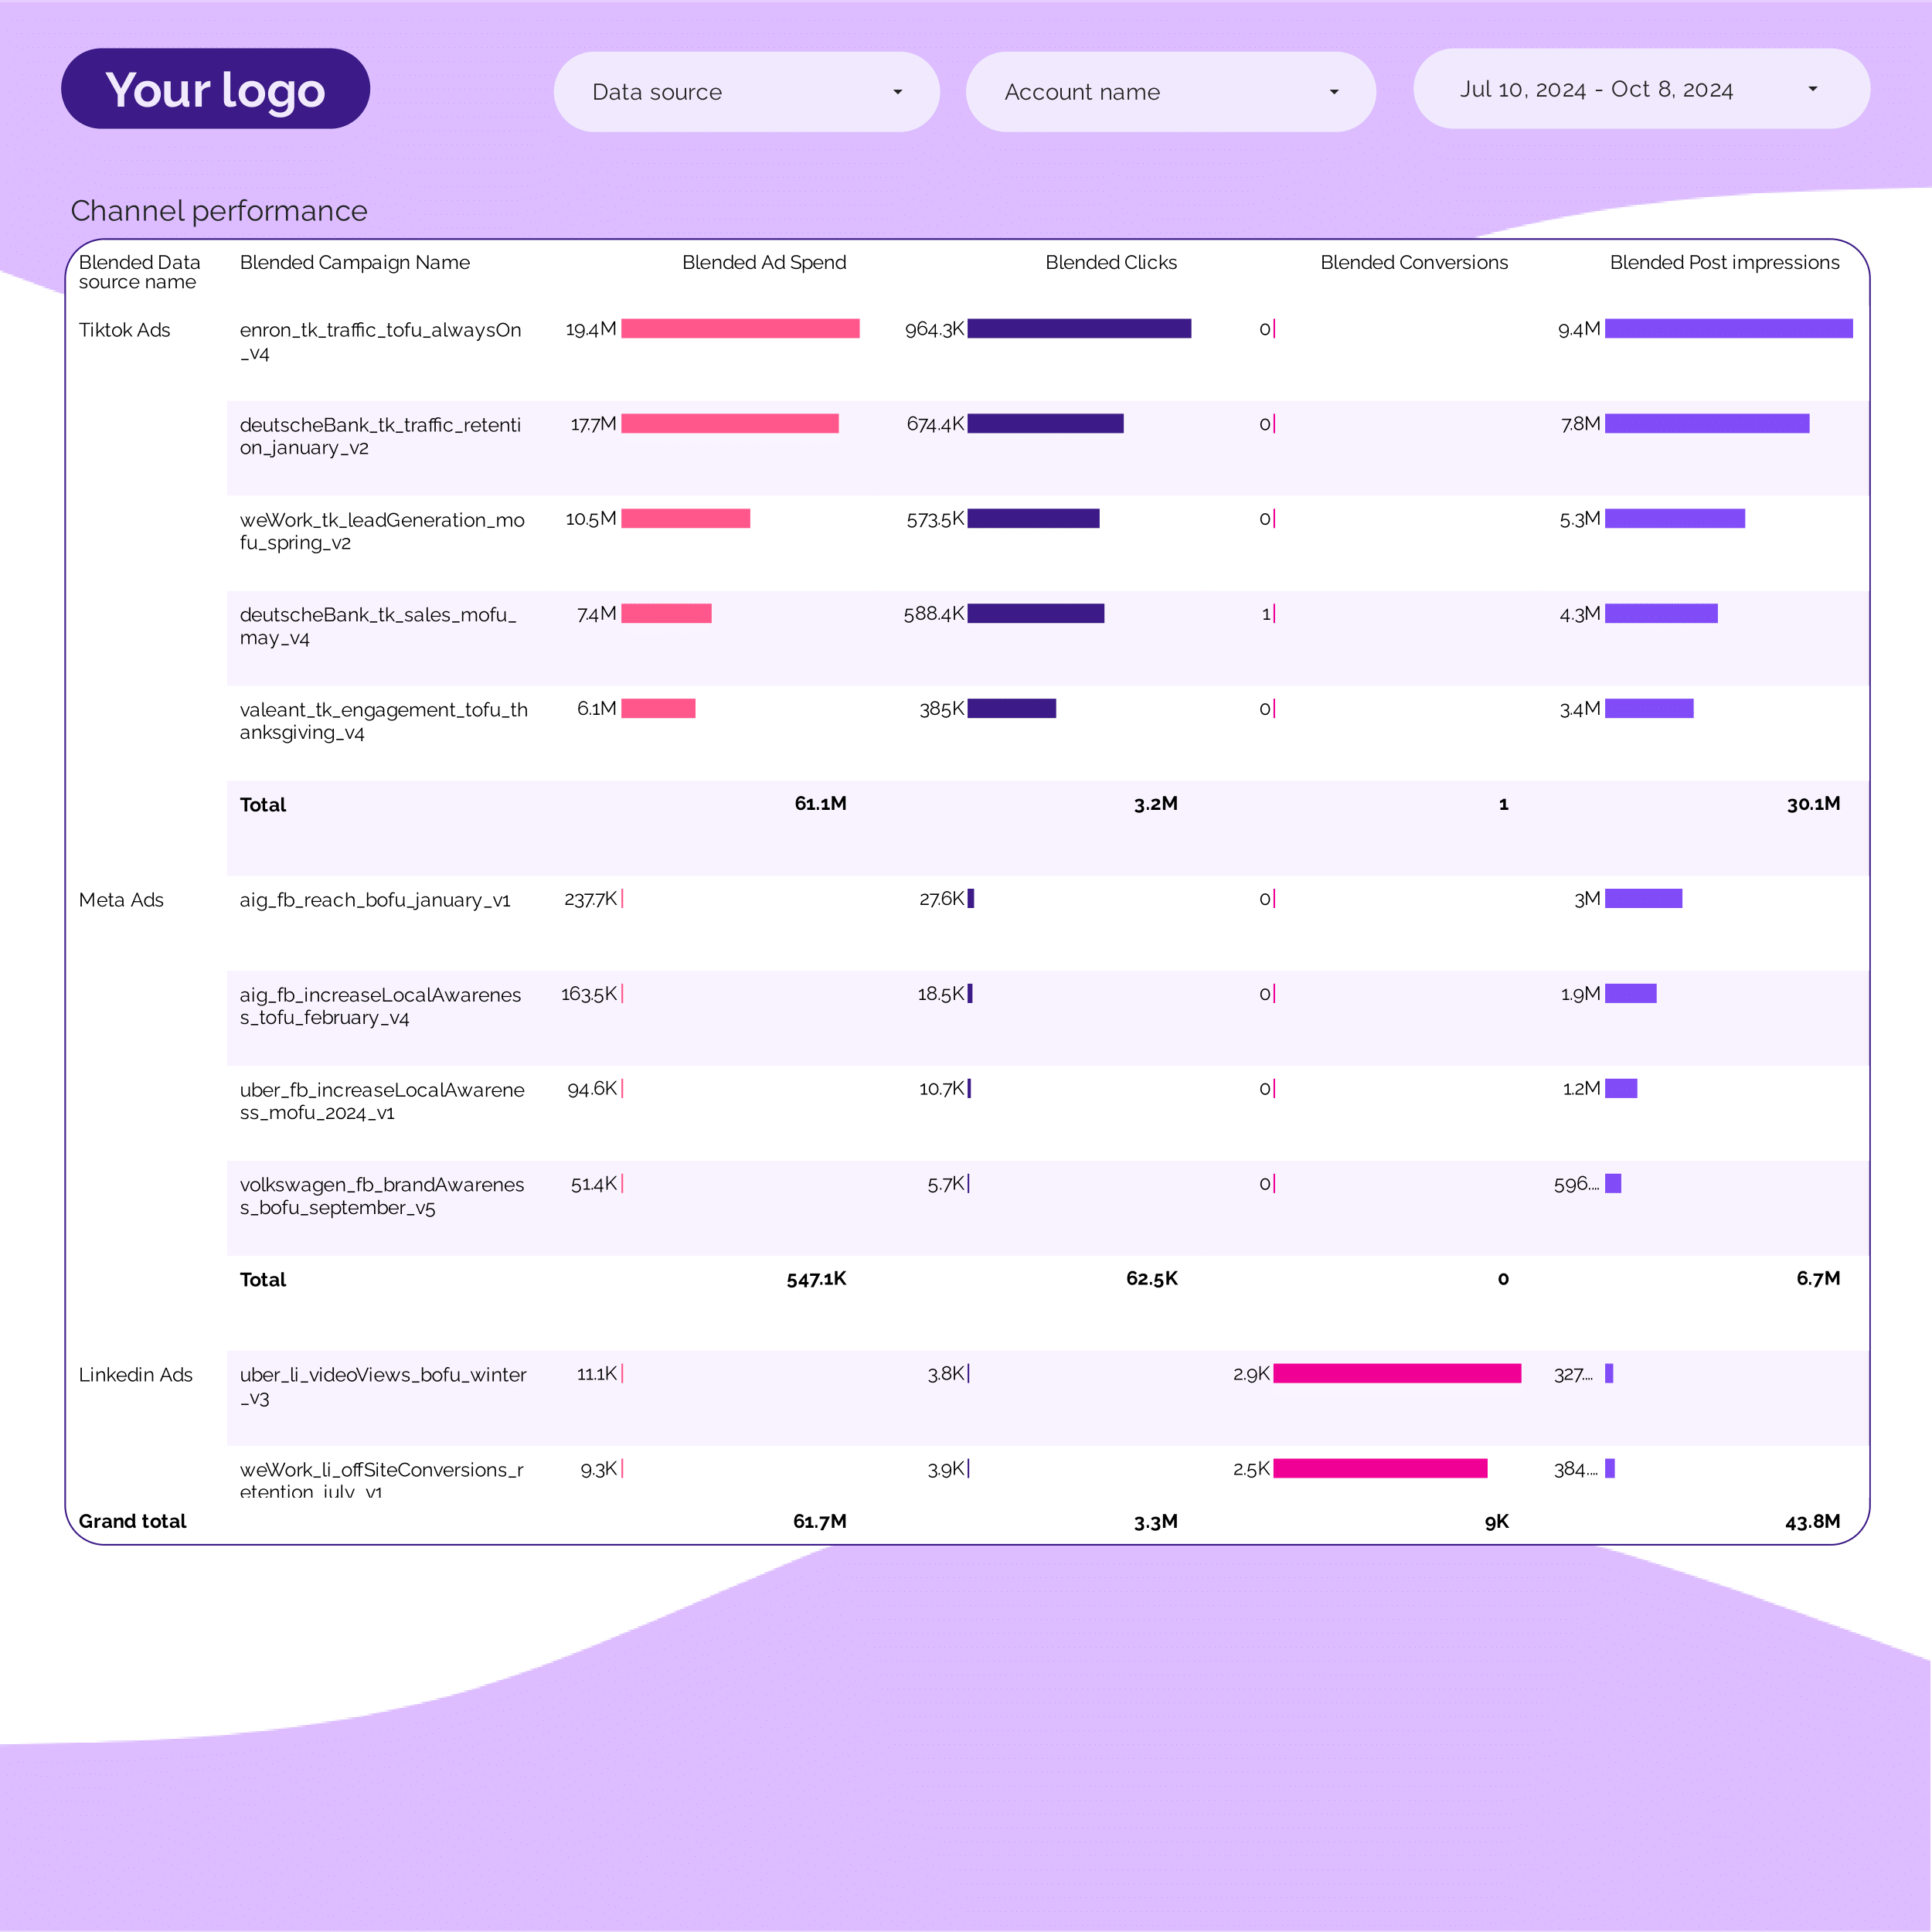
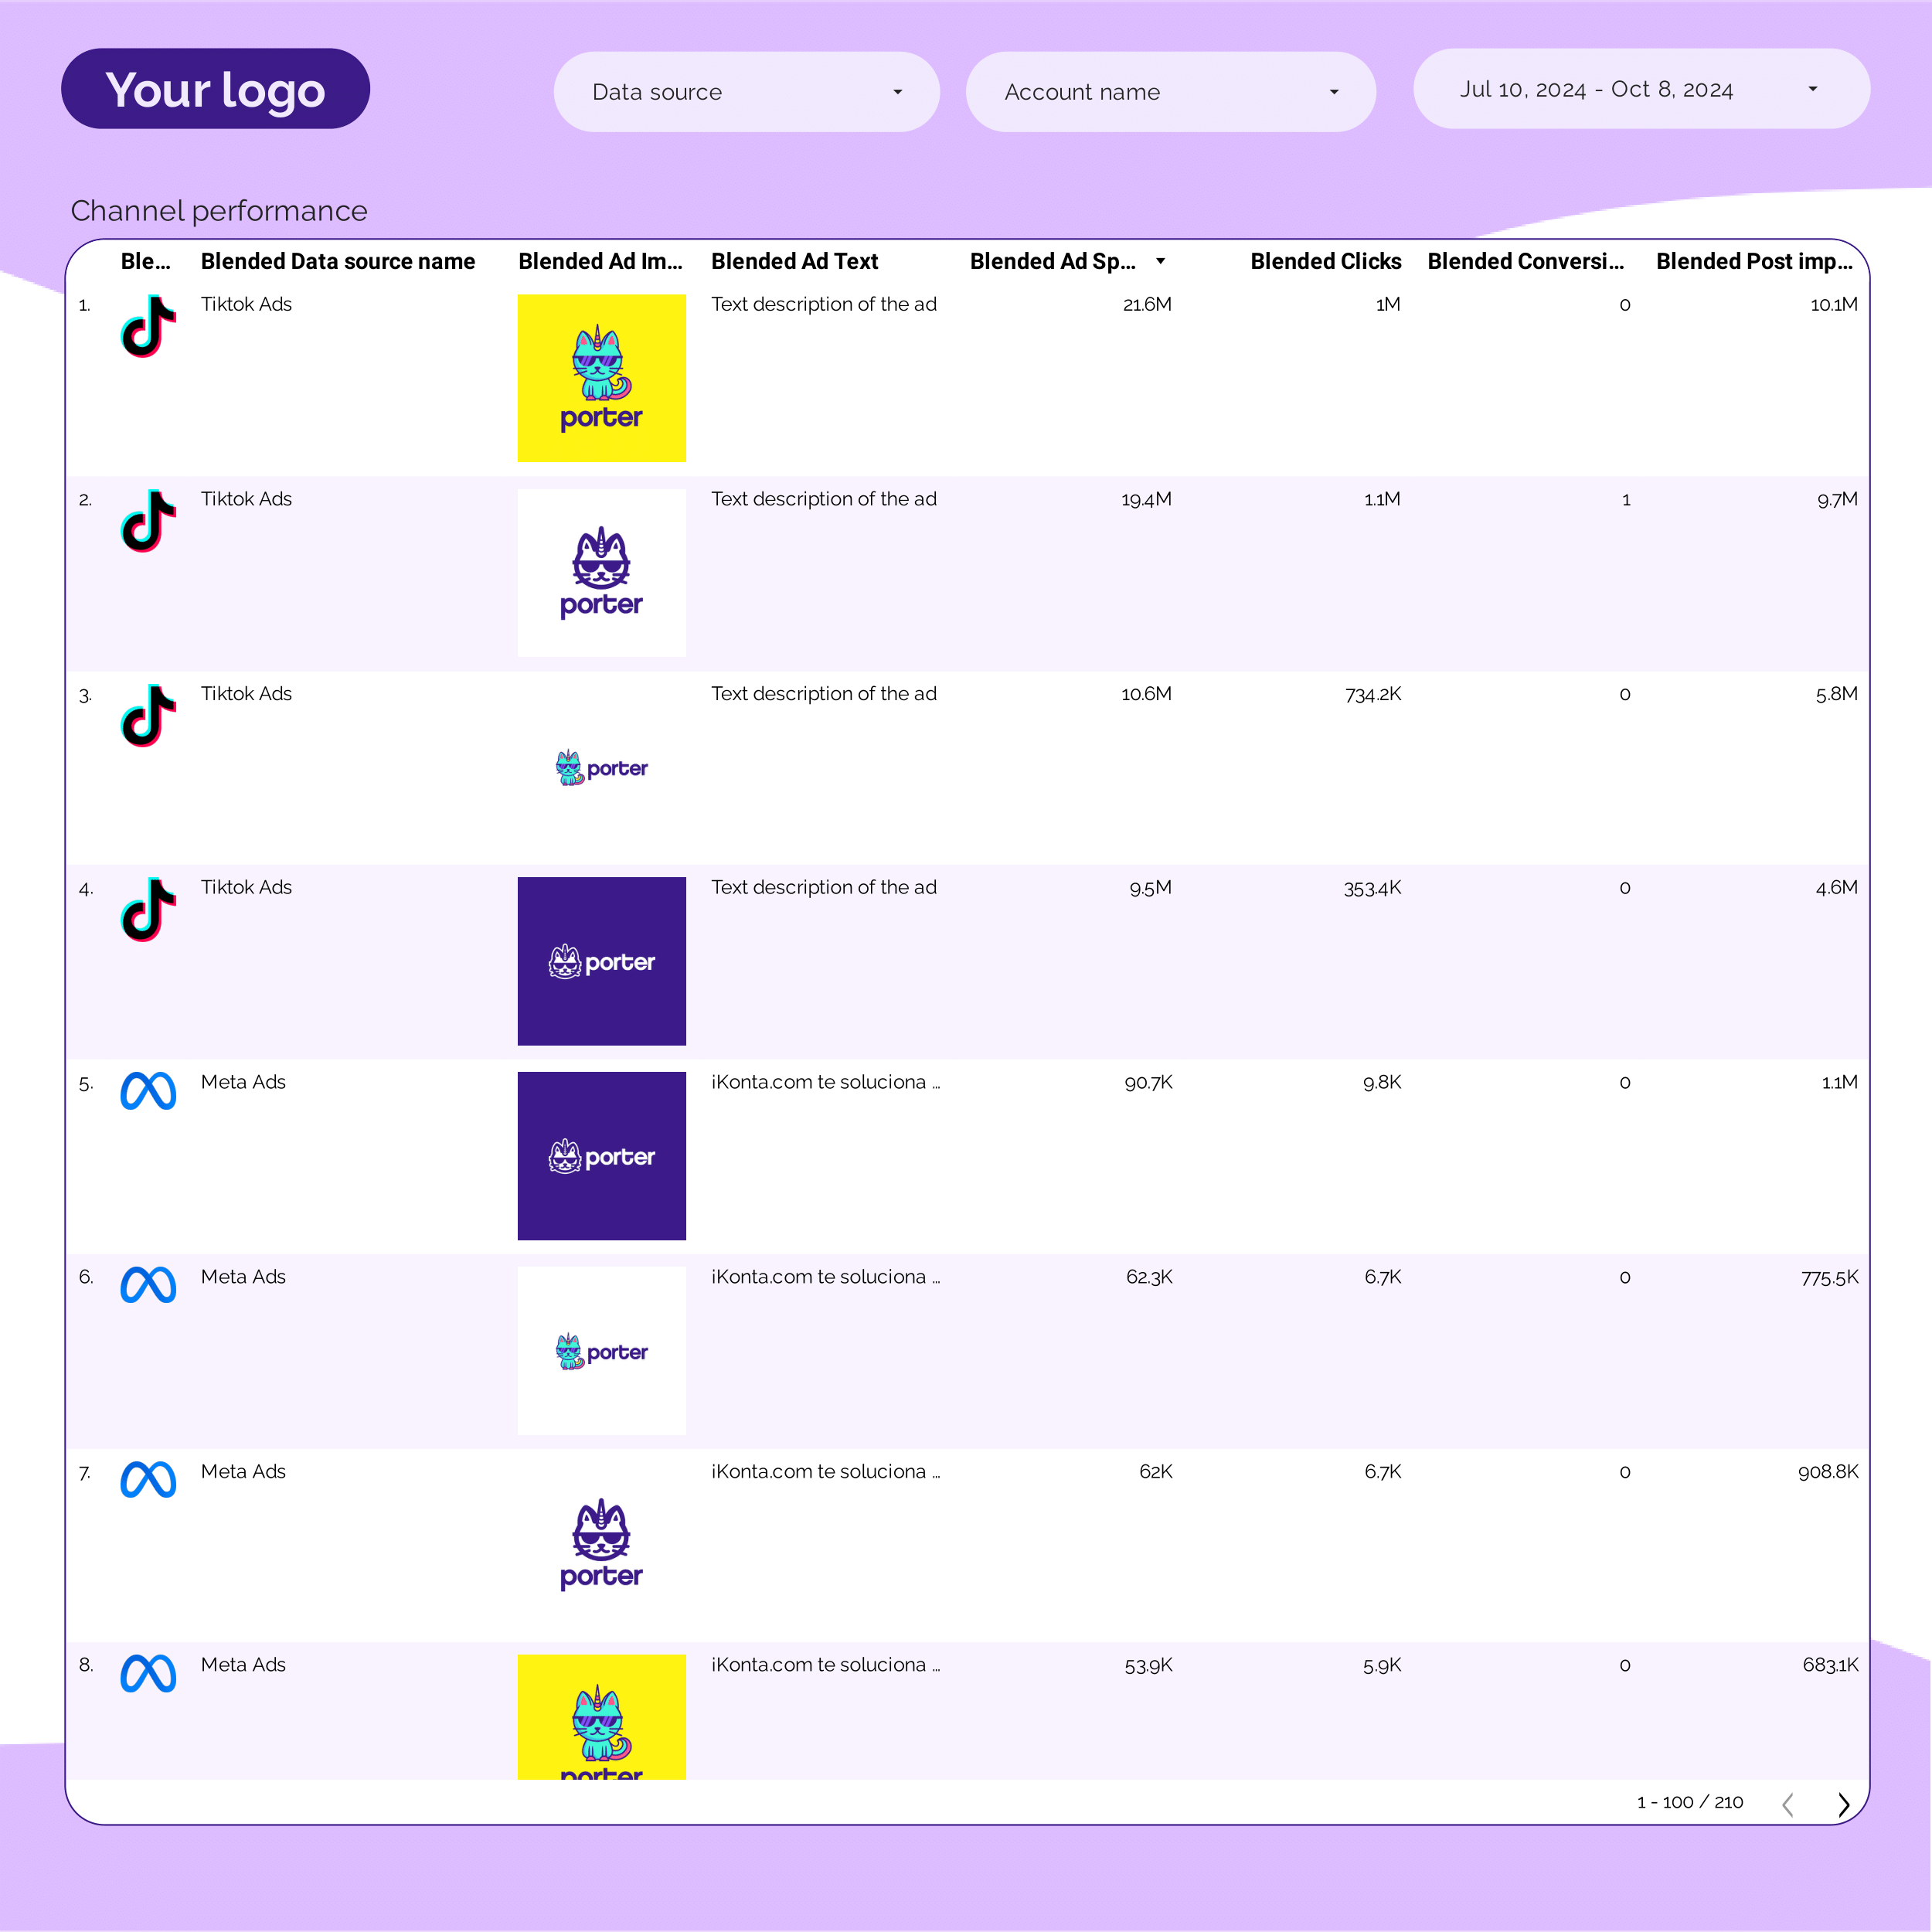
Multi-channel Marketing performance Report template for Data Studio by Porter
Mide impressions across channels → CTR by channel, engagement rate → cross-channel conversions, ROI. Segmenta por channel, campaign, date.
Google Analytics 4 Attribution Report template for Data Studio by Porter
Mide touchpoints, assisted interactions → path length, time to conversion → attributed conversions by model. Segmenta por channel, model type.
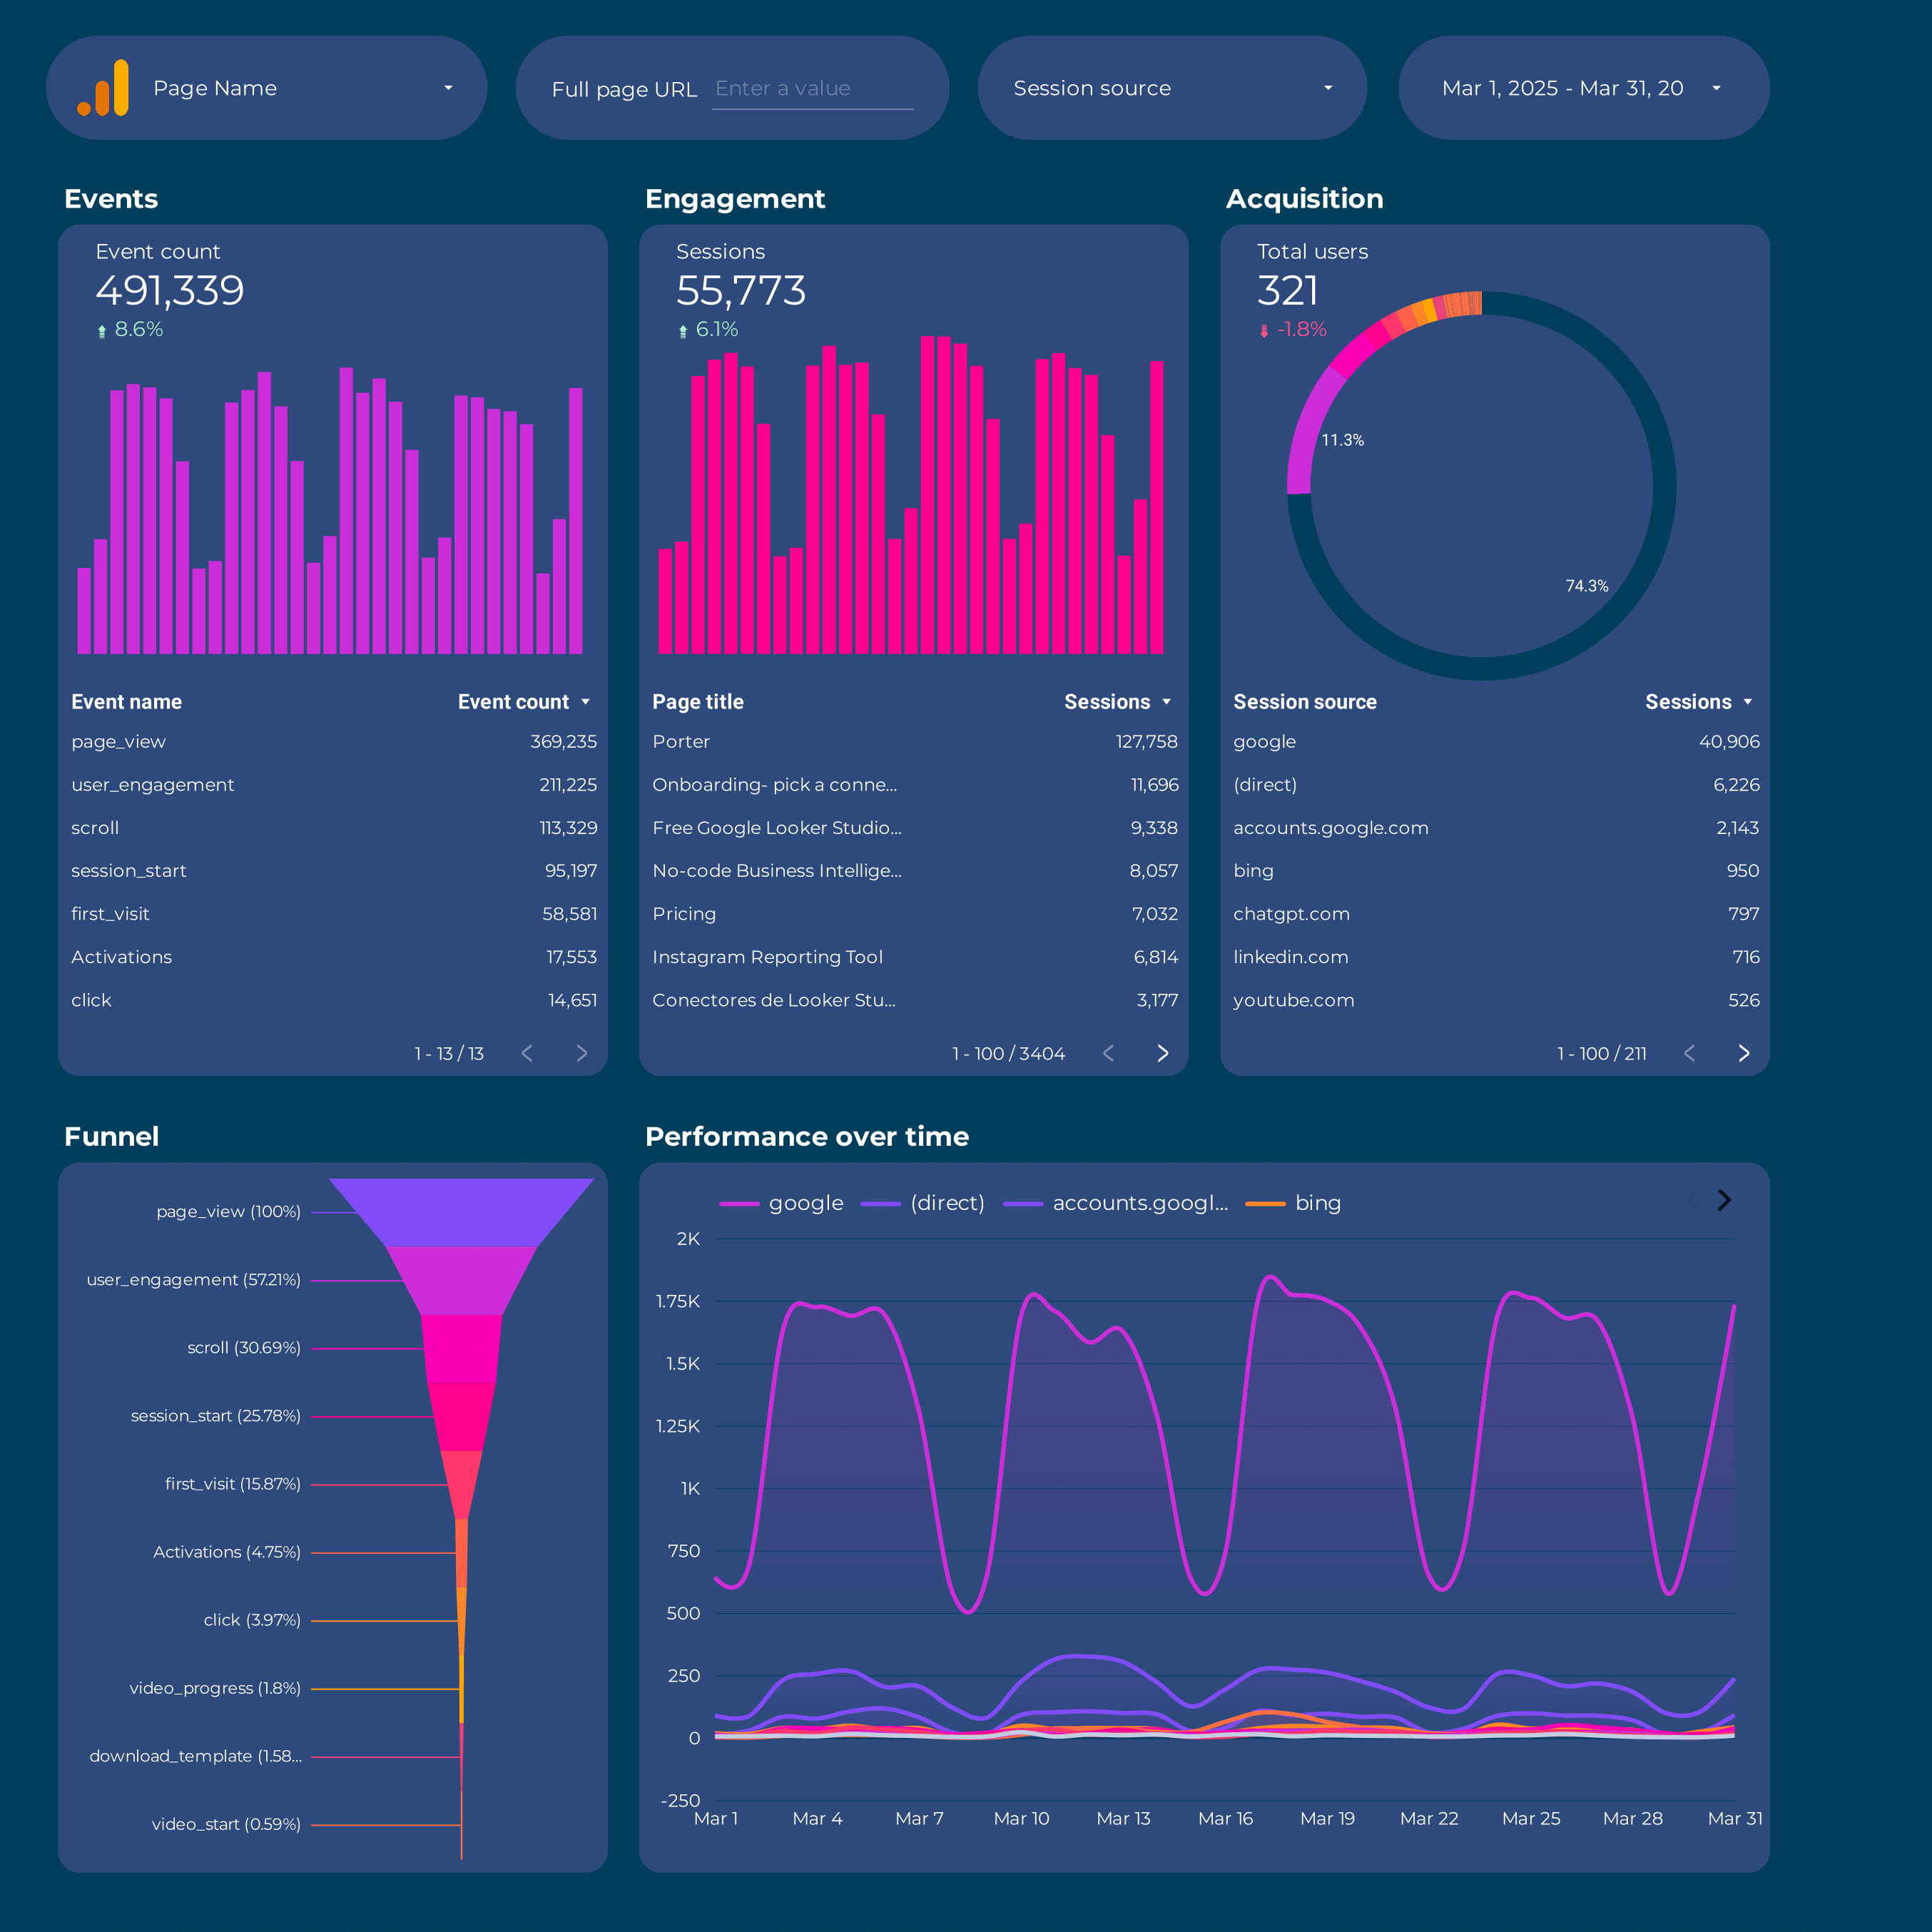
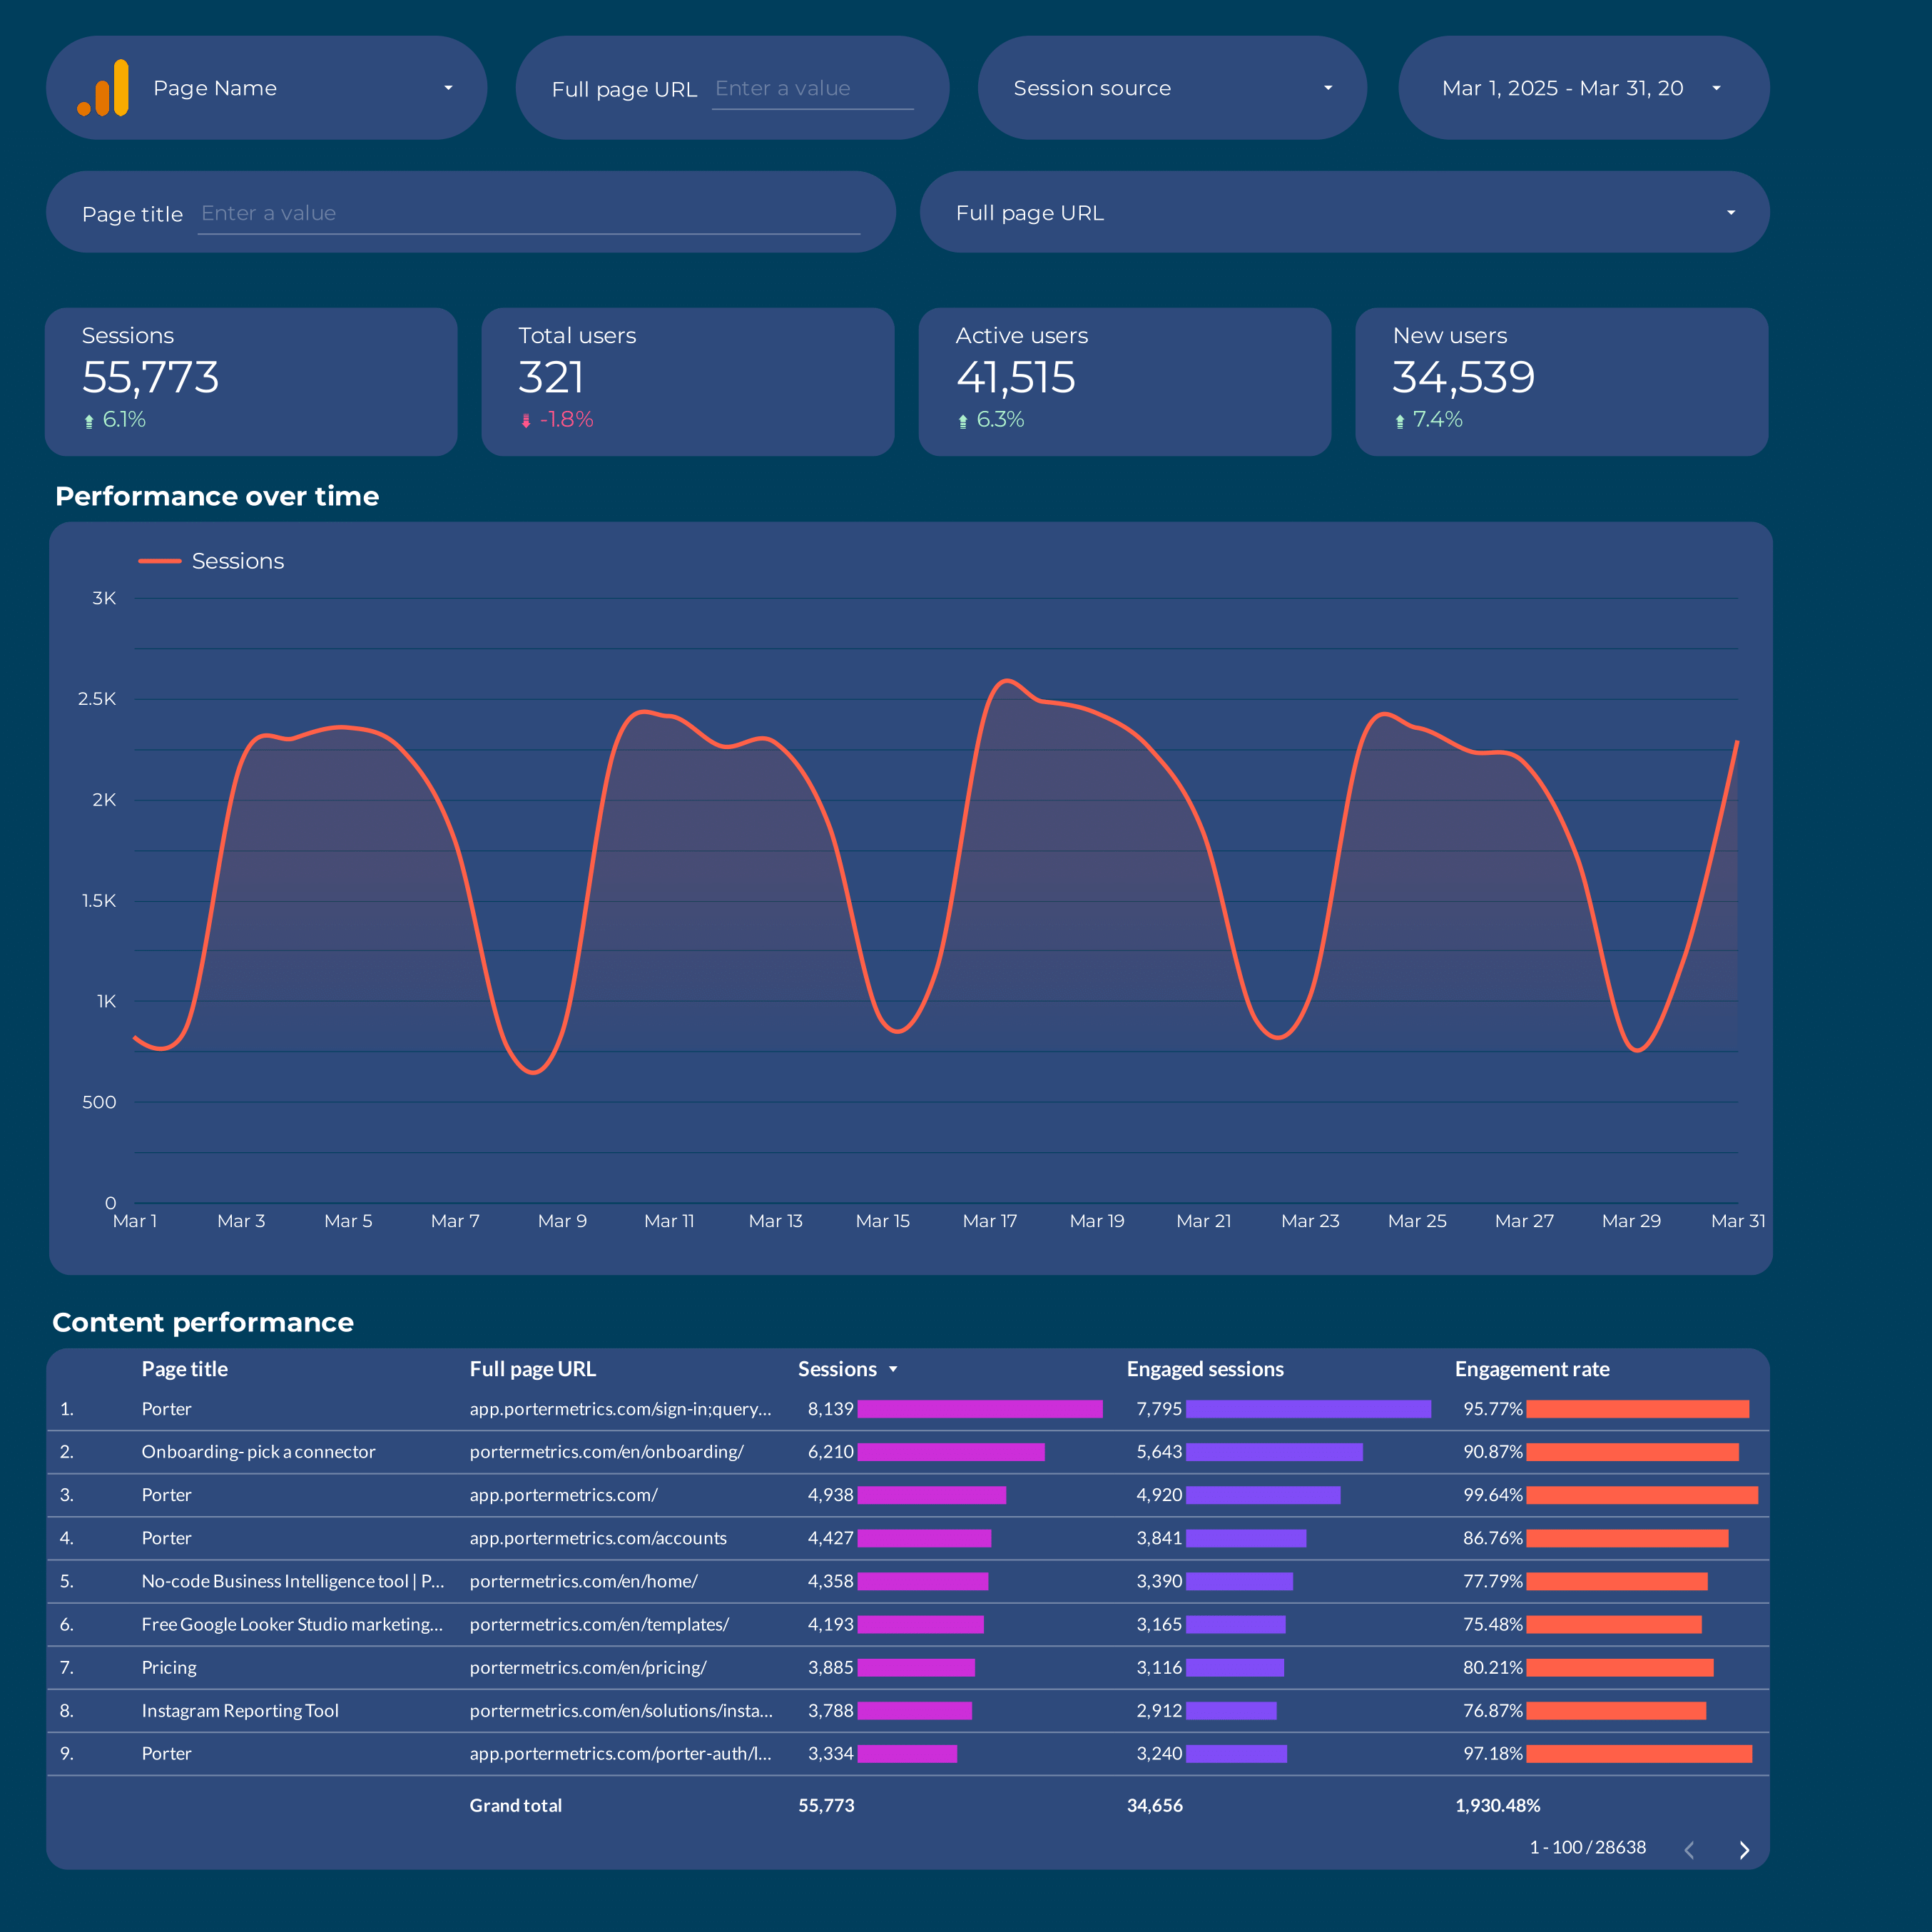
Google Analytics 4 Report template for Data Studio by Porter
Mide sessions, new users by source → engagement rate, events/session → conversions by channel, revenue. Segmenta por source/medium, campaign, landing page.
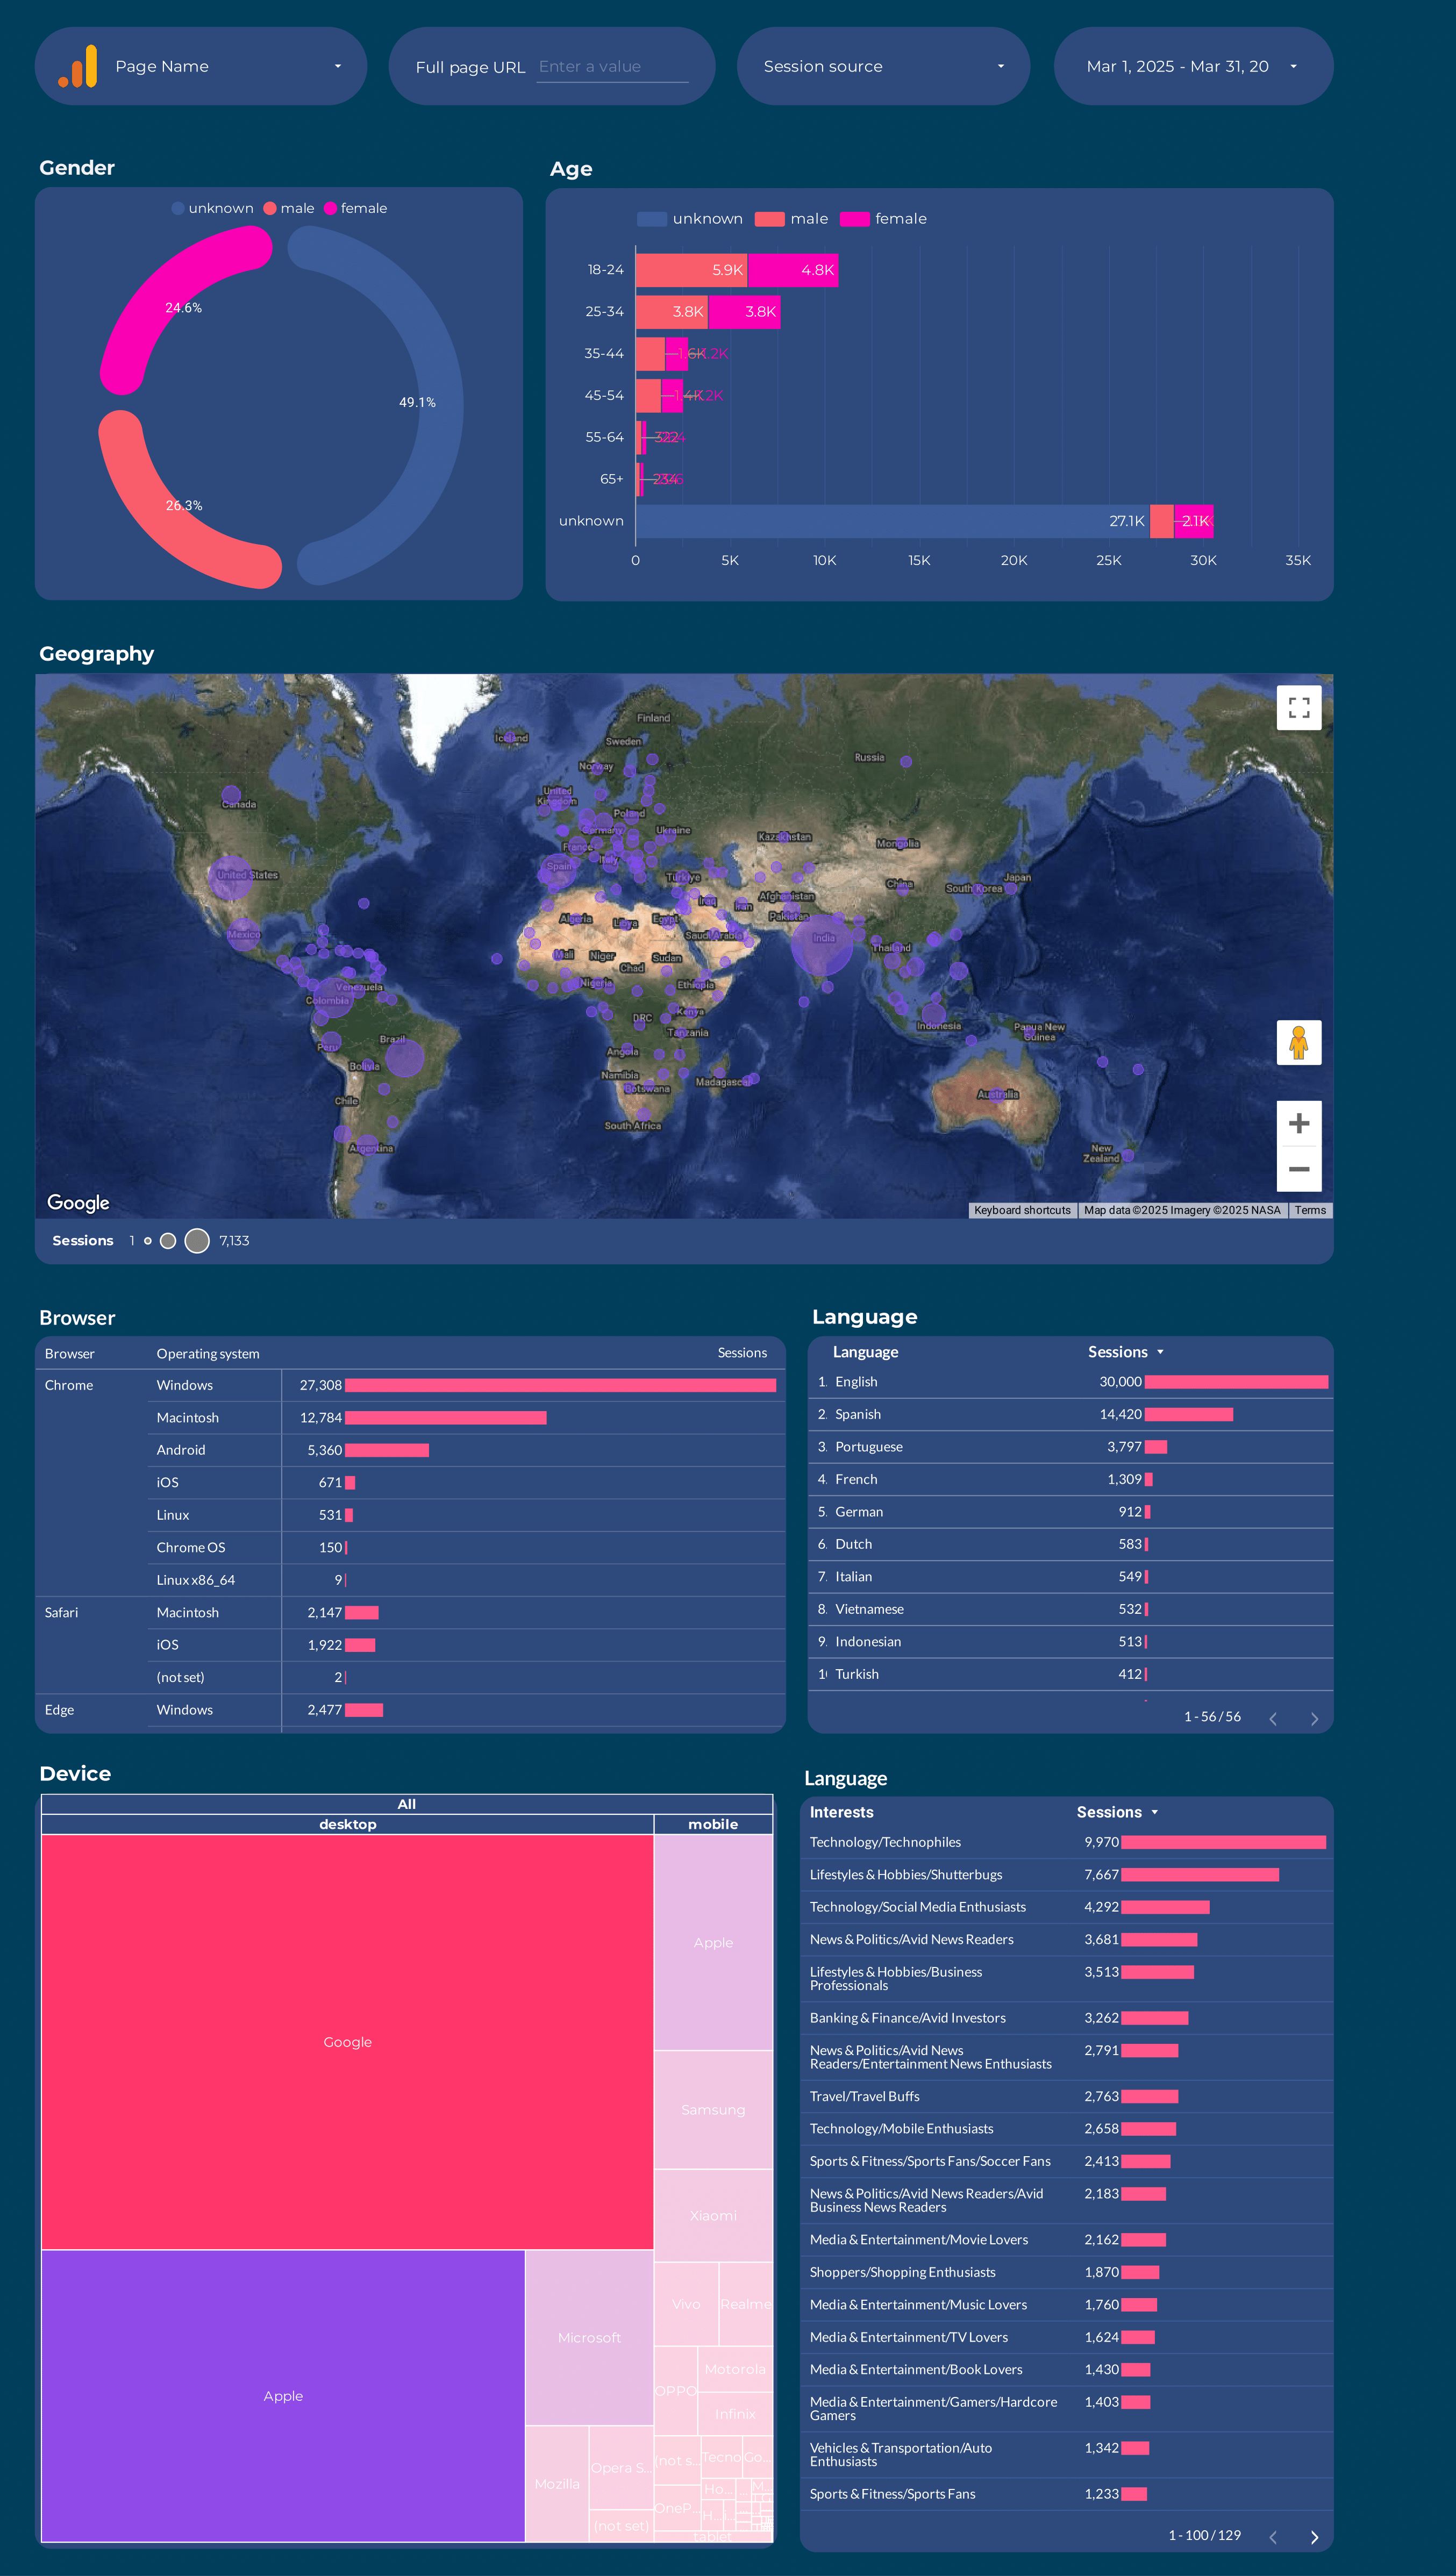
Google Analytics 4 Audience Report template for Data Studio by Porter
Mide users, new vs returning → session duration, pages/session → conversion rate by segment. Segmenta por age, gender, interests, geography.
Content marketing Report template for Data Studio by Porter
Mide page views, organic impressions → time on page, scroll depth, shares → content conversions, lead captures. Segmenta por content type, topic, channel.

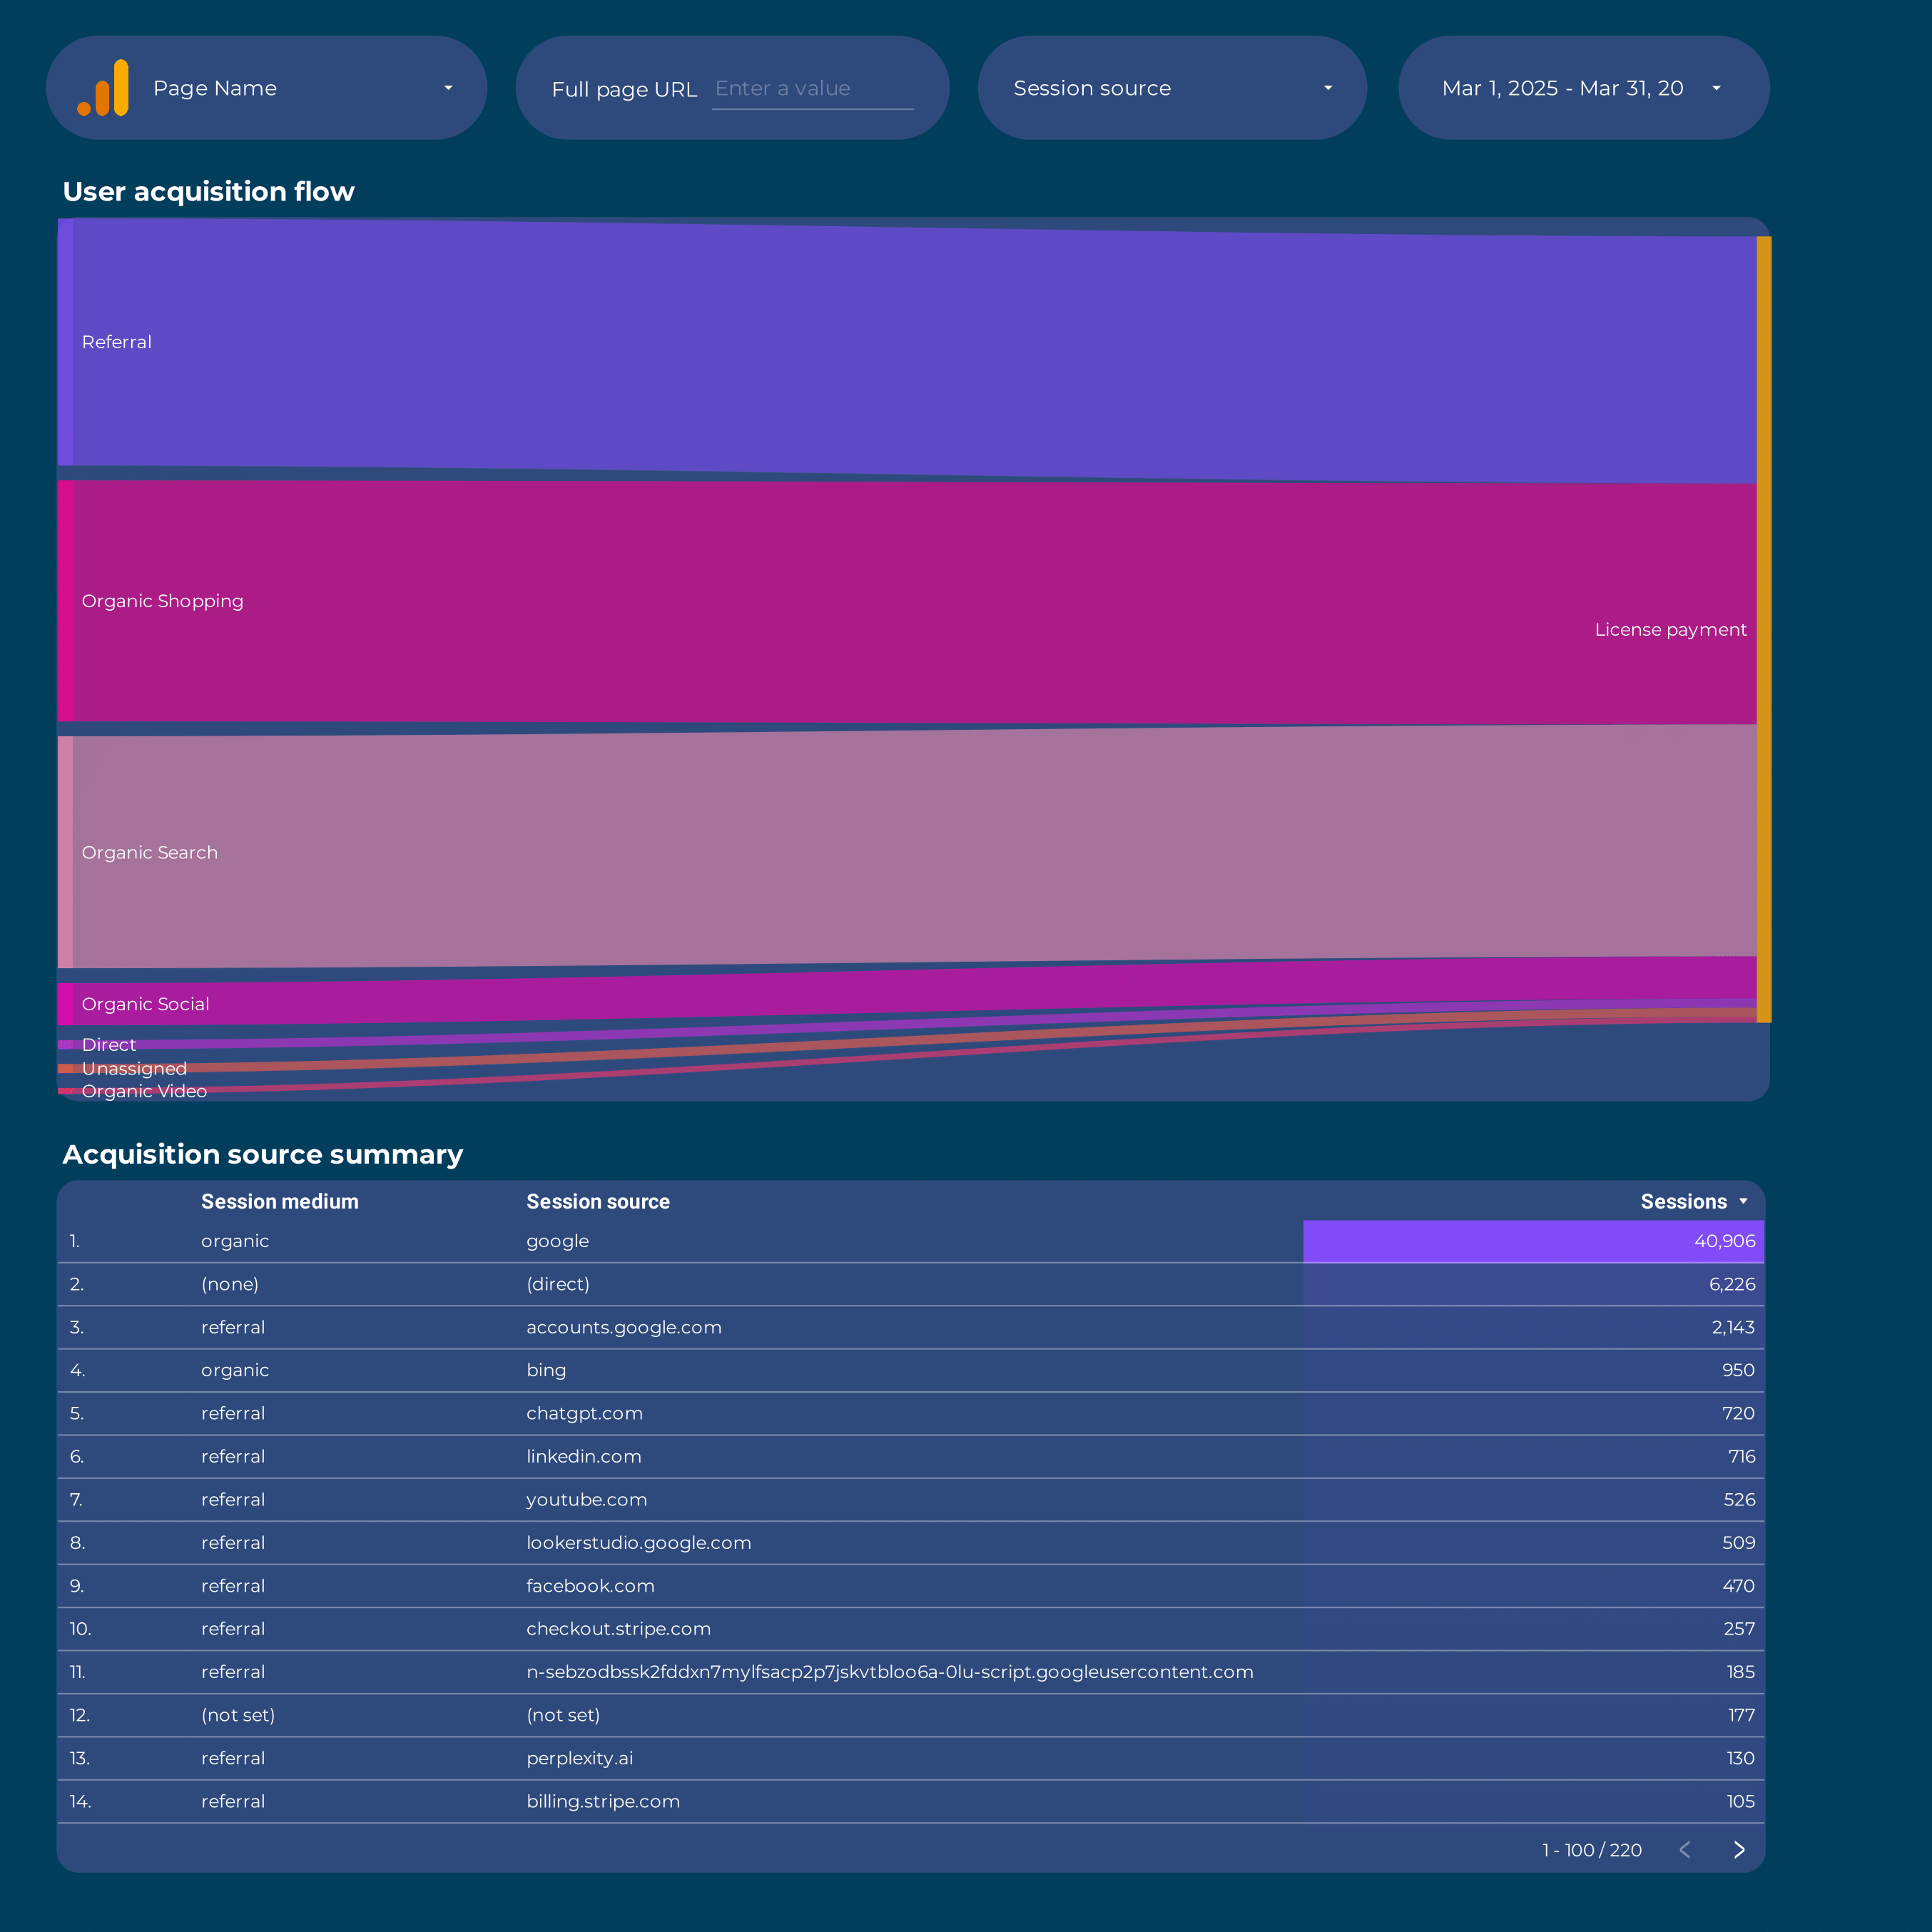
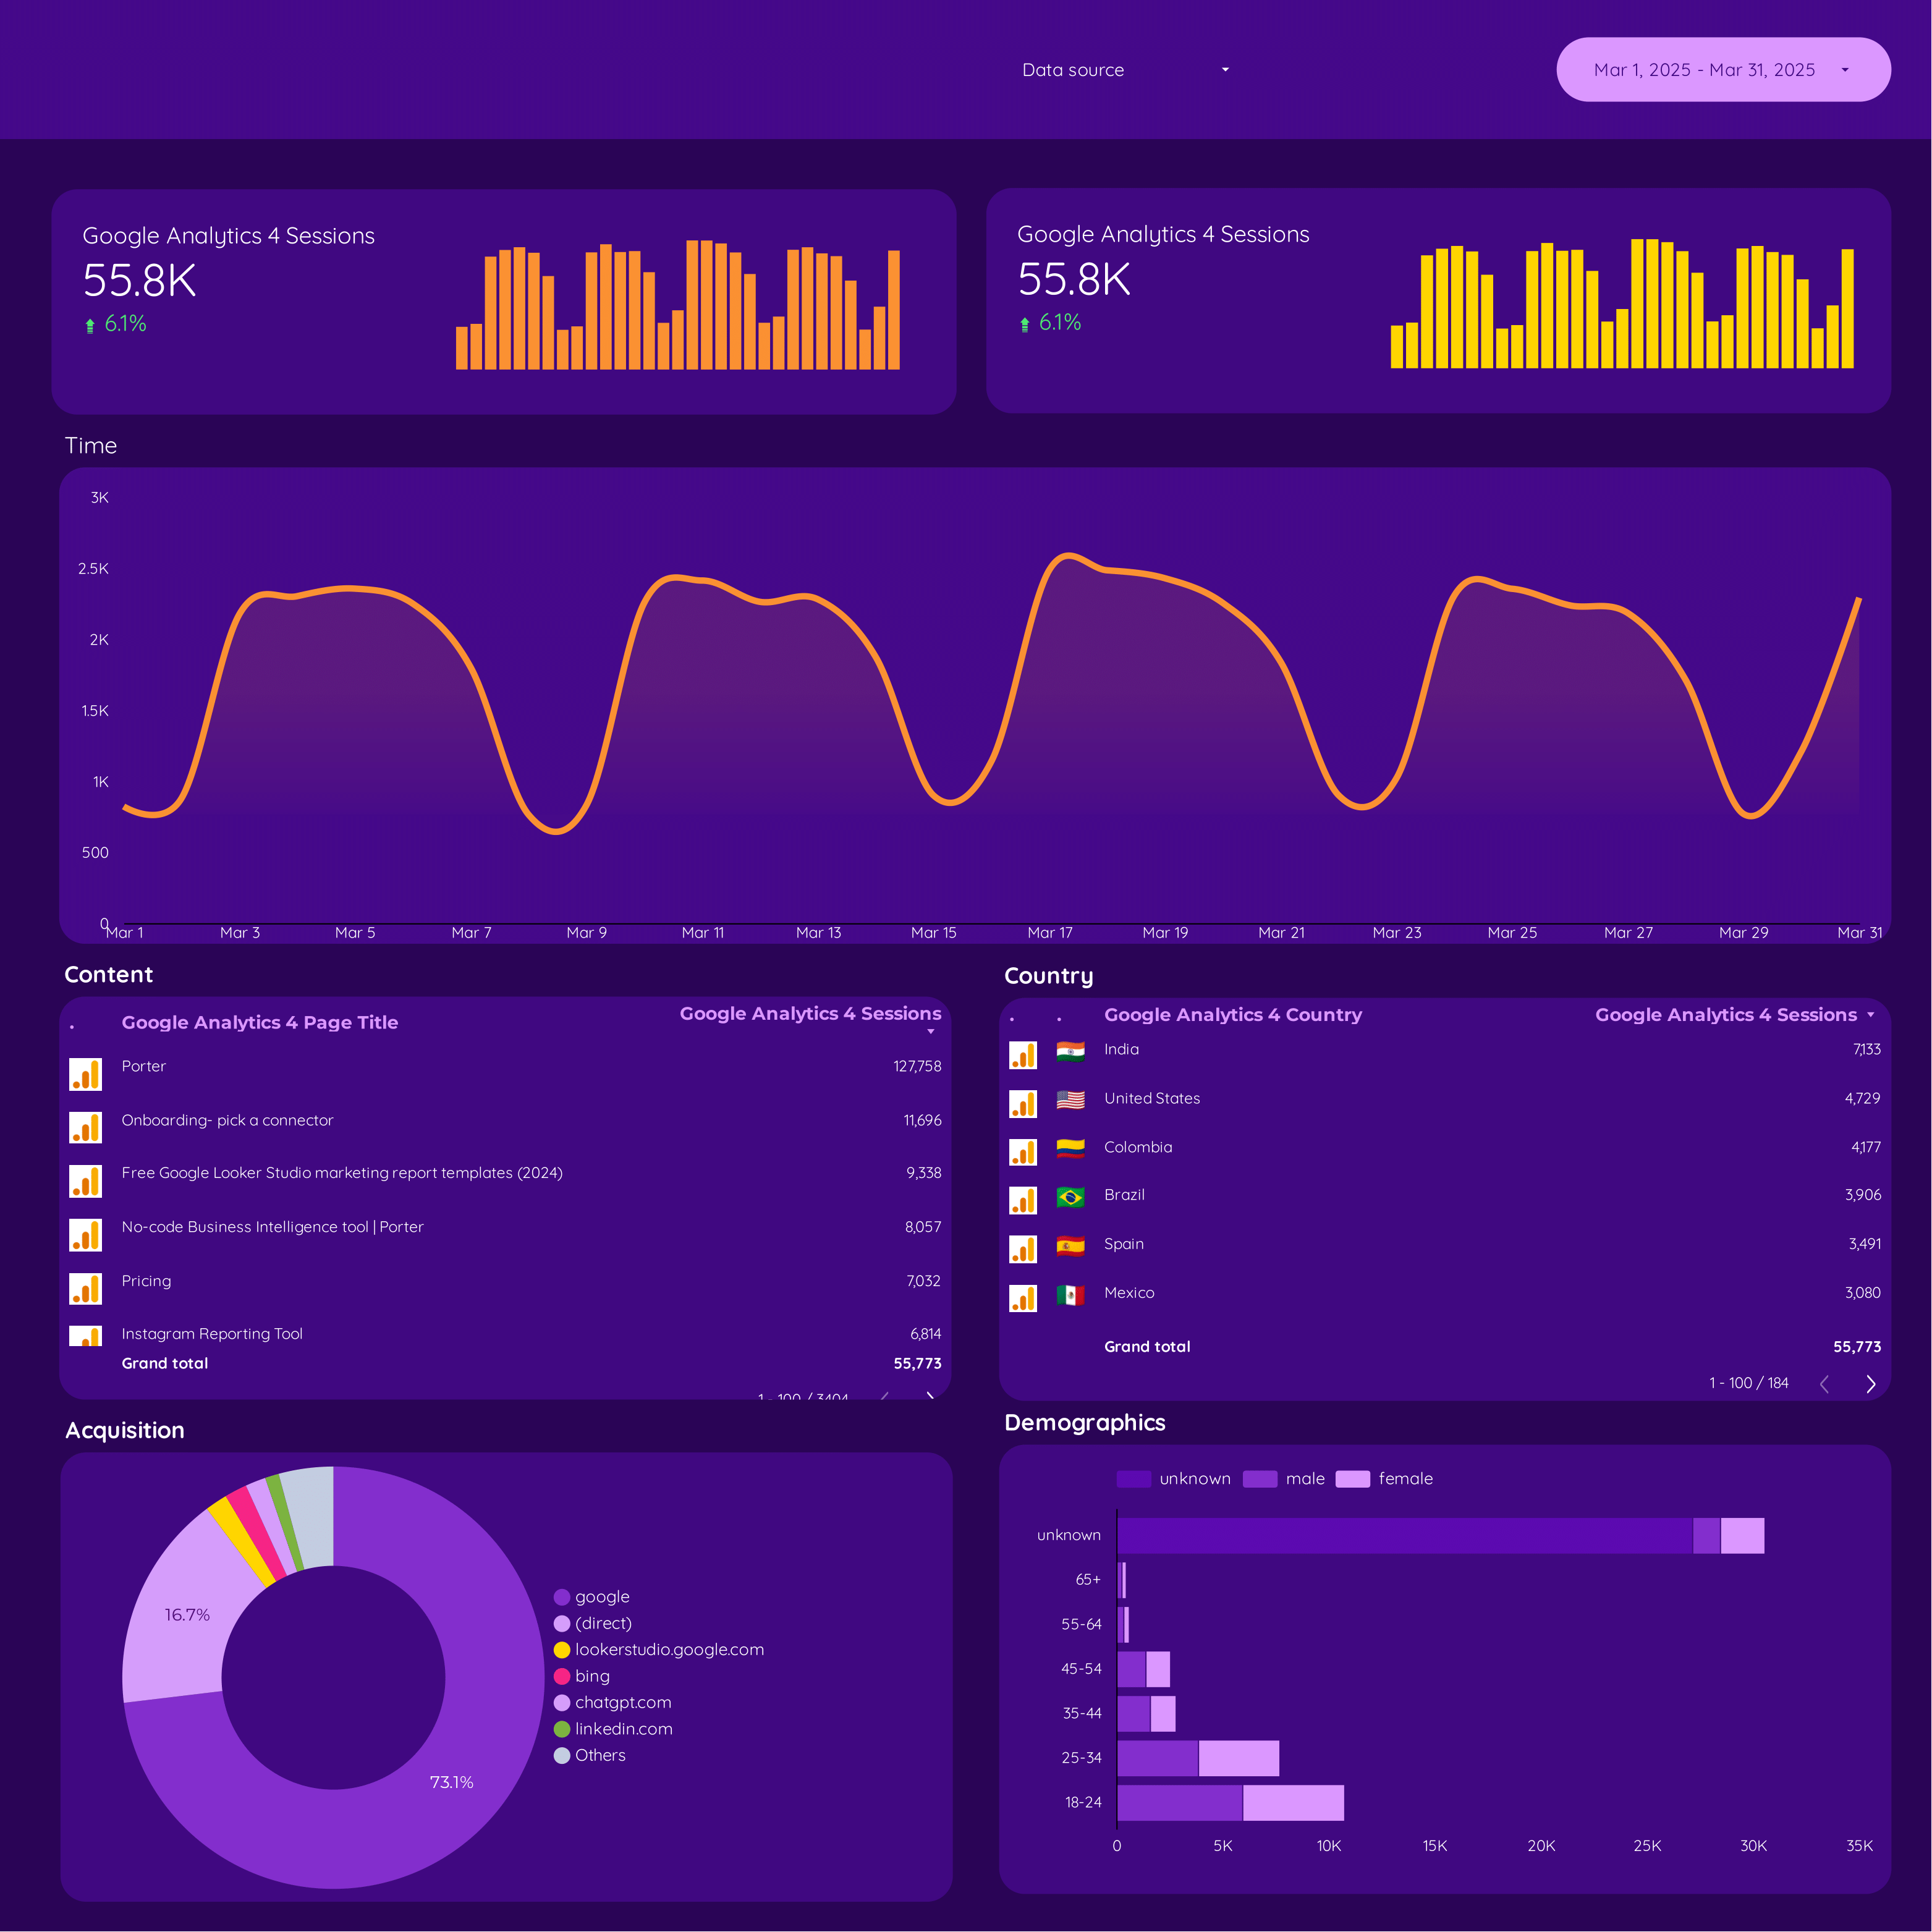
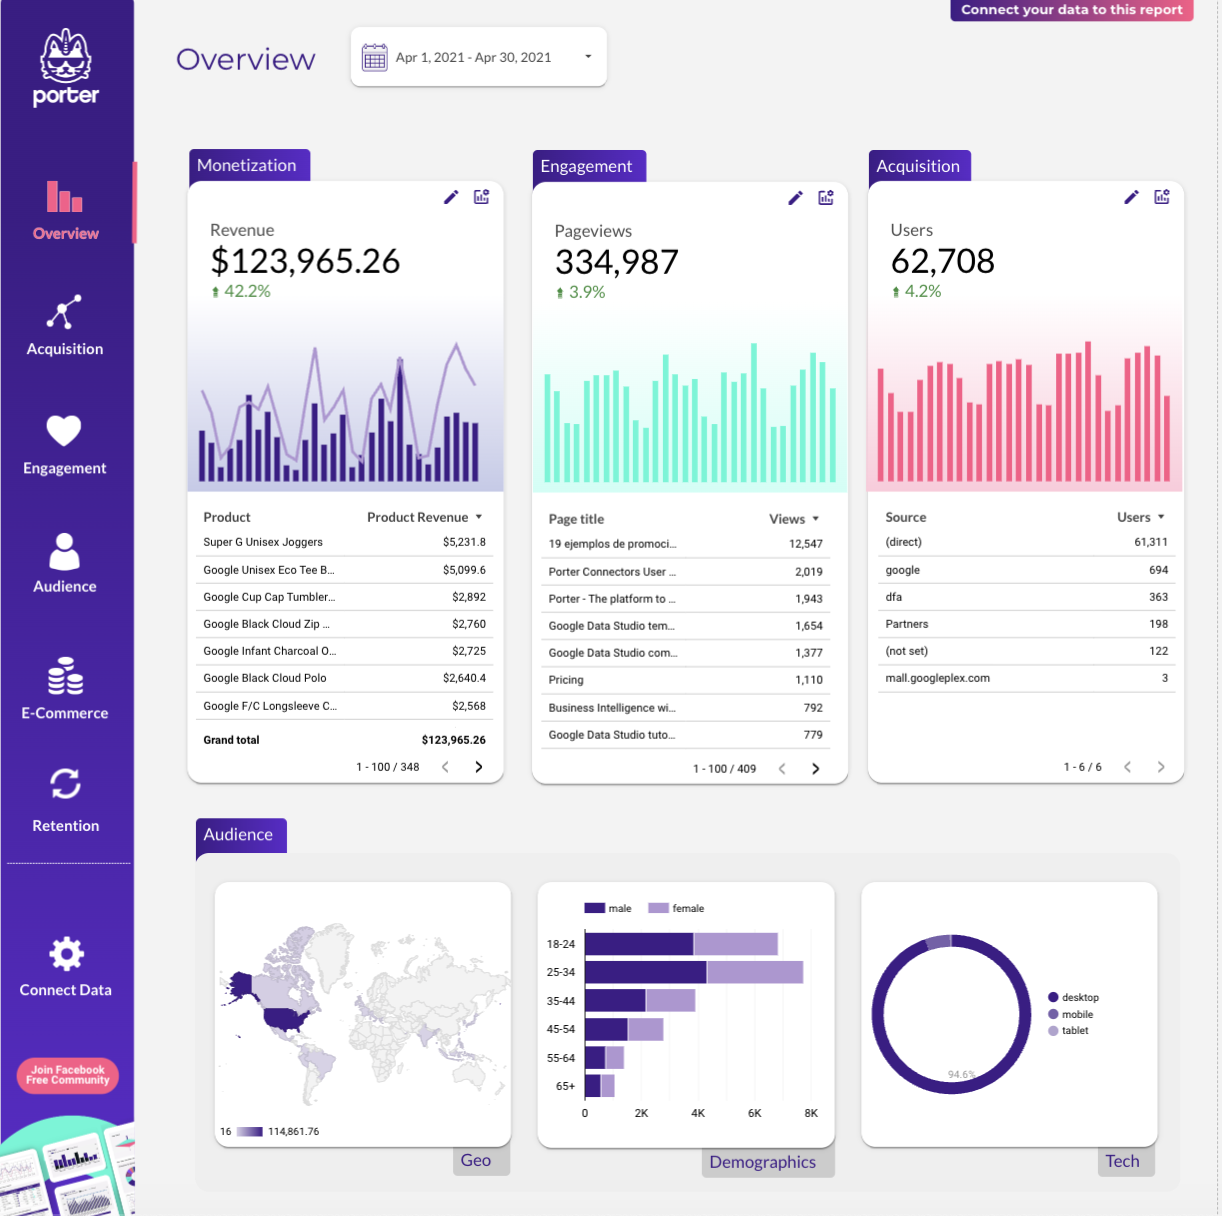
Acquisition Report template for Data Studio by Porter
Mide sessions, new users by source → engagement rate, events/session → conversions by channel, revenue. Segmenta por source/medium, campaign, landing page.
Google Analytics 4 E-commerce Report template for Data Studio by Porter
Mide product impressions, catalog views → add-to-cart rate, product clicks → purchase rate, revenue, AOV. Segmenta por product, category, source.
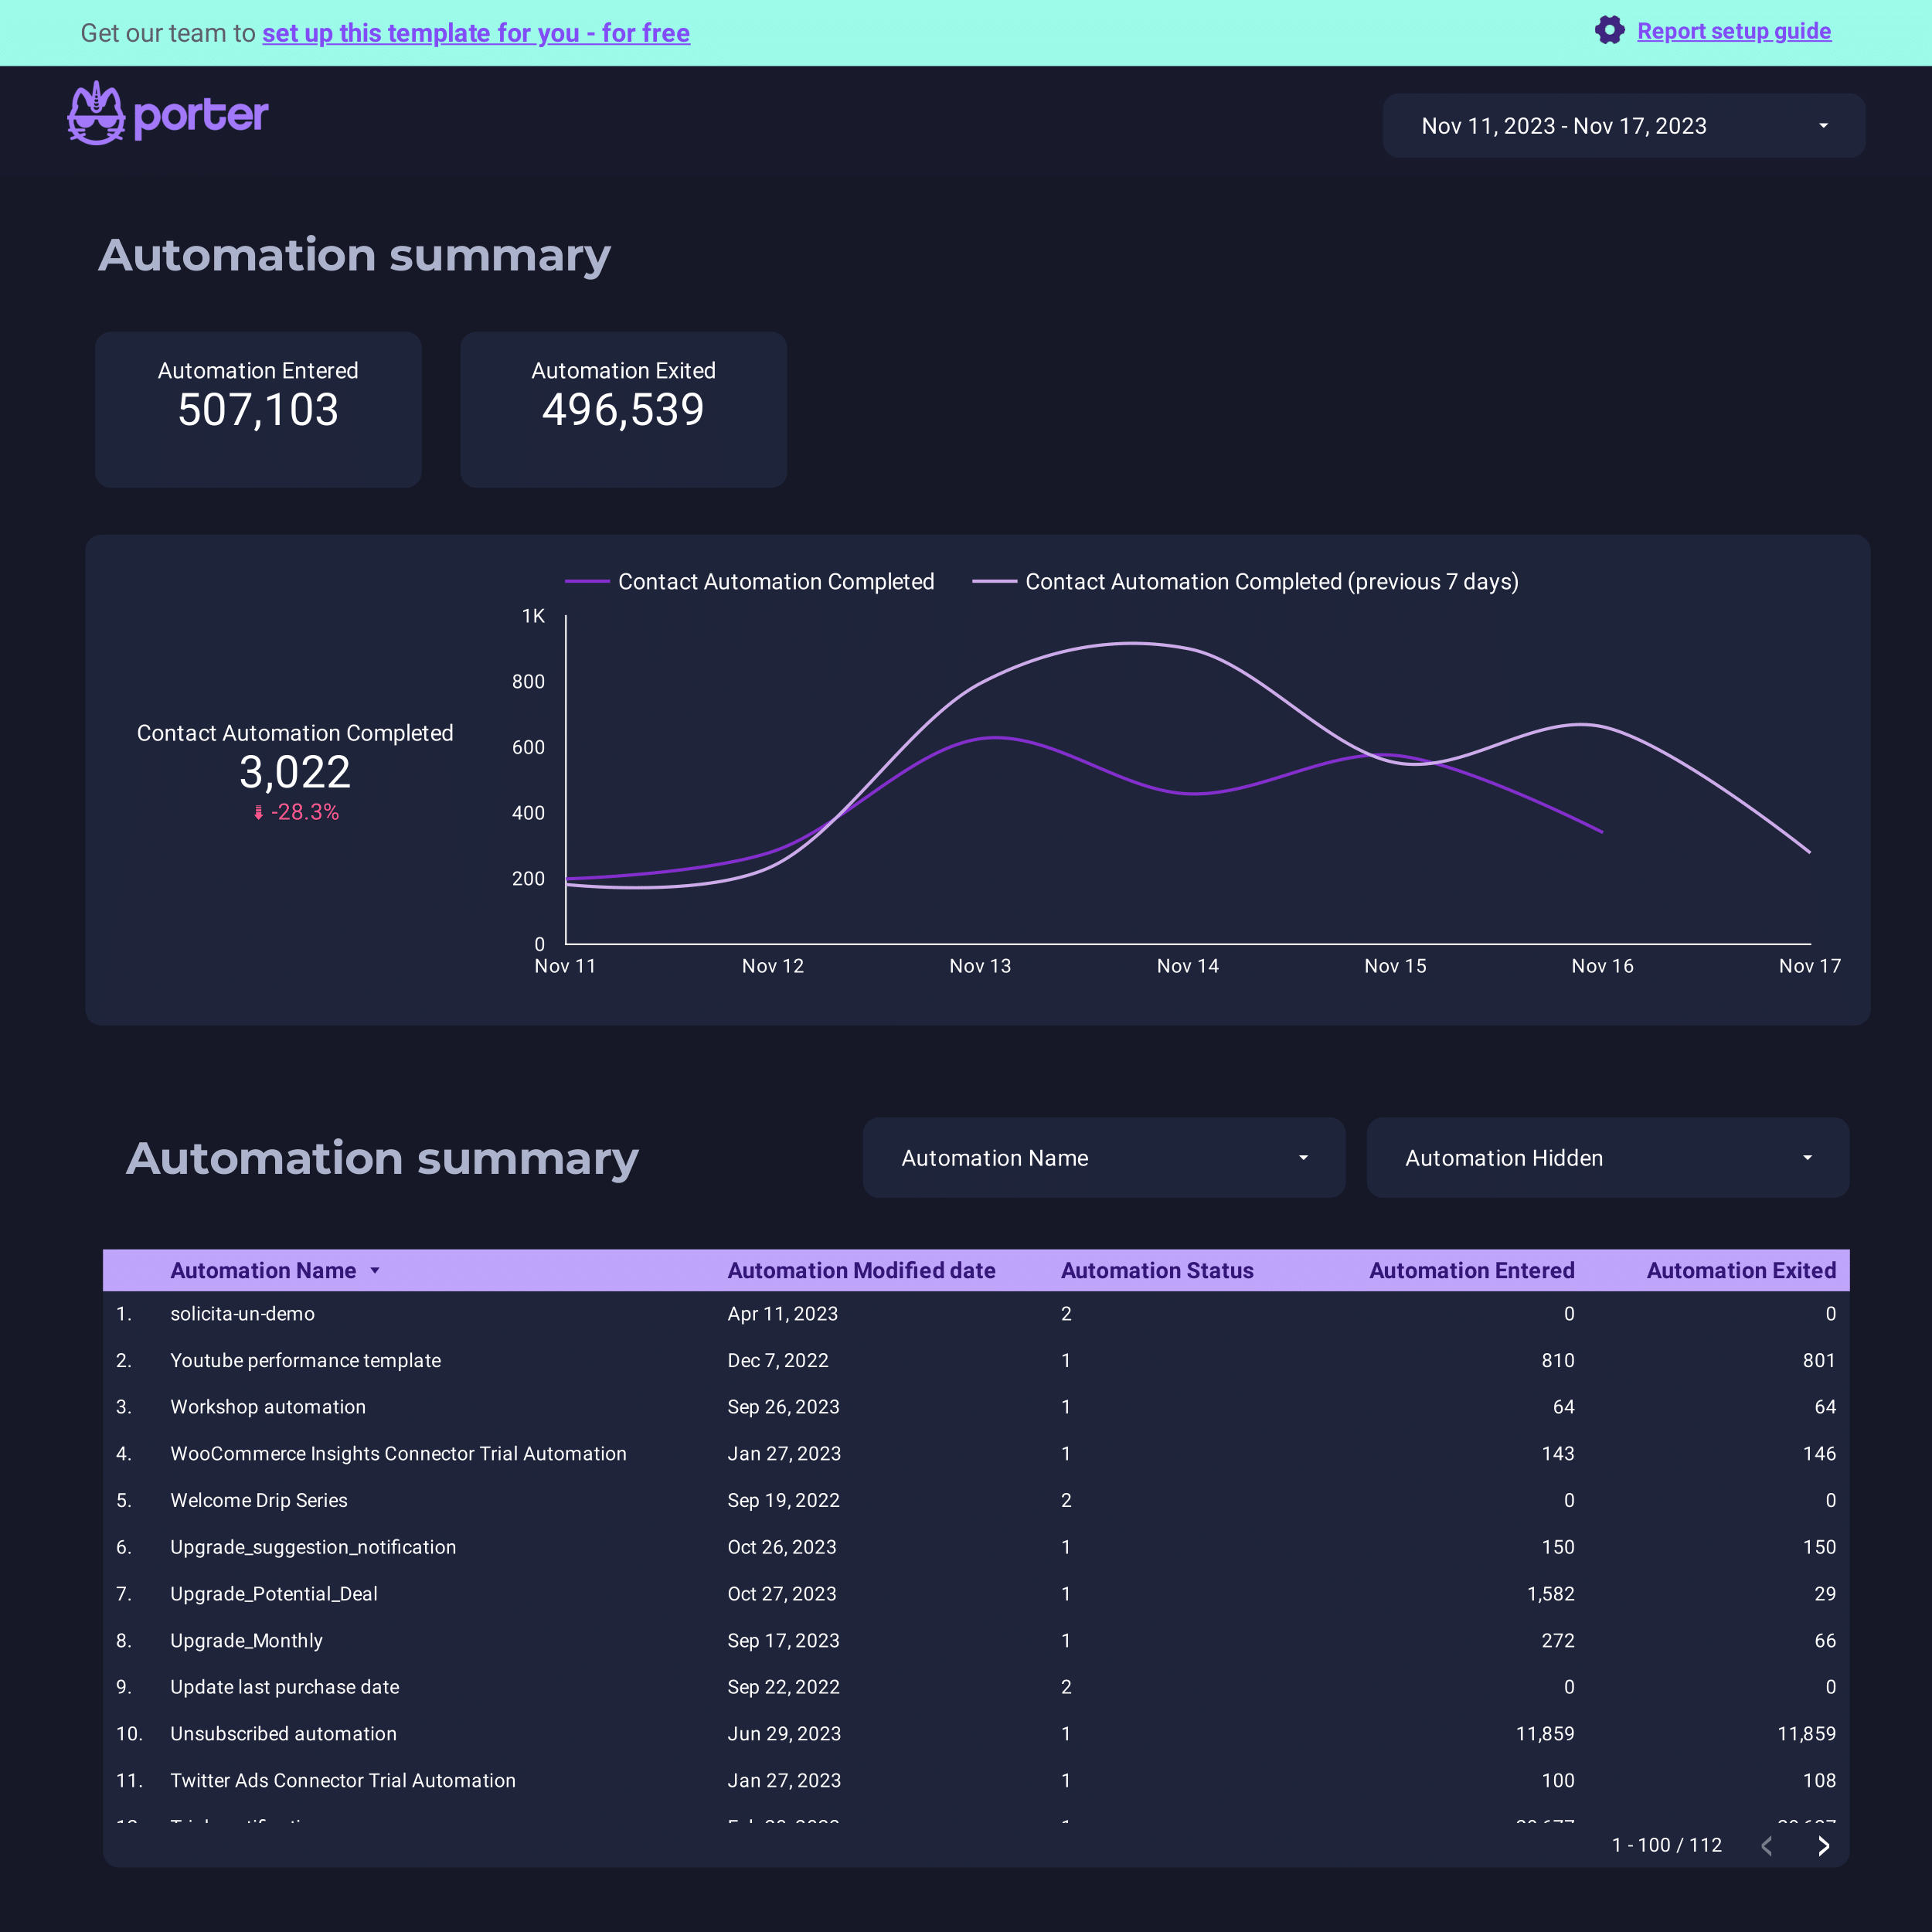
ActiveCampaign Report template for Data Studio by Porter
Mide contacts, email deliverability → open rate, click rate → conversion events, deals. Segmenta por automation, list, campaign.
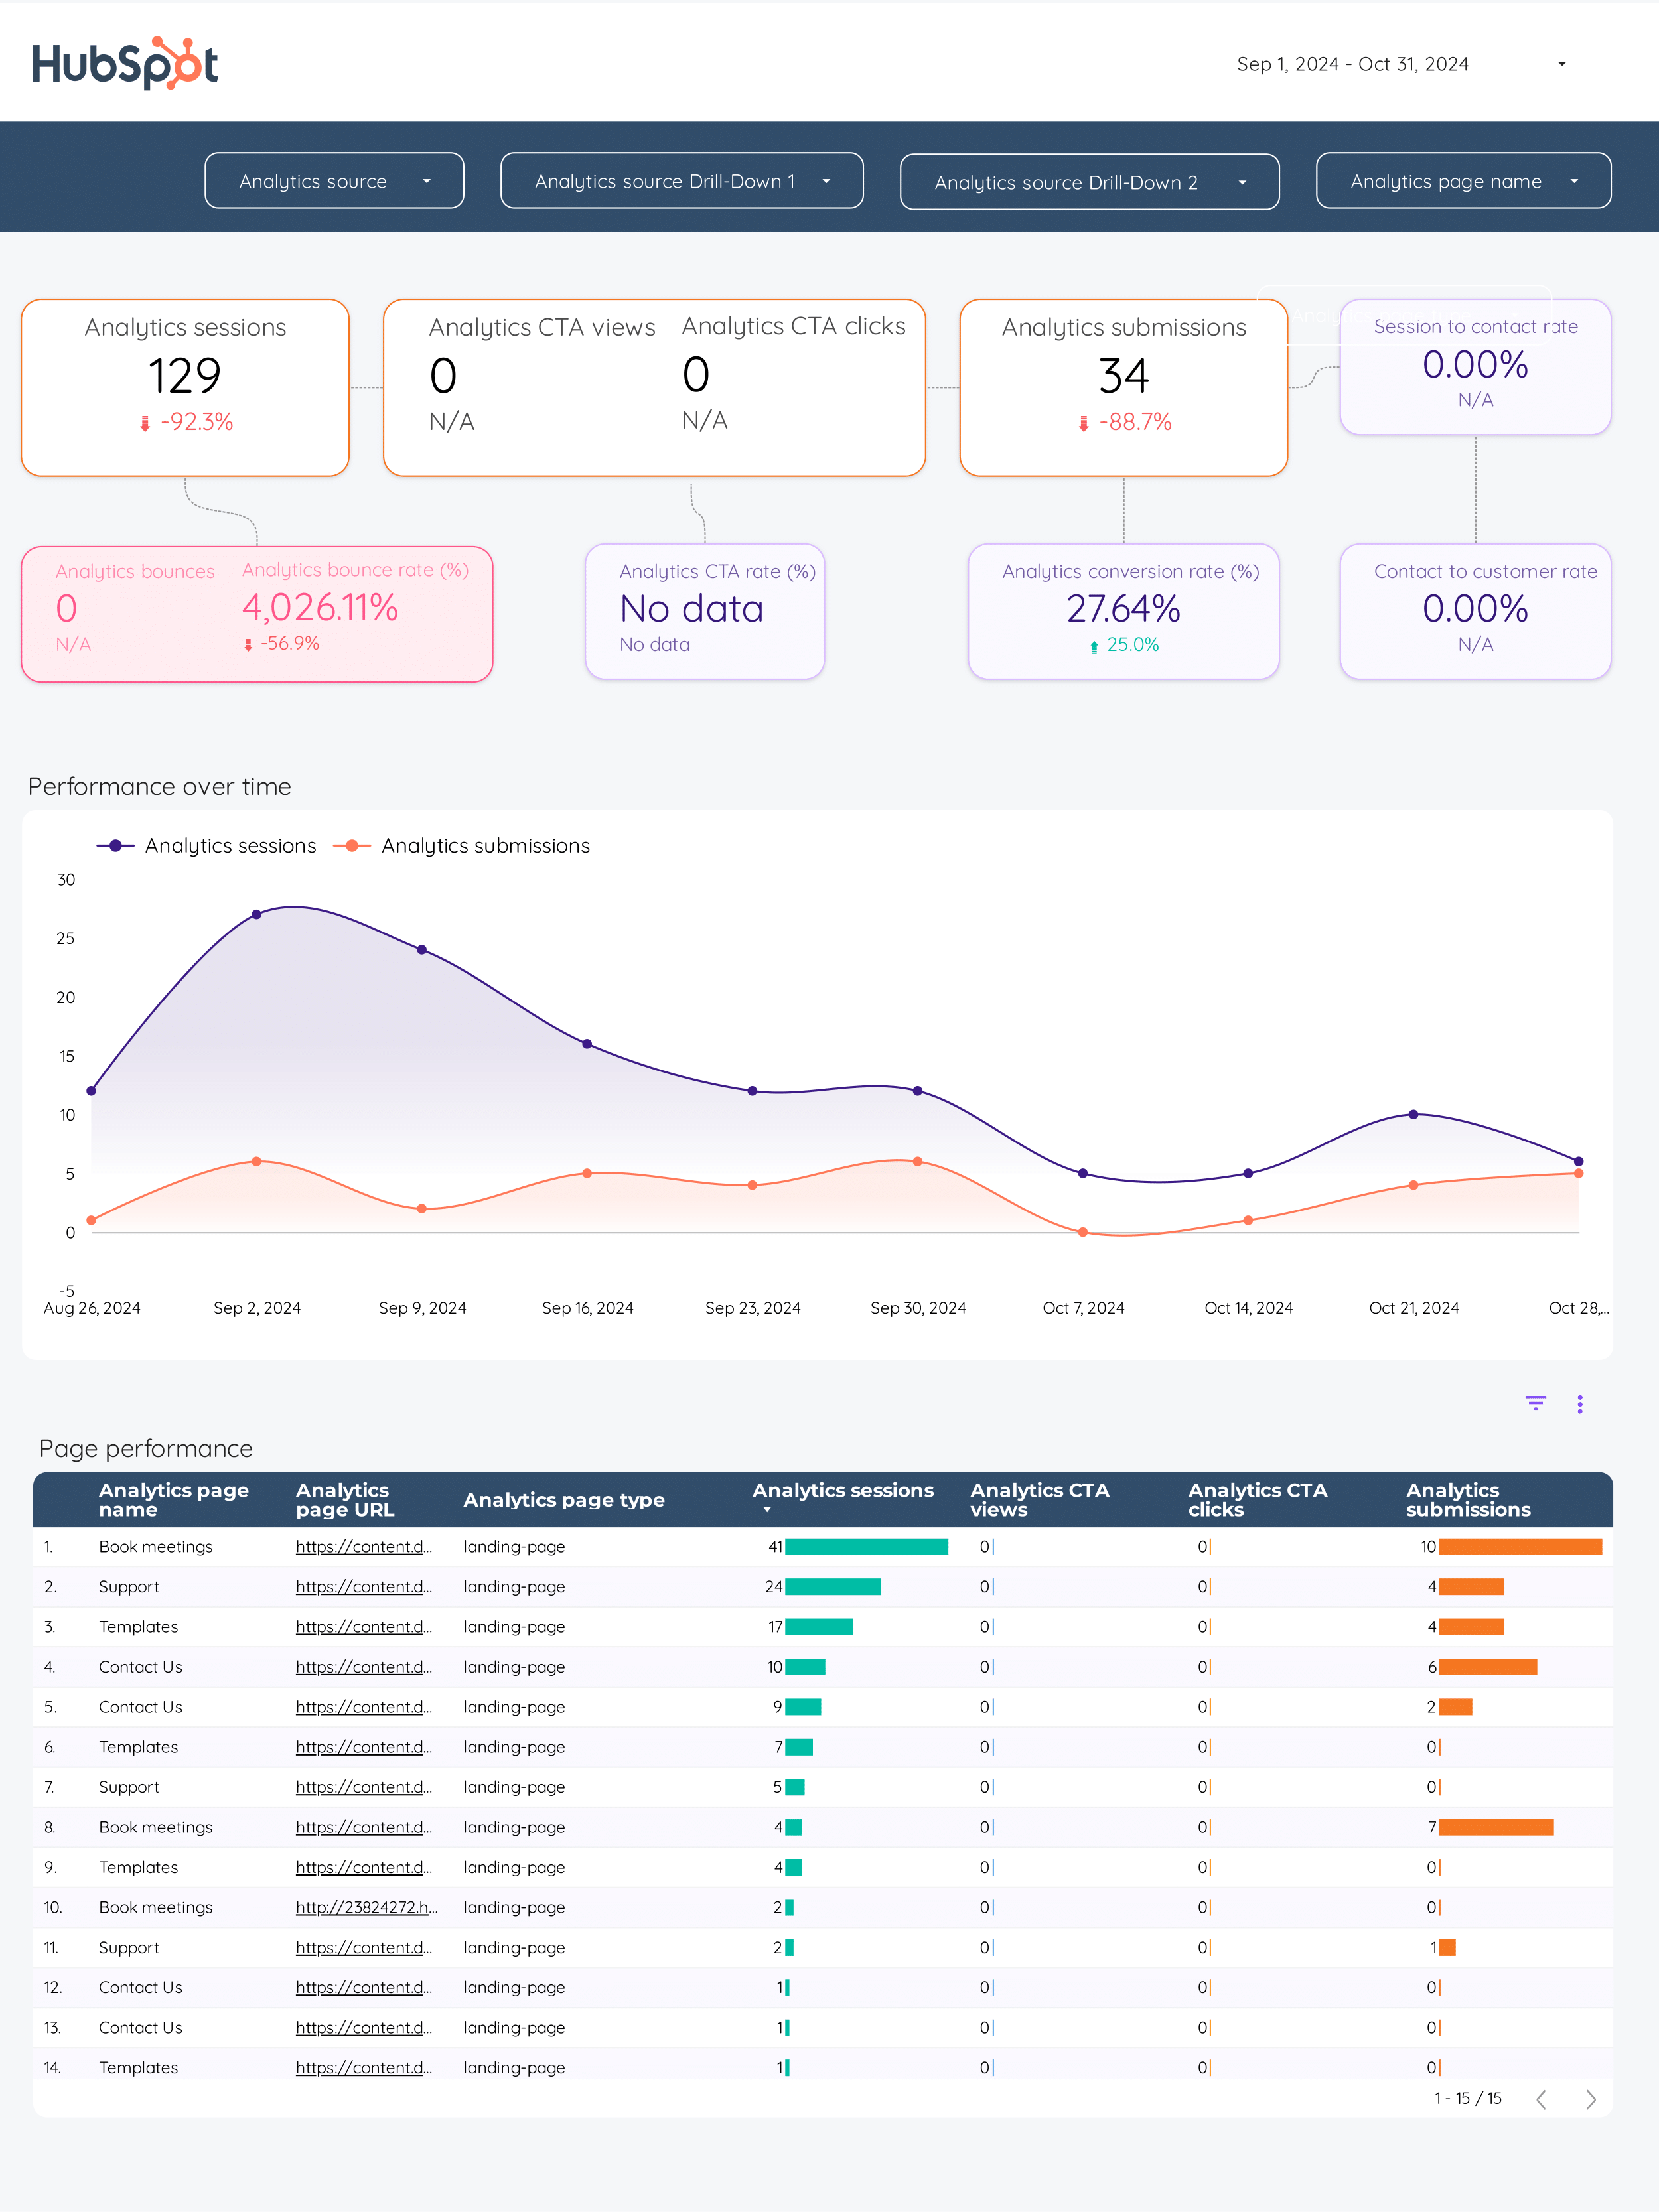
Website Report template for Data Studio by Porter
Mide sessions, visitors, traffic sources → bounce rate, pages/session, duration → form submissions, purchases. Segmenta por landing page, source, device.
Paid media Client presentation Report template for Data Studio by Porter
Mide client reach, impressions → CTR, engagement by platform → client ROAS, CPA, goals. Segmenta por client, platform, campaign.
B2B Marketing performance Report template for Data Studio by Porter
Mide account reach, impressions → engagement by account → MQLs, SQLs, pipeline contribution. Segmenta por account, campaign, stage.
Creator marketing Report template for Data Studio by Porter
Mide creator reach, impressions → engagement per creator, saves → conversions per creator, ROI. Segmenta por creator, platform.
Inbound marketing Report template for Data Studio by Porter
Mide blog traffic, social reach → content downloads, form views → MQLs, SQLs, pipeline generated. Segmenta por content asset, channel, stage.
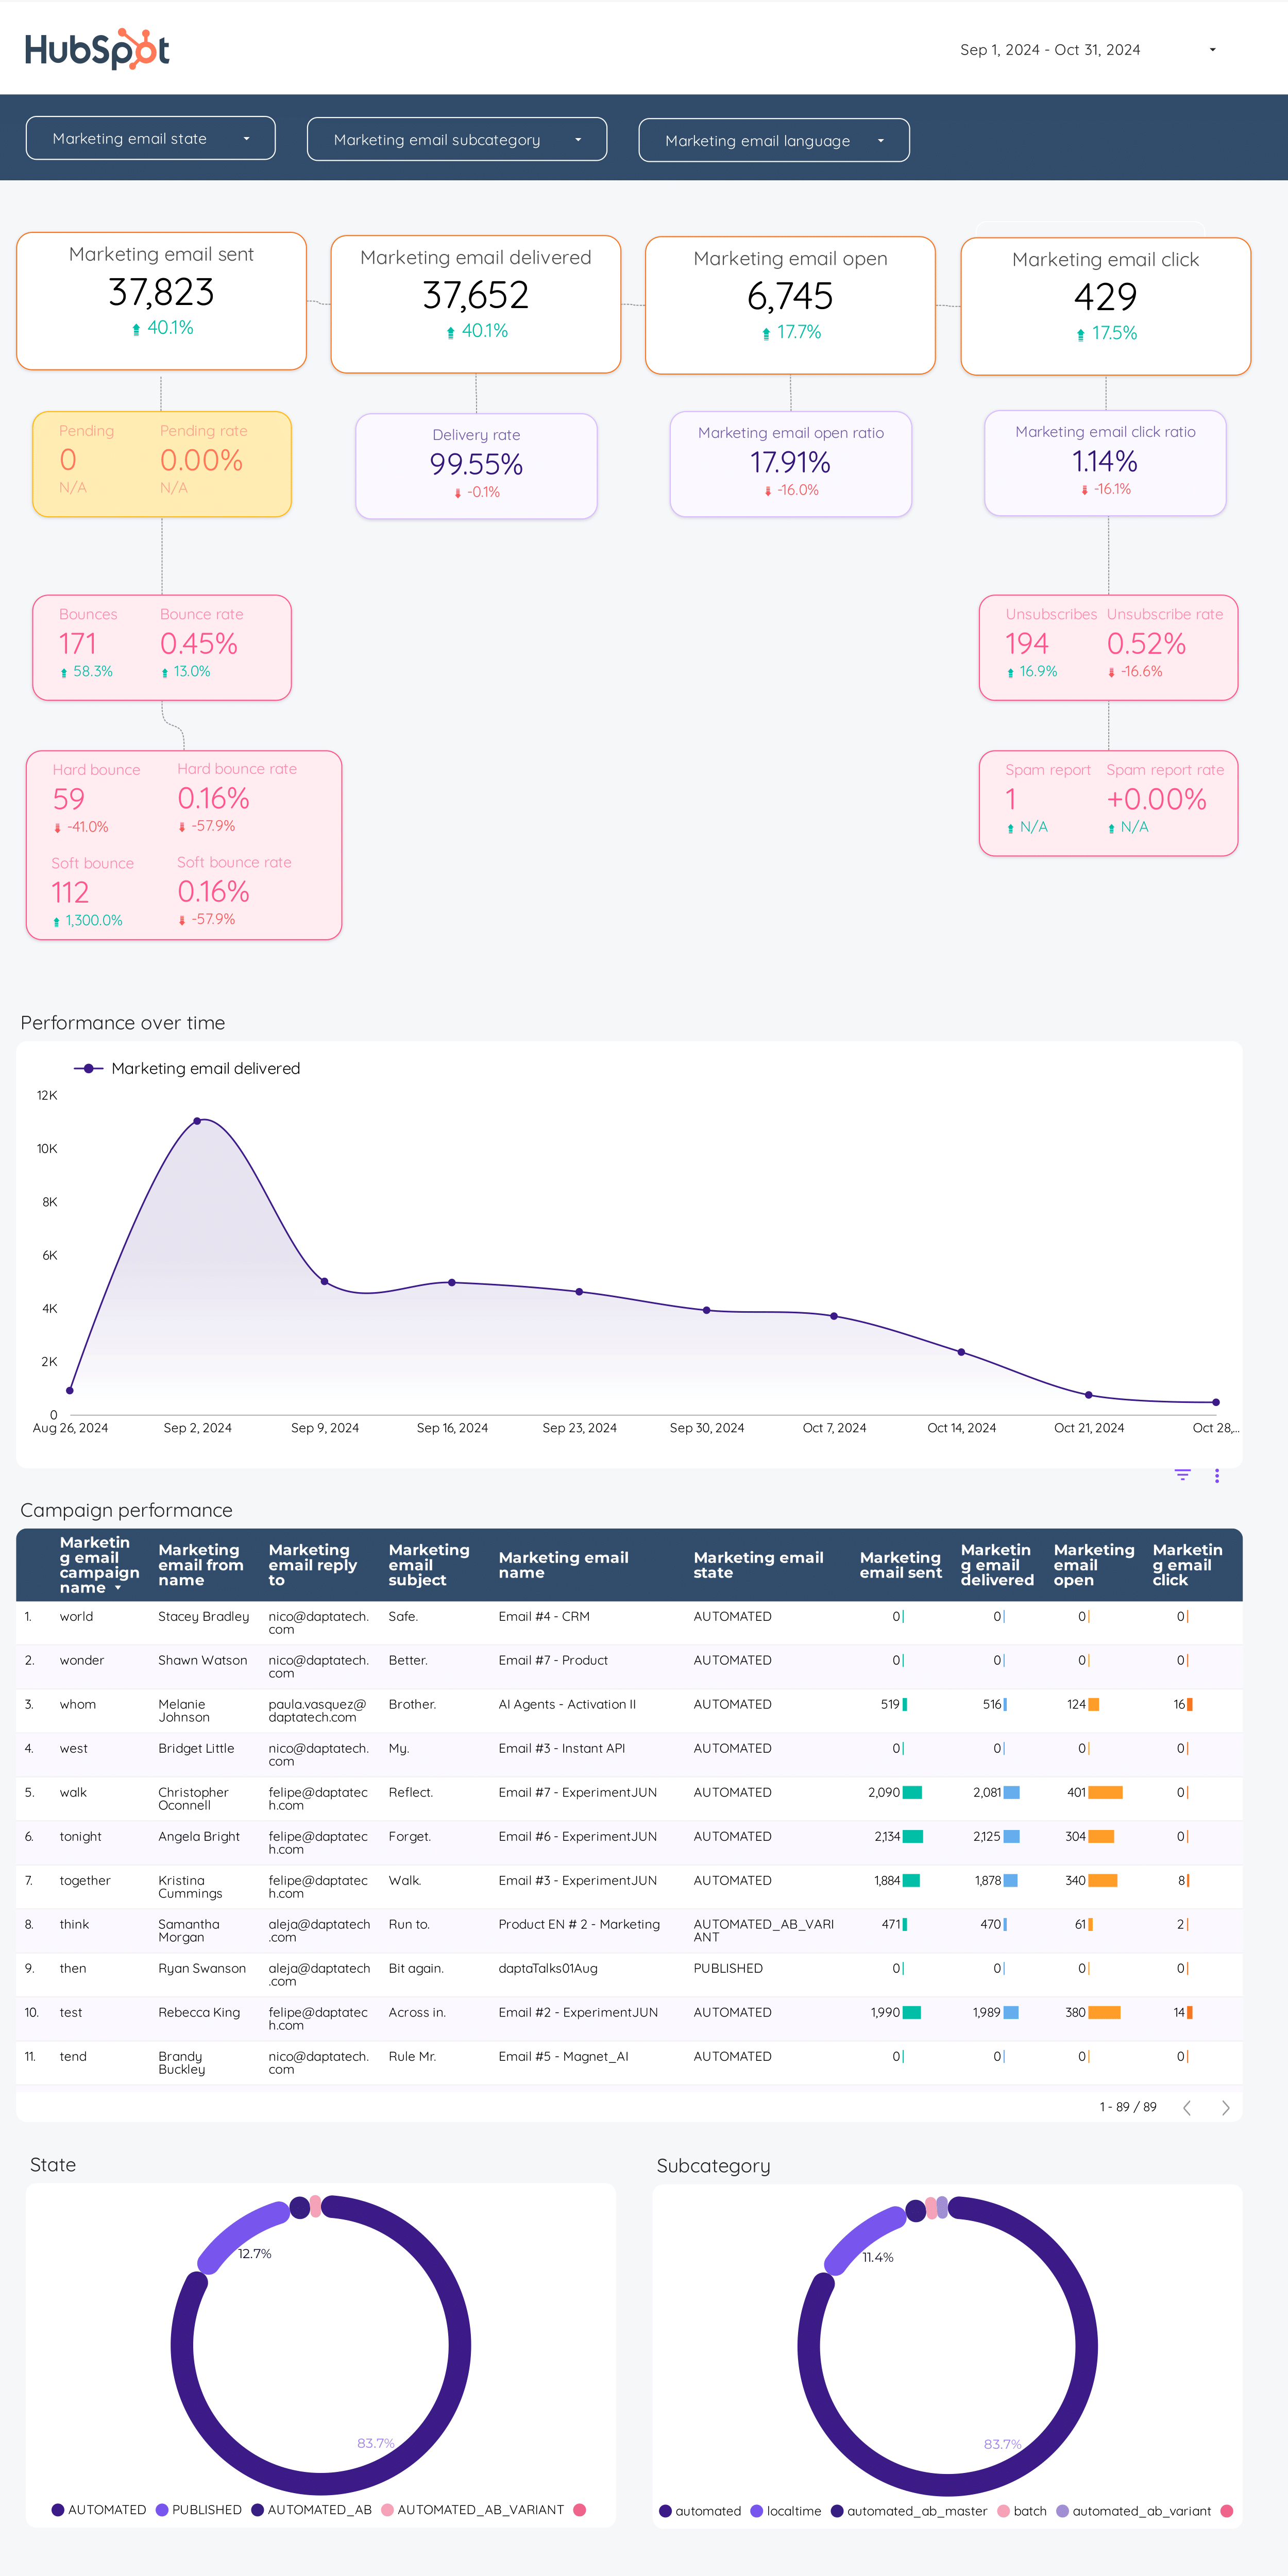
Email marketing Report template for Data Studio by Porter
Mide emails sent, deliverability → open rate, CTR, unsubscribes → email revenue, conversion. Segmenta por campaign, segment, time.
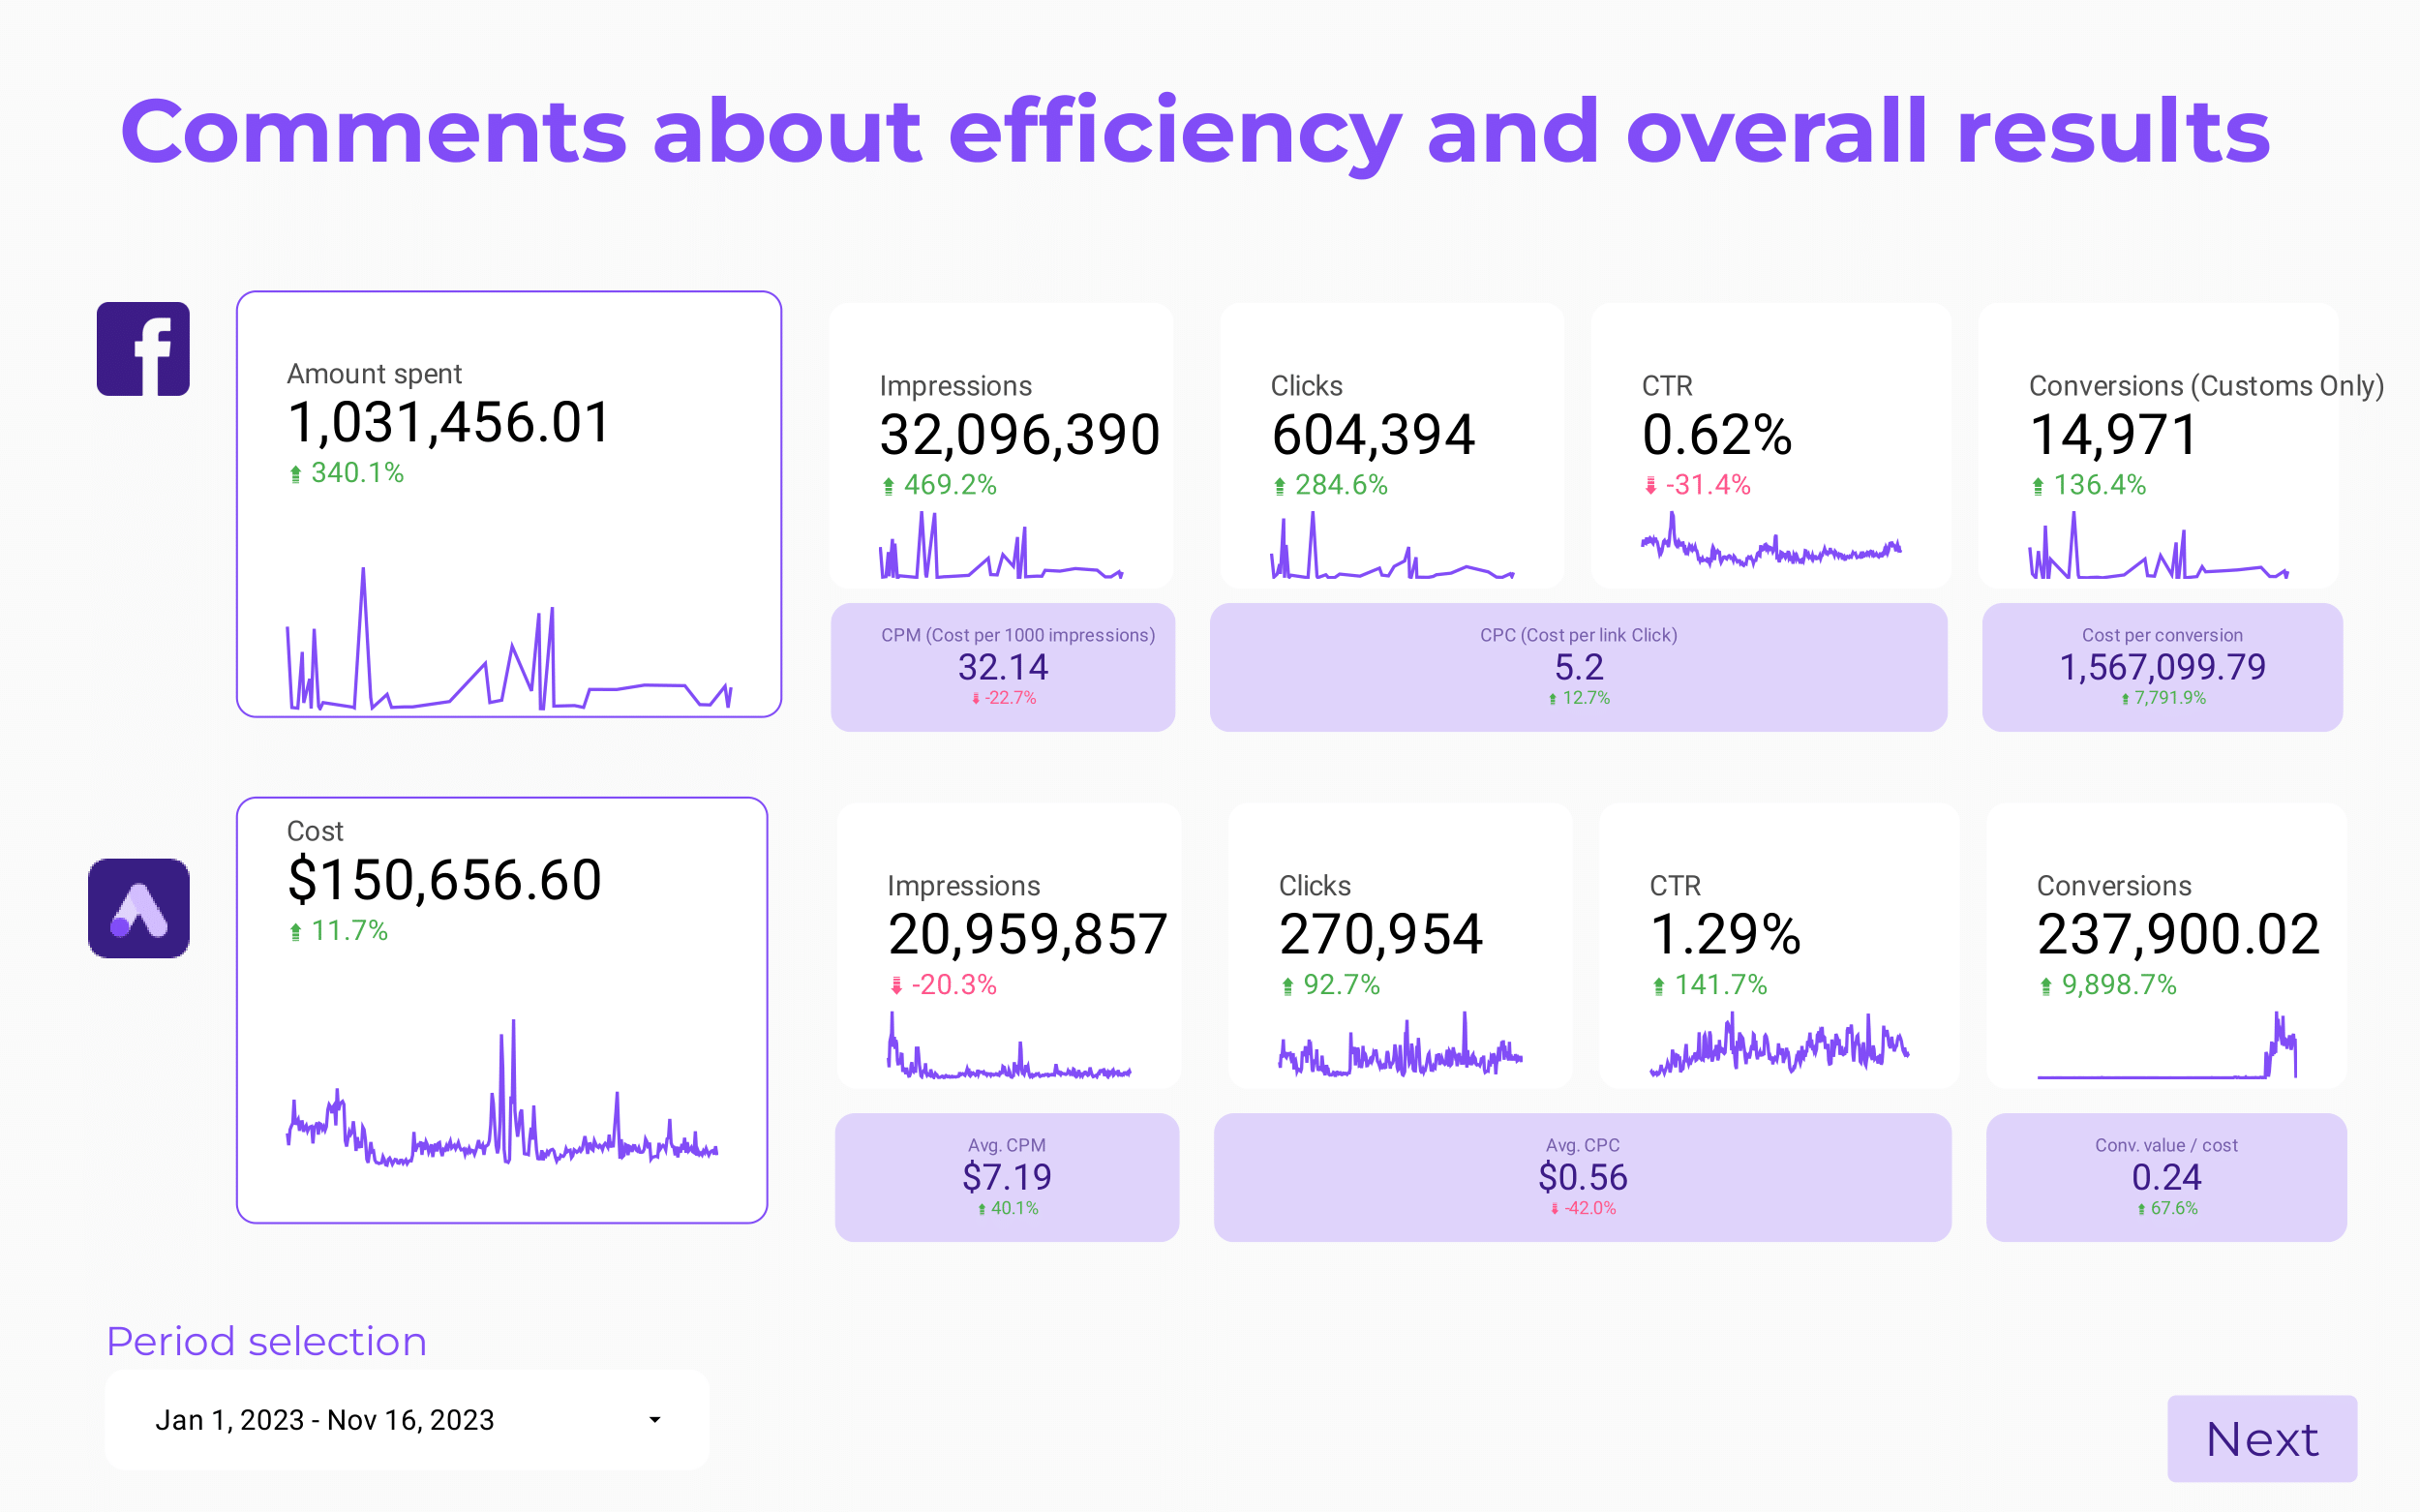
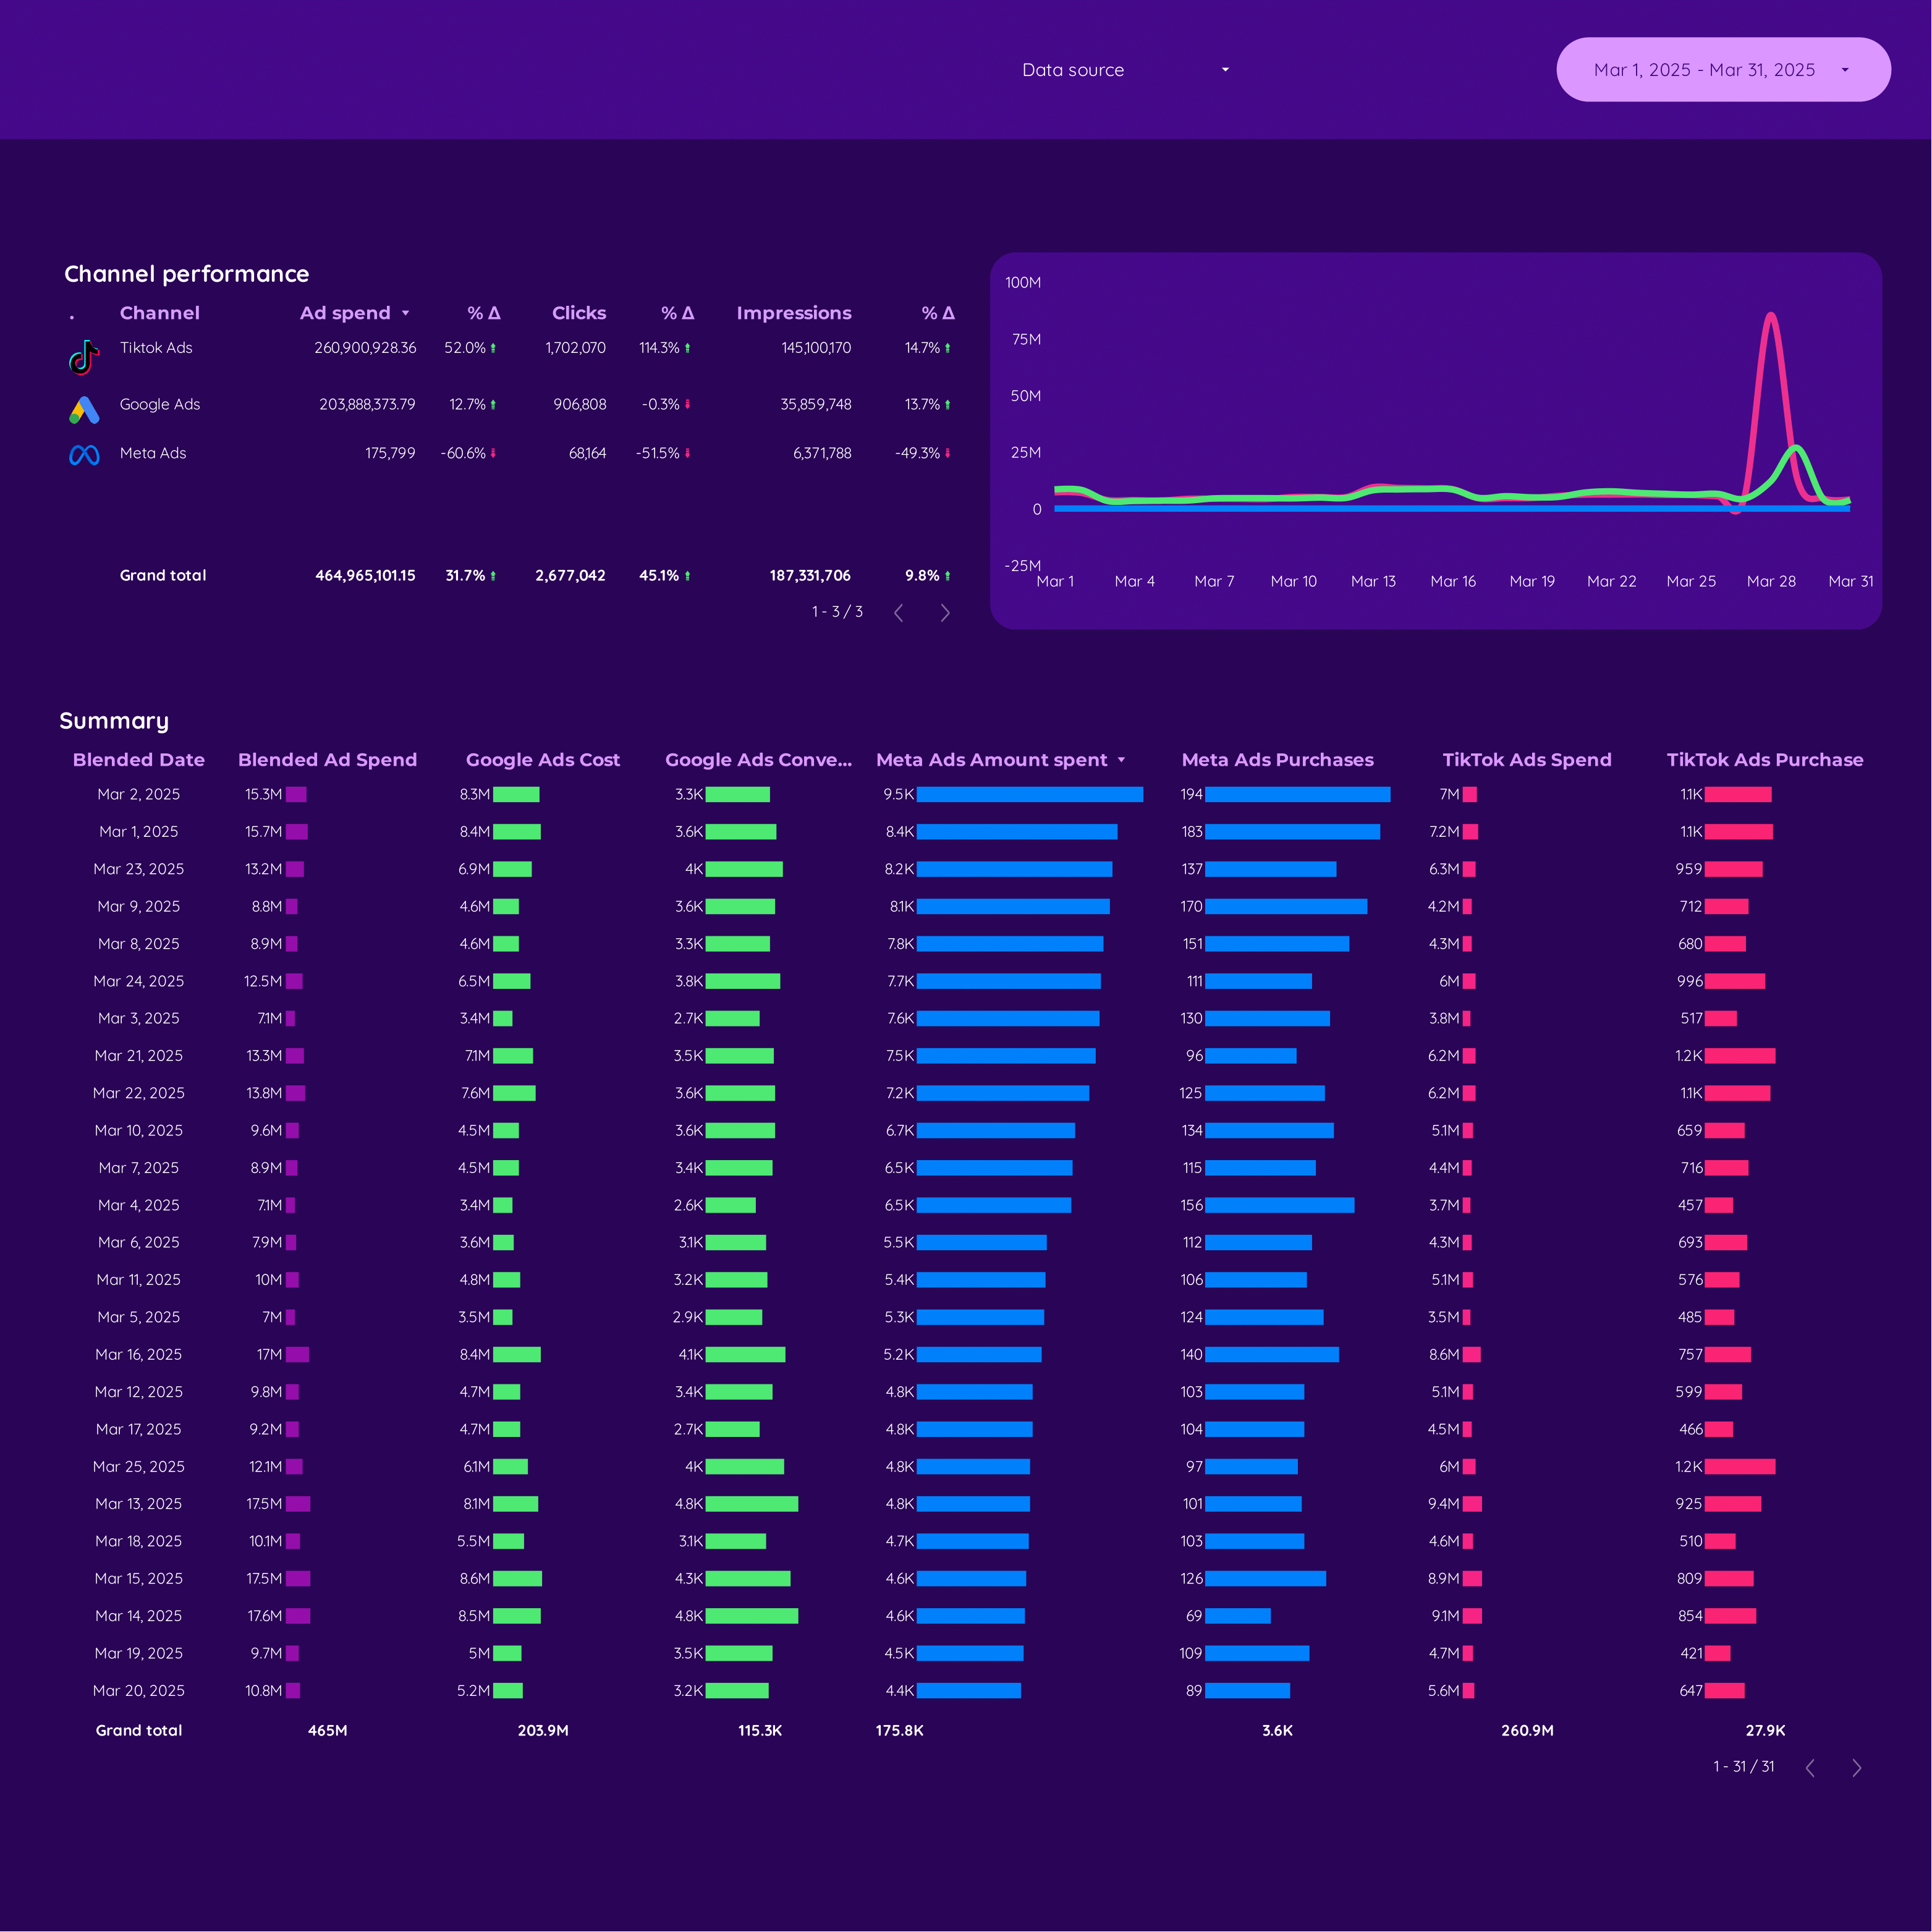
Marketing Ad spend Report template for Data Studio by Porter
Mide spend distribution, budget allocation → efficiency (CPC, CPM by channel) → ROAS by channel, blended CPA. Segmenta por channel, campaign, period.
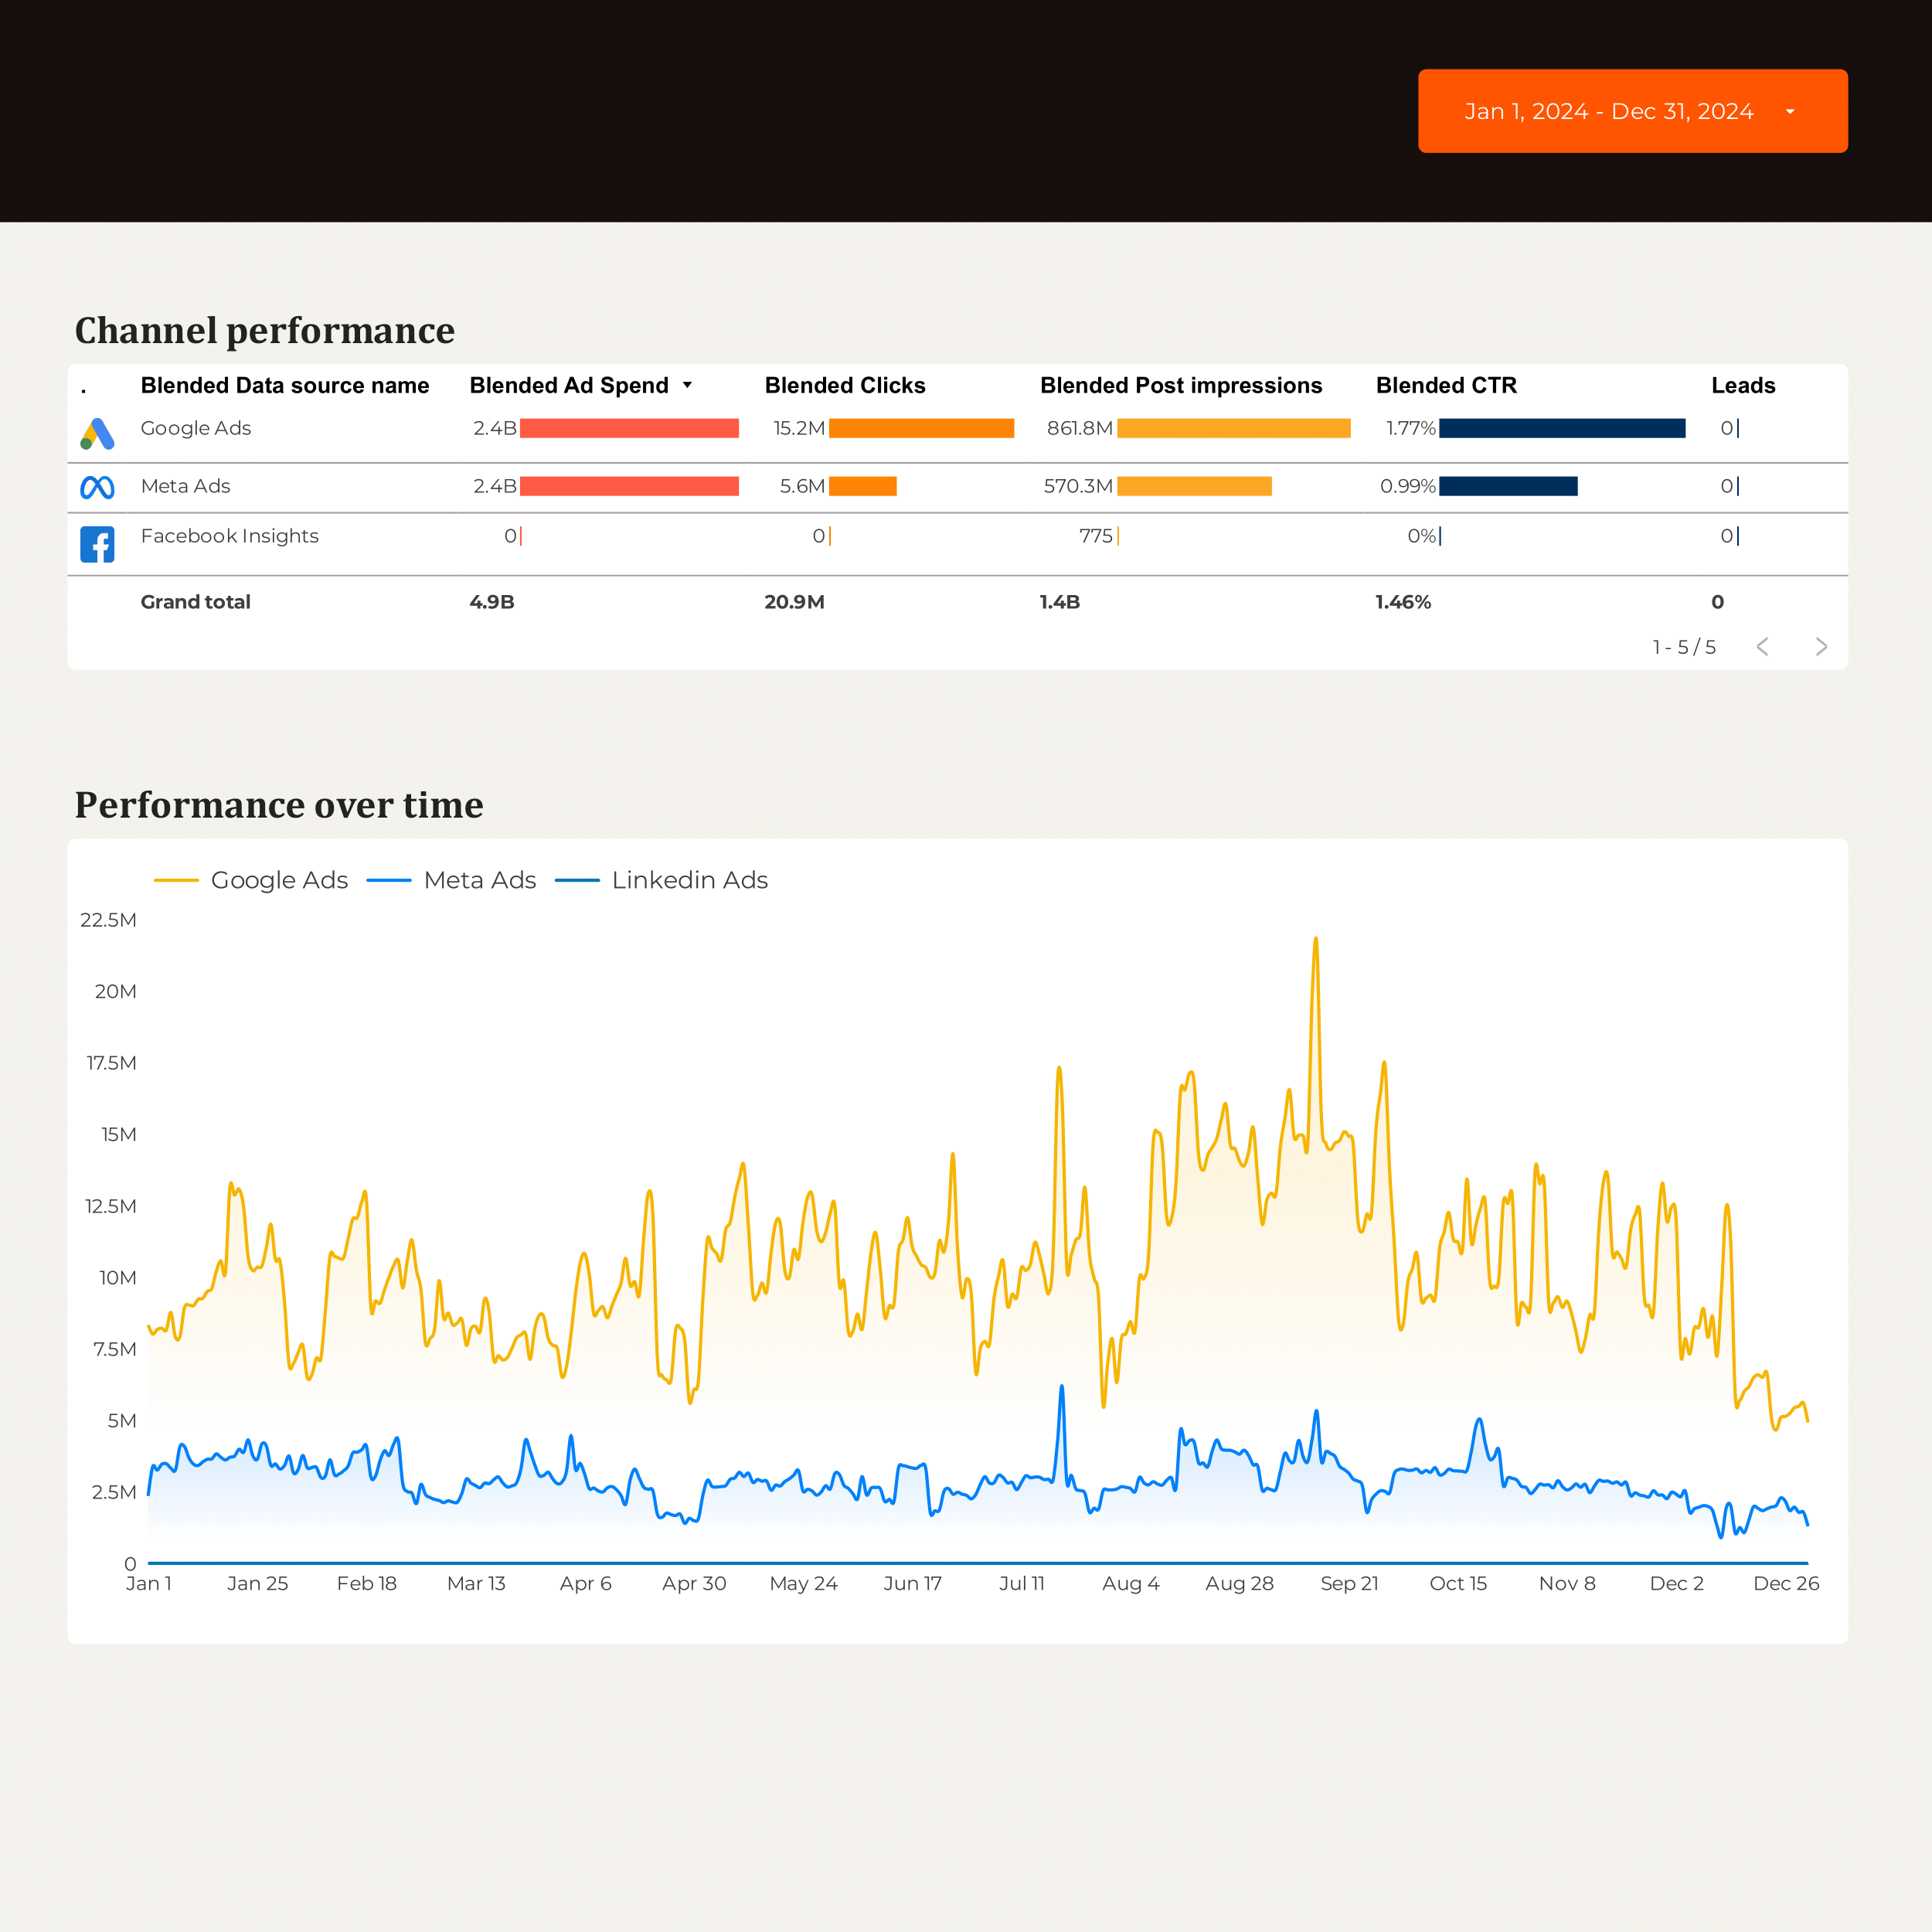
Cross-channel Report template for Data Studio by Porter
Mide unified impressions, reach → cross-platform CTR comparison → attributed conversions, blended ROAS. Segmenta por platform, campaign, audience.

PPC multi-channel Report template for Data Studio by Porter
Mide cross-platform impressions → CTR comparison by platform → blended ROAS, CPA by platform. Segmenta por platform, campaign type.
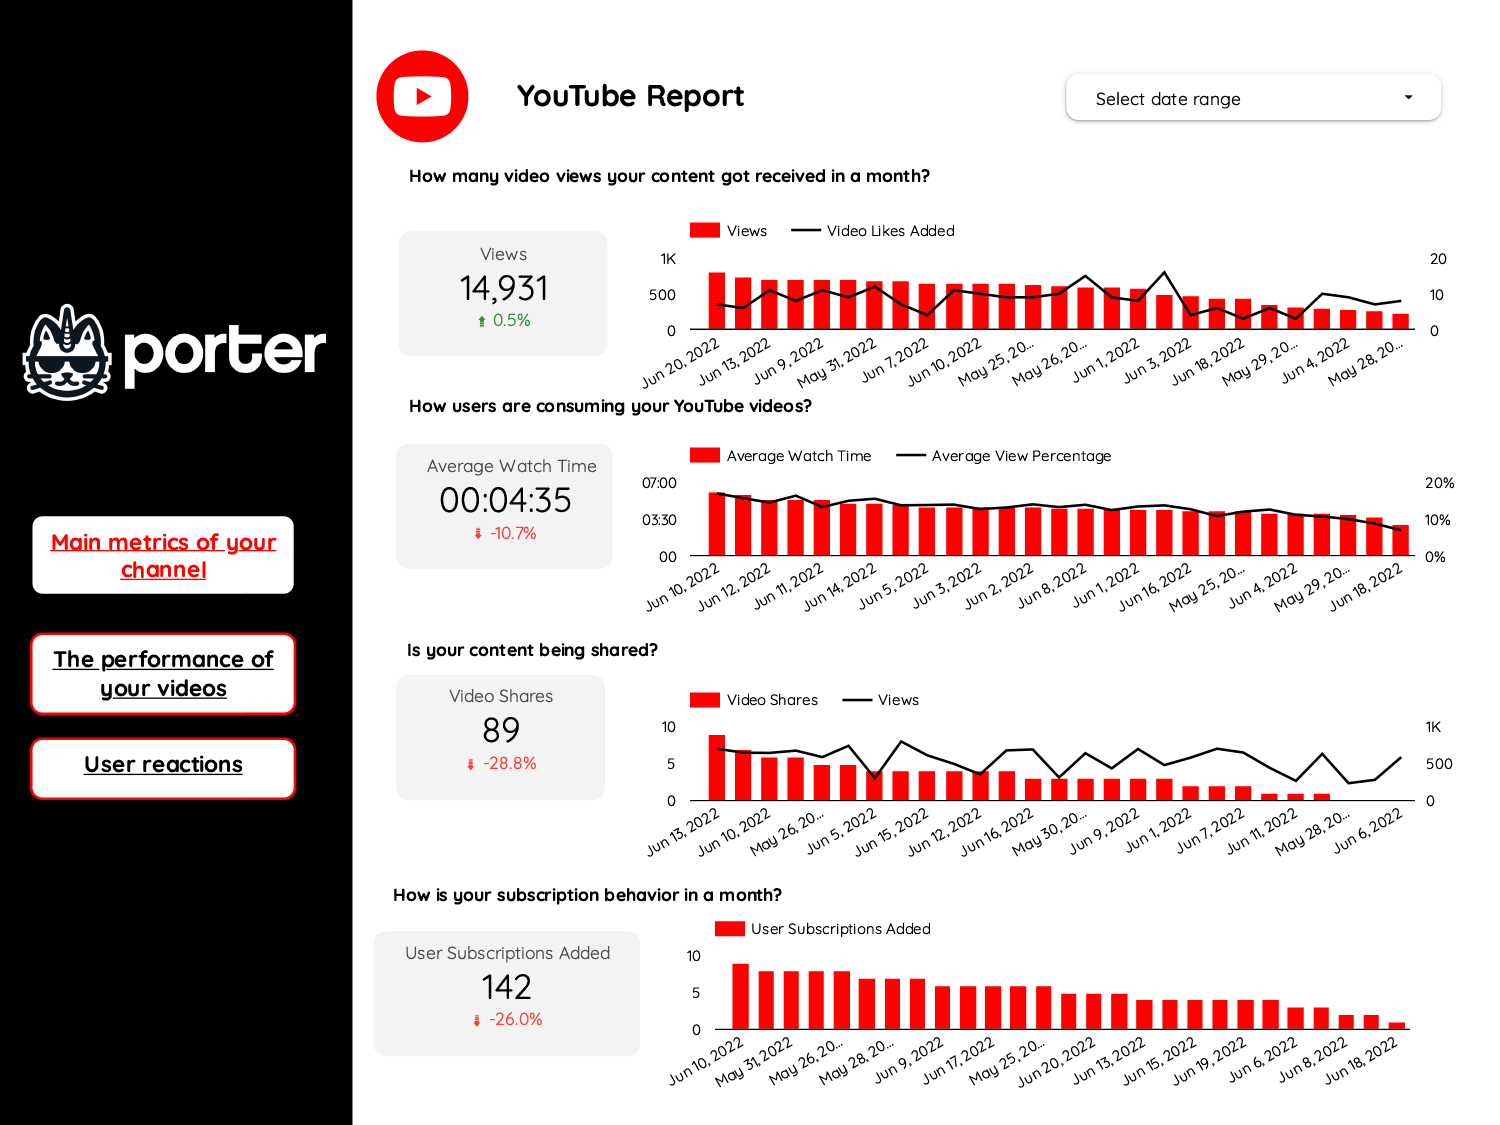
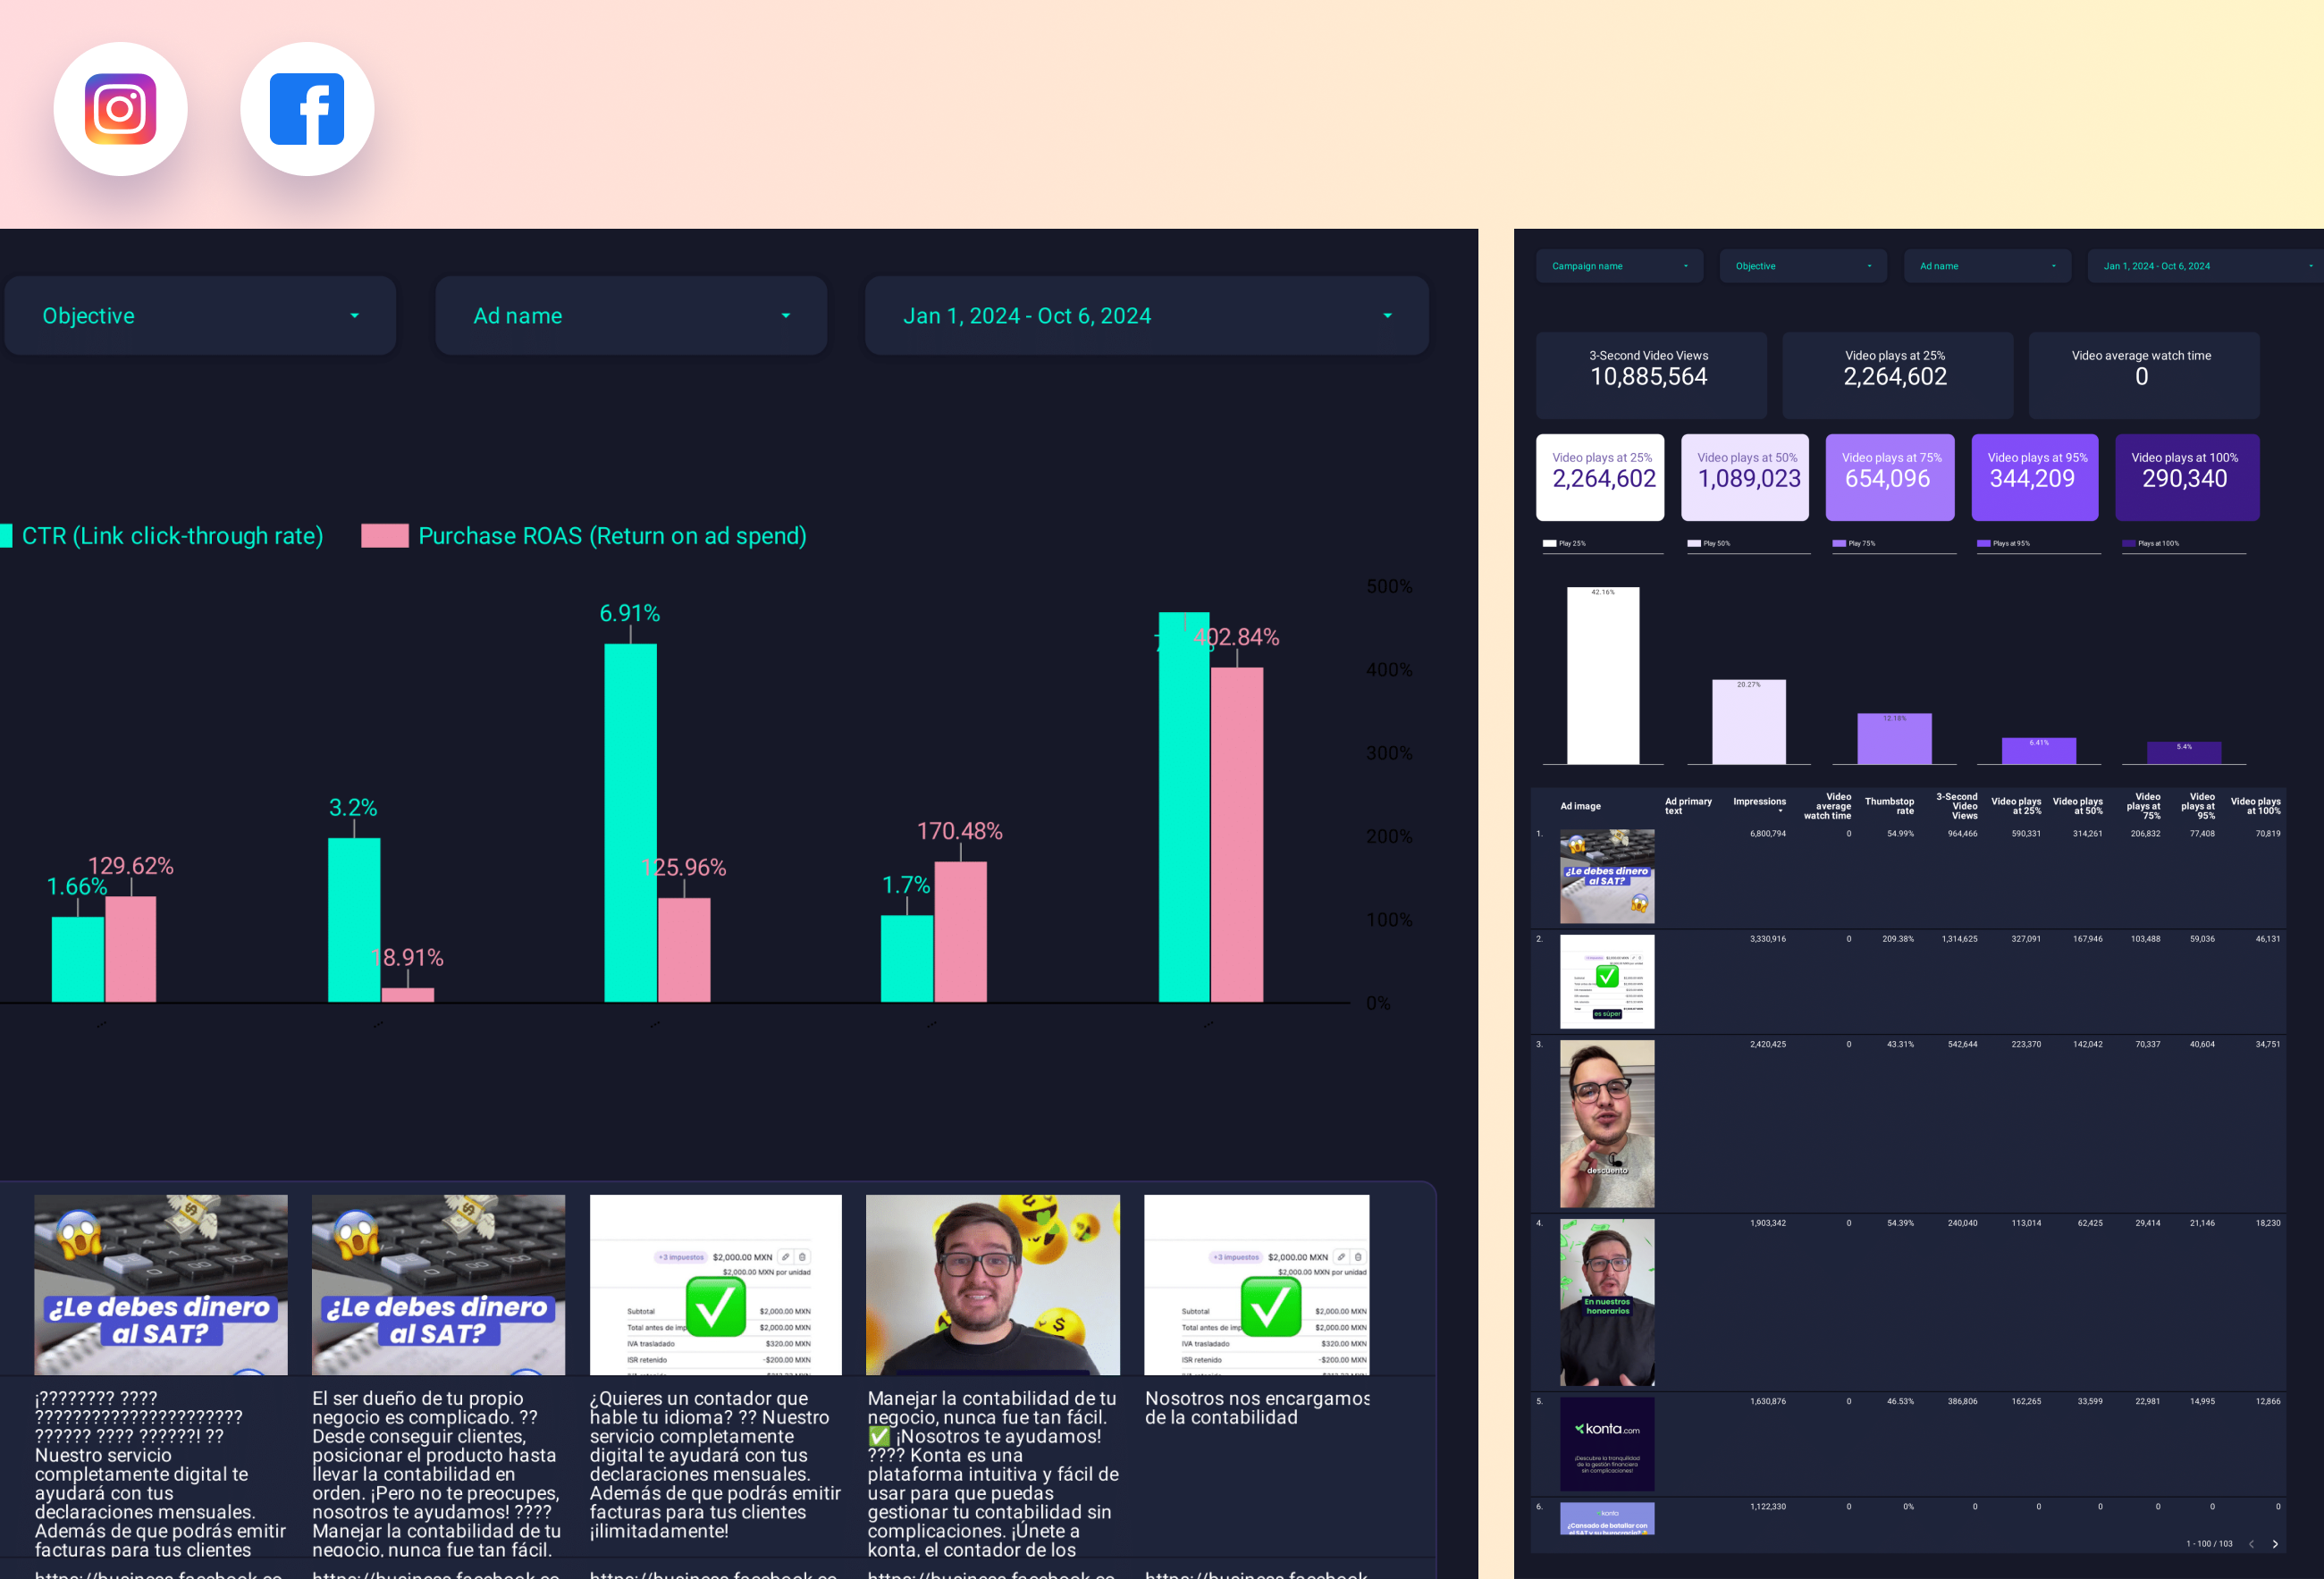
Video marketing Report template for Data Studio by Porter
Mide video views, reach → watch time, completion rate → CTA clicks, subscriber growth. Segmenta por platform, video type.
PPC Campaign performance Report template for Data Studio by Porter
Mide campaign impressions, SOV → CTR, CPC per campaign → ROAS, conversions per campaign. Segmenta por campaign, ad group, date.
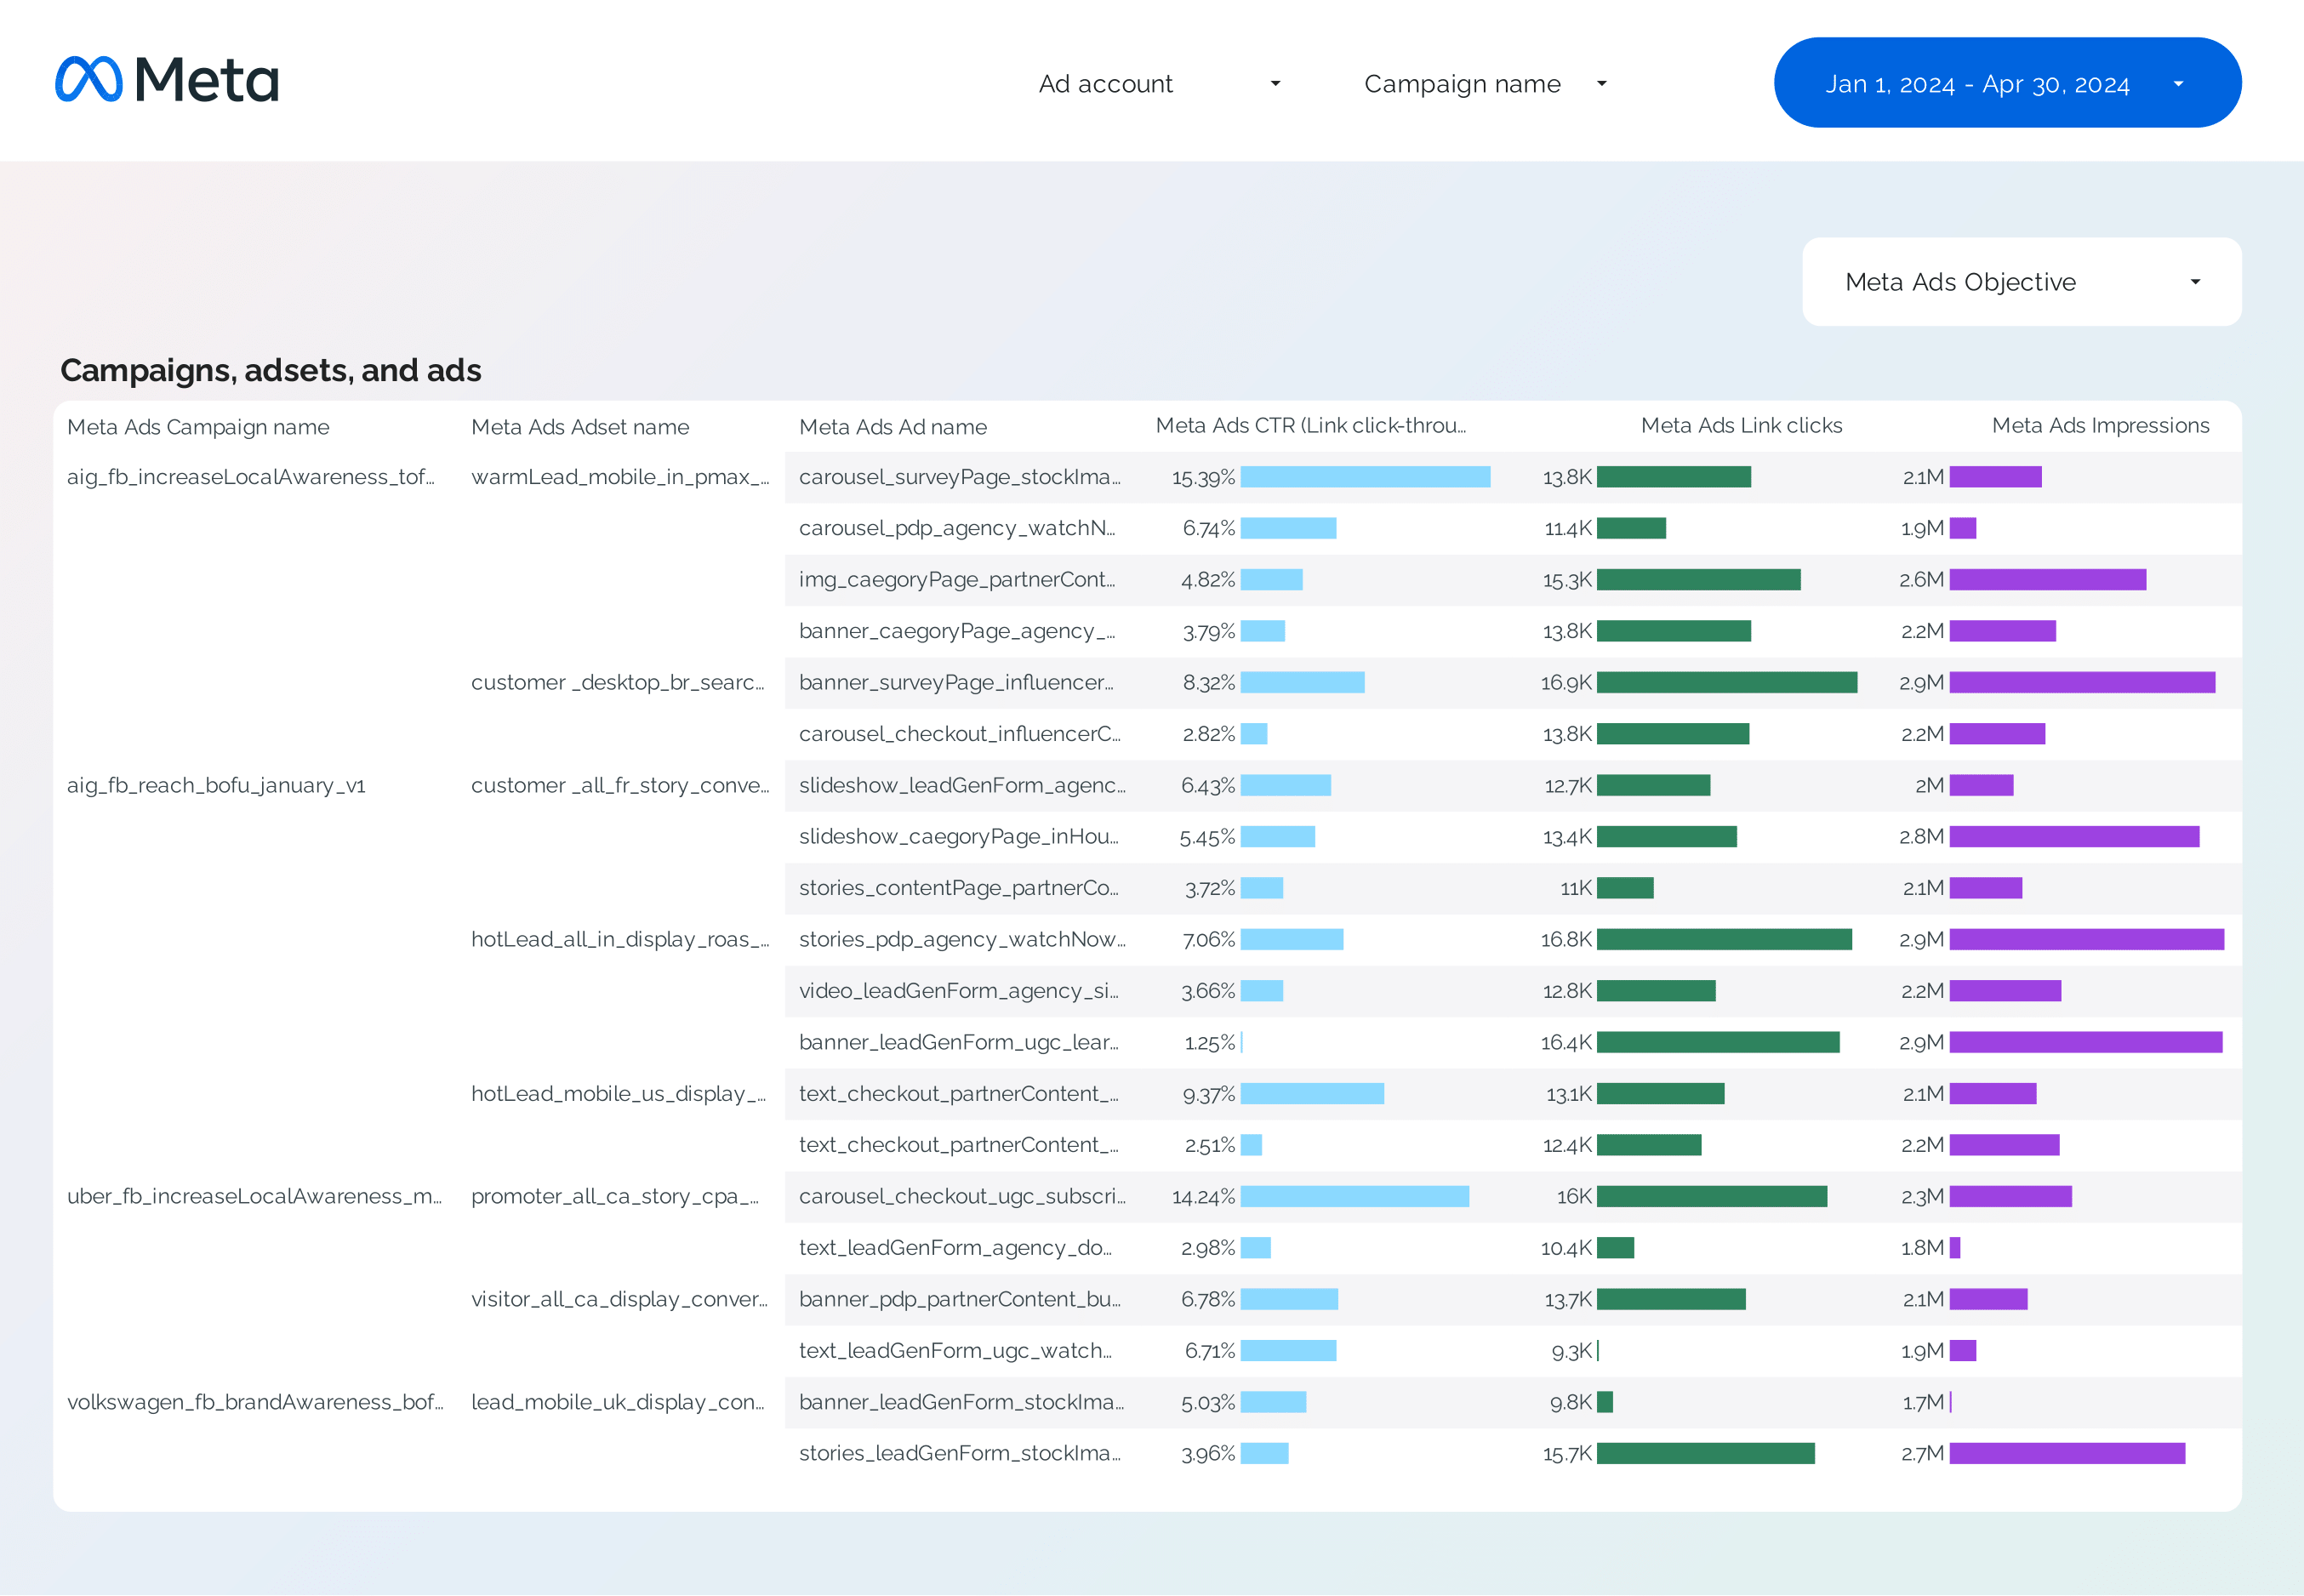
Facebook Ads Campaign performance Report template for Data Studio by Porter
Mide campaign reach, impressions → CTR, CPC by campaign → ROAS, CPA per campaign. Segmenta por campaign, objective, audience.
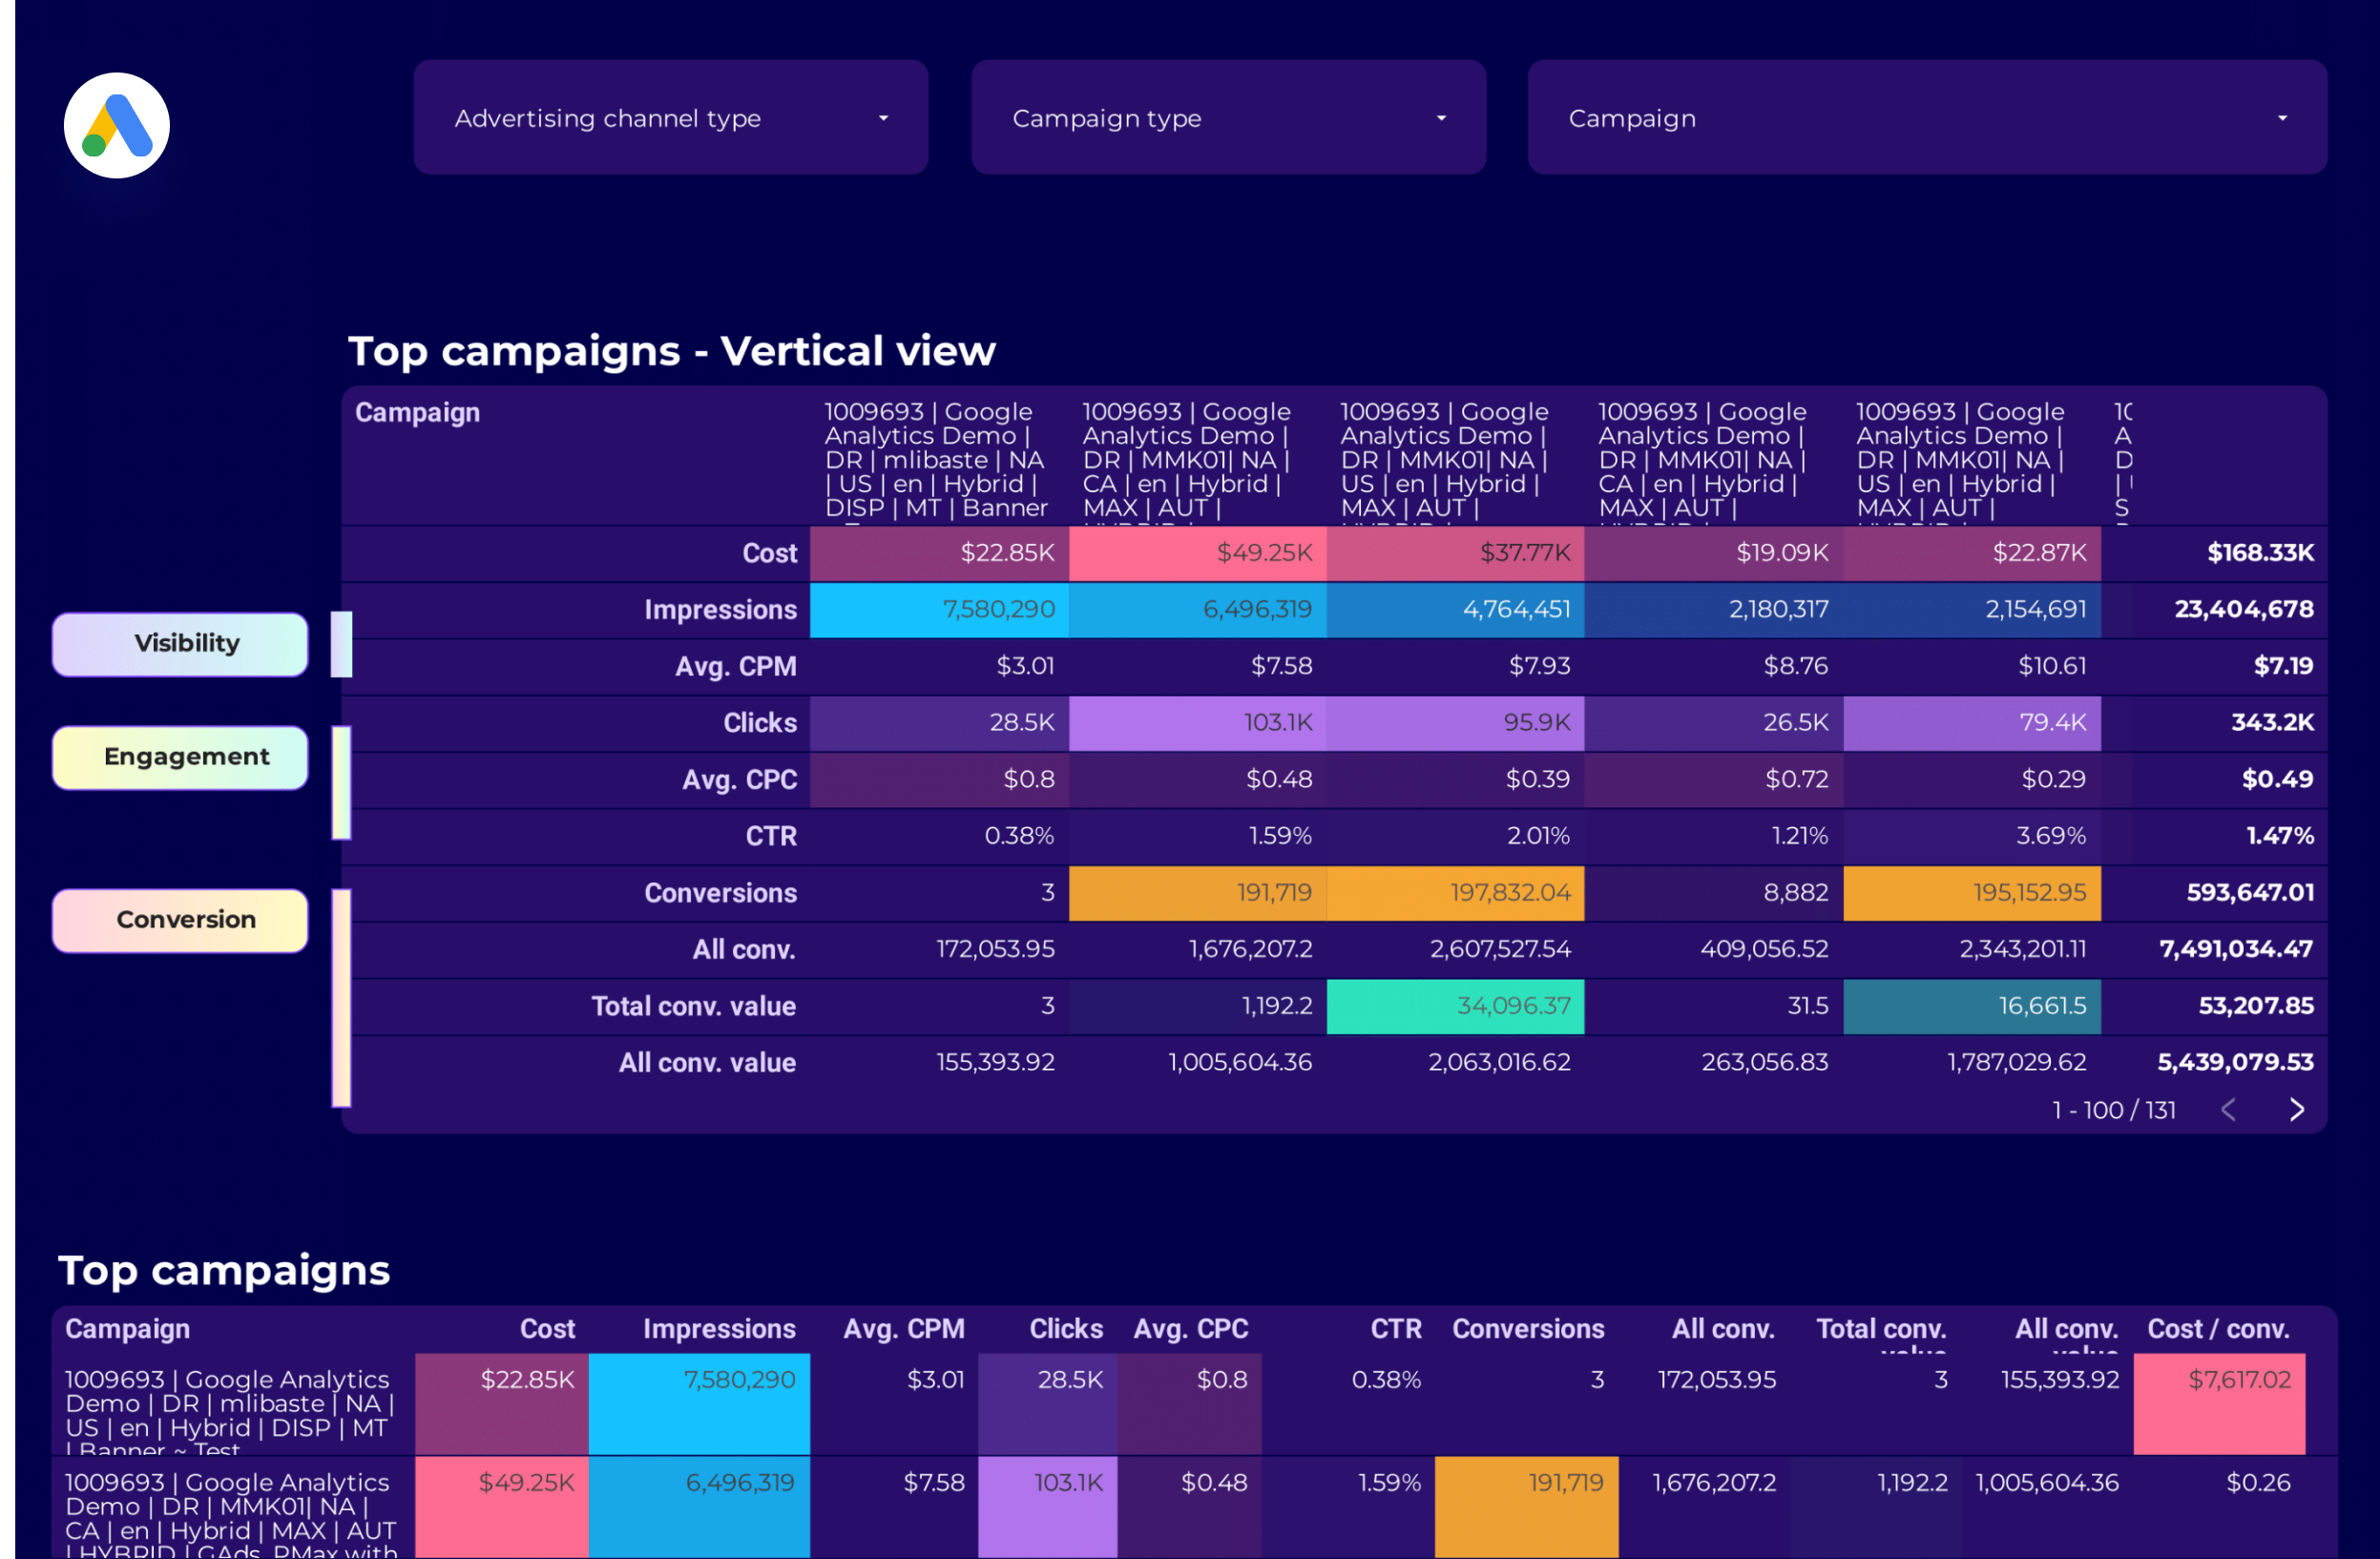
Google Ads Campaign performance Report template for Data Studio by Porter
Mide campaign impressions, reach → CTR, CPC by campaign → ROAS, conversions per campaign. Segmenta por campaign, network, device.
Paid media Creative performance Report template for Data Studio by Porter
Mide creative reach, frequency → CTR, view rate by creative → ROAS per creative, CPA. Segmenta por creative format, platform.
PPC Creative performance Report template for Data Studio by Porter
Mide creative impressions, frequency → CTR by creative, hook rate → ROAS per creative variant. Segmenta por creative, format, copy.
PPC KPIs Report template for Data Studio by Porter
Mide impression trends vs target → CTR vs benchmark, CPC tracking → ROAS attainment, CPA vs target. Segmenta por KPI, platform, campaign.

Facebook Ads Creative performance Report template for Data Studio by Porter
Mide ad impressions by creative → CTR, hook rate, hold rate → ROAS per creative, CPA. Segmenta por creative format, copy.
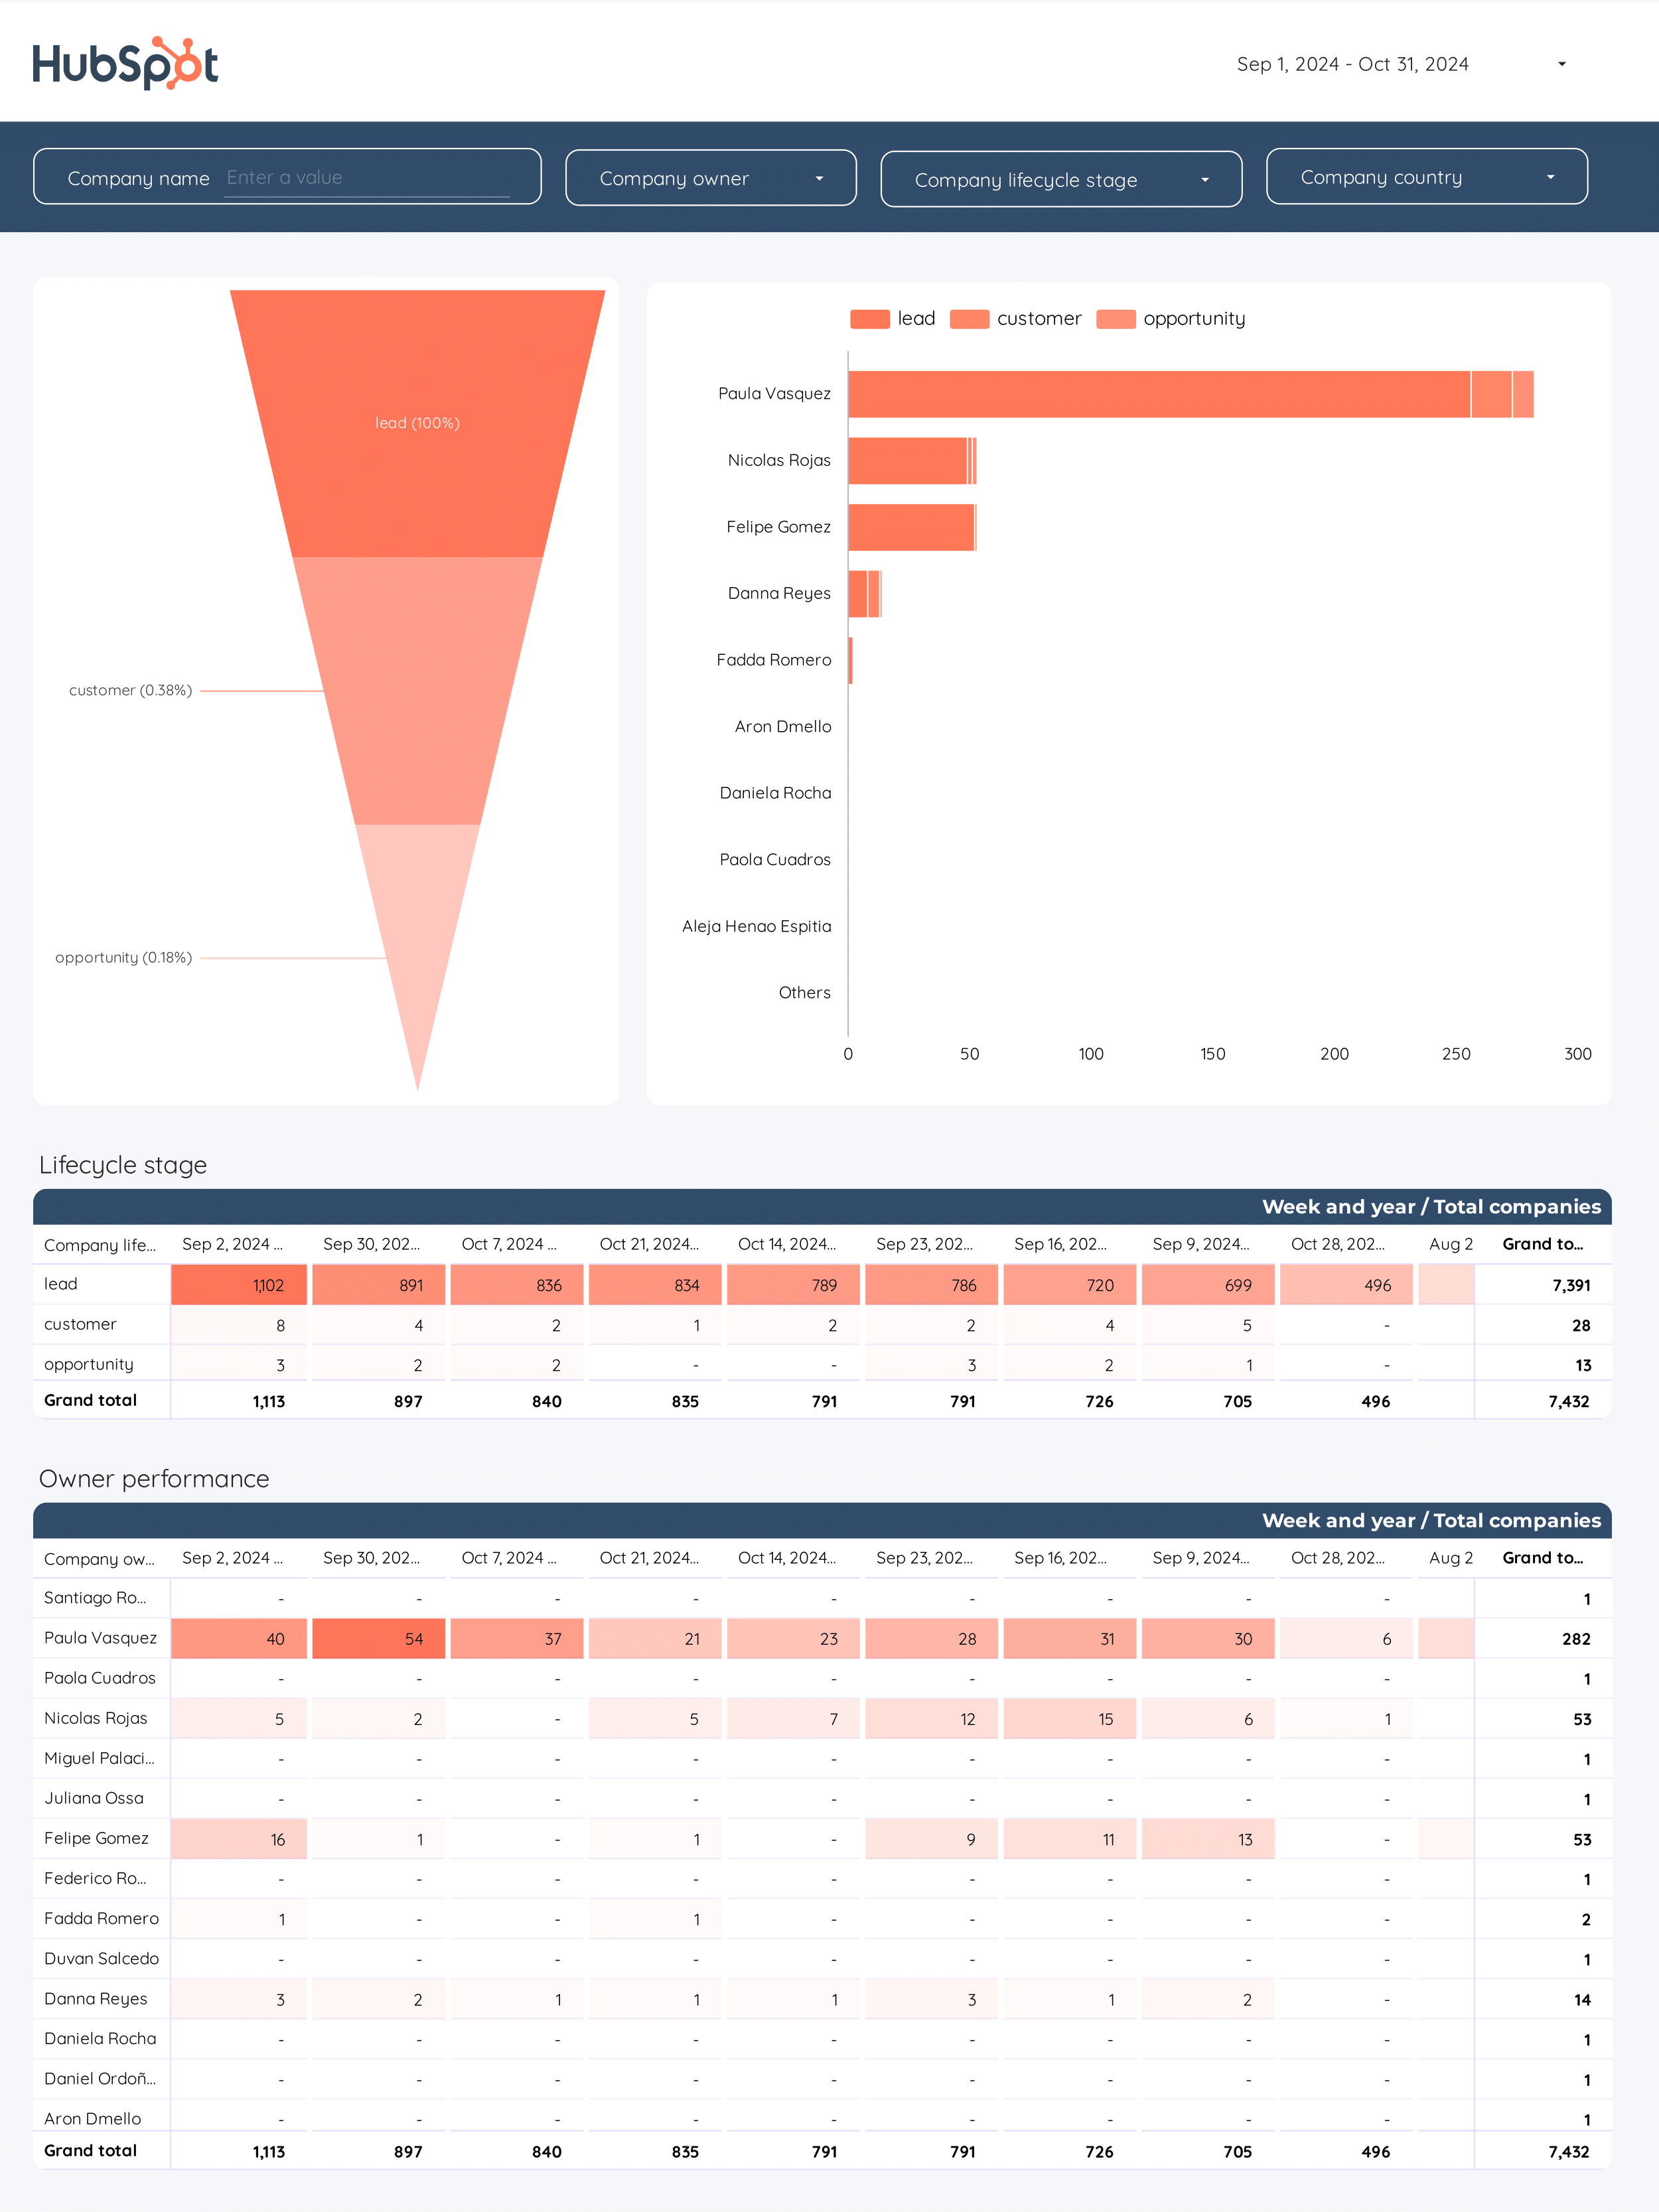
B2B Funnel Report template for Data Studio by Porter
Mide account reach, ad impressions → content engagement, demo requests → pipeline value, deal velocity. Segmenta por account tier, channel.
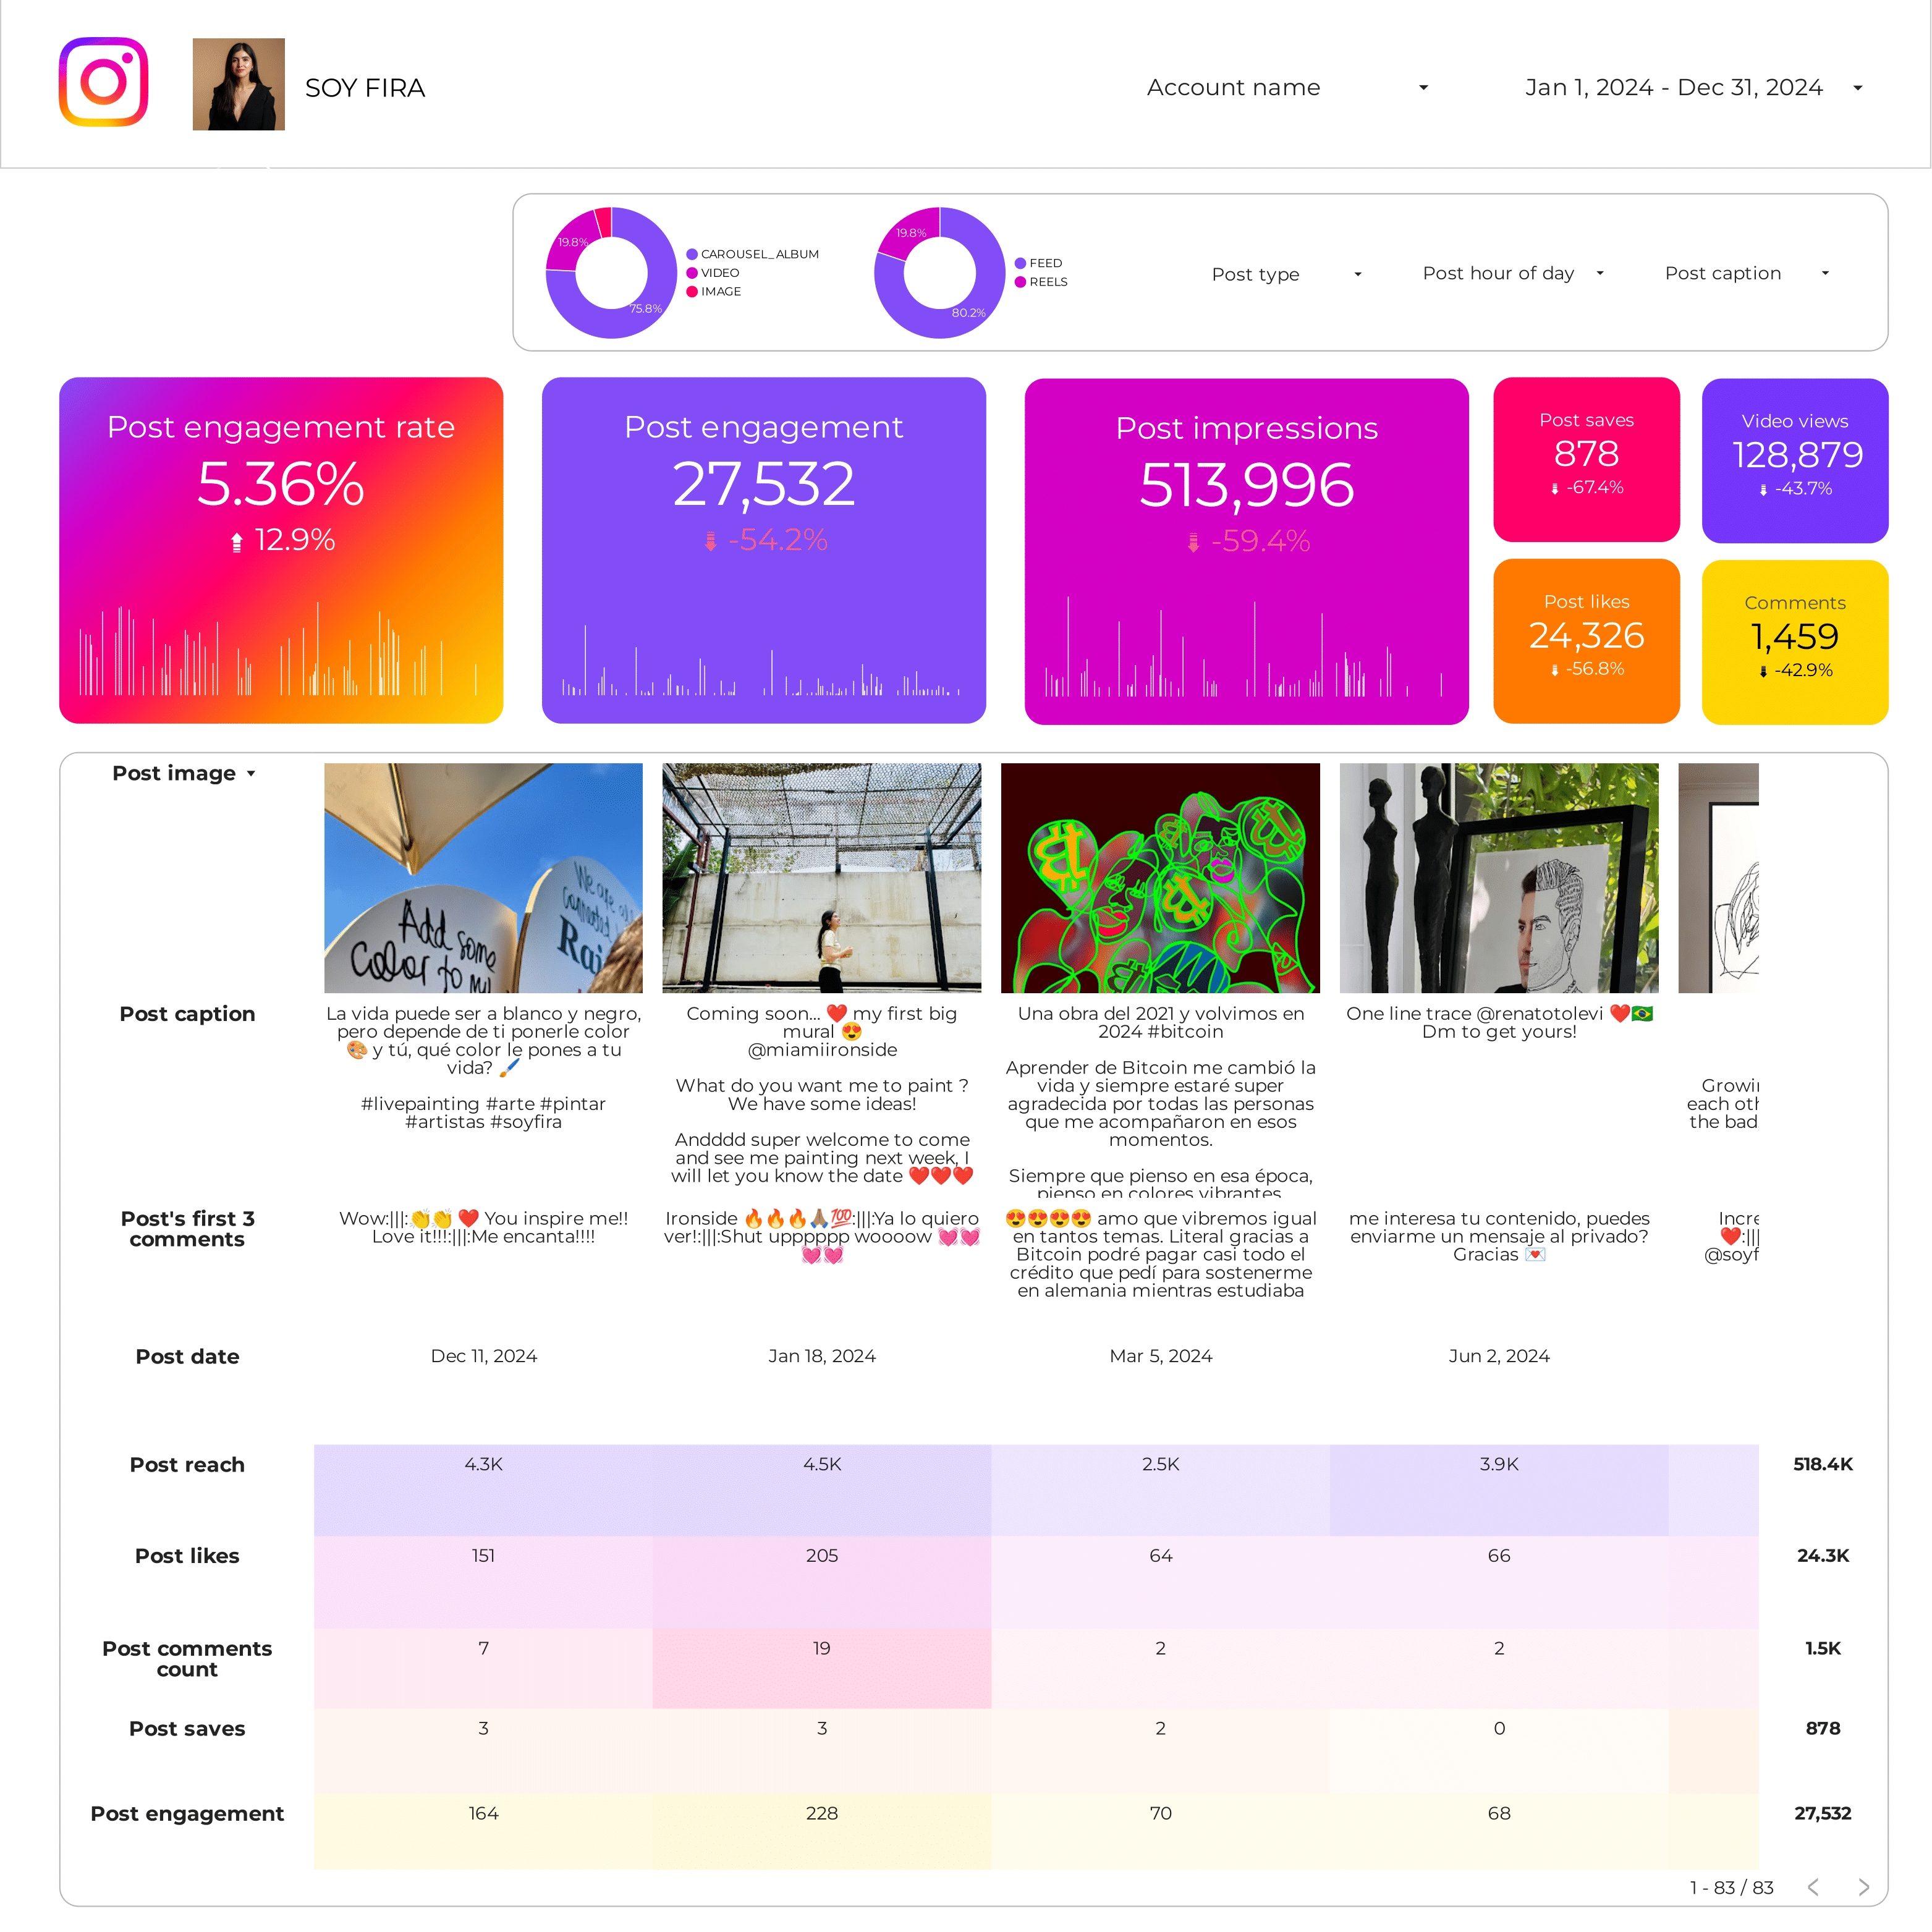
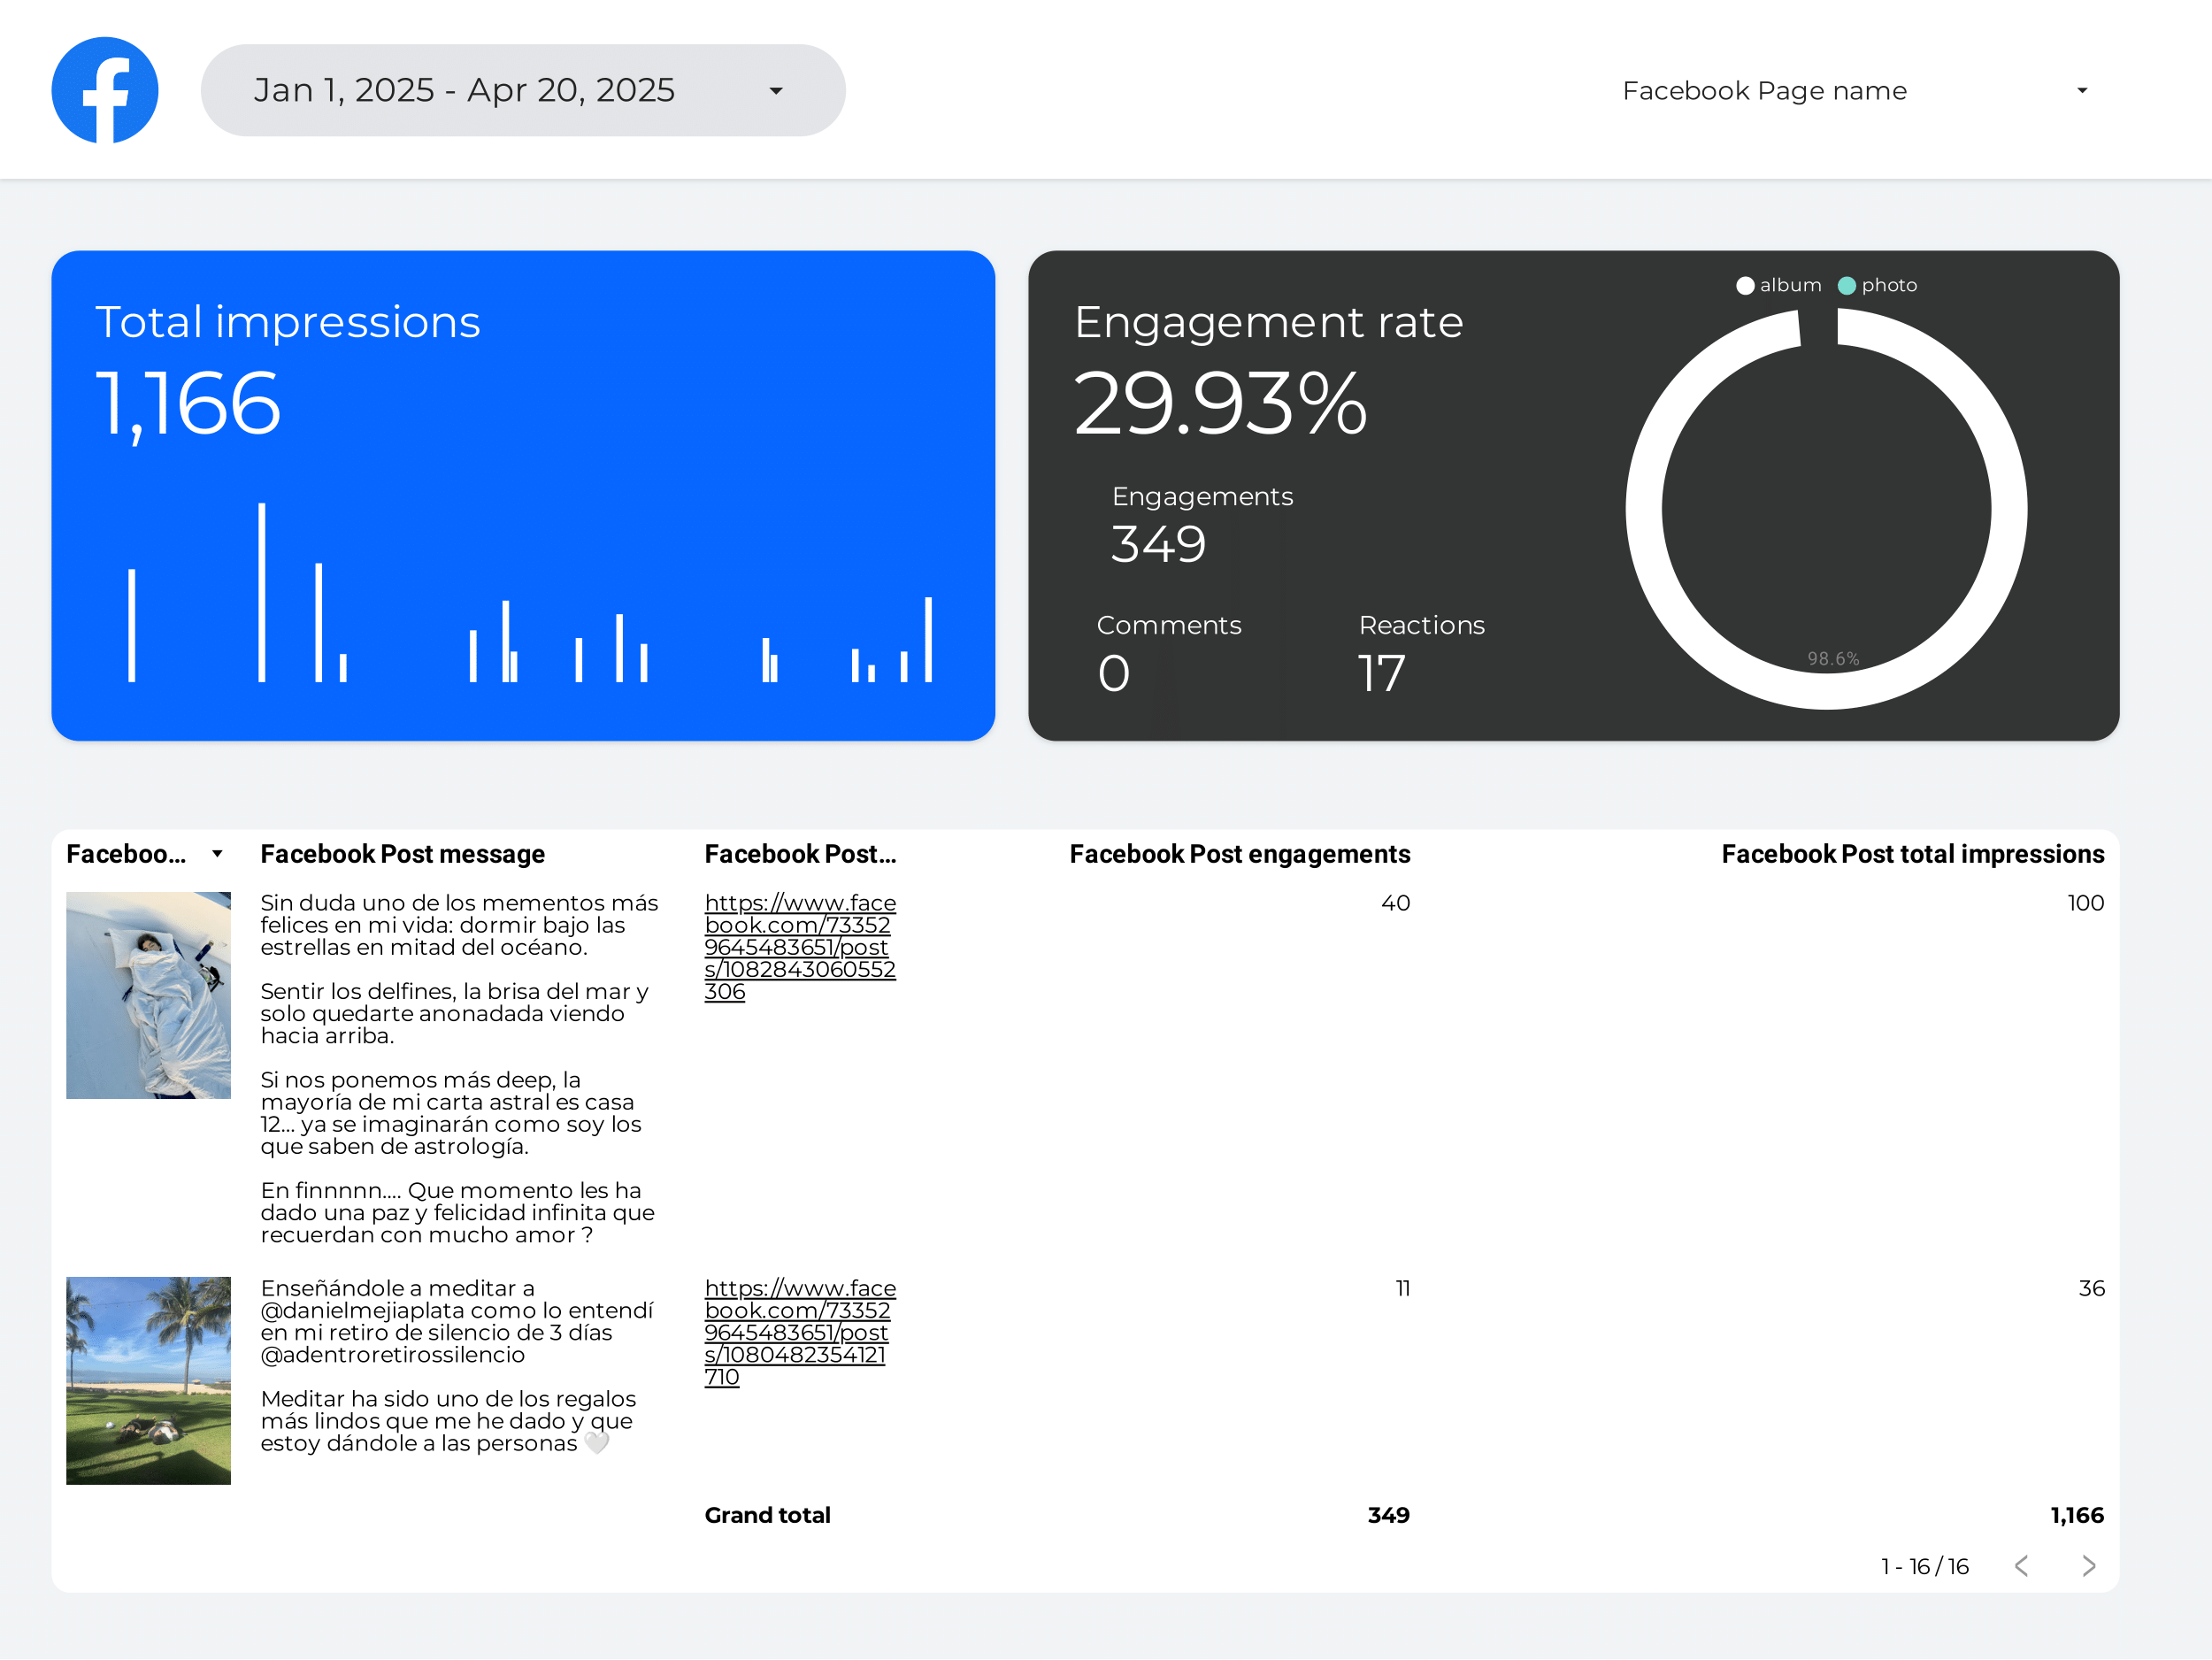
Instagram Insights Post performance Report template for Data Studio by Porter
Mide post reach, impressions → likes, comments, saves per post → CTR to profile, website taps. Segmenta por post format, topic, time.
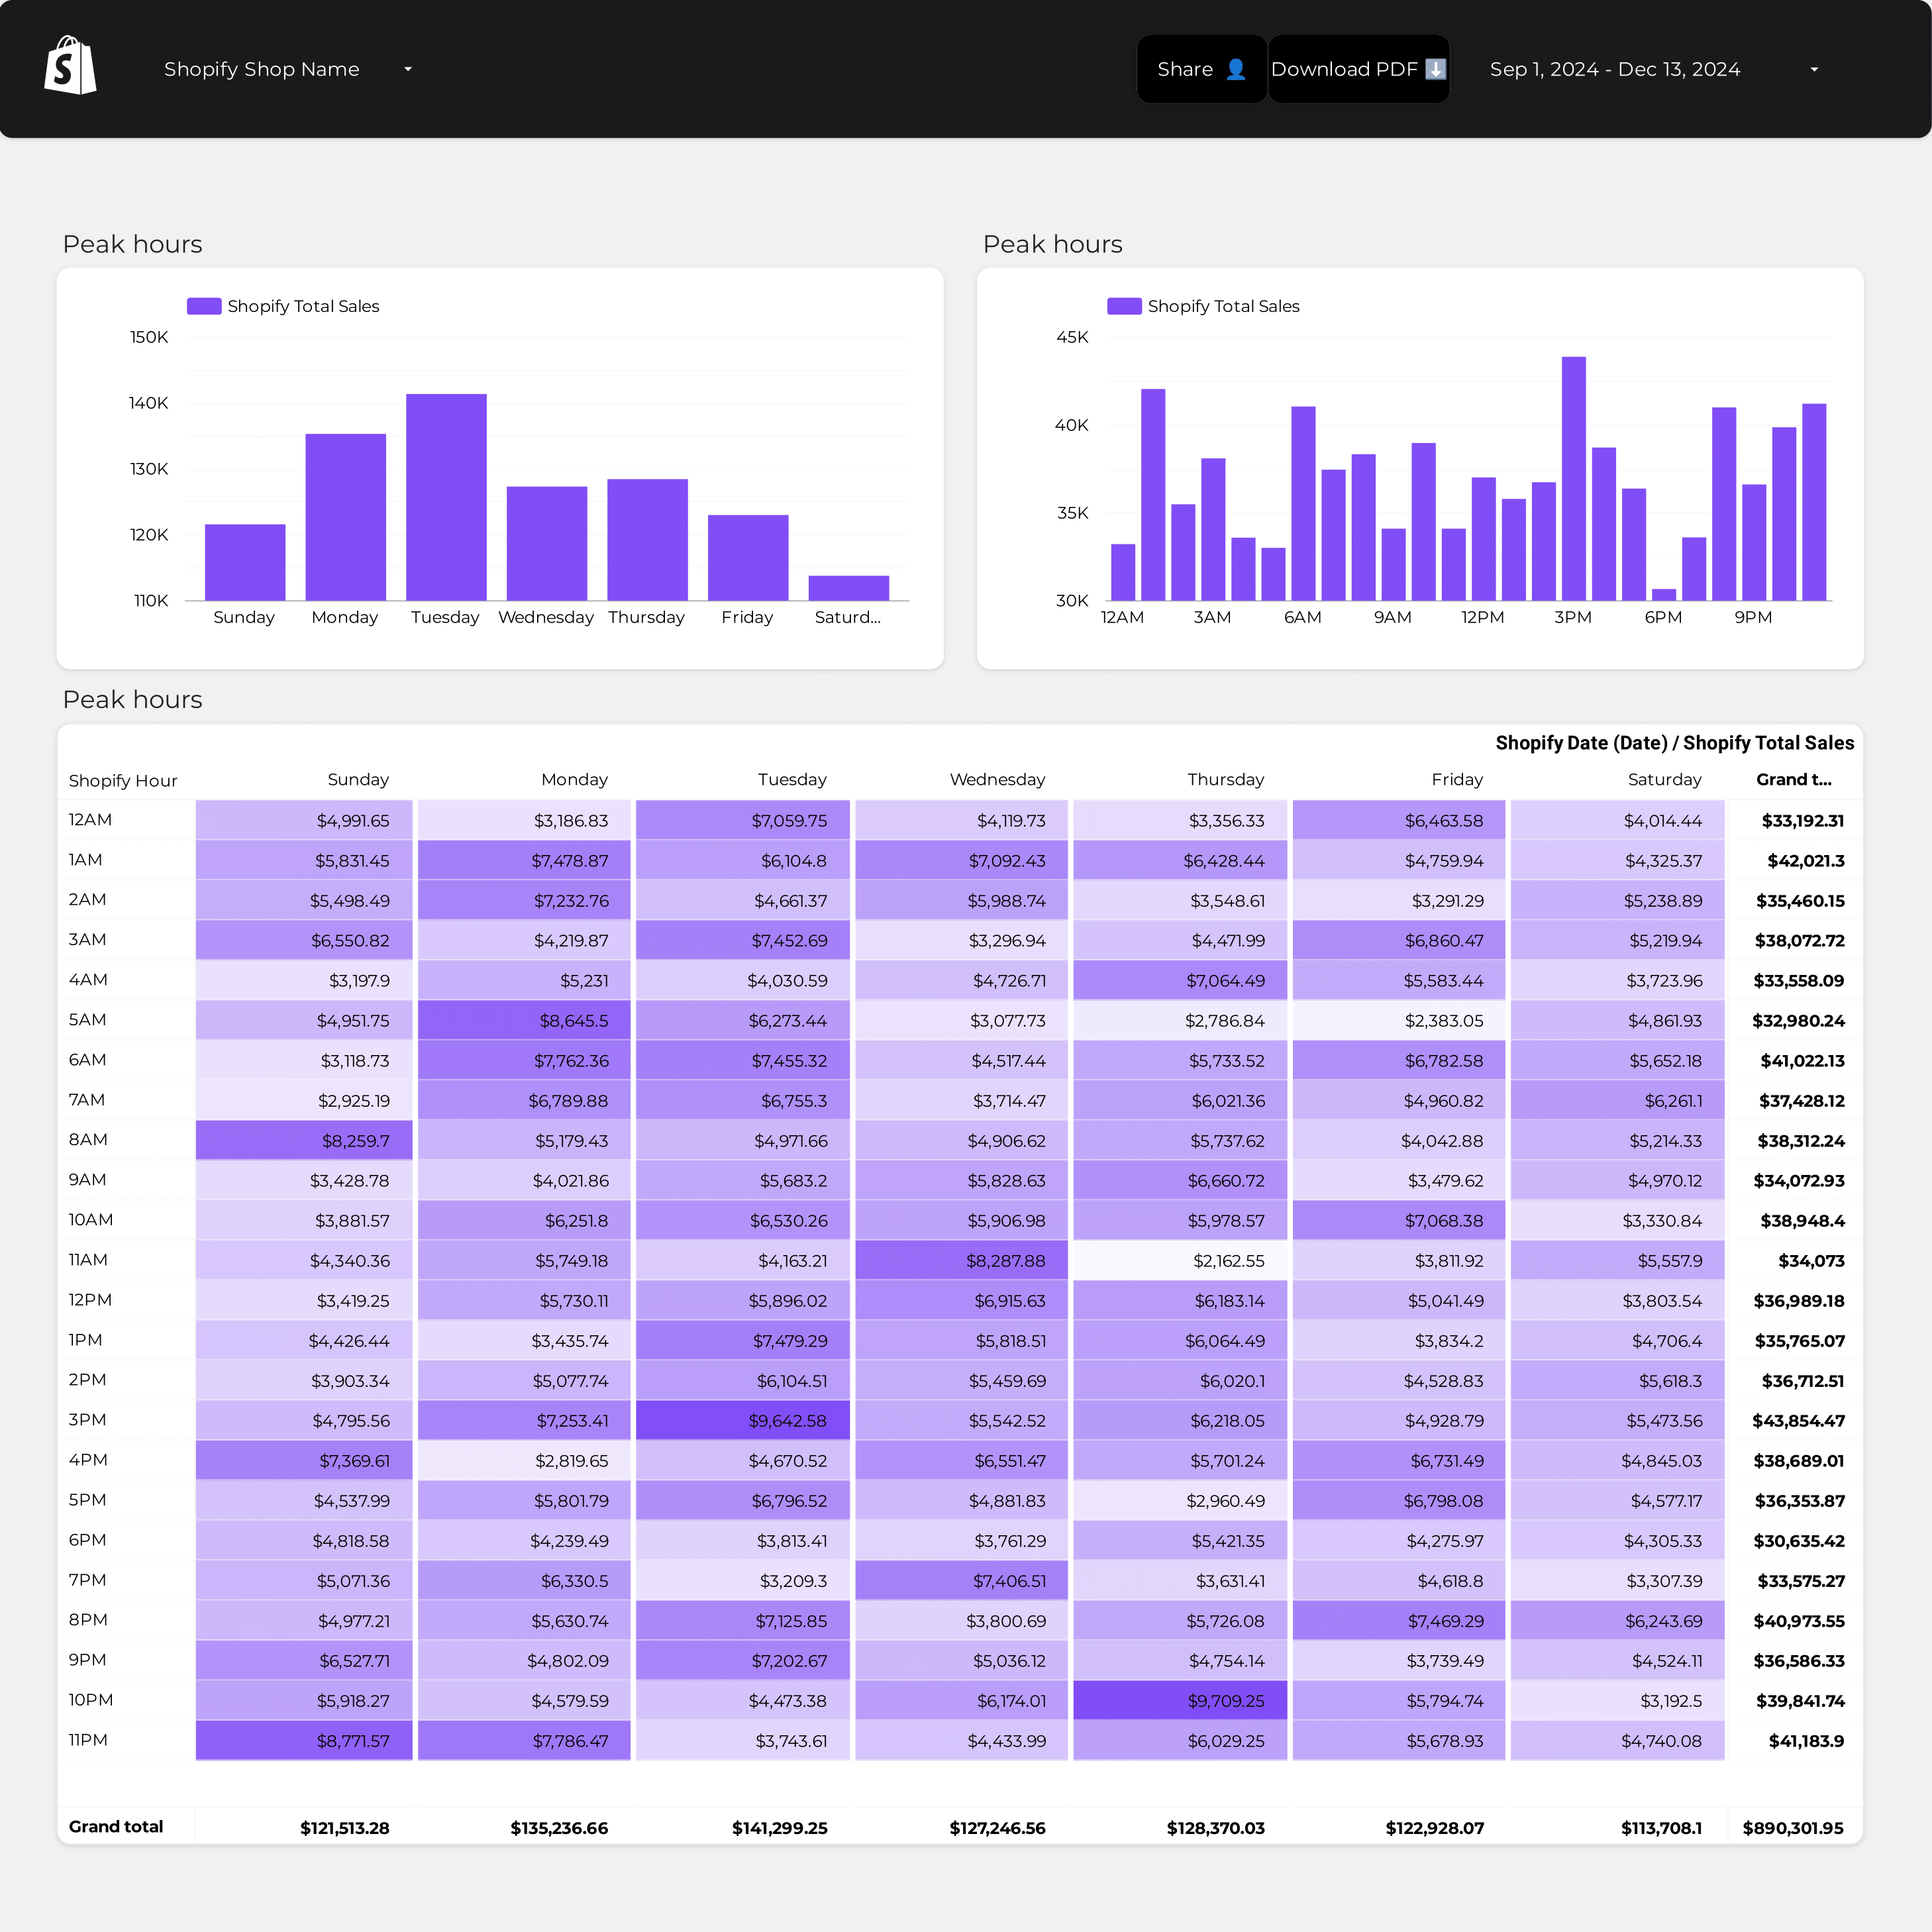
Shopify Store performance Report template for Data Studio by Porter
Mide store sessions, product views → add-to-cart rate, abandonment → orders, revenue, conversion. Segmenta por product, source, device.
What is a data analytics dashboard on Data Studio?
A data analytics dashboard on Data Studio is a visual report that connects to multiple data sources—GA4, ad platforms, CRM, e-commerce—to track and display KPIs in real time. It enables analysts, marketers, and executives to monitor performance, spot trends, and make data-driven decisions at a glance.
These free data analytics dashboard templates for Data Studio connect to your data sources and update automatically. These templates cover popular search terms like dashboard reporting examples, what is a dashboard in business, what is dashboard in website. Customize any template with your branding, metrics, and filters to create professional data analytics reports in minutes.
80+ data sources: With Porter Metrics, connect Google Ads, Meta Ads, GA4, Search Console, Shopify, HubSpot, and more to build analytics dashboards in minutes.
Why use a data analytics dashboard?
Centralize your data
Pull data from multiple platforms into one dashboard. Our cross-channel template unifies marketing data across all sources.
Custom visualizations
Build charts, tables, and scorecards tailored to your analysis. Use Data Studio charts and calculated fields for custom metrics.
Save reporting time
Dashboards update automatically. Schedule delivery so reports arrive without manual work.
Collaborate and share
Share live dashboards with your team, export to PDF, or embed on websites. Control view and edit permissions.
How to build a data analytics dashboard
Select metrics and dimensions
Choose your KPIs, breakdowns, and chart types. Use calculated fields and regex for advanced analysis.

Connect Google Analytics 4 to Data Studio
Porter Metrics
How To Design Marketing Reports on Data Studio
Porter MetricsKey metrics for a data analytics dashboard
Traffic & Acquisition
- Sessions — total visits
- Users — unique visitors
- Source/medium — traffic attribution
- New vs. returning — audience mix
Performance
- Conversion rate — goal completion
- Revenue — total and by channel
- ROAS — ad spend efficiency
- CPA — cost per acquisition
Engagement
- Bounce rate — session quality
- Session duration — time on site
- Pages per session — content depth
- Engagement rate — GA4 metric
Custom Metrics
- Calculated fields — custom KPIs
- Blended data — cross-source metrics
- Goal tracking — progress vs. targets
- Cohort analysis — user behavior over time
Start building your analytics dashboard today
Connect 80+ data sources in minutes. Build custom dashboards and automate reporting on Data Studio. Get started for free →