

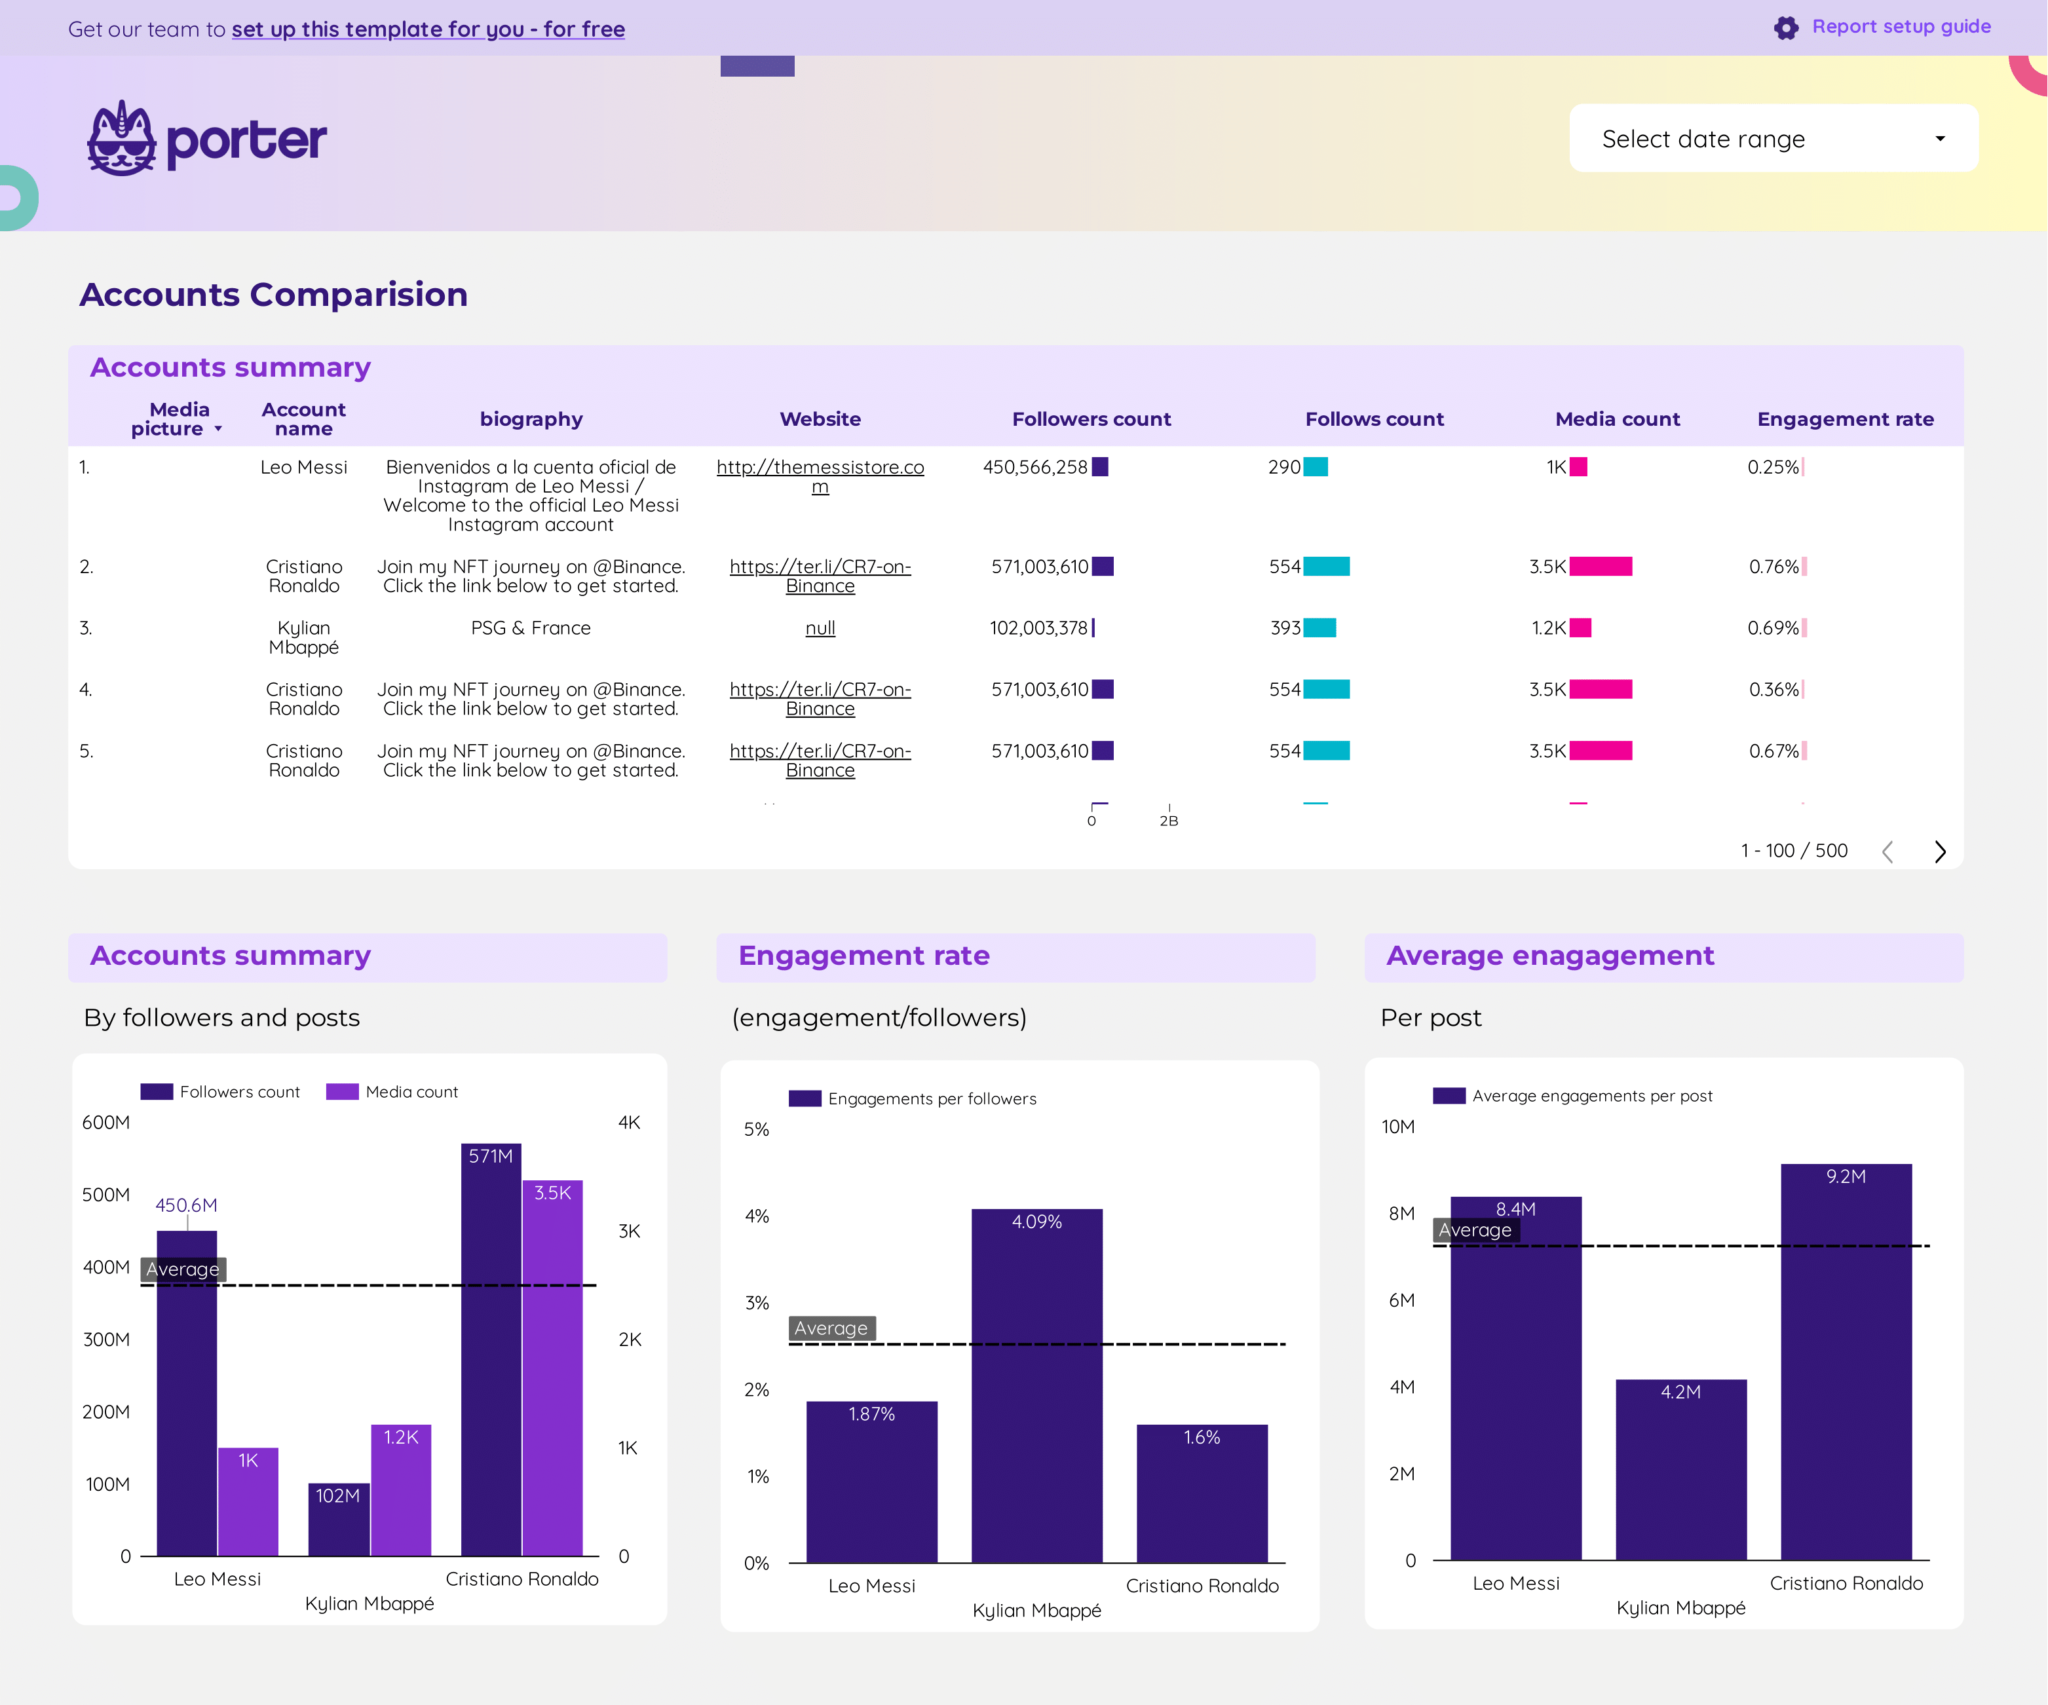
Competitors analysis Dashboard template
The Competitors Analysis Dashboard template provides a structured approach to evaluating your market position using Instagram Public Data and Facebook Public Data. This template is designed for marketing professionals seeking to leverage social media insights for strategic decision-making.
Utilize Instagram Insights and Facebook Insights to track and compare competitor performance. The dashboard offers a detailed view of various metrics, enabling you to understand competitor strategies and audience engagement.
- Engagement Metrics: Analyze likes, comments, and shares to gauge audience interaction.
- Follower Growth: Monitor changes in follower counts to assess brand popularity.
- Content Performance: Evaluate the effectiveness of different content types and posting frequencies.
- Audience Demographics: Compare age, gender, and location data to identify target market segments.
This dashboard template is an essential tool for marketers aiming to optimize their social media strategies by understanding competitive dynamics and audience preferences.
Facebook Ads KPI tracker Dashboard template
Track your Facebook Ads performance with our KPI Tracker Dashboard Template. This tool is designed for PPC professionals focused on goal tracking and optimizing ad spend.
Monitor essential KPIs such as:
- Click-Through Rate (CTR): Measure the effectiveness of your ad creatives.
- Conversion Rate: Track the percentage of users completing desired actions.
- Cost Per Click (CPC): Analyze the cost-effectiveness of your campaigns.
- Return on Ad Spend (ROAS): Evaluate the revenue generated for every dollar spent.
Utilize this dashboard to align your advertising strategies with business objectives, ensuring data-driven decisions in your Facebook Ads campaigns.
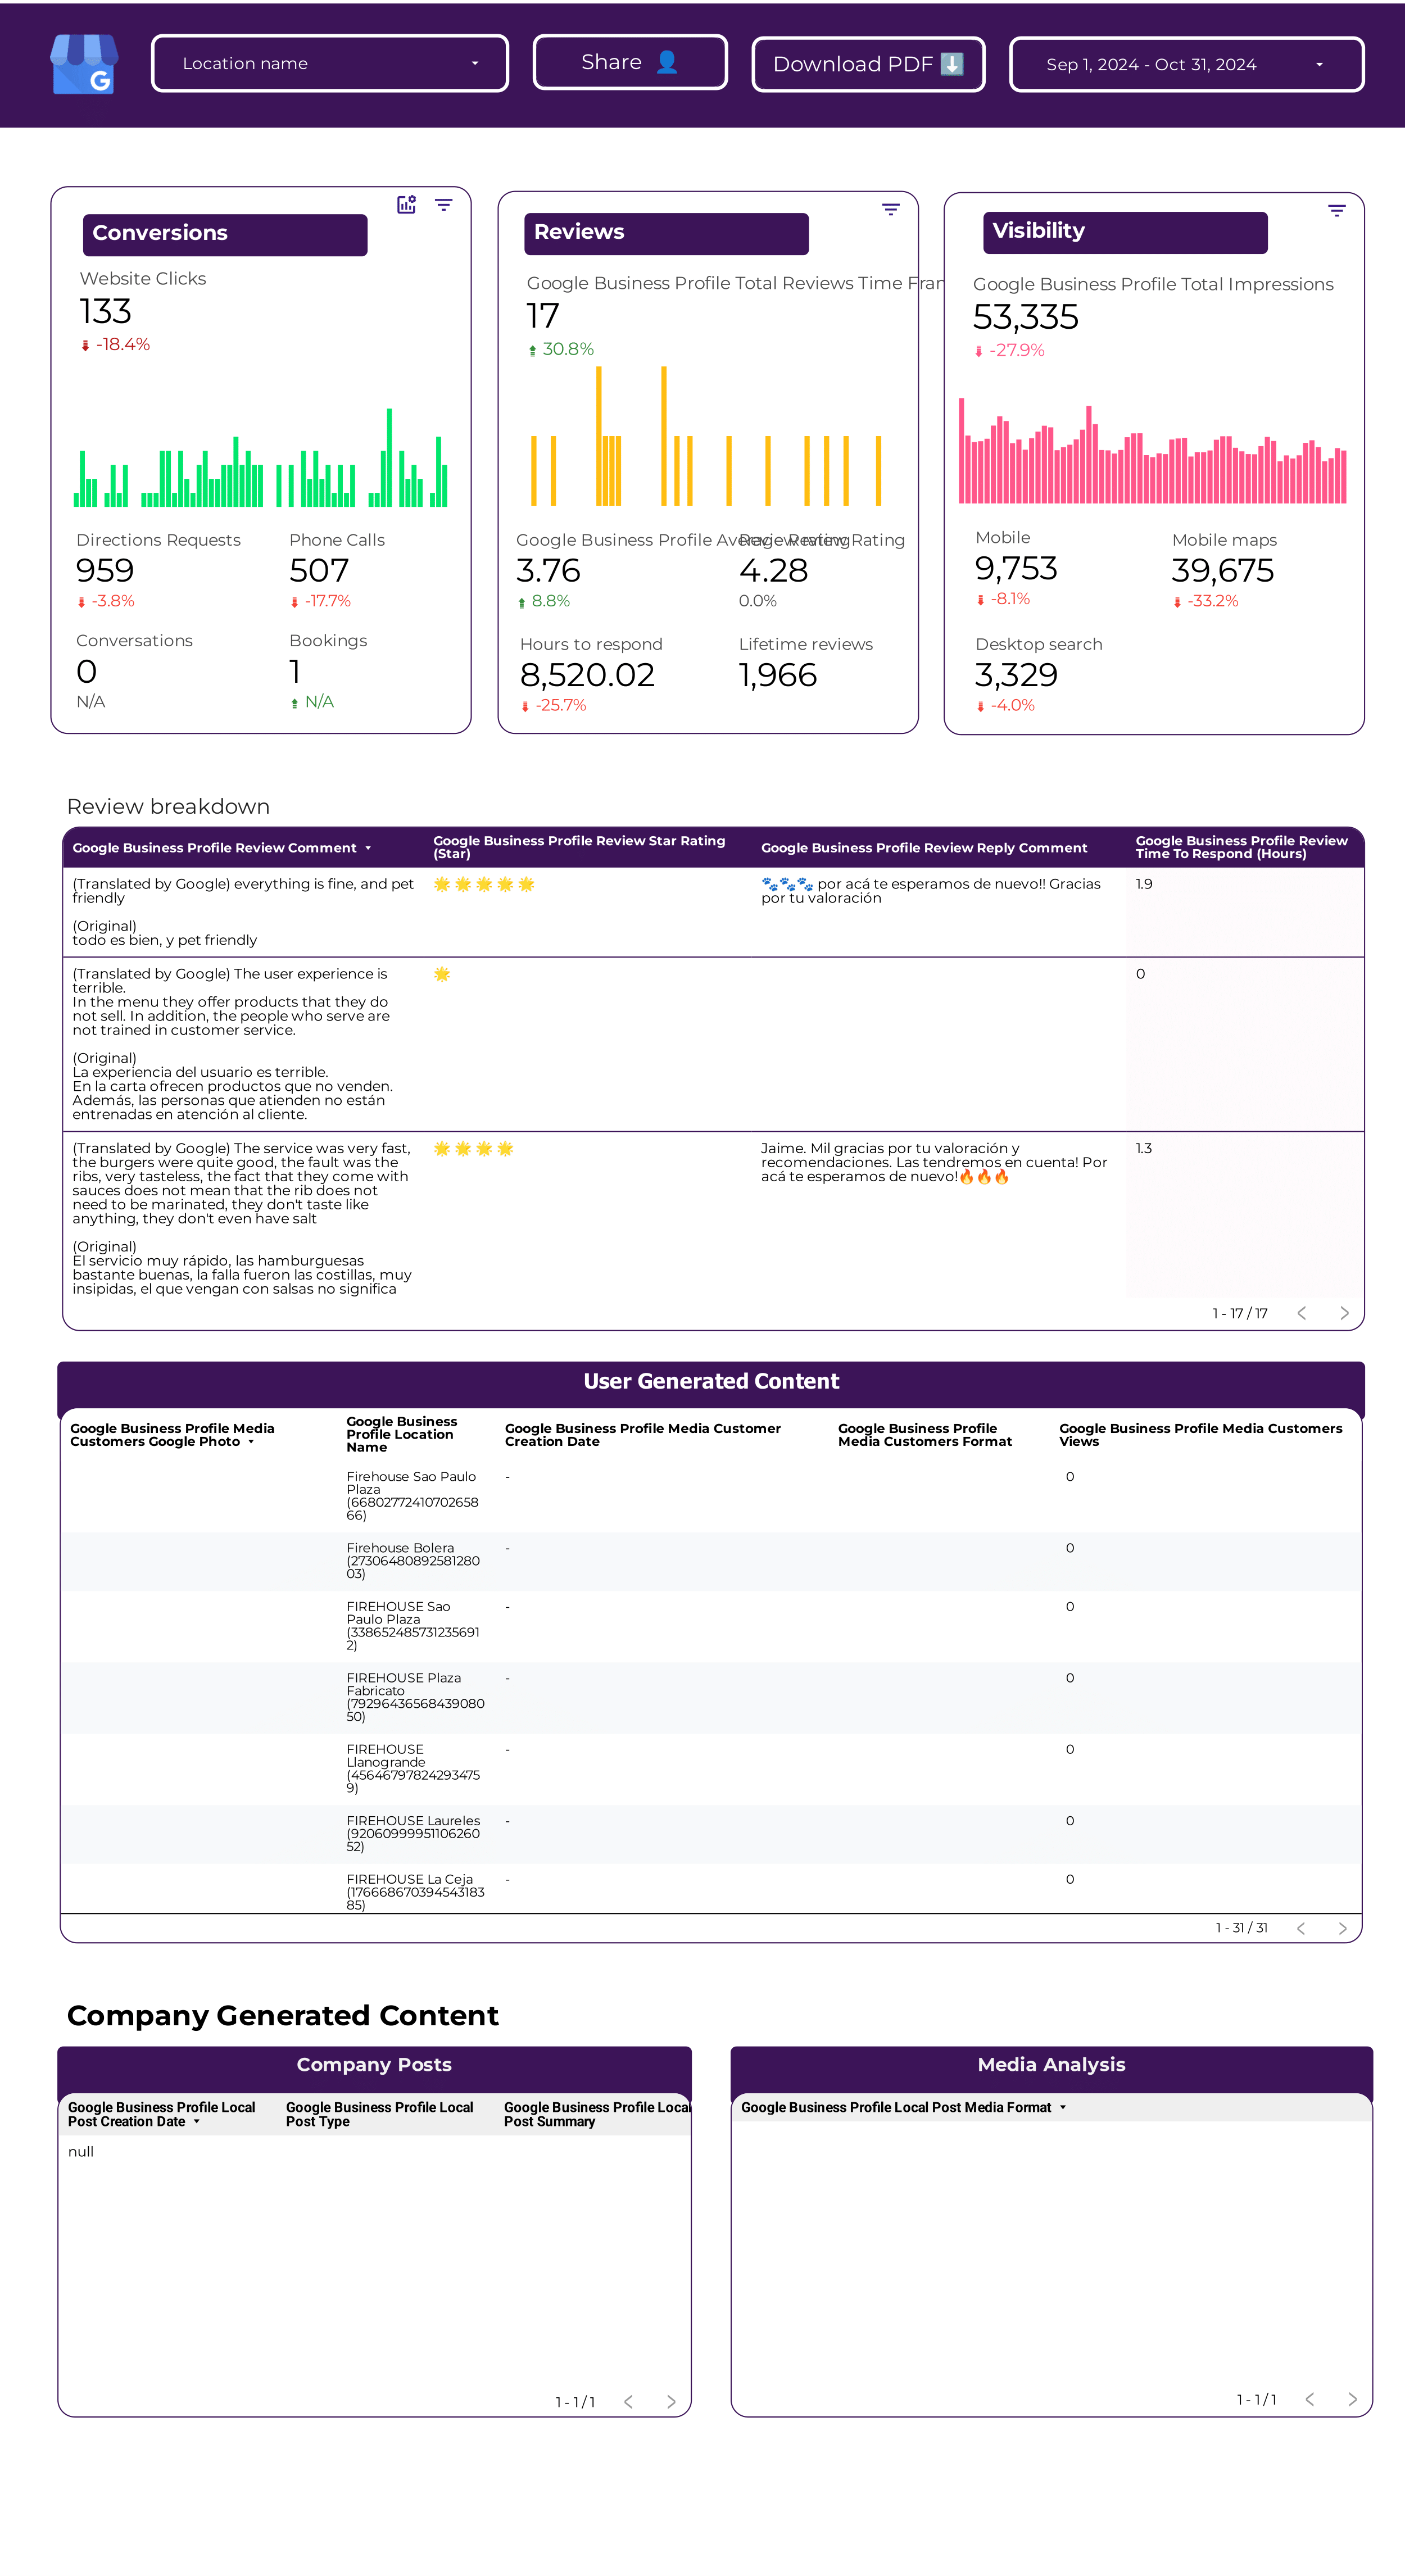
Google Business Profile Dashboard template
Optimize your Google Business Profile with our specialized Dashboard template designed for Local SEO strategies. This template provides a structured approach to managing and analyzing your business’s online presence.
Utilize the Dashboard to:
- Track and analyze local search performance metrics.
- Monitor customer engagement and feedback.
- Manage business information updates efficiently.
Stay ahead in local search results by leveraging data-driven insights from your Google Business Profile. This template is an essential tool for businesses aiming to improve their visibility and connect with local customers effectively.
Multi-channel Marketing performance Dashboard template
The Multi-channel Marketing Performance Dashboard template provides a centralized view of your marketing efforts across various platforms. This dashboard integrates data from Google Analytics 4, Instagram Insights, Google Ads, YouTube, Facebook Insights, Facebook Ads, LinkedIn Ads, TikTok Ads, and Twitter Ads.
With this template, you can:
- Track SEO performance and analyze website traffic using Google Analytics 4.
- Monitor social media engagement and audience growth through Instagram and Facebook Insights.
- Evaluate advertising campaigns across Google Ads, Facebook Ads, LinkedIn Ads, TikTok Ads, and Twitter Ads.
- Analyze video content performance on YouTube.
This dashboard template is designed to provide actionable insights by consolidating data from multiple channels, allowing for a streamlined analysis of marketing strategies and outcomes.
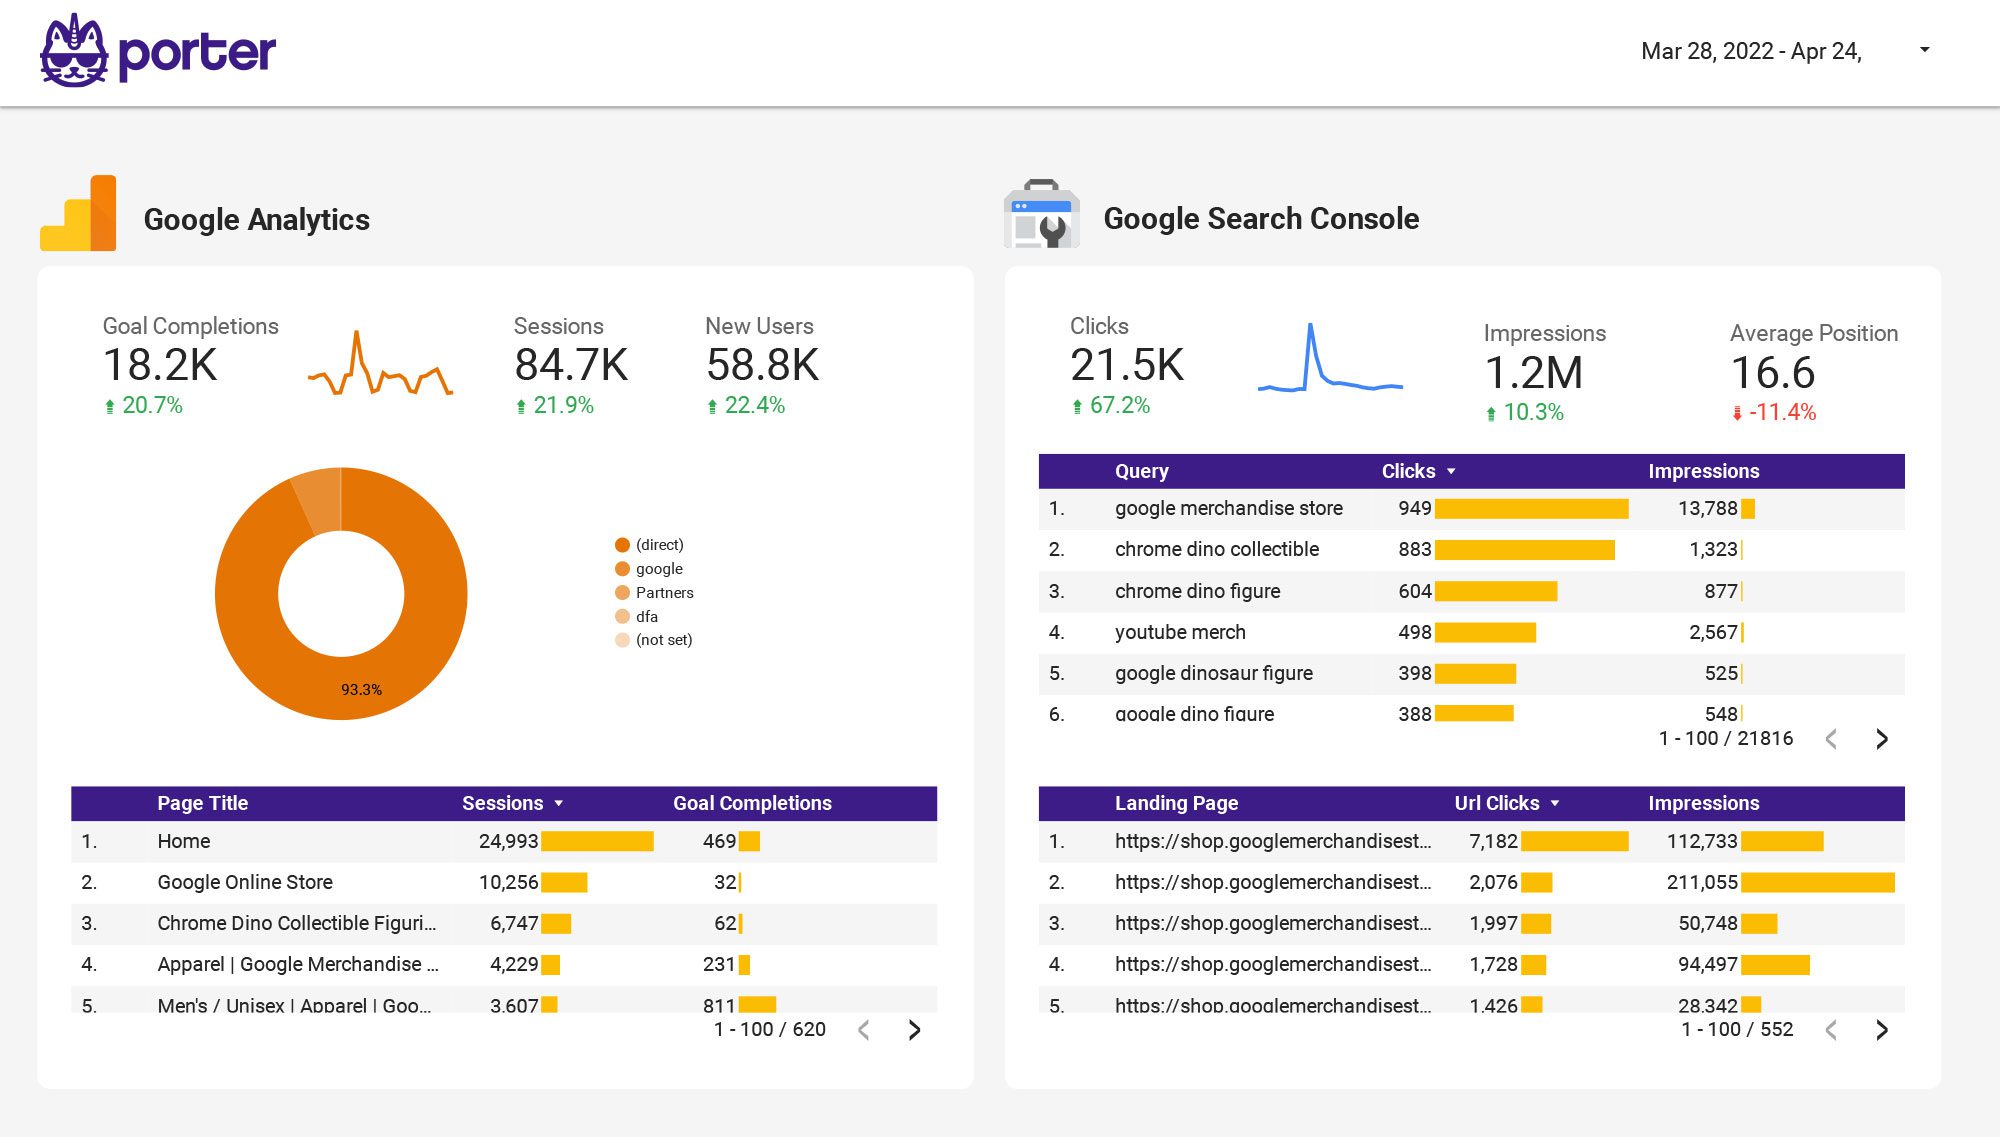
SEO Serp tracking Dashboard template
The SEO SERP Tracking Dashboard template is designed to provide a detailed overview of your website’s performance in search engine results. This tool integrates seamlessly with Google Search Console to deliver actionable insights.
With this dashboard, you can:
- Monitor keyword rankings and track their fluctuations over time.
- Analyze click-through rates (CTR) and identify trends.
- Evaluate impressions to understand visibility in search results.
- Identify top-performing pages and optimize underperforming ones.
Utilize this template to make data-driven decisions and improve your website’s search engine performance.
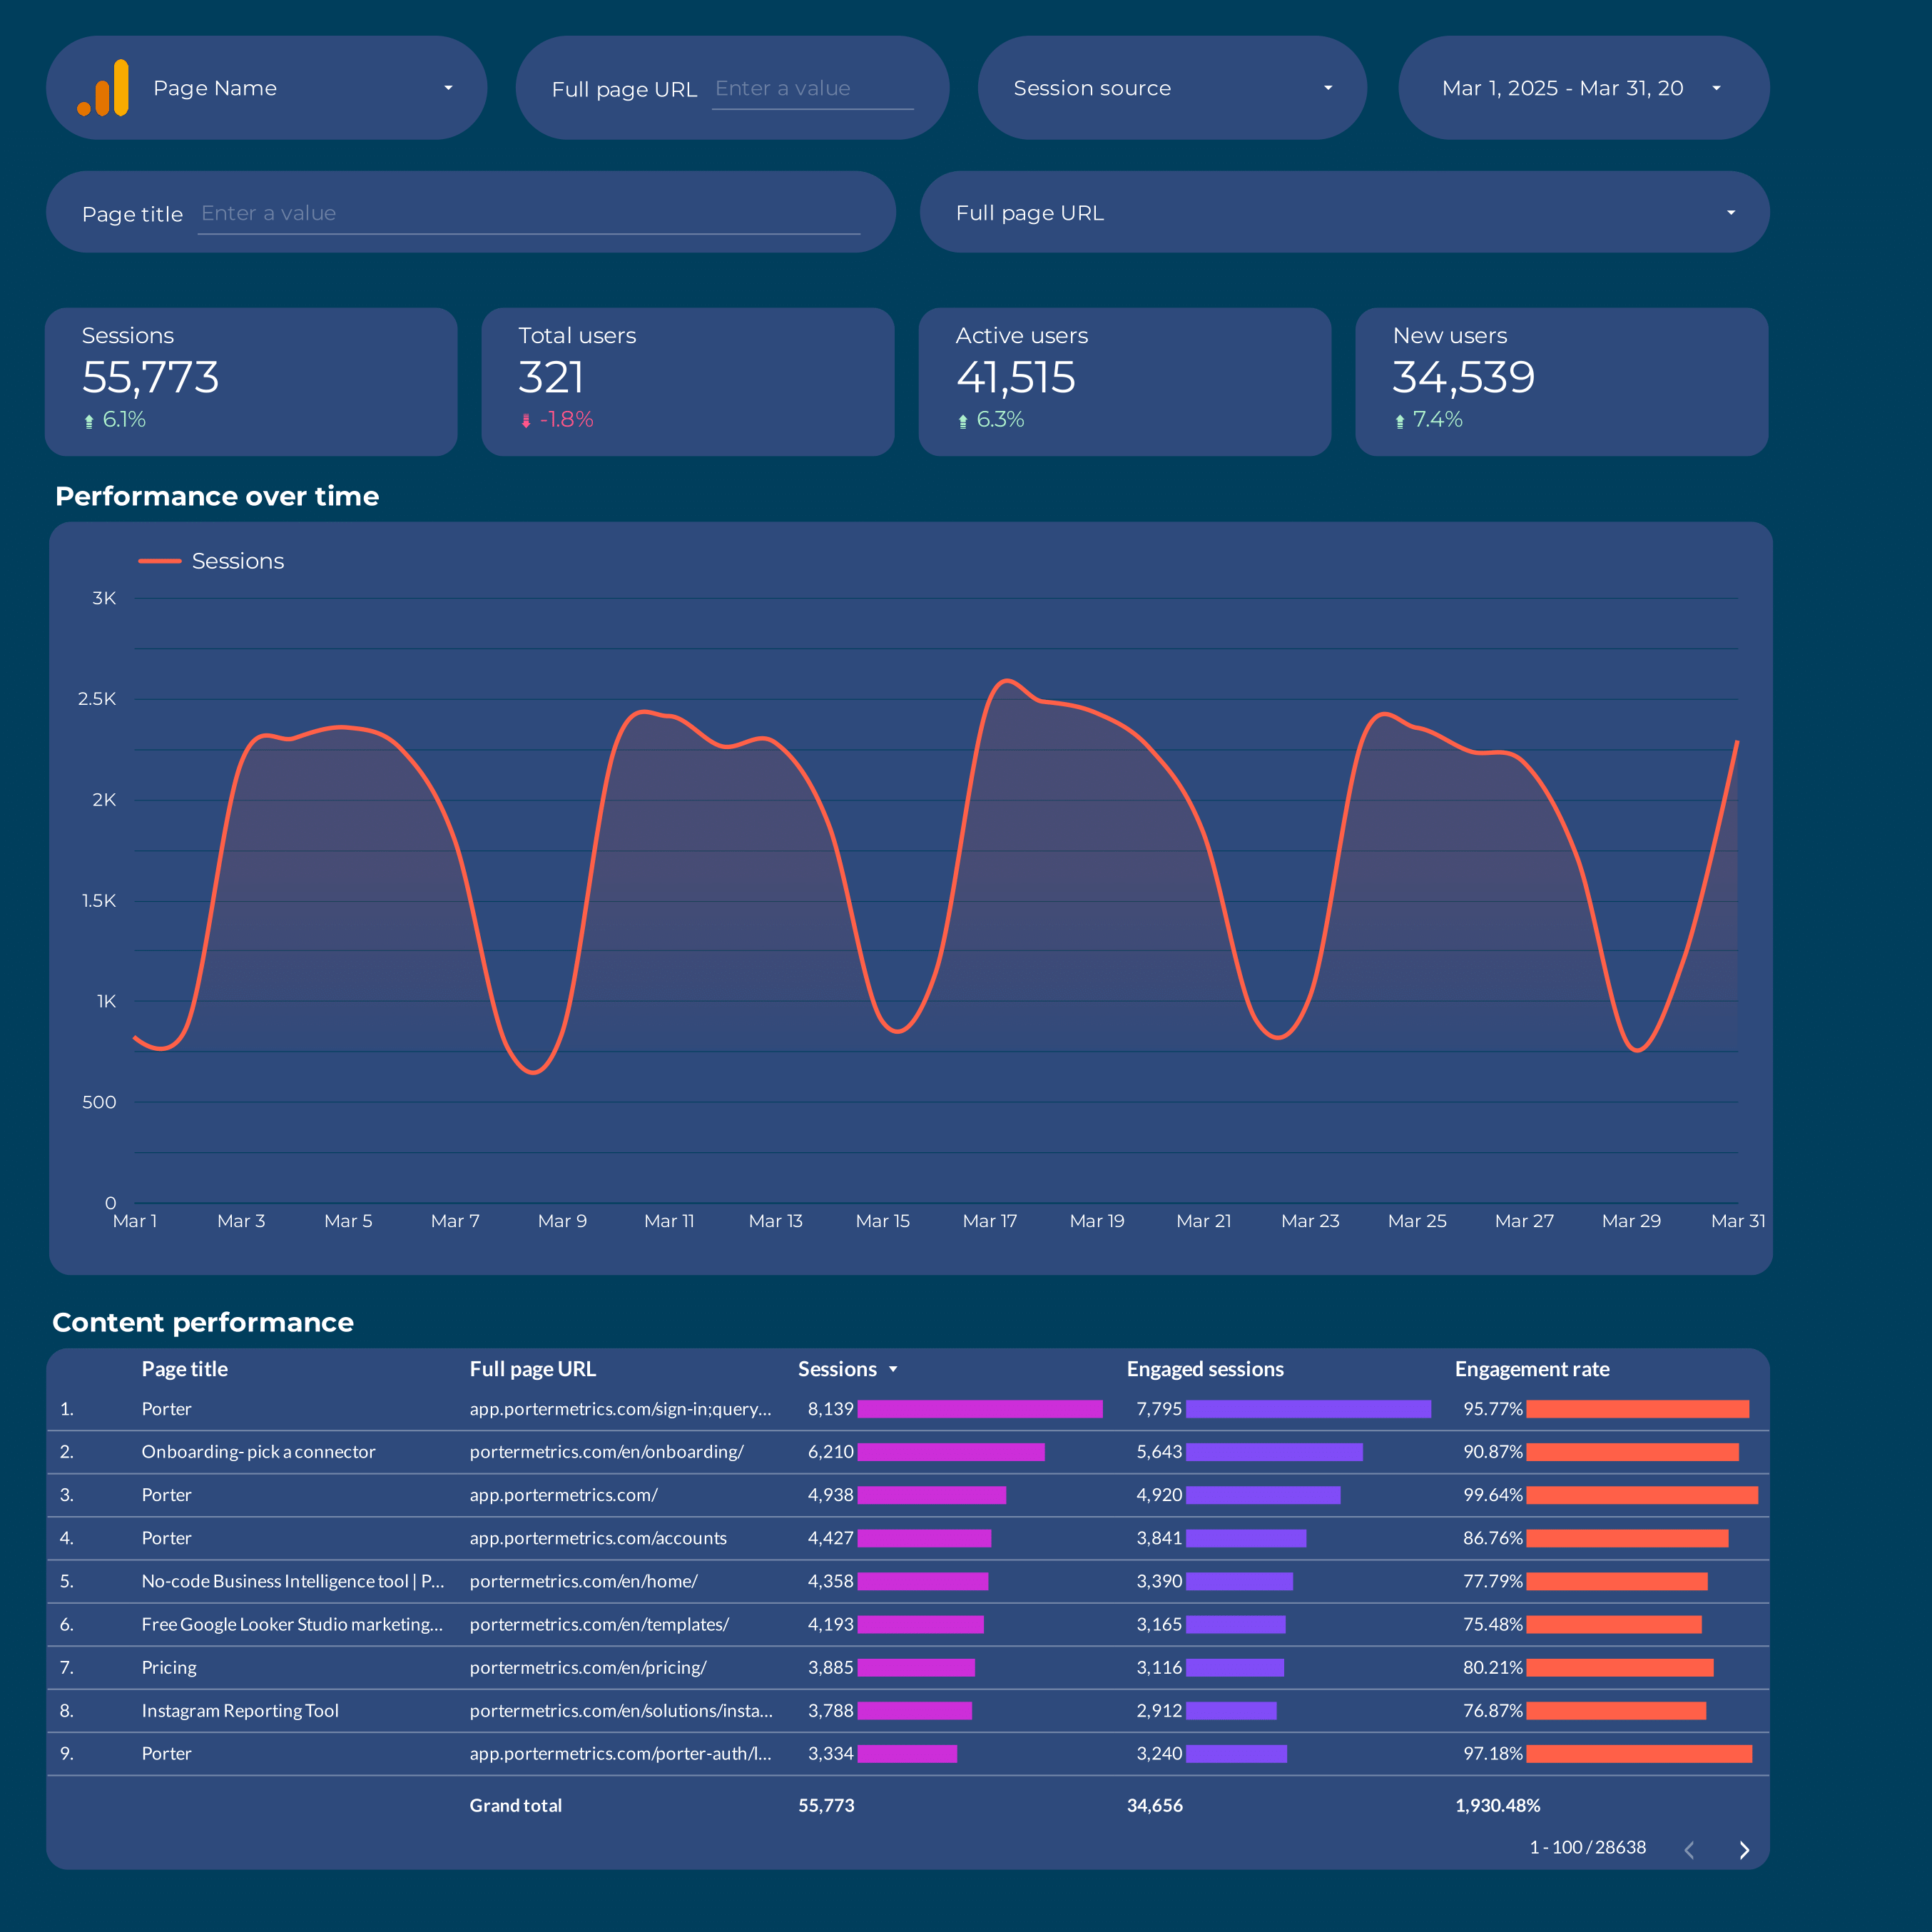
Content marketing Dashboard template
The Content Marketing Dashboard Template is designed to provide marketers with a streamlined view of their content performance using Google Analytics 4. This template integrates essential metrics and dimensions to help you track and analyze your content marketing efforts effectively.
With this dashboard, you can:
- Monitor user engagement metrics such as page views, session duration, and bounce rate.
- Analyze traffic sources to understand where your audience is coming from and how they interact with your content.
- Evaluate conversion rates to measure the success of your content in driving desired actions.
- Track audience demographics to tailor your content strategy to your target audience.
This template leverages the advanced capabilities of Google Analytics 4 to provide a detailed overview of your content marketing performance, enabling data-driven decision-making.
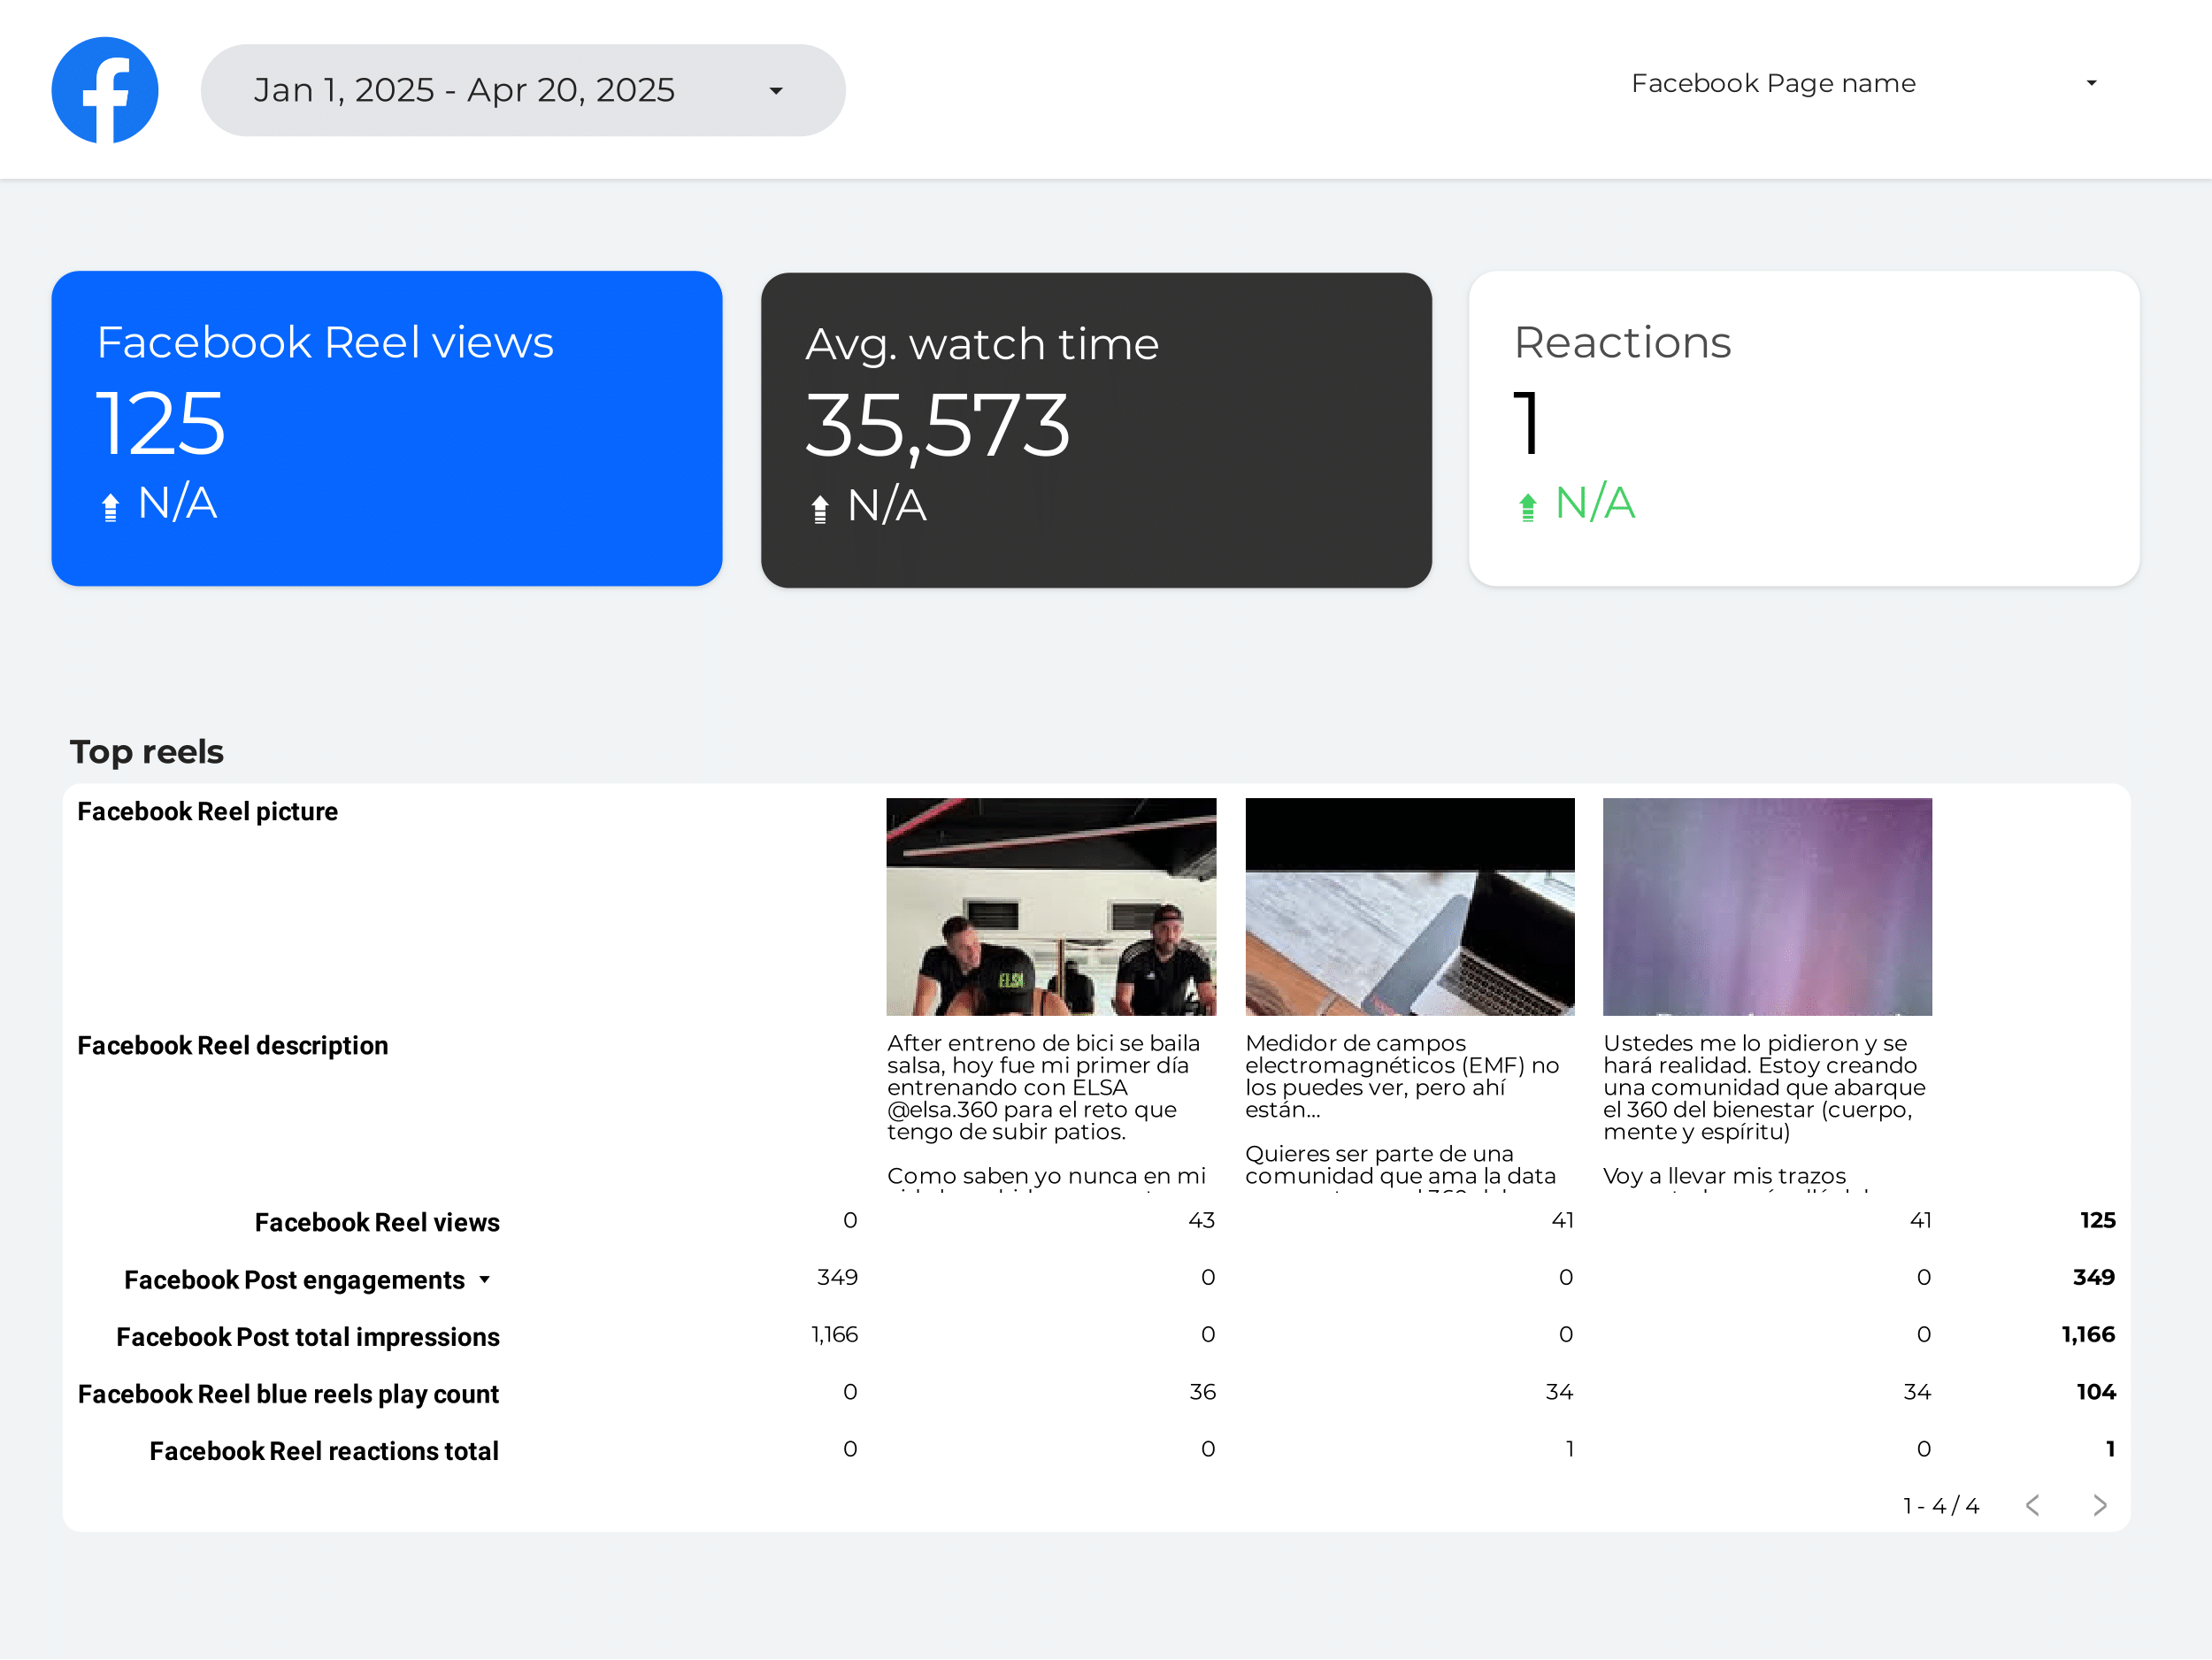
Facebook Insights Dashboard template
The Facebook Insights Dashboard template provides a structured view of your social media performance metrics. This tool is designed to help you track and analyze your Facebook page’s data effectively.
With this dashboard, you can:
- Monitor audience engagement through metrics such as likes, shares, and comments.
- Analyze post reach and impressions to understand content visibility.
- Track follower growth over time to assess audience expansion.
- Evaluate page performance with detailed insights into user demographics and behavior.
This template integrates seamlessly with your existing data sources, providing a centralized location for all your Facebook Insights. Utilize this dashboard to make informed decisions and optimize your social media strategy.
Google Business Profile Reviews Dashboard template
The Google Business Profile Reviews Dashboard template is designed for businesses focusing on Local SEO strategies. This dashboard provides a centralized view of your Google Business Profile reviews, allowing you to monitor and manage customer feedback effectively.
With this template, you can:
- Track the number of reviews over time to understand trends in customer feedback.
- Analyze the average rating to gauge overall customer satisfaction.
- Identify common themes in reviews to address customer concerns and improve service.
- Monitor response rates to ensure timely engagement with customers.
Utilize this dashboard to maintain a strong online presence and improve your business’s visibility in local search results.
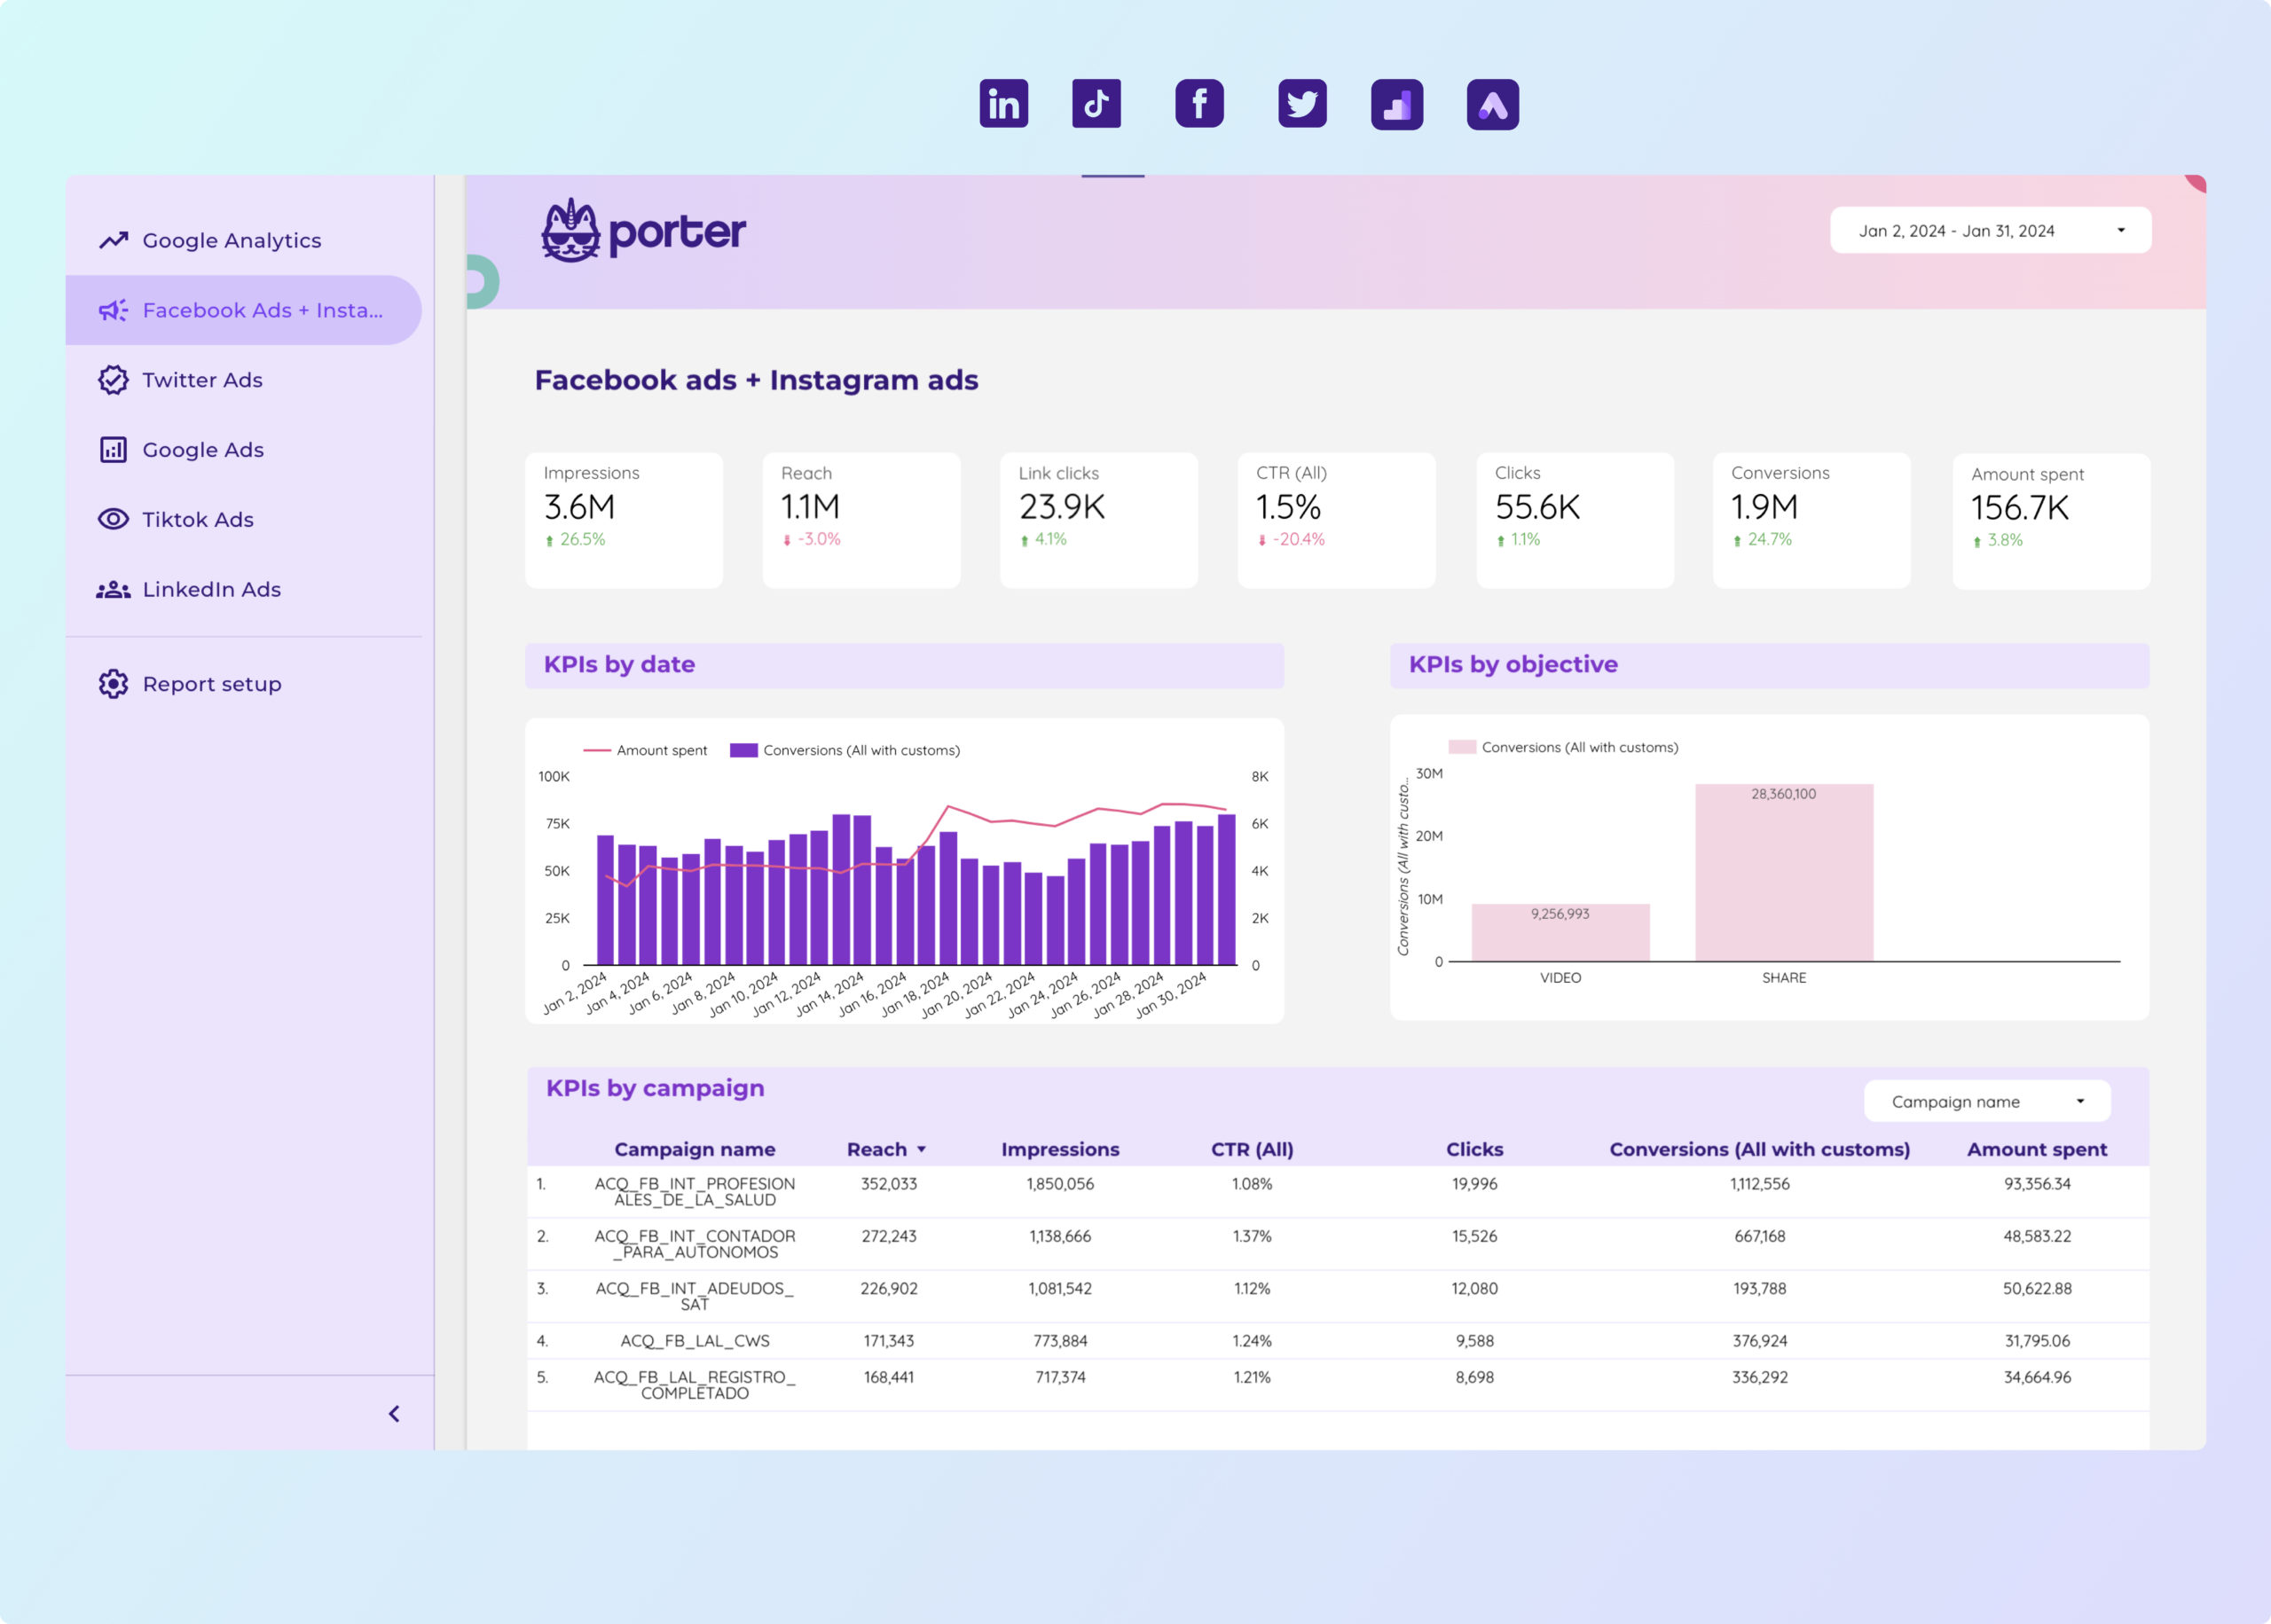
Paid media Dashboard template
This Paid Media Dashboard Template is designed for marketers managing campaigns across multiple platforms. It integrates data from PPC channels such as Google Ads, Facebook Ads, LinkedIn Ads, TikTok Ads, and Twitter Ads.
Utilize this dashboard to track and analyze performance metrics from Google Analytics 4 and Base. The template provides a centralized view of your advertising efforts, allowing for data-driven decision-making.
- Google Ads: Monitor impressions, clicks, and conversion rates.
- Facebook Ads: Analyze audience engagement and ad spend.
- LinkedIn Ads: Evaluate lead generation and campaign reach.
- TikTok Ads: Track video views and user interactions.
- Twitter Ads: Assess tweet engagement and follower growth.
This template is ideal for marketers seeking to consolidate their advertising data into a single, actionable view.
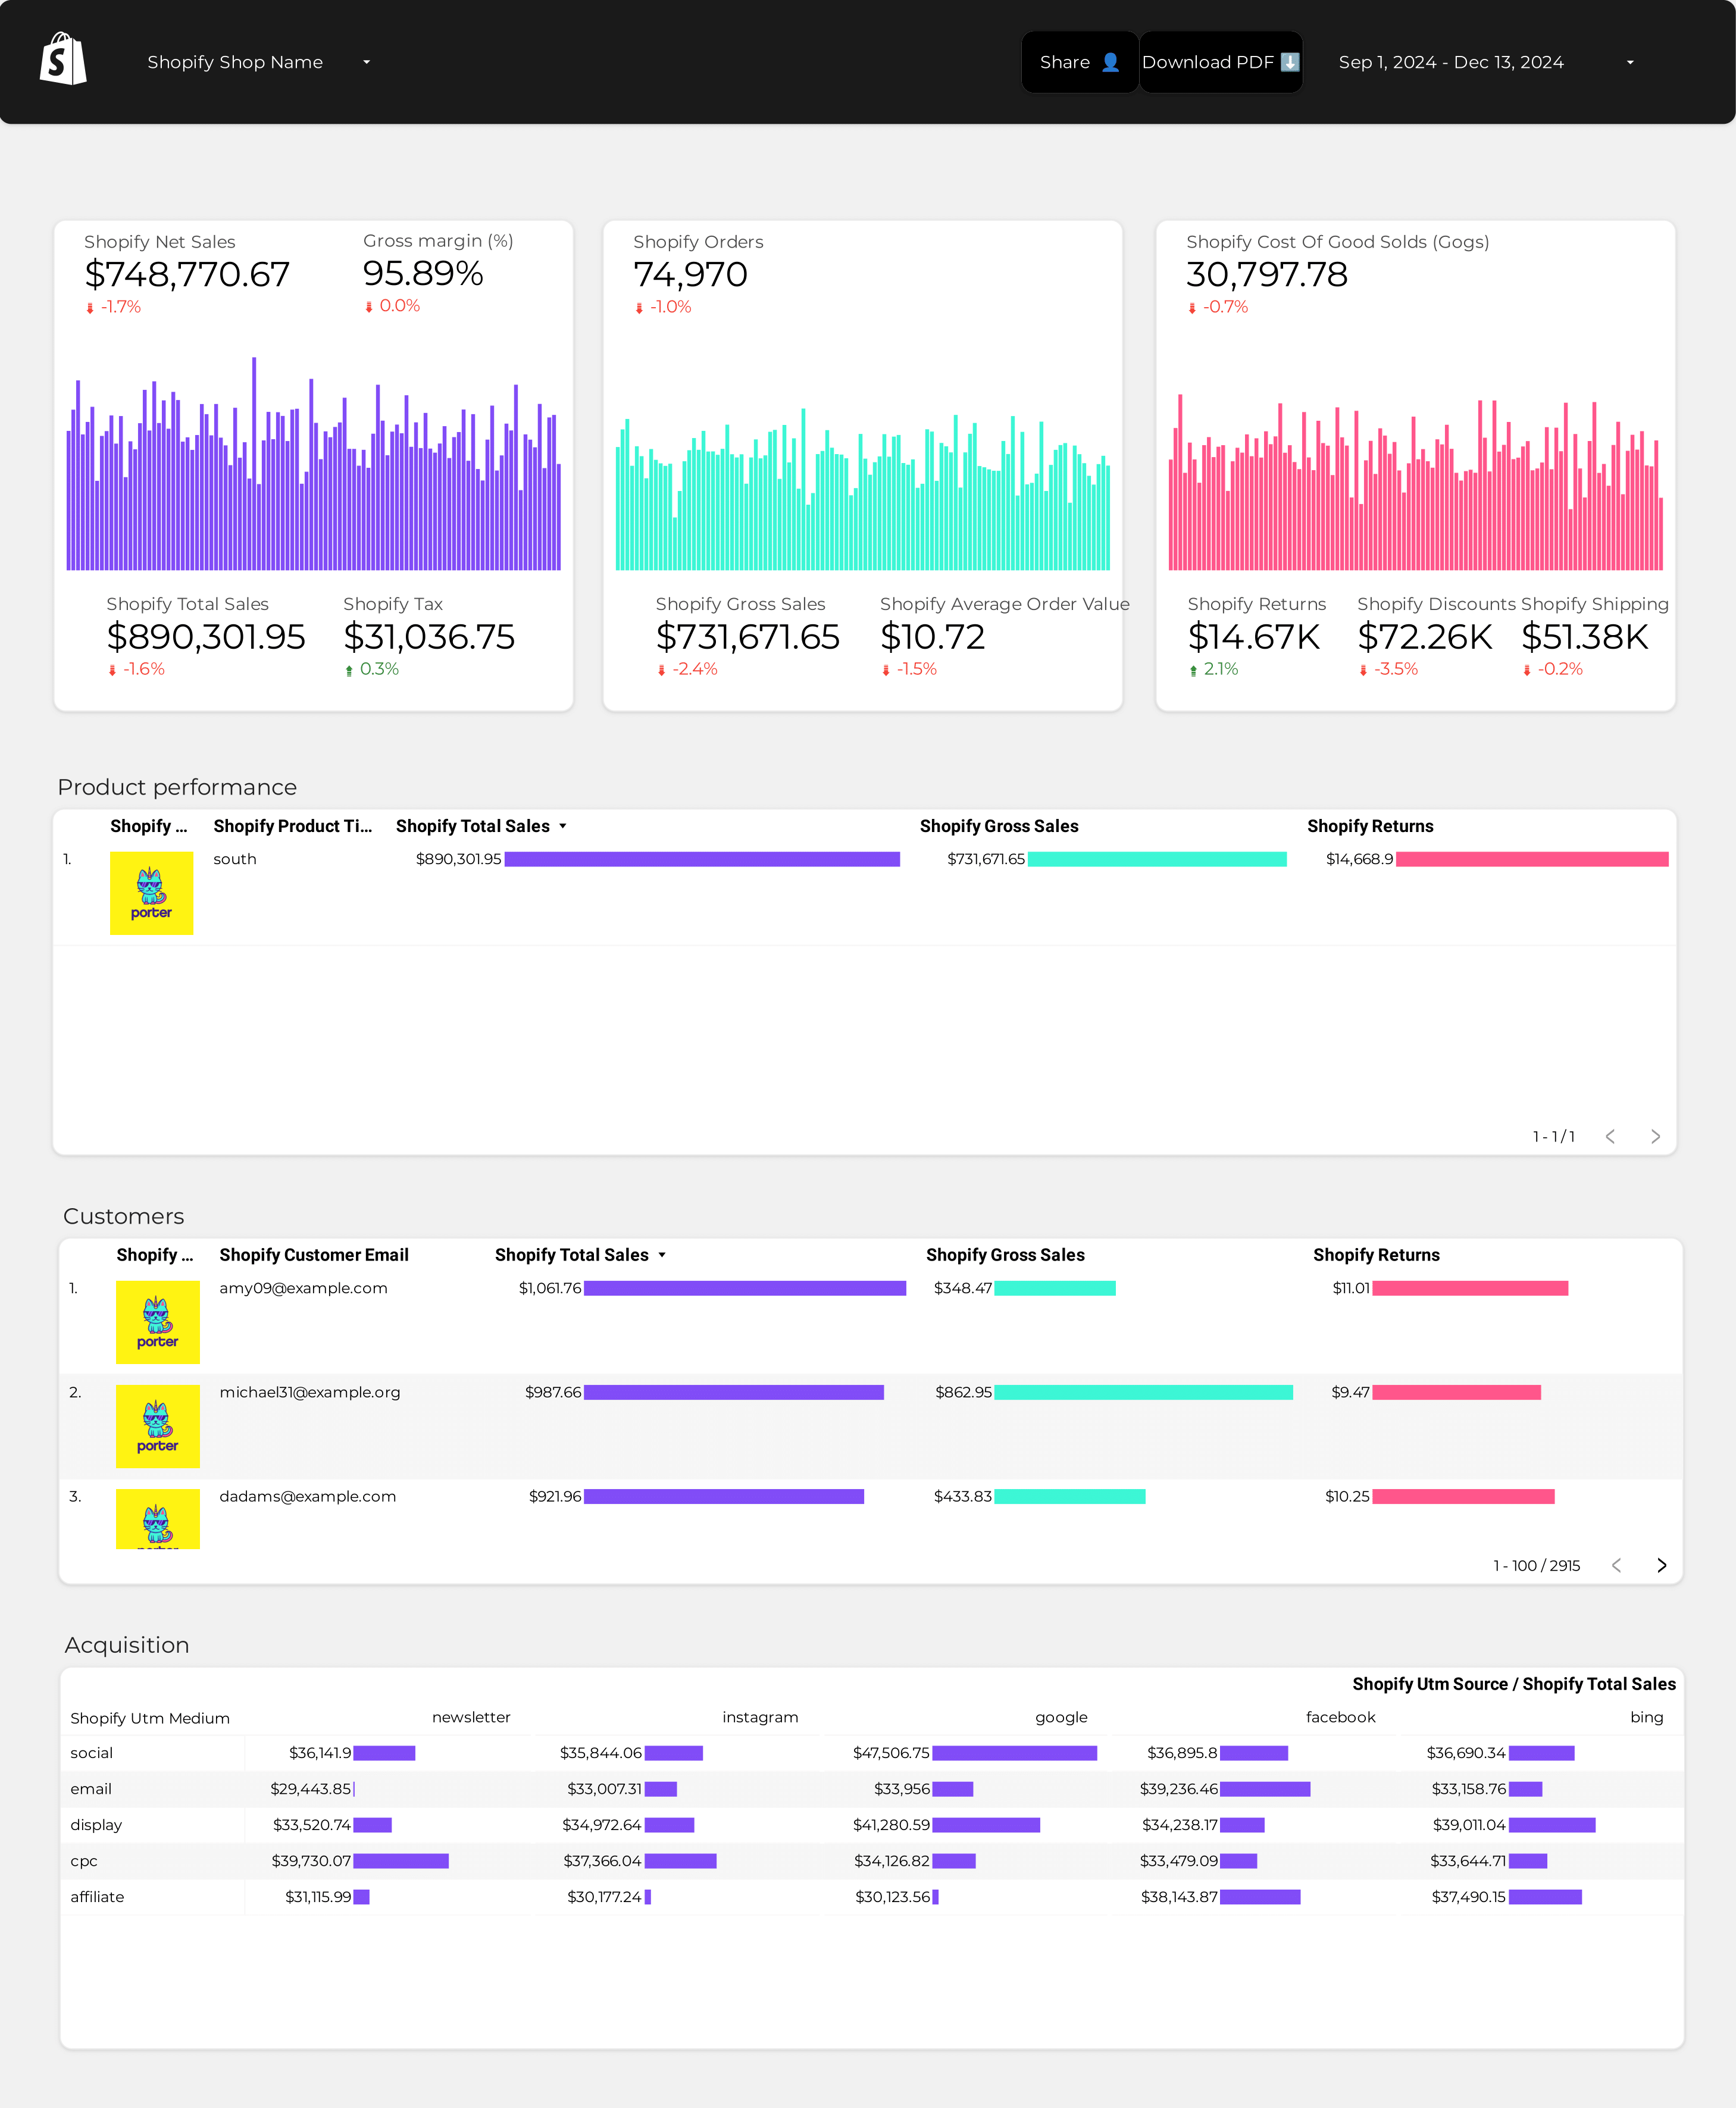
Shopify Dashboard template
The Shopify Dashboard Template is designed to provide a streamlined overview of your e-commerce operations. This template integrates seamlessly with Shopify, offering a centralized hub for monitoring and managing your online store’s performance.
With this dashboard, you can:
- Track Sales Data: Access real-time sales figures and analyze trends over time.
- Monitor Inventory Levels: Keep an eye on stock availability to ensure timely restocking and avoid stockouts.
- Analyze Customer Behavior: Gain insights into customer purchasing patterns and preferences.
- Review Marketing Campaigns: Evaluate the effectiveness of your marketing efforts and adjust strategies accordingly.
This template is an essential tool for any Shopify store owner looking to maintain a competitive edge in the e-commerce landscape.
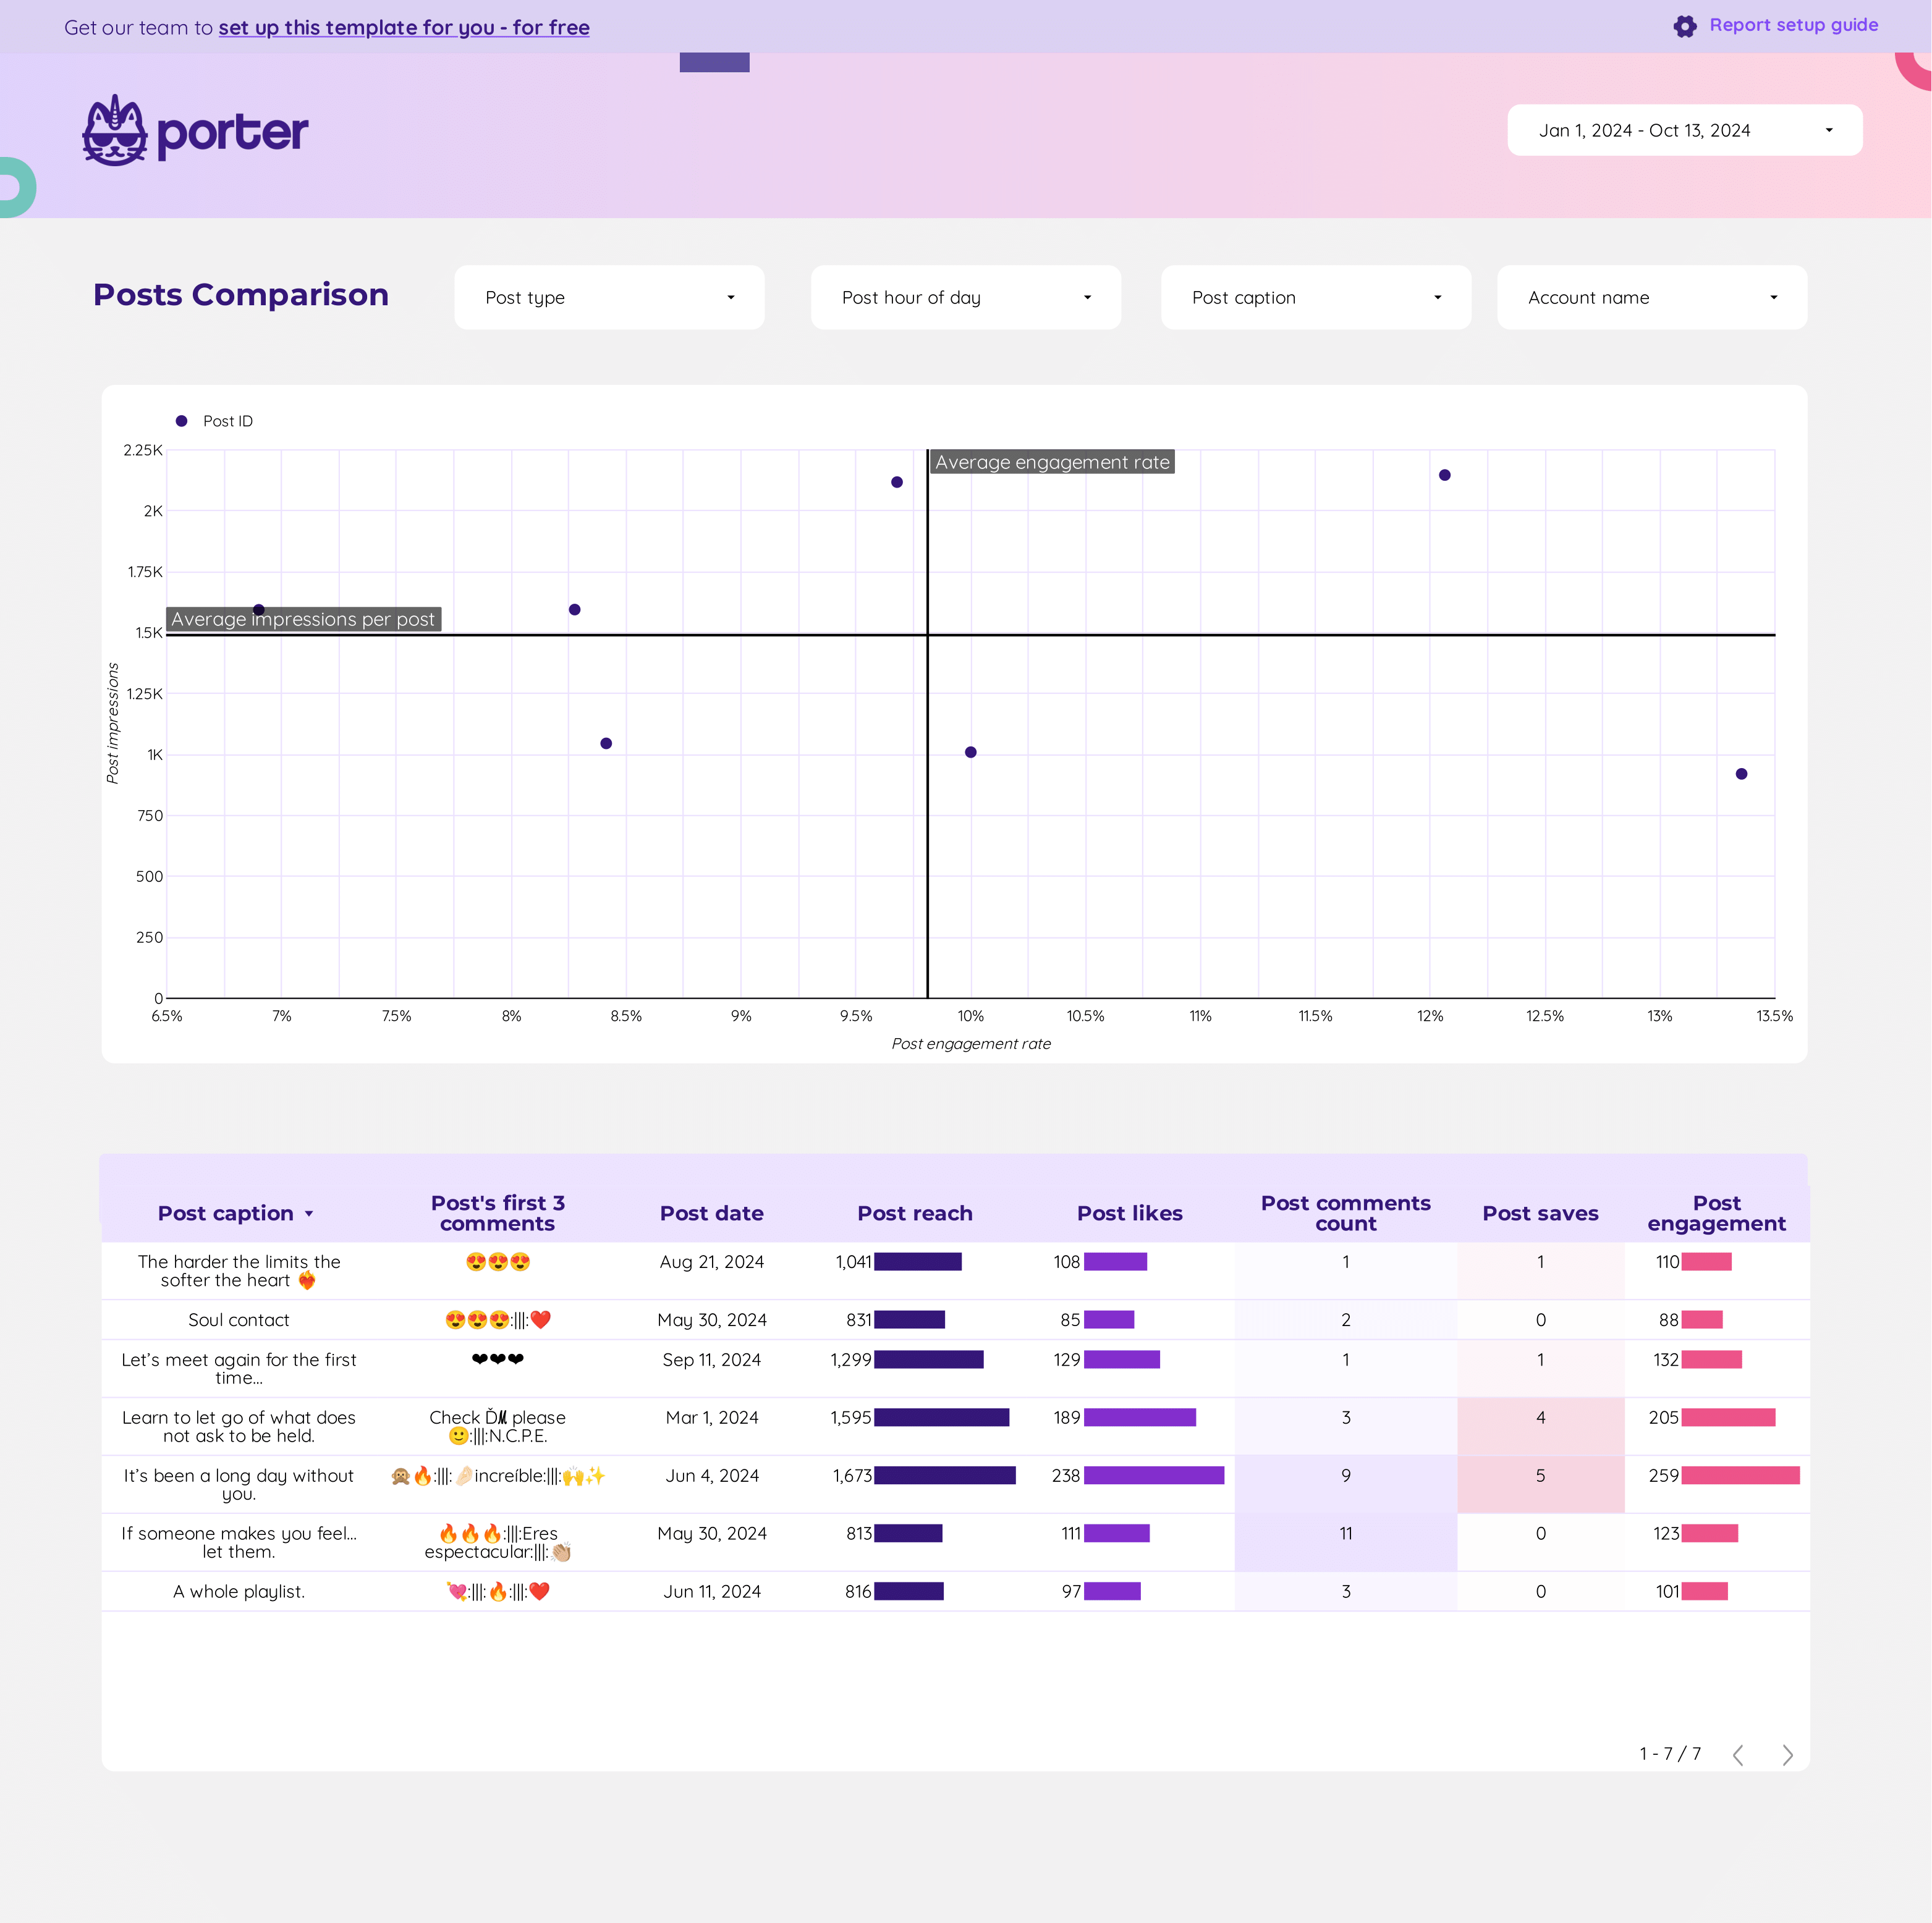
Content performance Dashboard template
The Content Performance Dashboard template integrates data from multiple social media platforms and analytics tools to provide a detailed overview of content metrics. This dashboard is designed for marketers and analysts who need to track and analyze content performance across various channels.
Data Sources:
- Google Analytics 4
- Instagram Insights
- Facebook Insights
- LinkedIn Pages
- Google Business Profile
- TikTok
Features:
- Aggregated metrics from multiple platforms
- Visual representation of engagement trends
- Comparative analysis of content performance
- Customizable views for specific social media channels
This dashboard template is essential for tracking social media content performance, providing insights into audience engagement, reach, and conversion metrics.
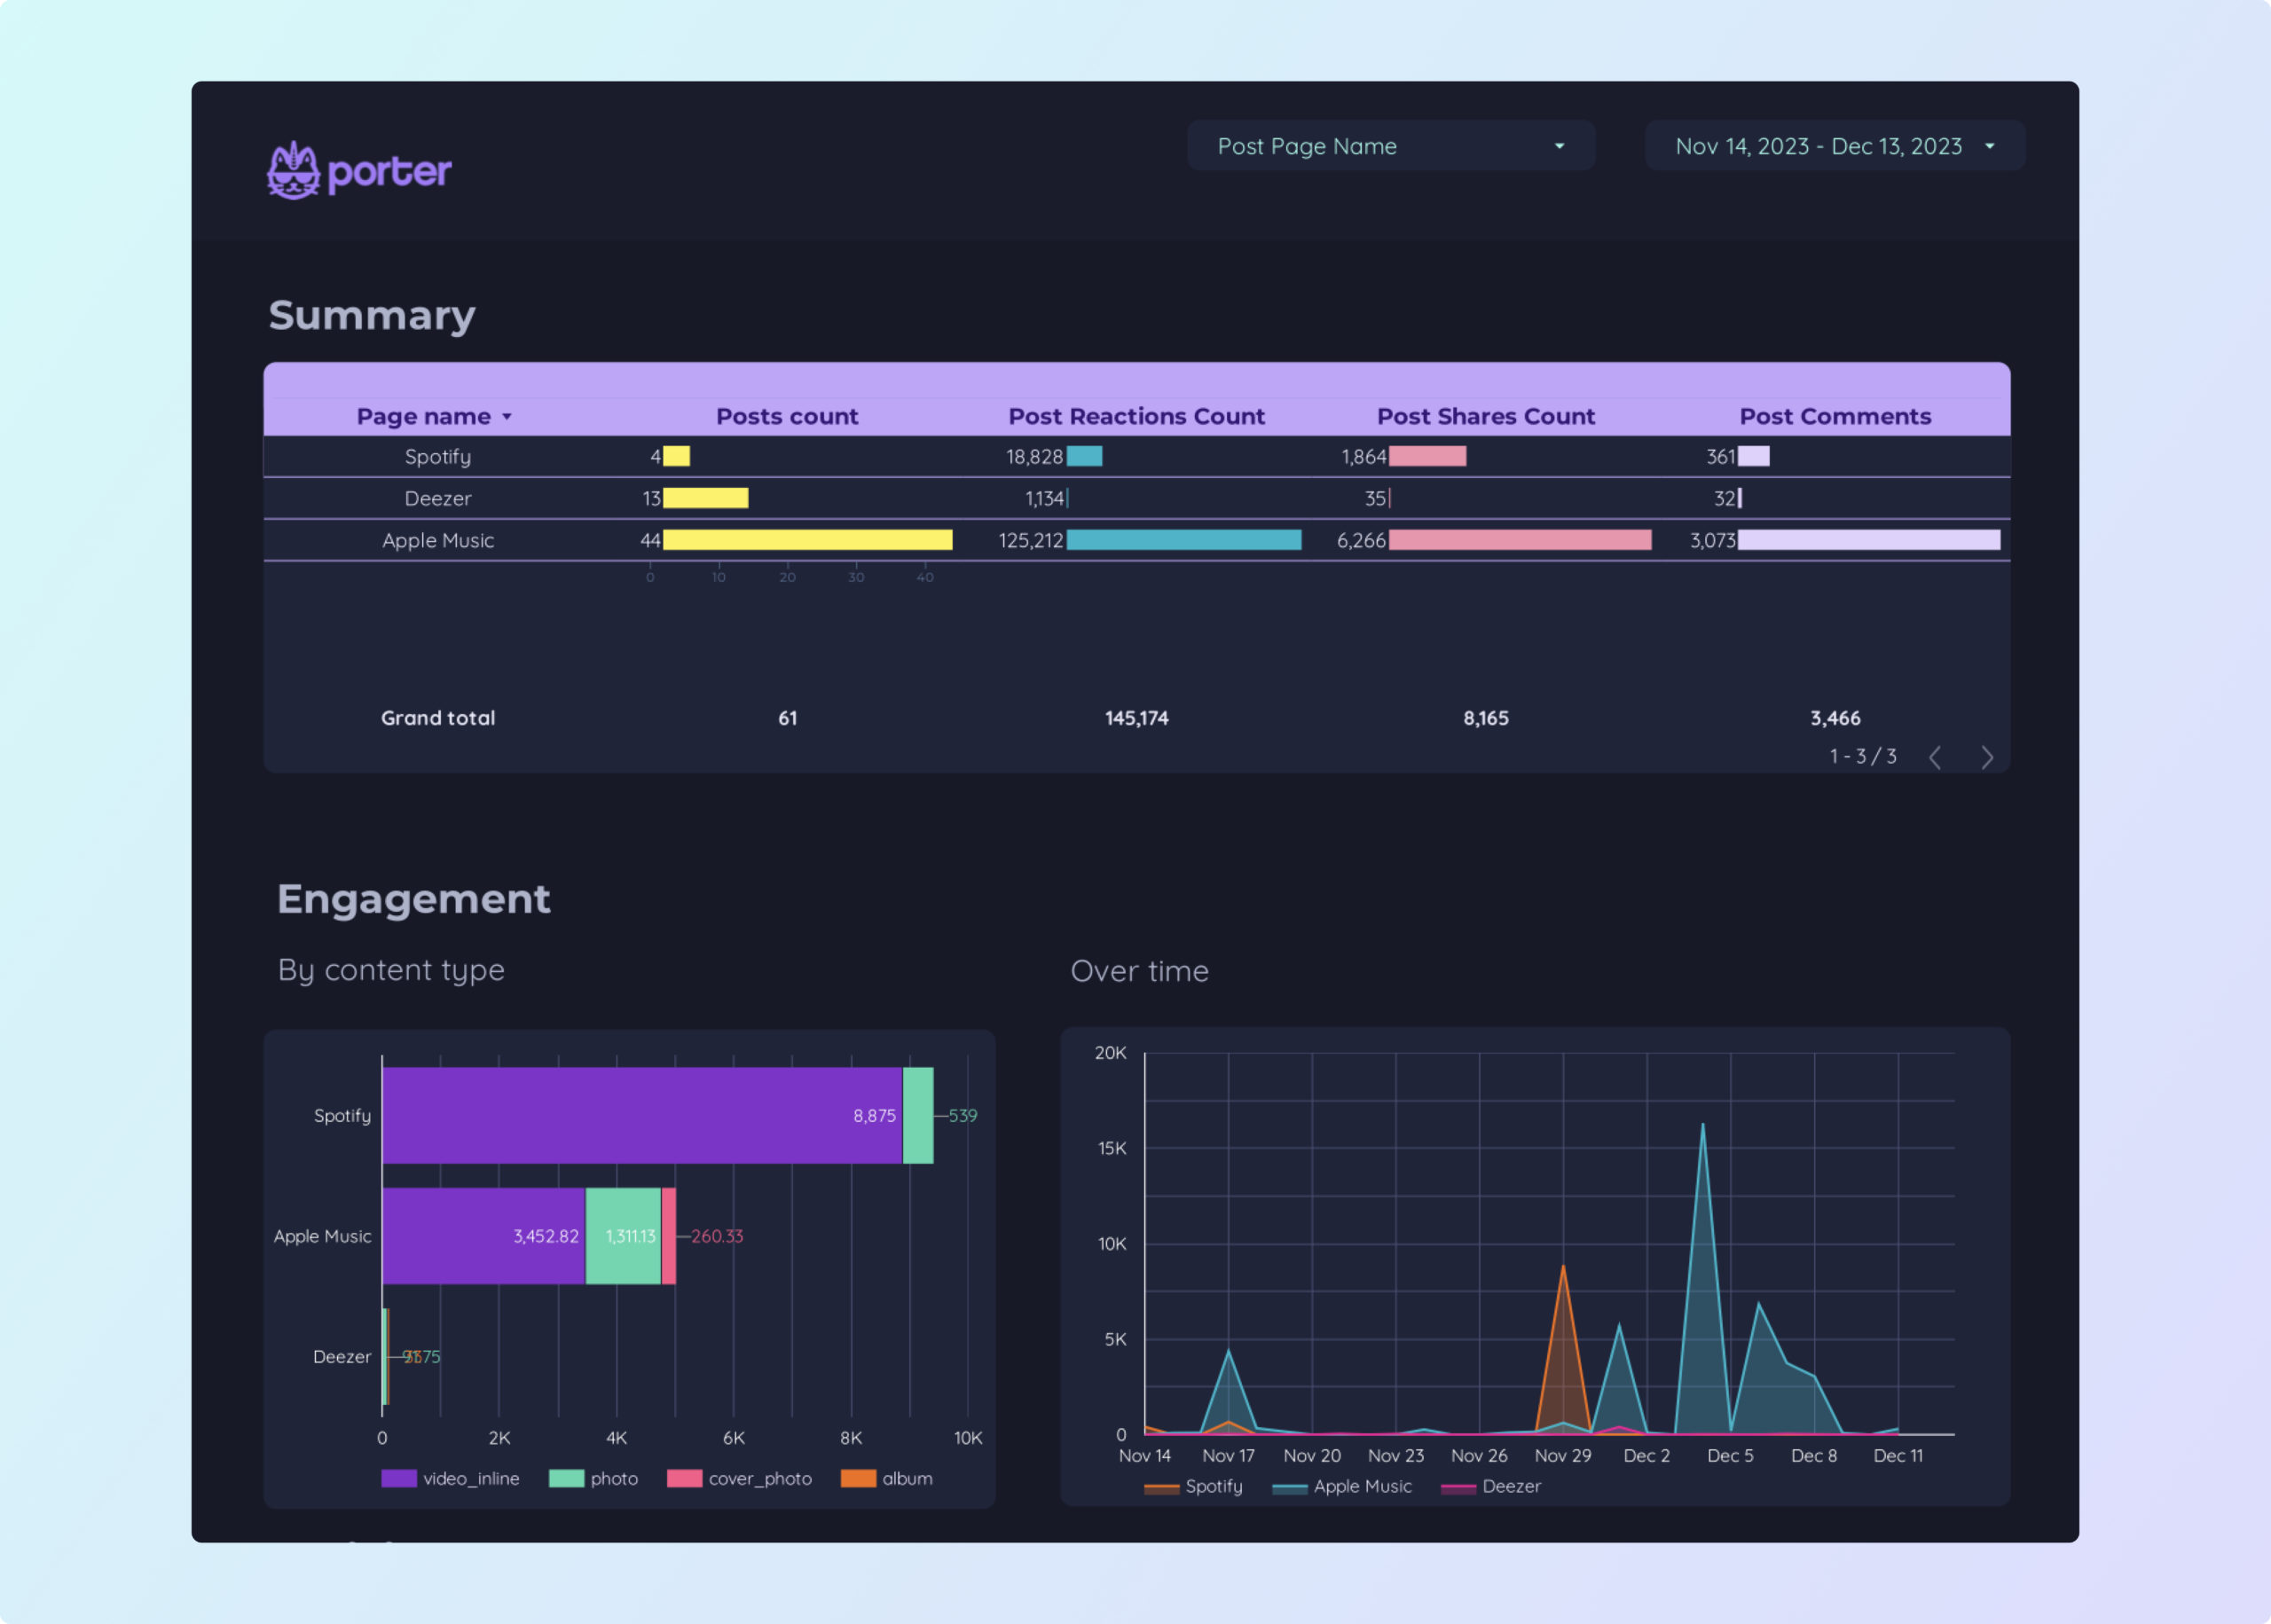
Facebook Insights competitors Dashboard template
The Facebook Insights Competitors Dashboard template provides a structured approach to analyzing your competitors’ performance on Facebook. This tool leverages Facebook Public Data to offer insights into various metrics.
With this dashboard, you can:
- Track engagement metrics such as likes, shares, and comments.
- Analyze audience demographics to understand the reach and influence of competitors.
- Monitor content performance to identify successful strategies.
Utilize this template to gain a competitive edge by understanding how your competitors interact with their audience and what content resonates most effectively.