


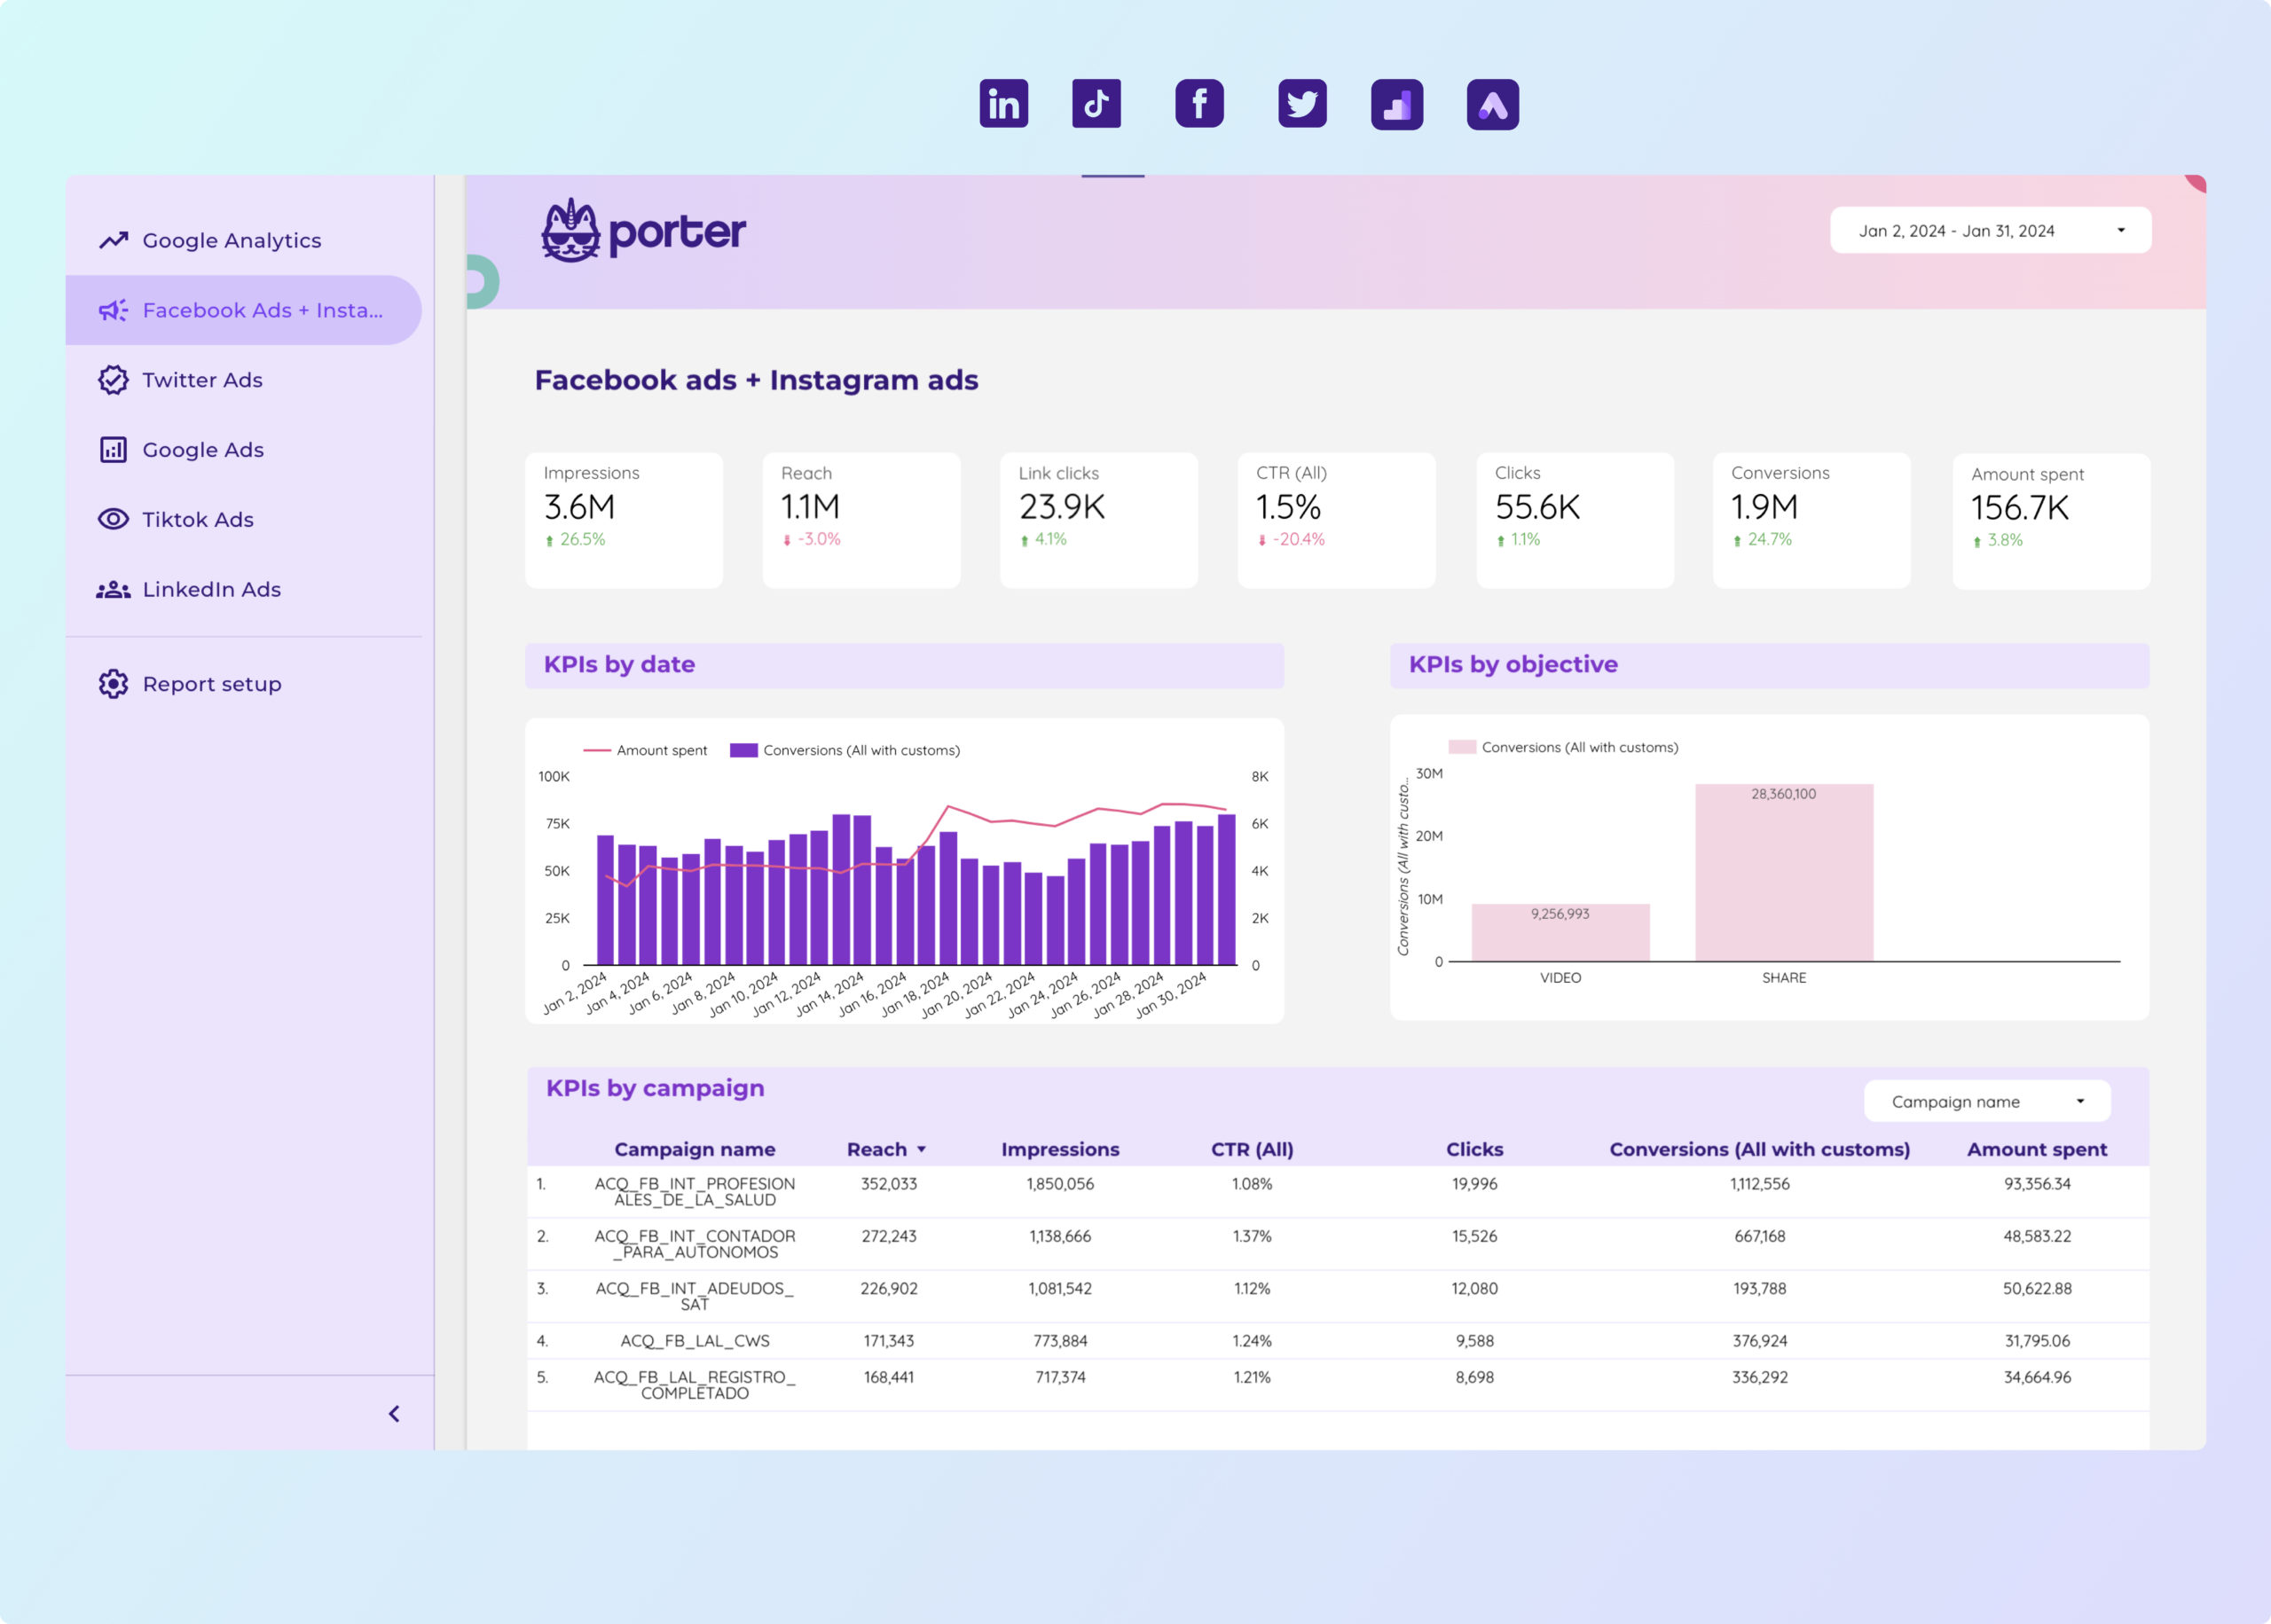
Paid media Dashboard template
This Paid Media Dashboard Template is designed for marketers managing campaigns across multiple platforms. It integrates data from PPC channels such as Google Ads, Facebook Ads, LinkedIn Ads, TikTok Ads, and Twitter Ads.
Utilize this dashboard to track and analyze performance metrics from Google Analytics 4 and Base. The template provides a centralized view of your advertising efforts, allowing for data-driven decision-making.
- Google Ads: Monitor impressions, clicks, and conversion rates.
- Facebook Ads: Analyze audience engagement and ad spend.
- LinkedIn Ads: Evaluate lead generation and campaign reach.
- TikTok Ads: Track video views and user interactions.
- Twitter Ads: Assess tweet engagement and follower growth.
This template is ideal for marketers seeking to consolidate their advertising data into a single, actionable view.
Multi-channel Marketing performance Dashboard template
The Multi-channel Marketing Performance Dashboard template provides a centralized view of your marketing efforts across various platforms. This dashboard integrates data from Google Analytics 4, Instagram Insights, Google Ads, YouTube, Facebook Insights, Facebook Ads, LinkedIn Ads, TikTok Ads, and Twitter Ads.
With this template, you can:
- Track SEO performance and analyze website traffic using Google Analytics 4.
- Monitor social media engagement and audience growth through Instagram and Facebook Insights.
- Evaluate advertising campaigns across Google Ads, Facebook Ads, LinkedIn Ads, TikTok Ads, and Twitter Ads.
- Analyze video content performance on YouTube.
This dashboard template is designed to provide actionable insights by consolidating data from multiple channels, allowing for a streamlined analysis of marketing strategies and outcomes.
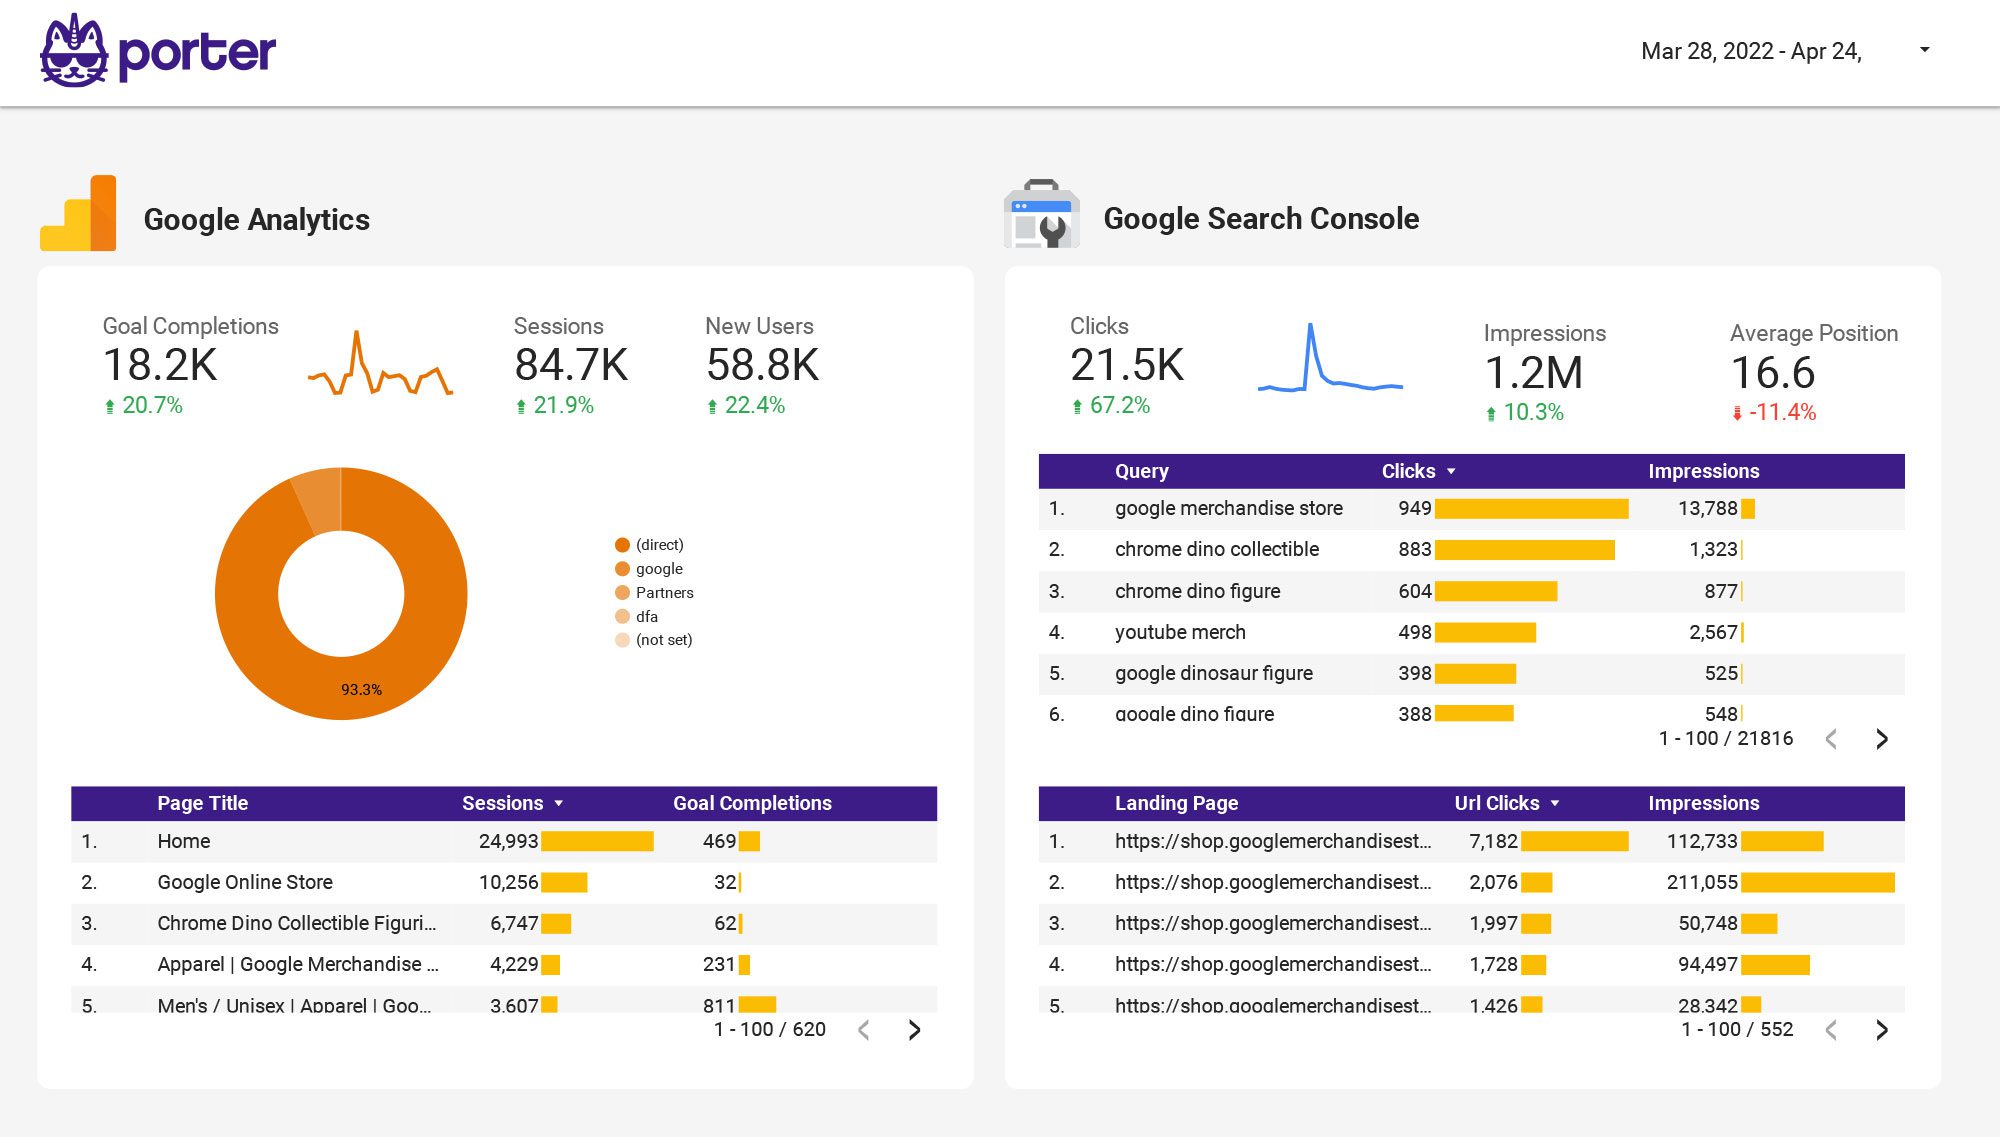
Lead generation Dashboard template
The Lead Generation Dashboard Template is designed for B2B marketers and sales teams to streamline their lead management process. This template integrates with popular platforms such as Google Ads, LinkedIn Ads, Facebook Ads, and HubSpot, providing a centralized view of your lead generation efforts.
Utilize data from Google Analytics 4 to track and analyze the performance of your campaigns. The dashboard offers insights into:
- Lead Sources: Identify which channels are driving the most leads.
- Conversion Rates: Monitor the effectiveness of your PPC campaigns.
- CRM Integration: Seamlessly connect with HubSpot to manage and nurture leads.
This template is essential for businesses looking to optimize their B2B lead generation strategy by leveraging data from multiple advertising and analytics platforms.
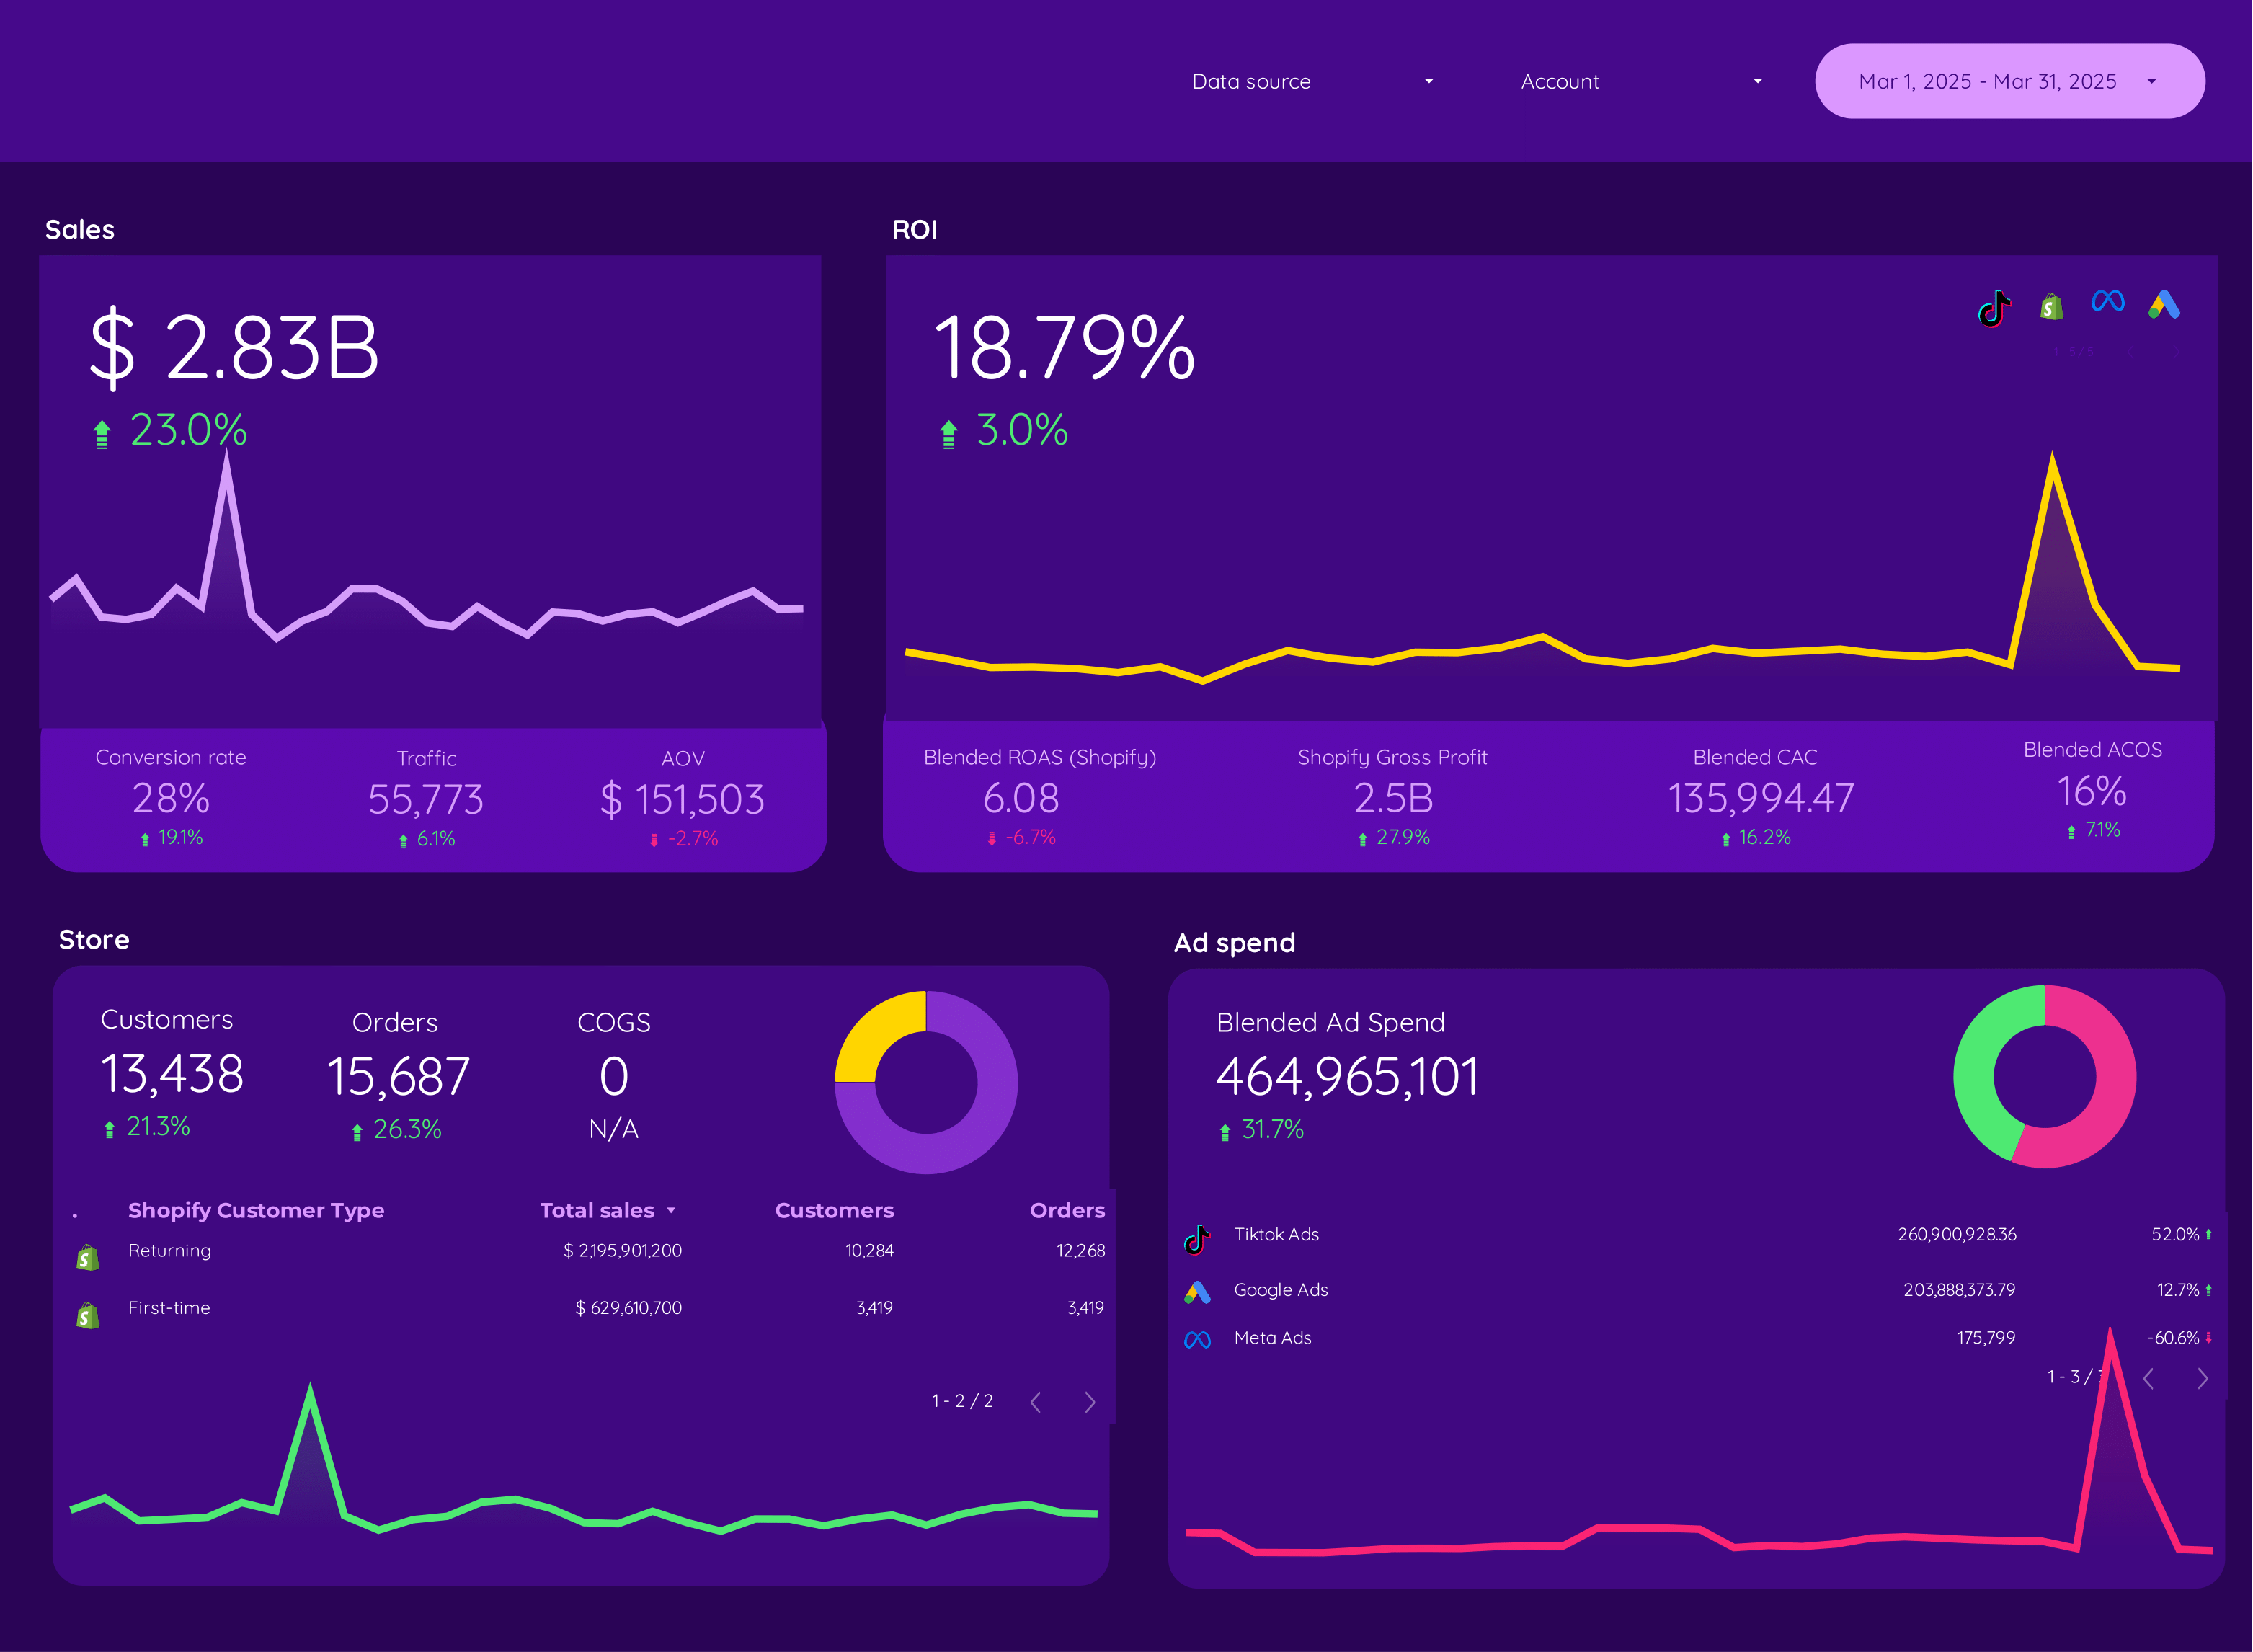
Google Analytics 4 E-commerce Dashboard template
The Google Analytics 4 E-commerce Dashboard template is designed for businesses using Shopify to track and analyze their online store’s performance. This dashboard provides a detailed view of your e-commerce data, allowing you to monitor and optimize your store’s performance effectively.
With this template, you can access a variety of metrics and dimensions, including:
- Sales Performance: Track total revenue, average order value, and conversion rates.
- Customer Behavior: Analyze user engagement, session duration, and bounce rates.
- Traffic Sources: Identify where your visitors are coming from, including organic search, paid ads, and social media.
- Product Insights: Review product performance, including top-selling items and product views.
This dashboard leverages the capabilities of Google Analytics 4 to provide real-time data and insights, helping you make informed decisions about your e-commerce strategy.
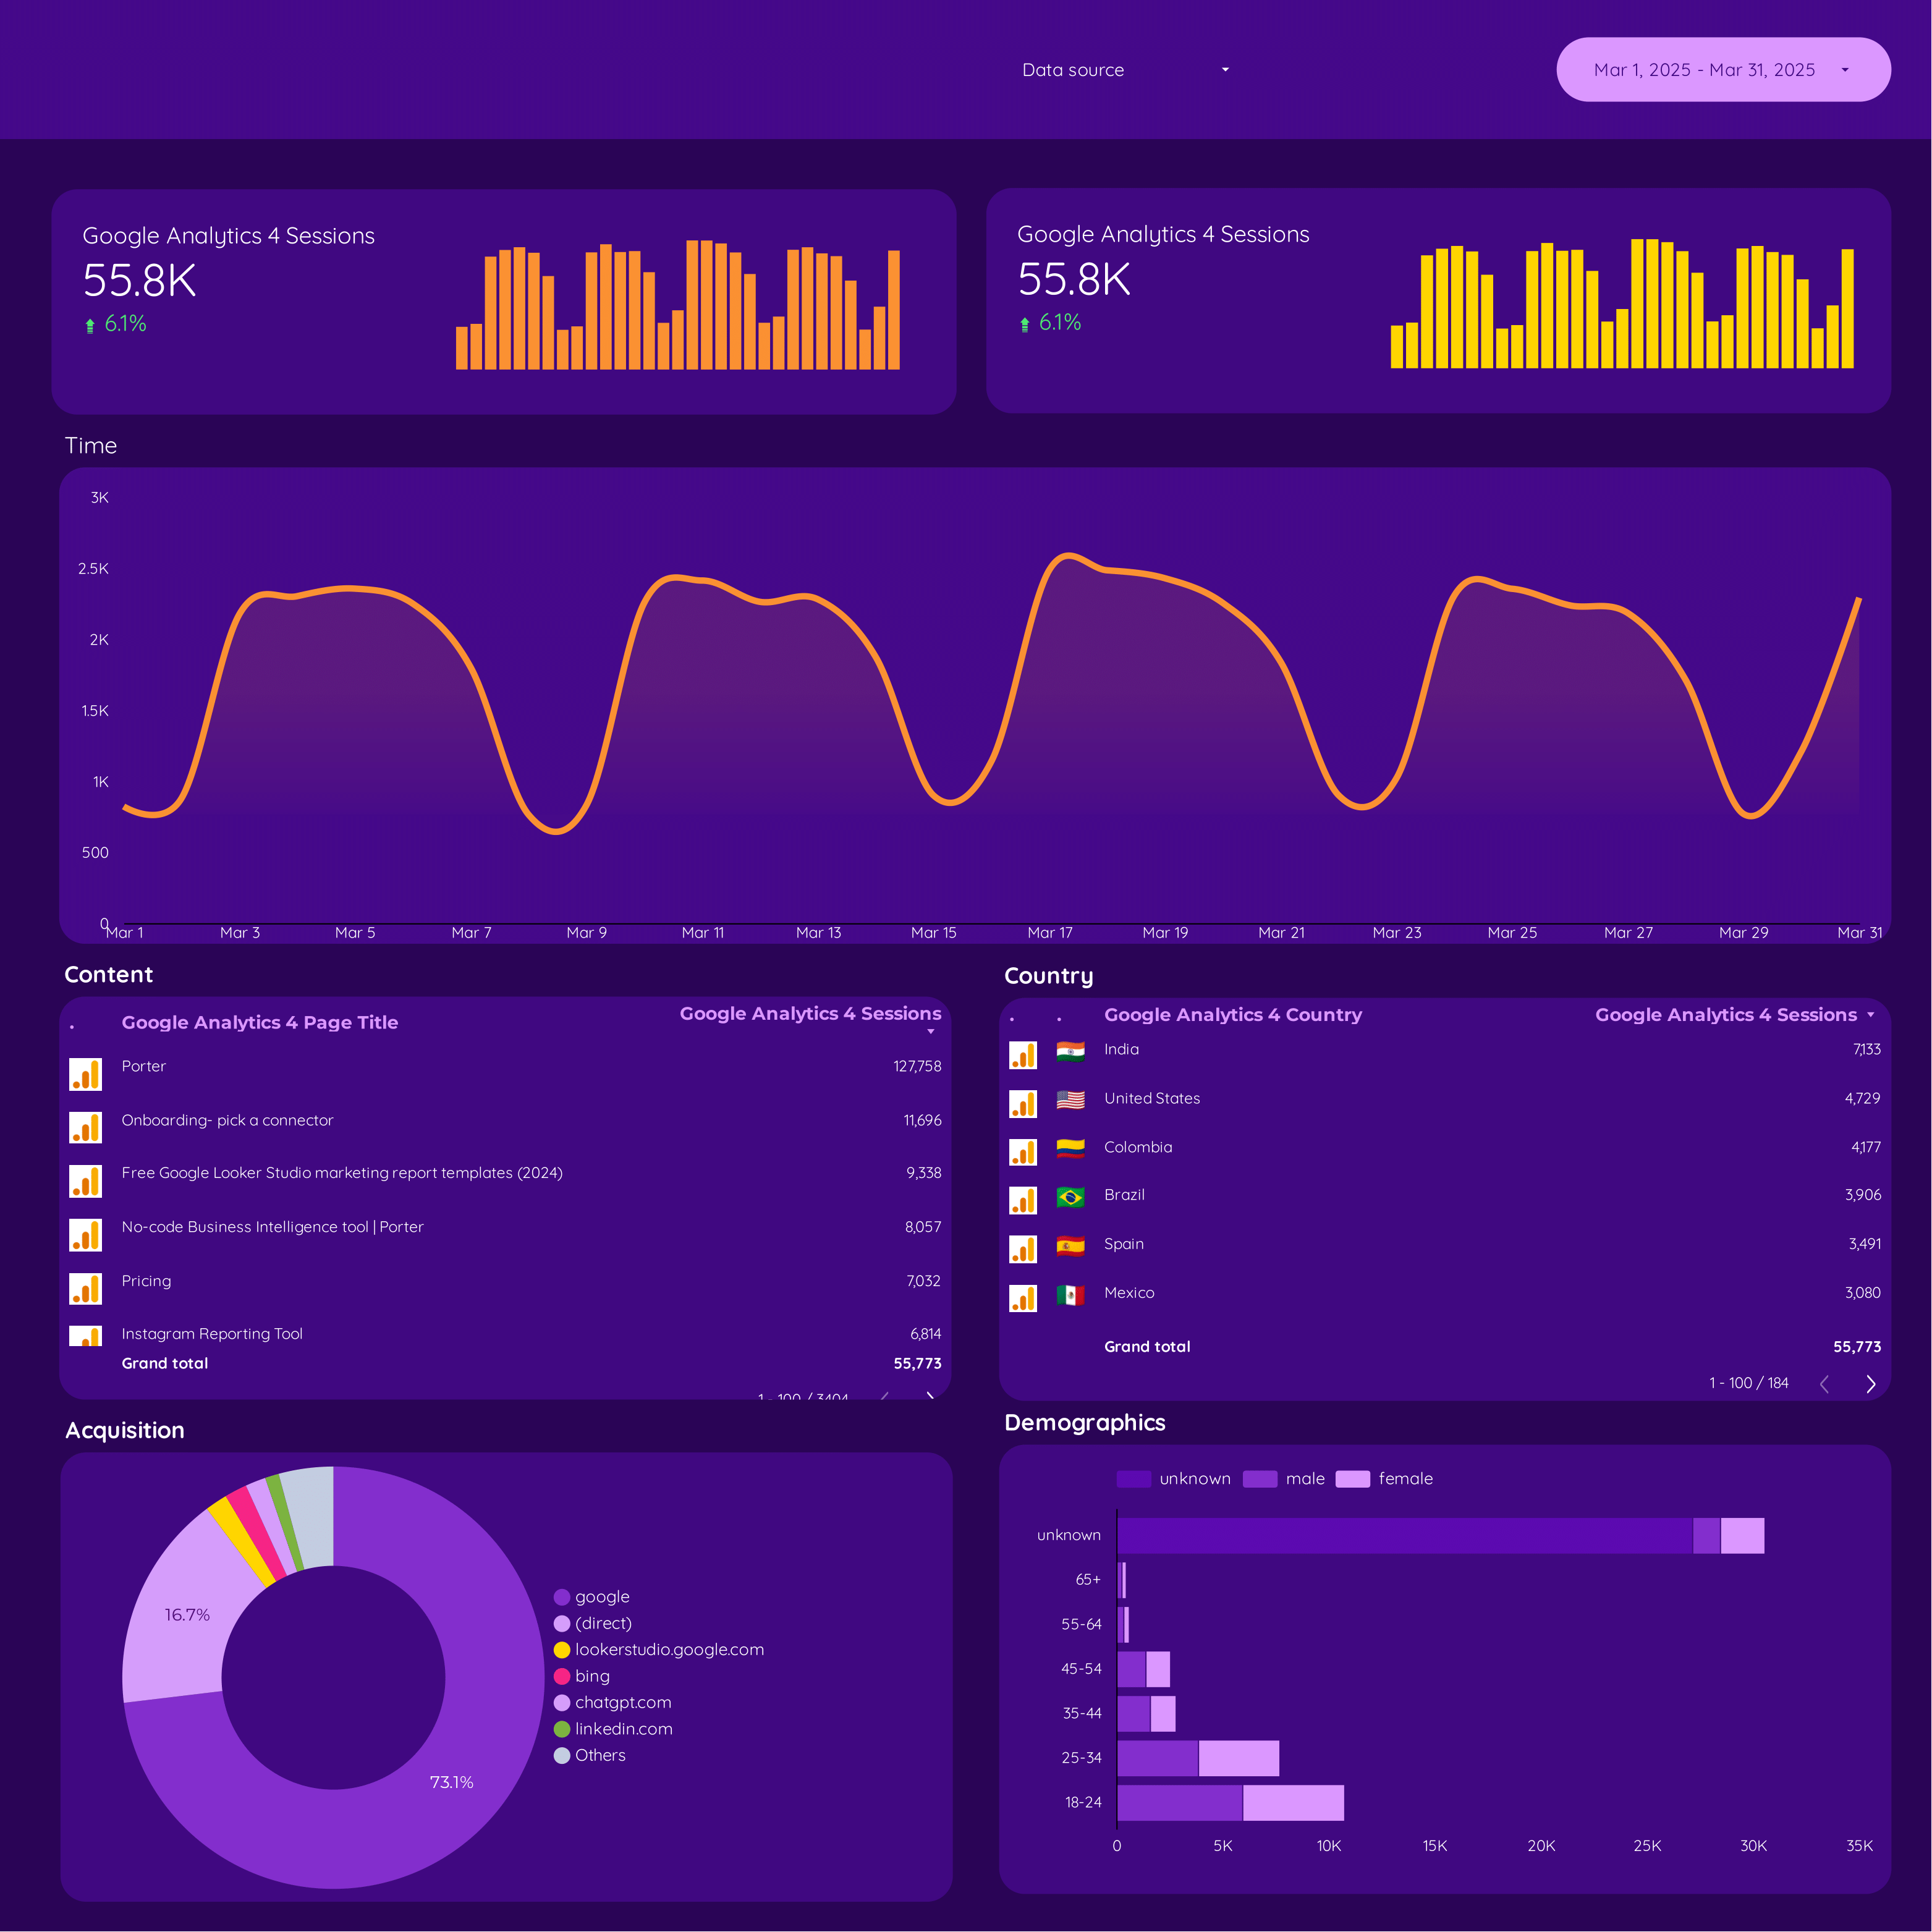
Google Analytics 4 Audience Dashboard template
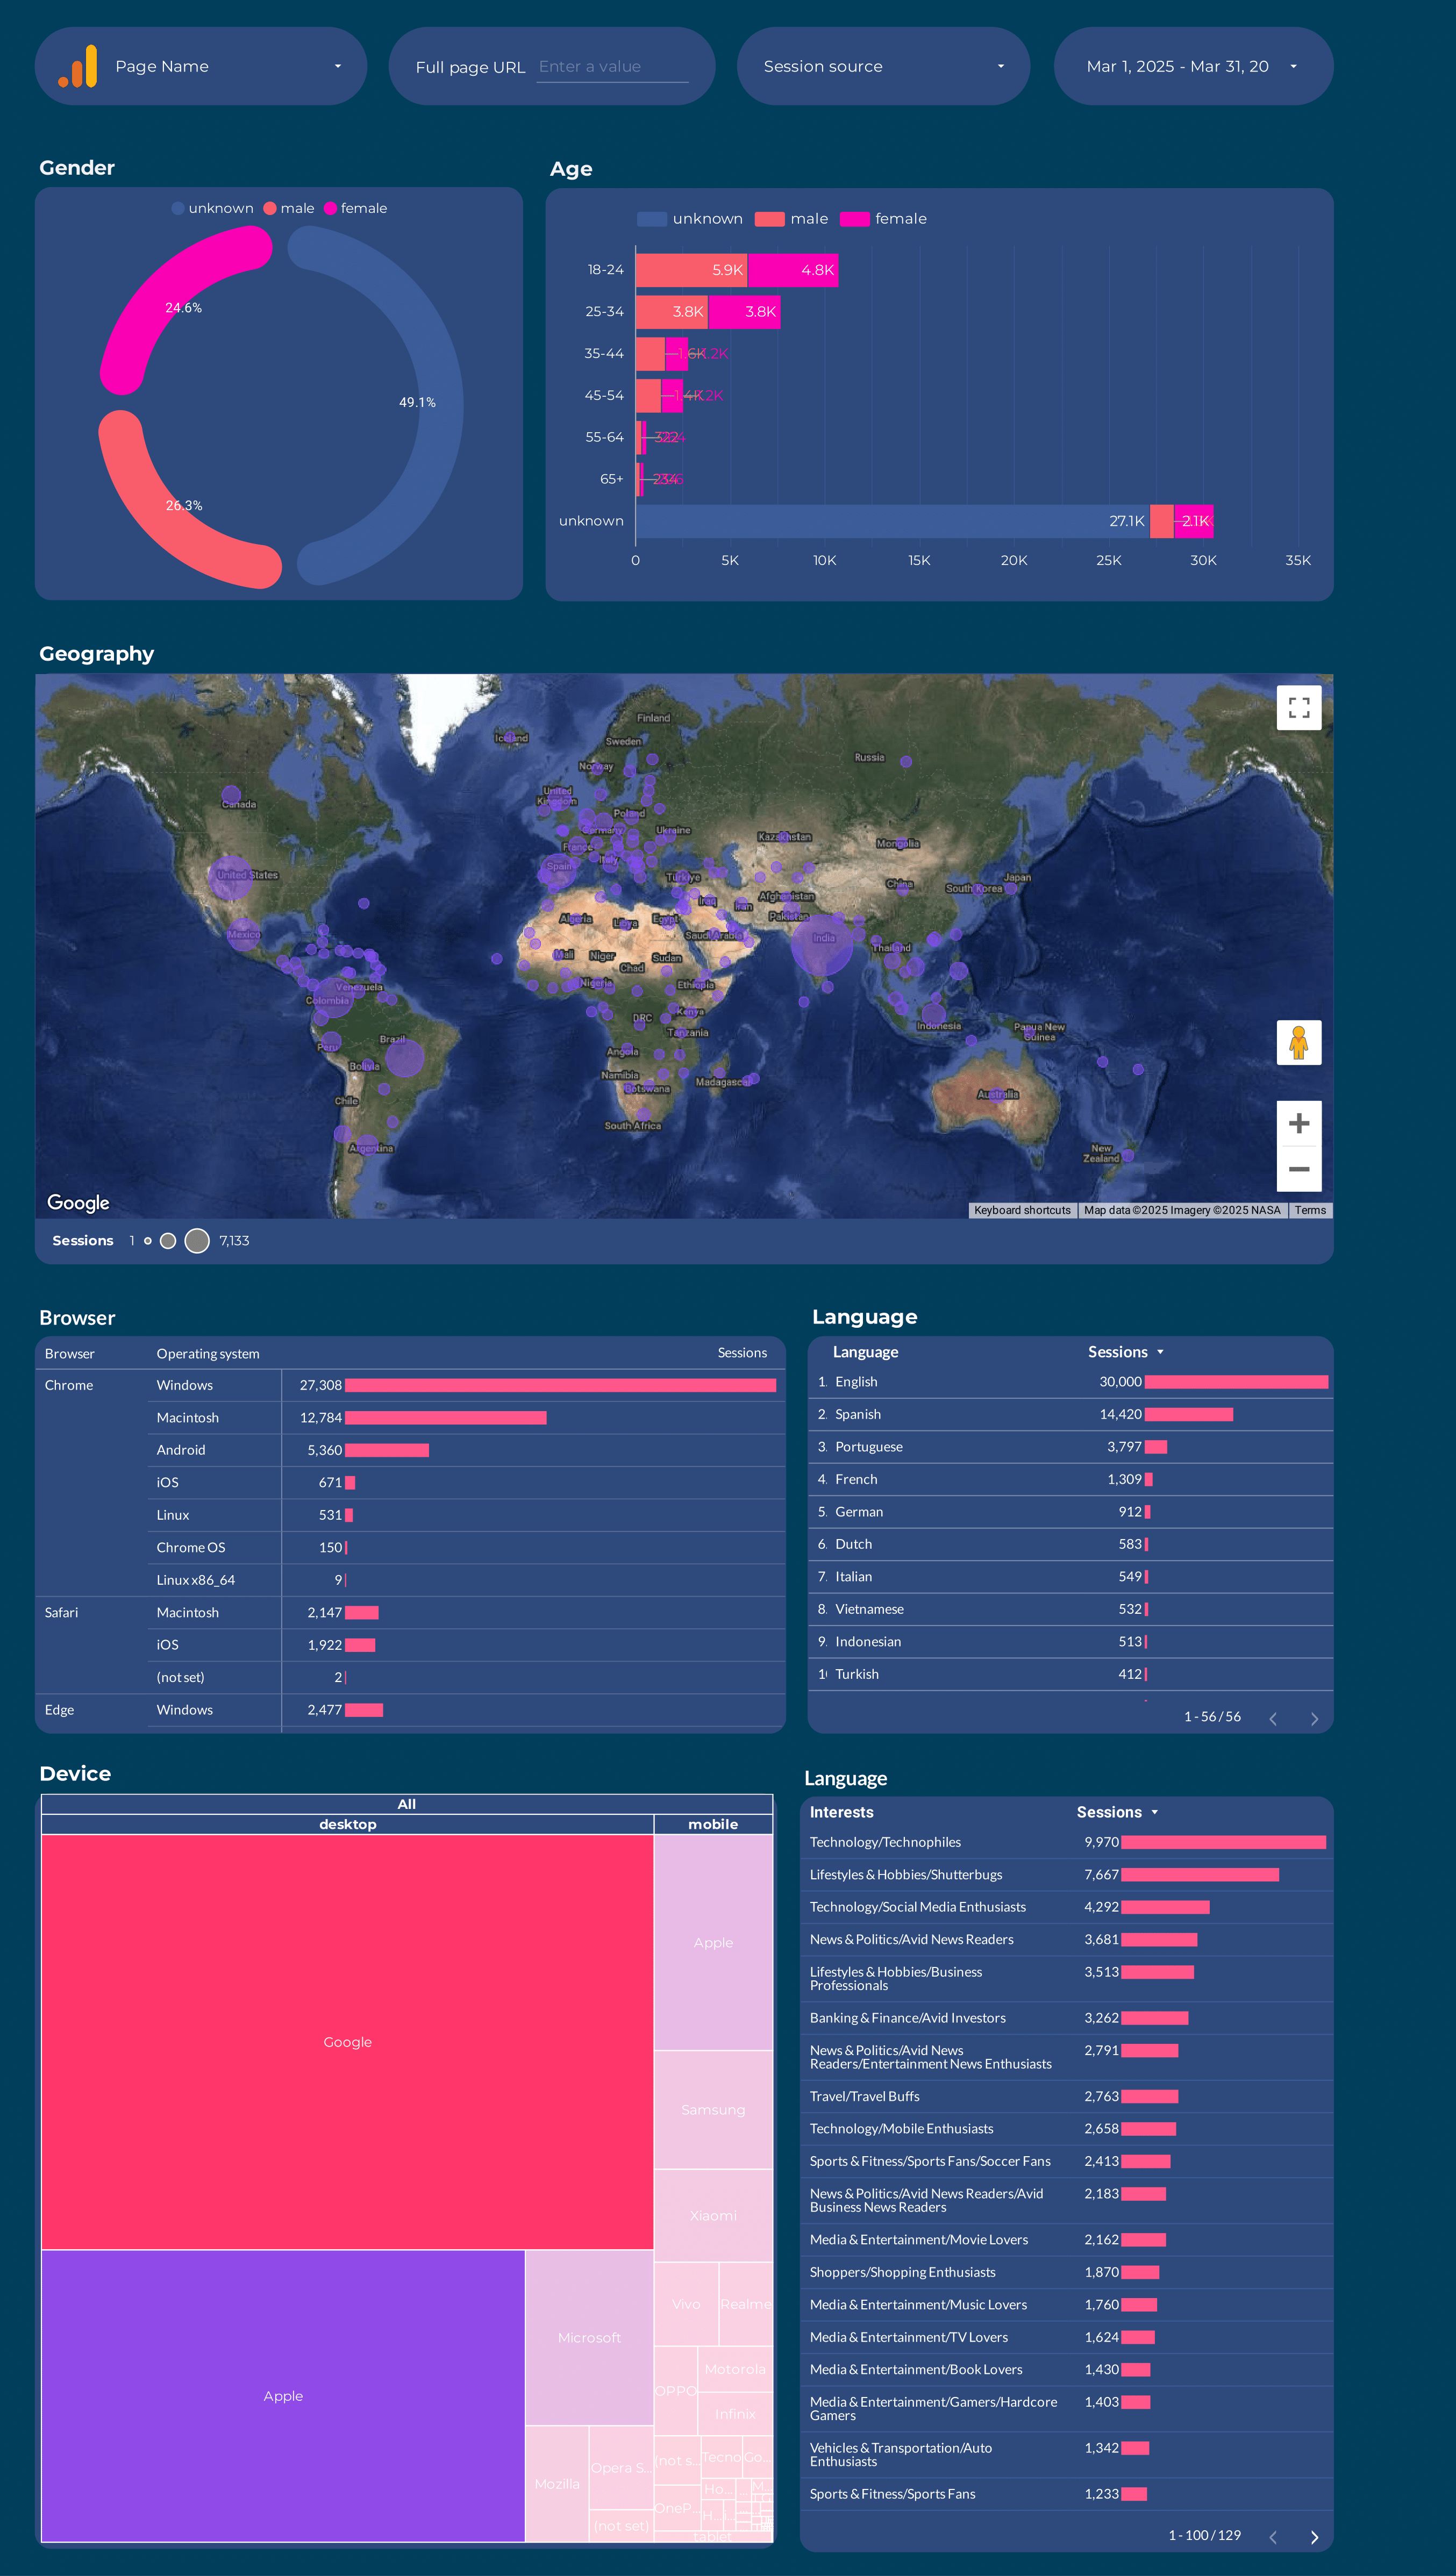
The Google Analytics 4 Audience Dashboard template provides a structured view of your audience data, enabling marketers to make informed decisions. This template is designed to help you understand your audience’s behavior and demographics.
Features include:
- Real-time Audience Insights: Monitor live data to track user interactions as they happen.
- Demographic Breakdown: Analyze user demographics such as age, gender, and location.
- Behavioral Analysis: Examine user behavior patterns, including session duration and page views.
- Custom Segments: Create and analyze custom audience segments to tailor marketing strategies.
This dashboard template is essential for marketers looking to leverage Google Analytics 4 for audience analysis and strategic planning.
Google Analytics 4 Attribution Dashboard template
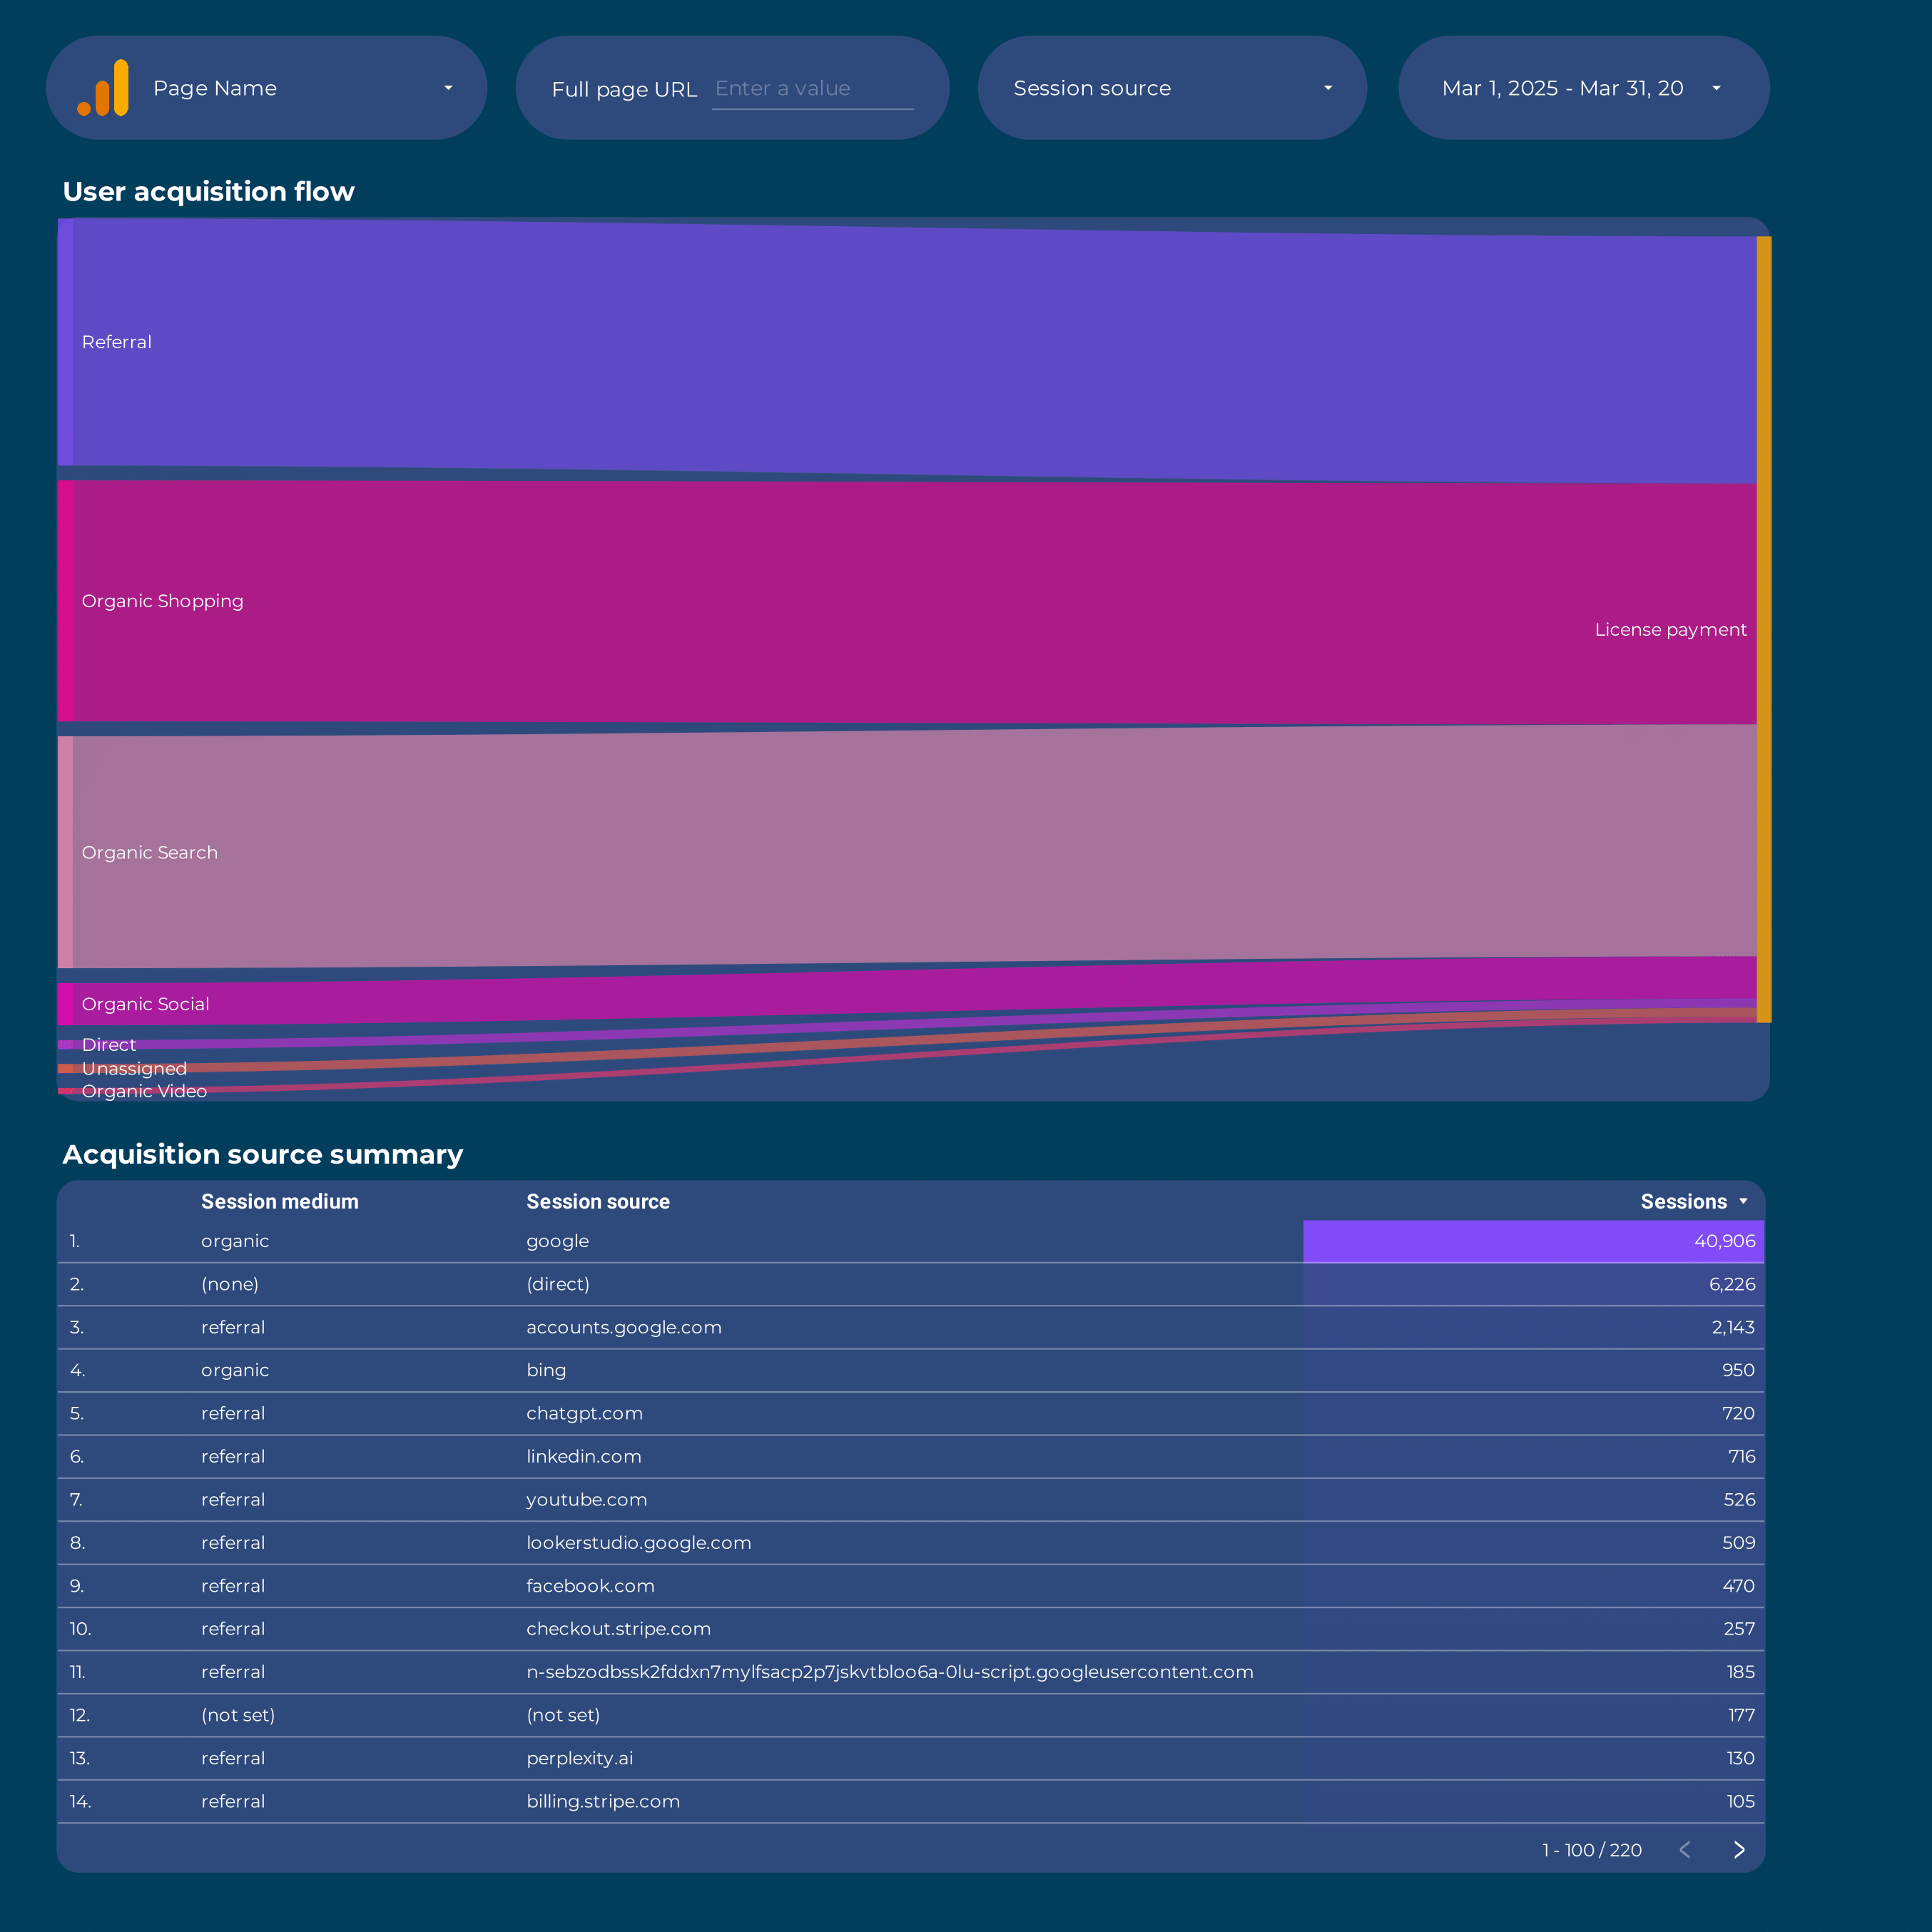
The Google Analytics 4 Attribution Dashboard template provides a detailed view of your marketing channels’ performance. This dashboard is designed to help marketers understand the attribution paths that lead to conversions, offering insights into how different channels contribute to your business goals.
With this dashboard, you can:
- Analyze multi-channel attribution to see how various marketing efforts work together.
- Track conversion paths to identify the most effective sequences of interactions.
- Evaluate the impact of each channel on your overall marketing strategy.
Utilize this template to gain a deeper understanding of your customer journey and optimize your marketing strategies based on data-driven insights.
Google Analytics 4 acquisition Dashboard template
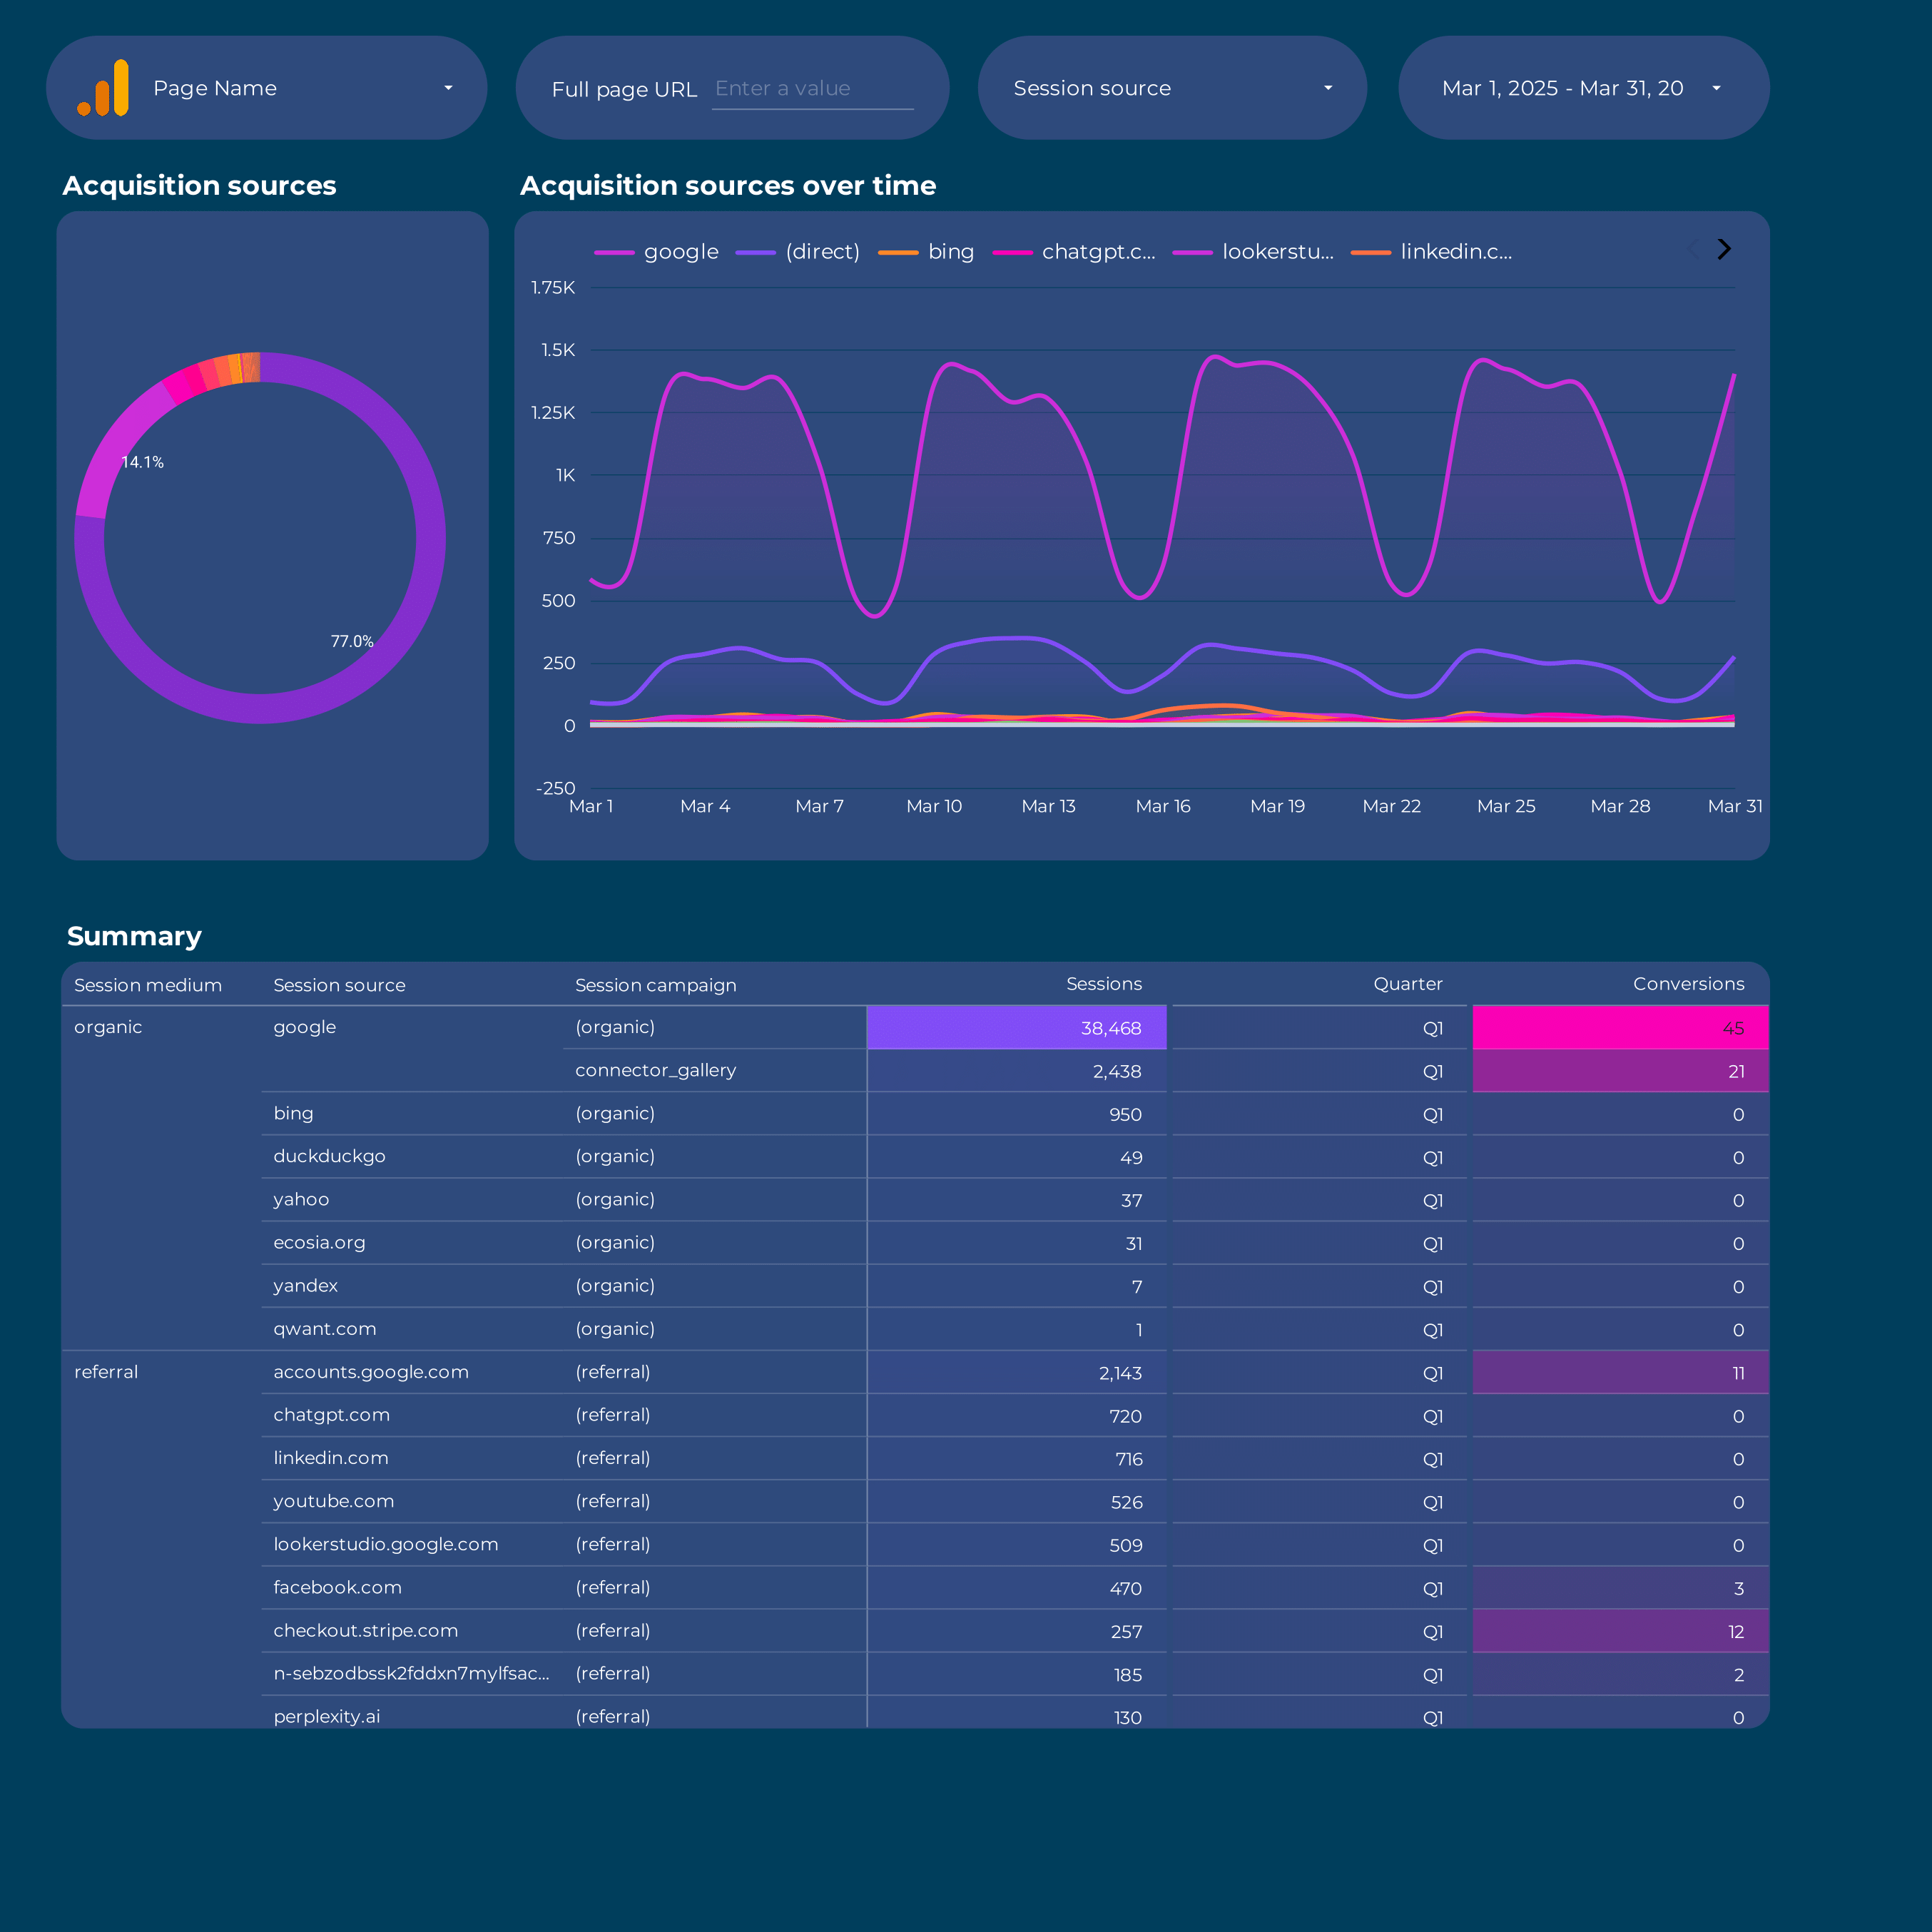
The Google Analytics 4 Acquisition Dashboard template provides a detailed overview of your website’s traffic sources and user acquisition channels. This dashboard is designed to help marketers and analysts understand how users are finding and interacting with your site.
Core Features:
- Traffic Source Analysis: Break down of user acquisition by channels such as organic search, paid search, direct, referral, and social media.
- User Engagement Metrics: Track user interactions and engagement levels across different acquisition sources.
- Attribution Insights: Analyze the contribution of various channels to conversions and user journeys.
- Real-Time Data: Monitor live data to see how current campaigns are performing.
This dashboard leverages Google Analytics 4’s advanced tracking capabilities to provide actionable insights into your marketing strategies and user acquisition efforts.
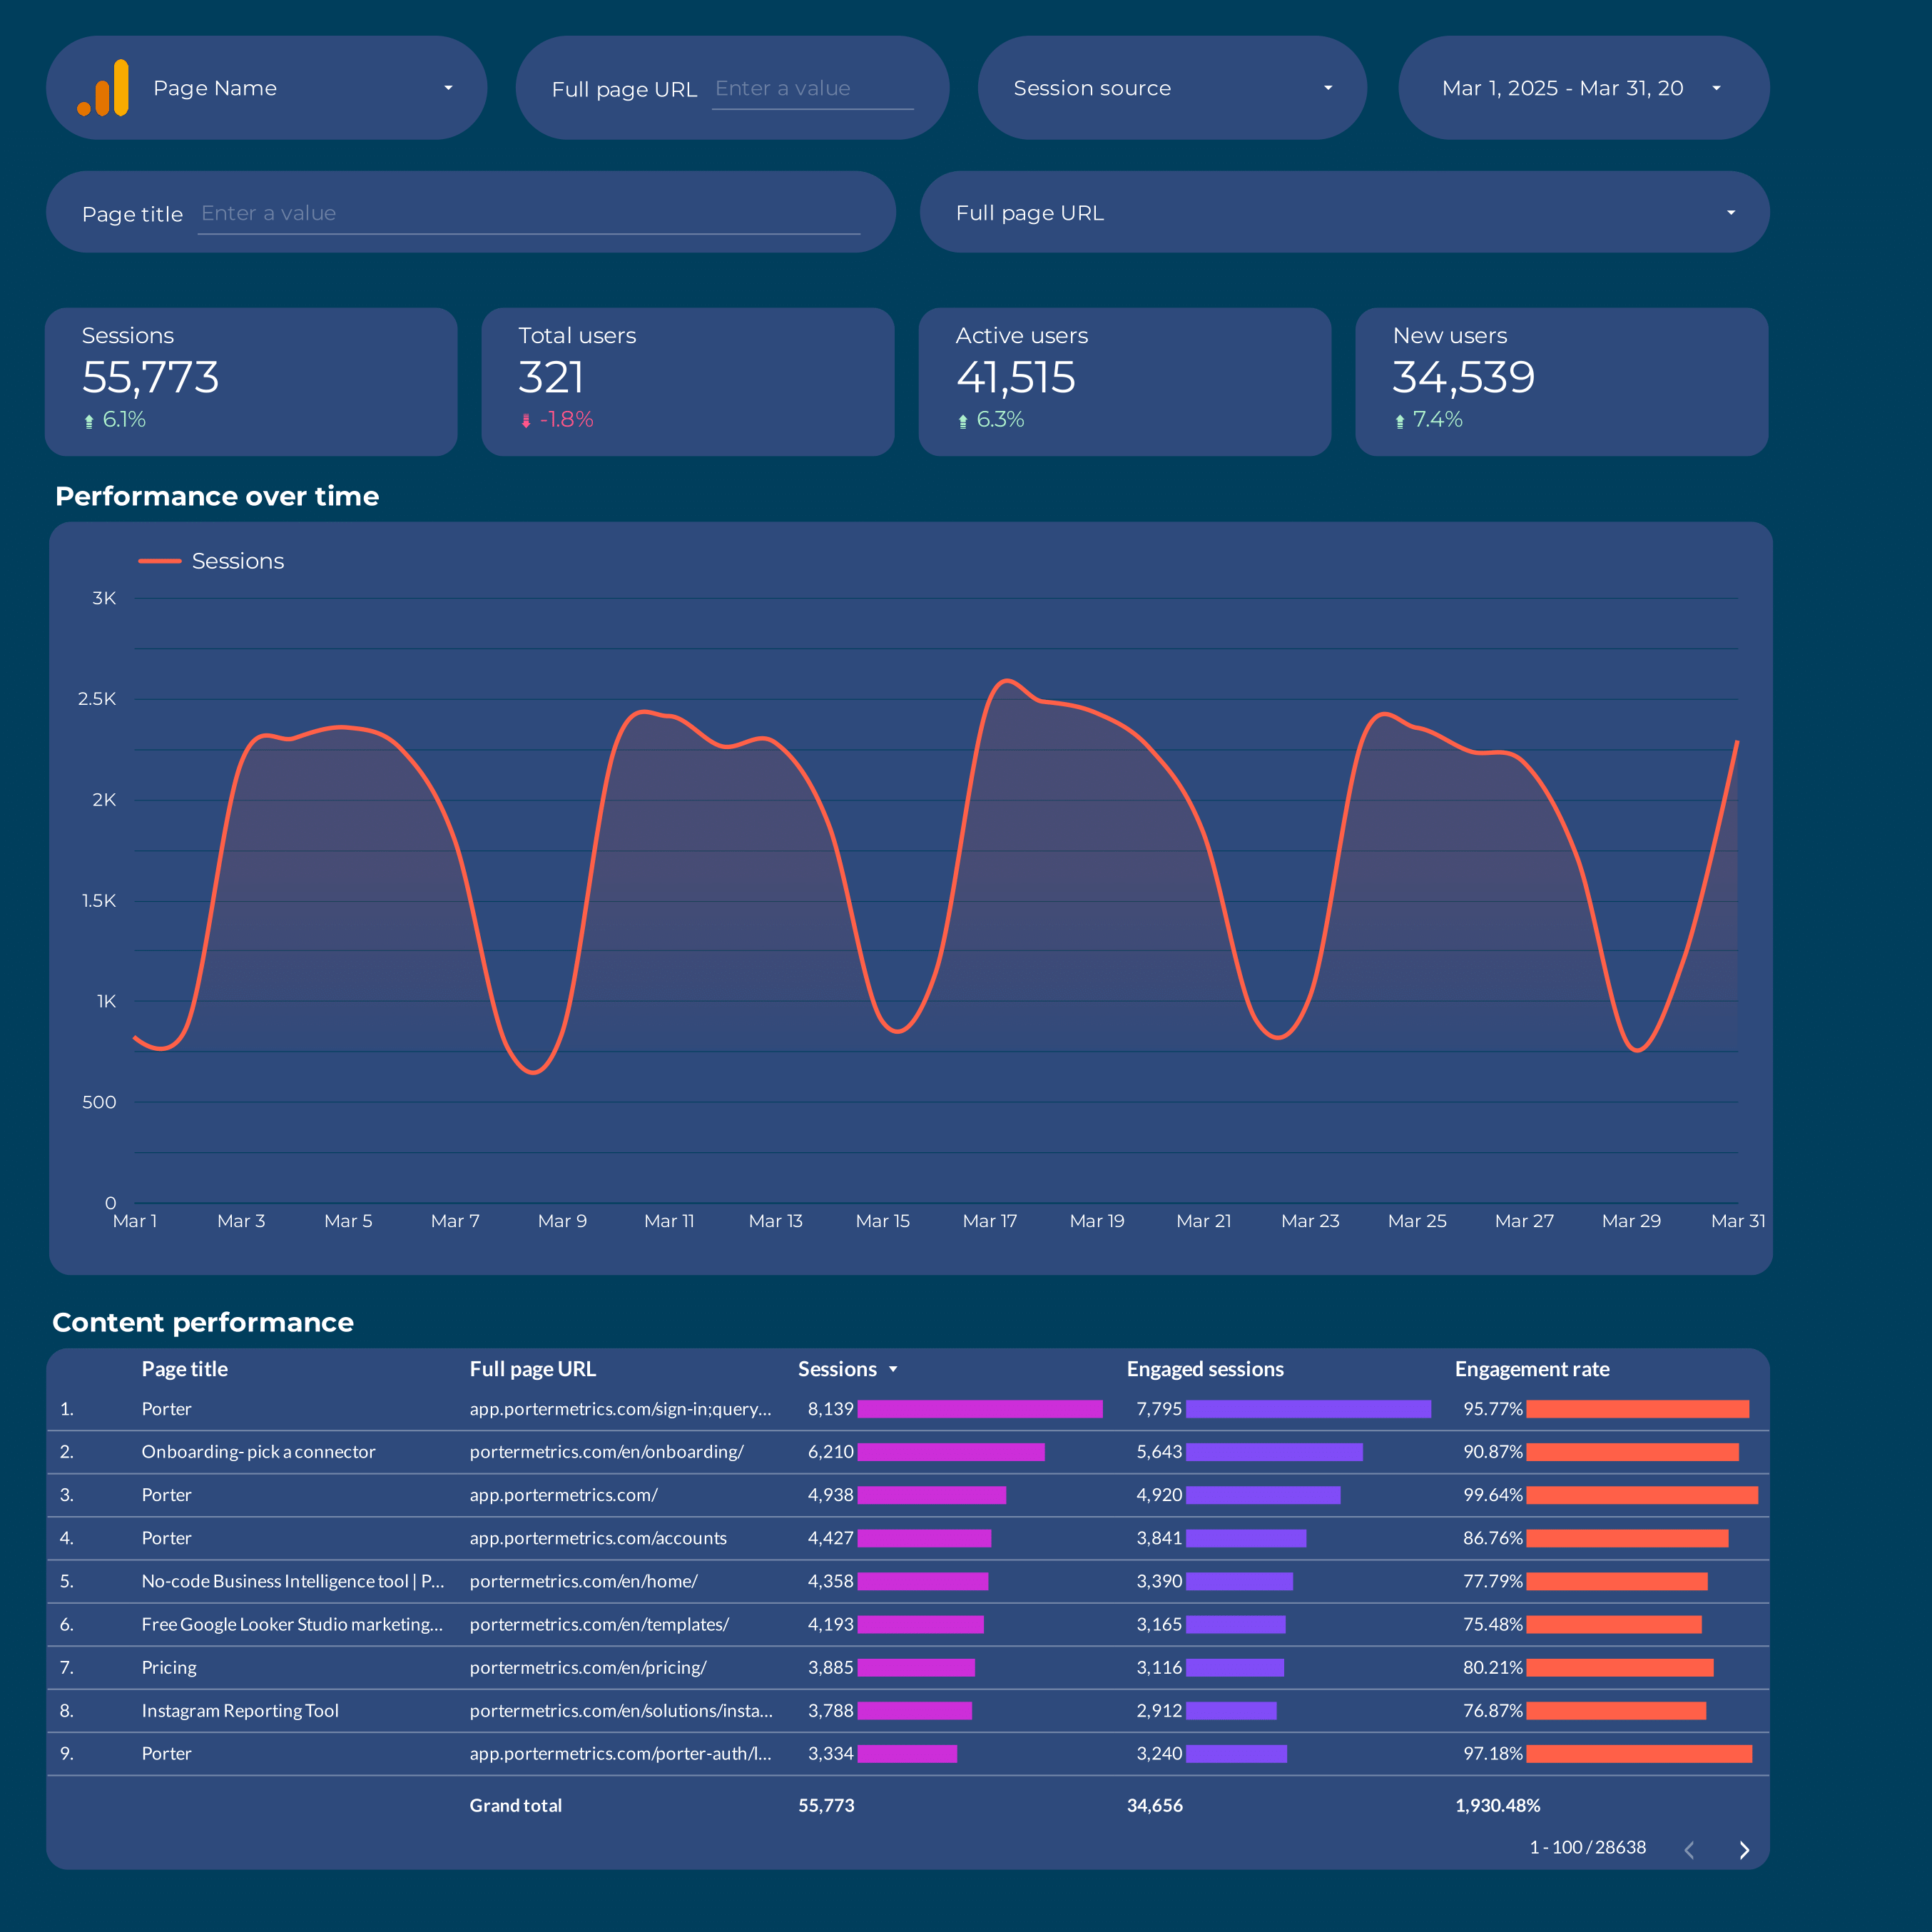
Google Analytics 4 Dashboard template
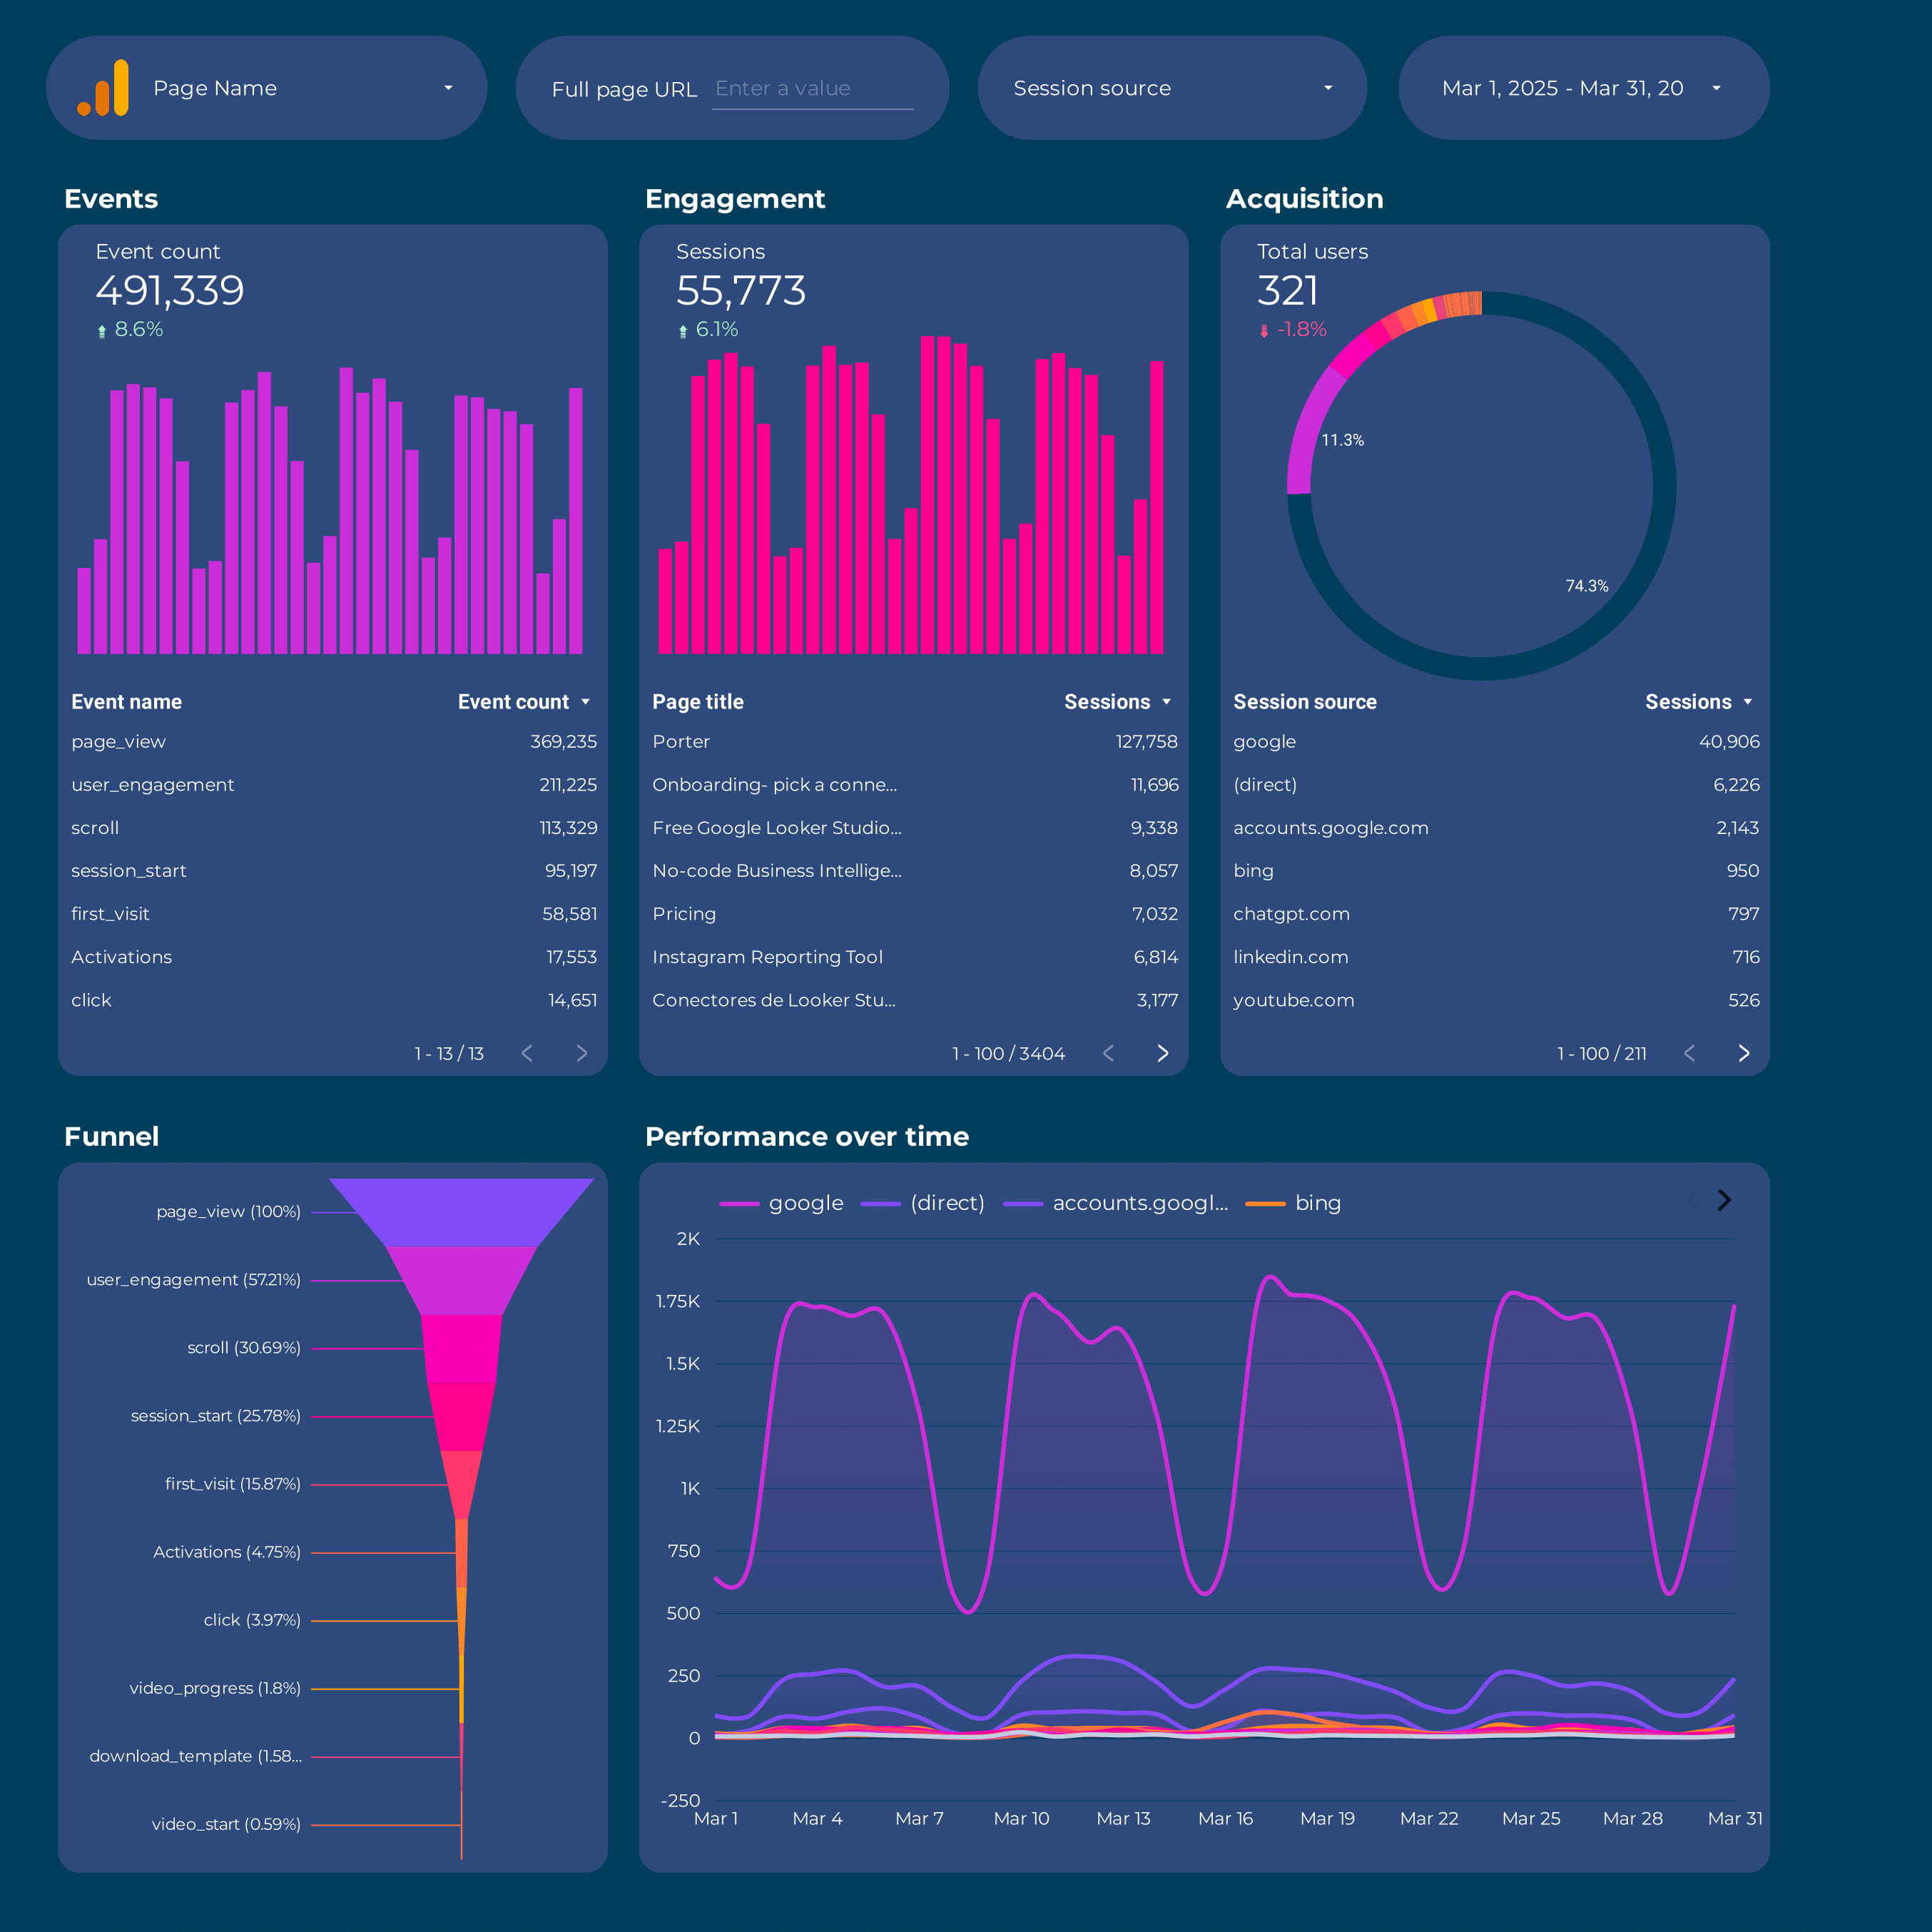
The Google Analytics 4 Dashboard Template is designed for marketing professionals and e-commerce businesses seeking to leverage website data effectively. This template provides a structured view of your Google Analytics 4 data, focusing on essential metrics and insights.
With this dashboard, you can:
- Track user acquisition and understand which channels drive the most traffic.
- Analyze user behavior to identify popular pages and content.
- Monitor conversion rates to assess the performance of marketing campaigns.
- Evaluate e-commerce metrics such as revenue, average order value, and product performance.
This template is tailored for those who need to make data-driven decisions based on real-time analytics and customizable reports.
E-commerce Dashboard template
The E-commerce Dashboard Template is designed to provide a centralized view of your online business performance. It integrates data from multiple platforms to offer a holistic view of your marketing and sales efforts.
With this dashboard, you can track and analyze data from:
- Google Analytics 4 for website traffic and user behavior insights.
- Shopify for sales and product performance metrics.
- Facebook Ads and Instagram Insights for social media advertising performance.
- Google Ads for search engine marketing analytics.
- Klaviyo for email marketing campaign results.
- TikTok Ads for video marketing effectiveness.
This template allows you to monitor PPC campaigns and assess the impact of your advertising spend across different channels. By consolidating data from Facebook Insights and other platforms, you can make informed decisions to optimize your marketing strategies.
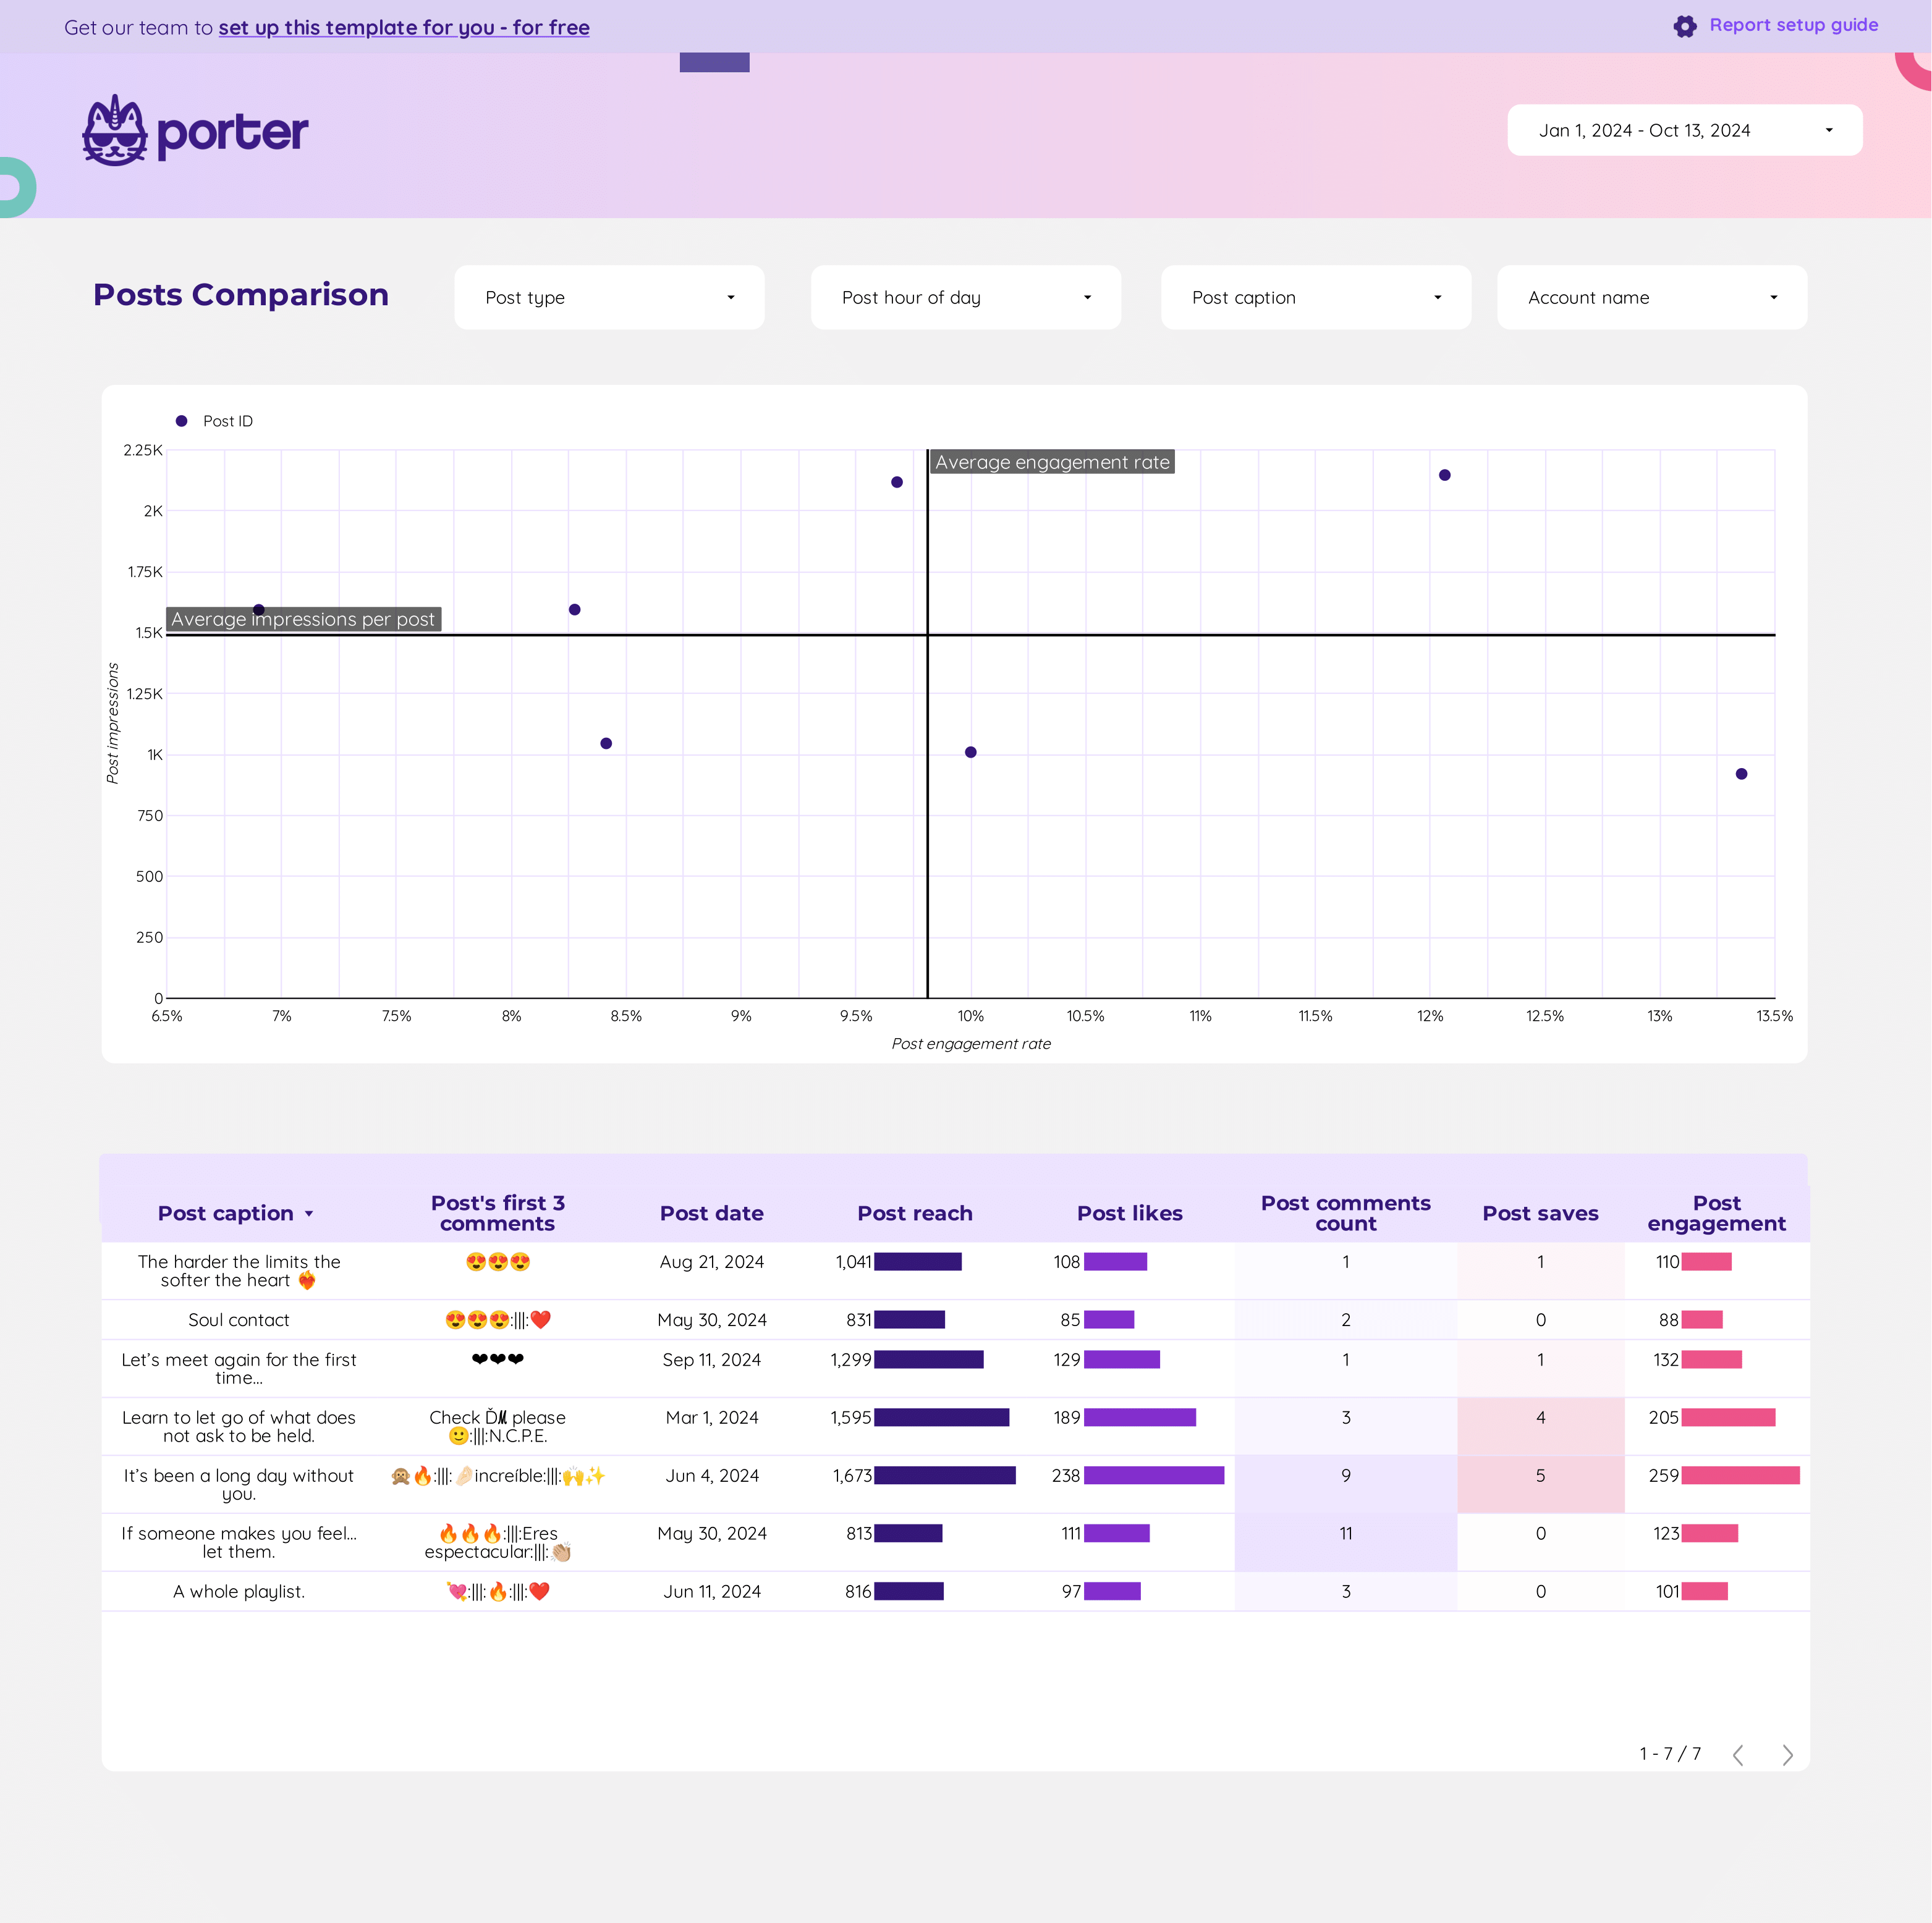
Content performance Dashboard template
The Content Performance Dashboard template integrates data from multiple social media platforms and analytics tools to provide a detailed overview of content metrics. This dashboard is designed for marketers and analysts who need to track and analyze content performance across various channels.
Data Sources:
- Google Analytics 4
- Instagram Insights
- Facebook Insights
- LinkedIn Pages
- Google Business Profile
- TikTok
Features:
- Aggregated metrics from multiple platforms
- Visual representation of engagement trends
- Comparative analysis of content performance
- Customizable views for specific social media channels
This dashboard template is essential for tracking social media content performance, providing insights into audience engagement, reach, and conversion metrics.
Content marketing Dashboard template
The Content Marketing Dashboard Template is designed to provide marketers with a streamlined view of their content performance using Google Analytics 4. This template integrates essential metrics and dimensions to help you track and analyze your content marketing efforts effectively.
With this dashboard, you can:
- Monitor user engagement metrics such as page views, session duration, and bounce rate.
- Analyze traffic sources to understand where your audience is coming from and how they interact with your content.
- Evaluate conversion rates to measure the success of your content in driving desired actions.
- Track audience demographics to tailor your content strategy to your target audience.
This template leverages the advanced capabilities of Google Analytics 4 to provide a detailed overview of your content marketing performance, enabling data-driven decision-making.
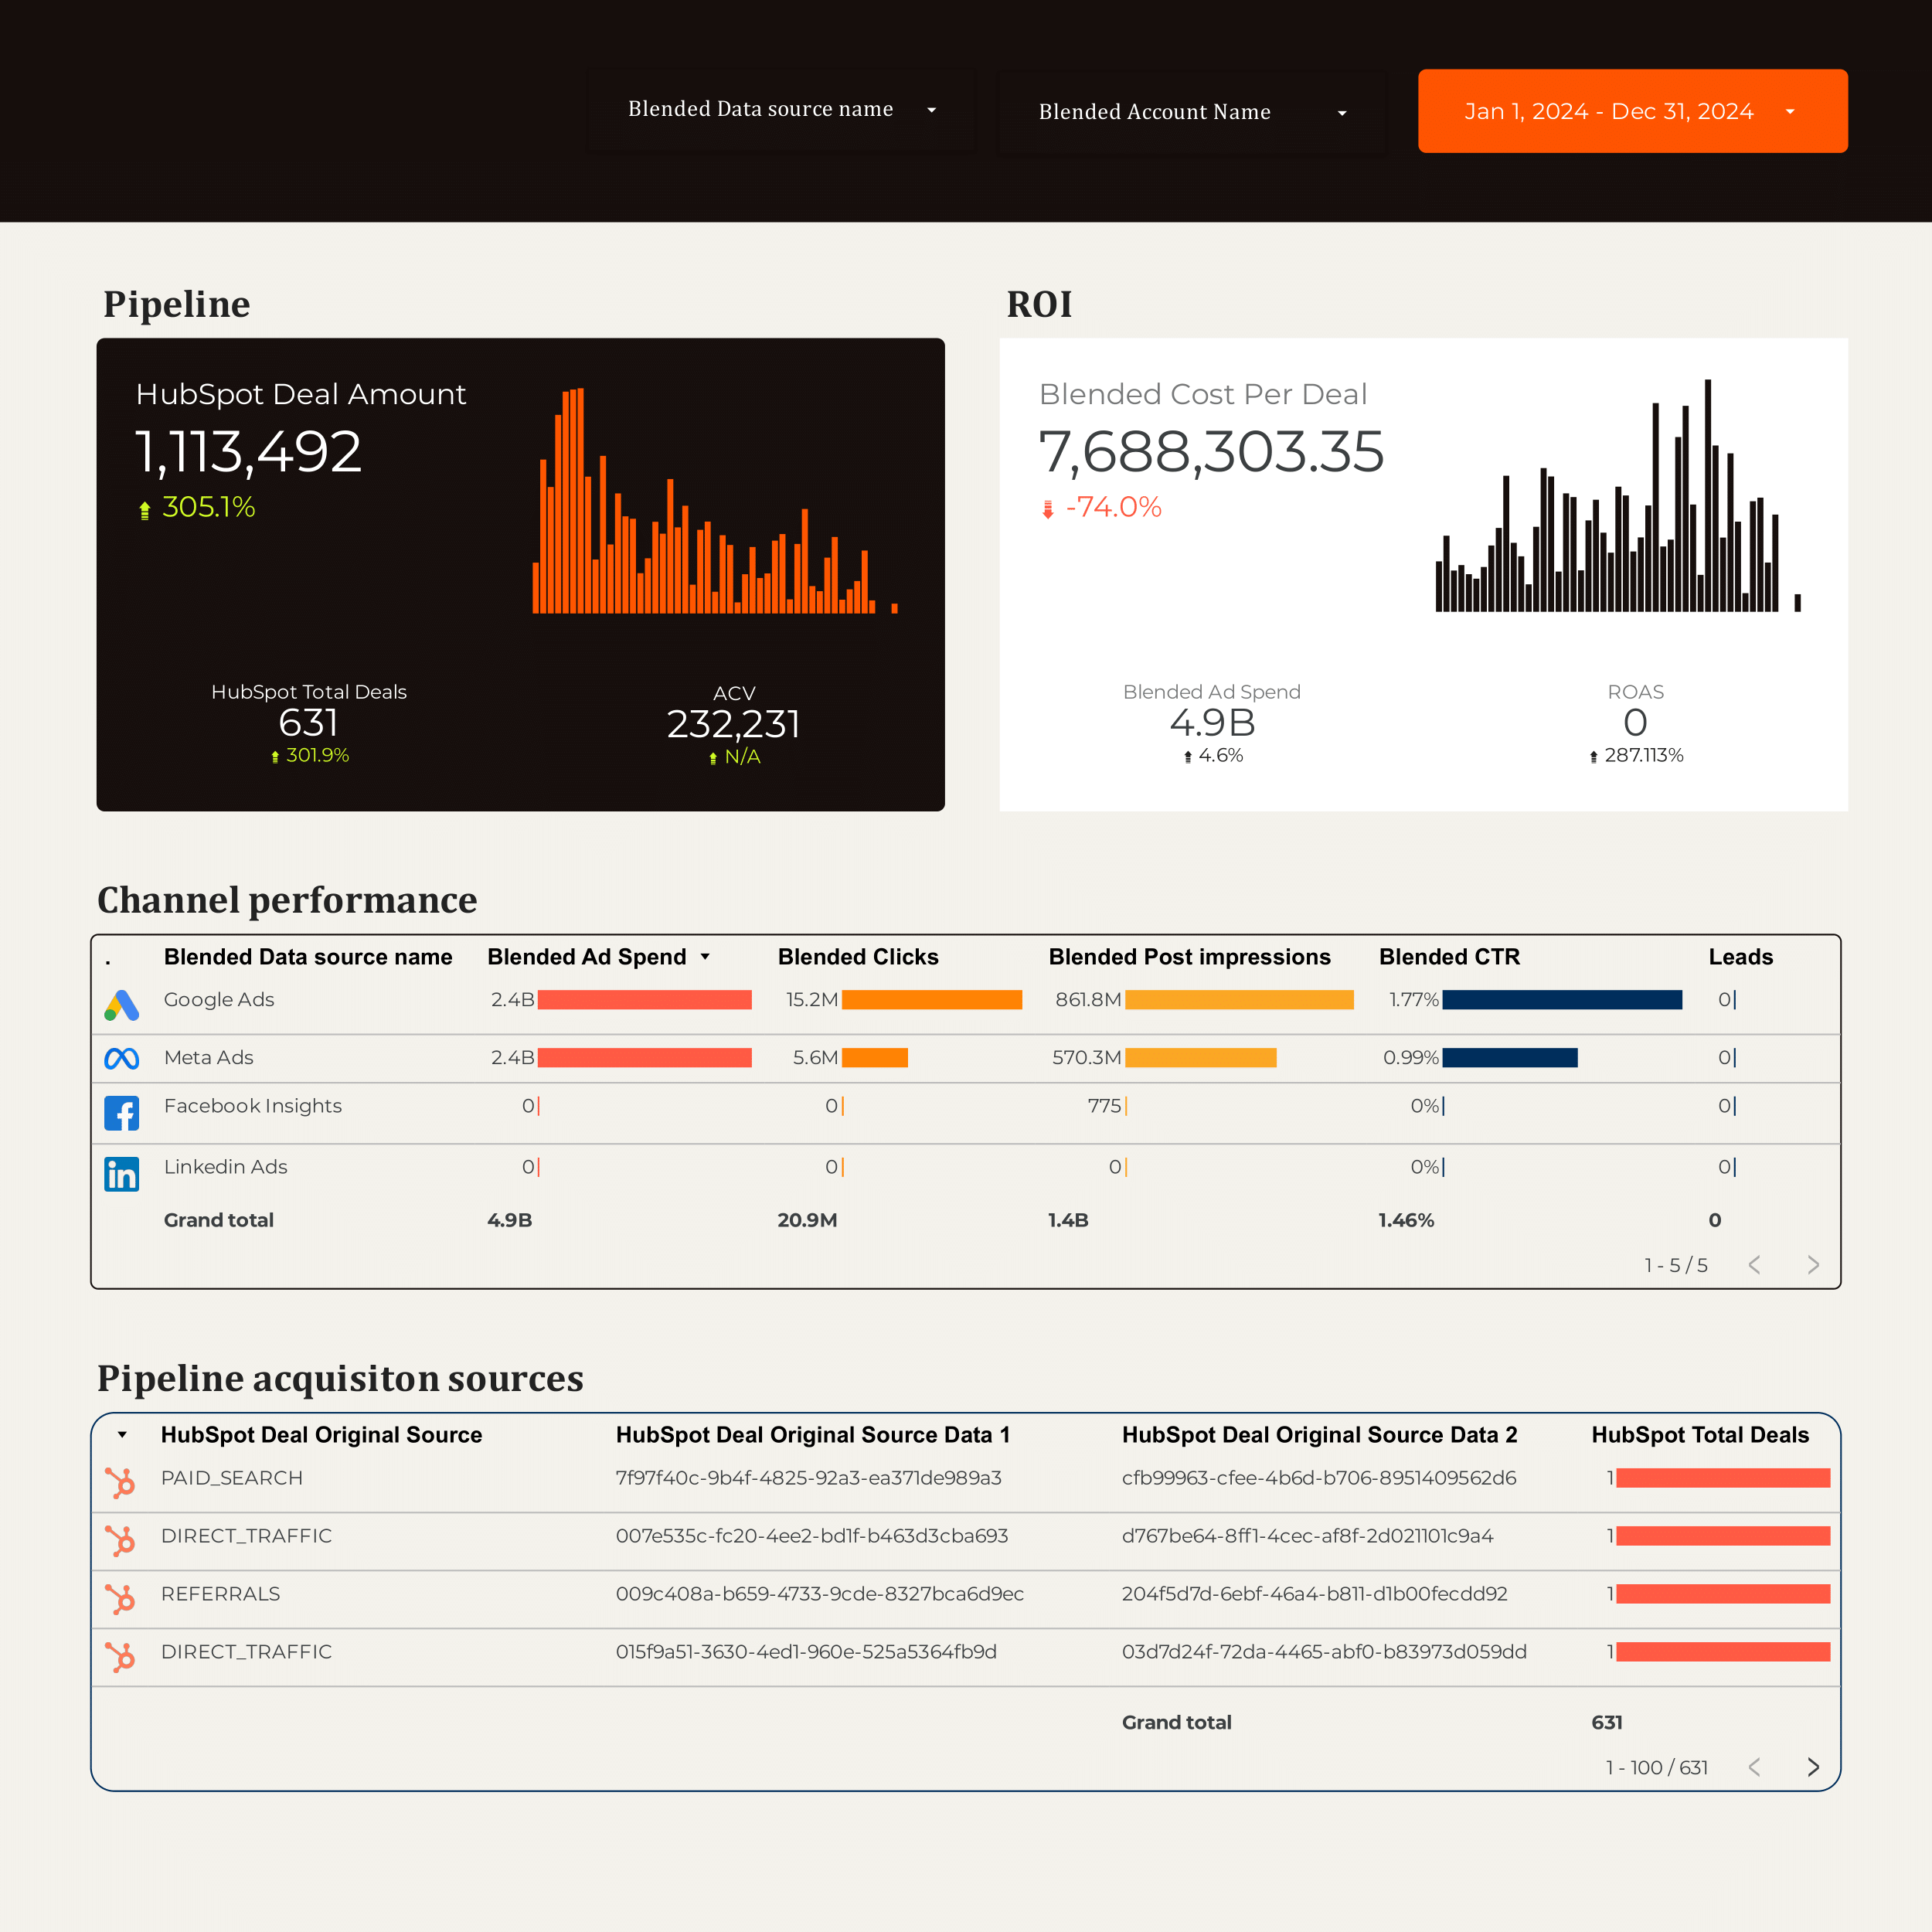
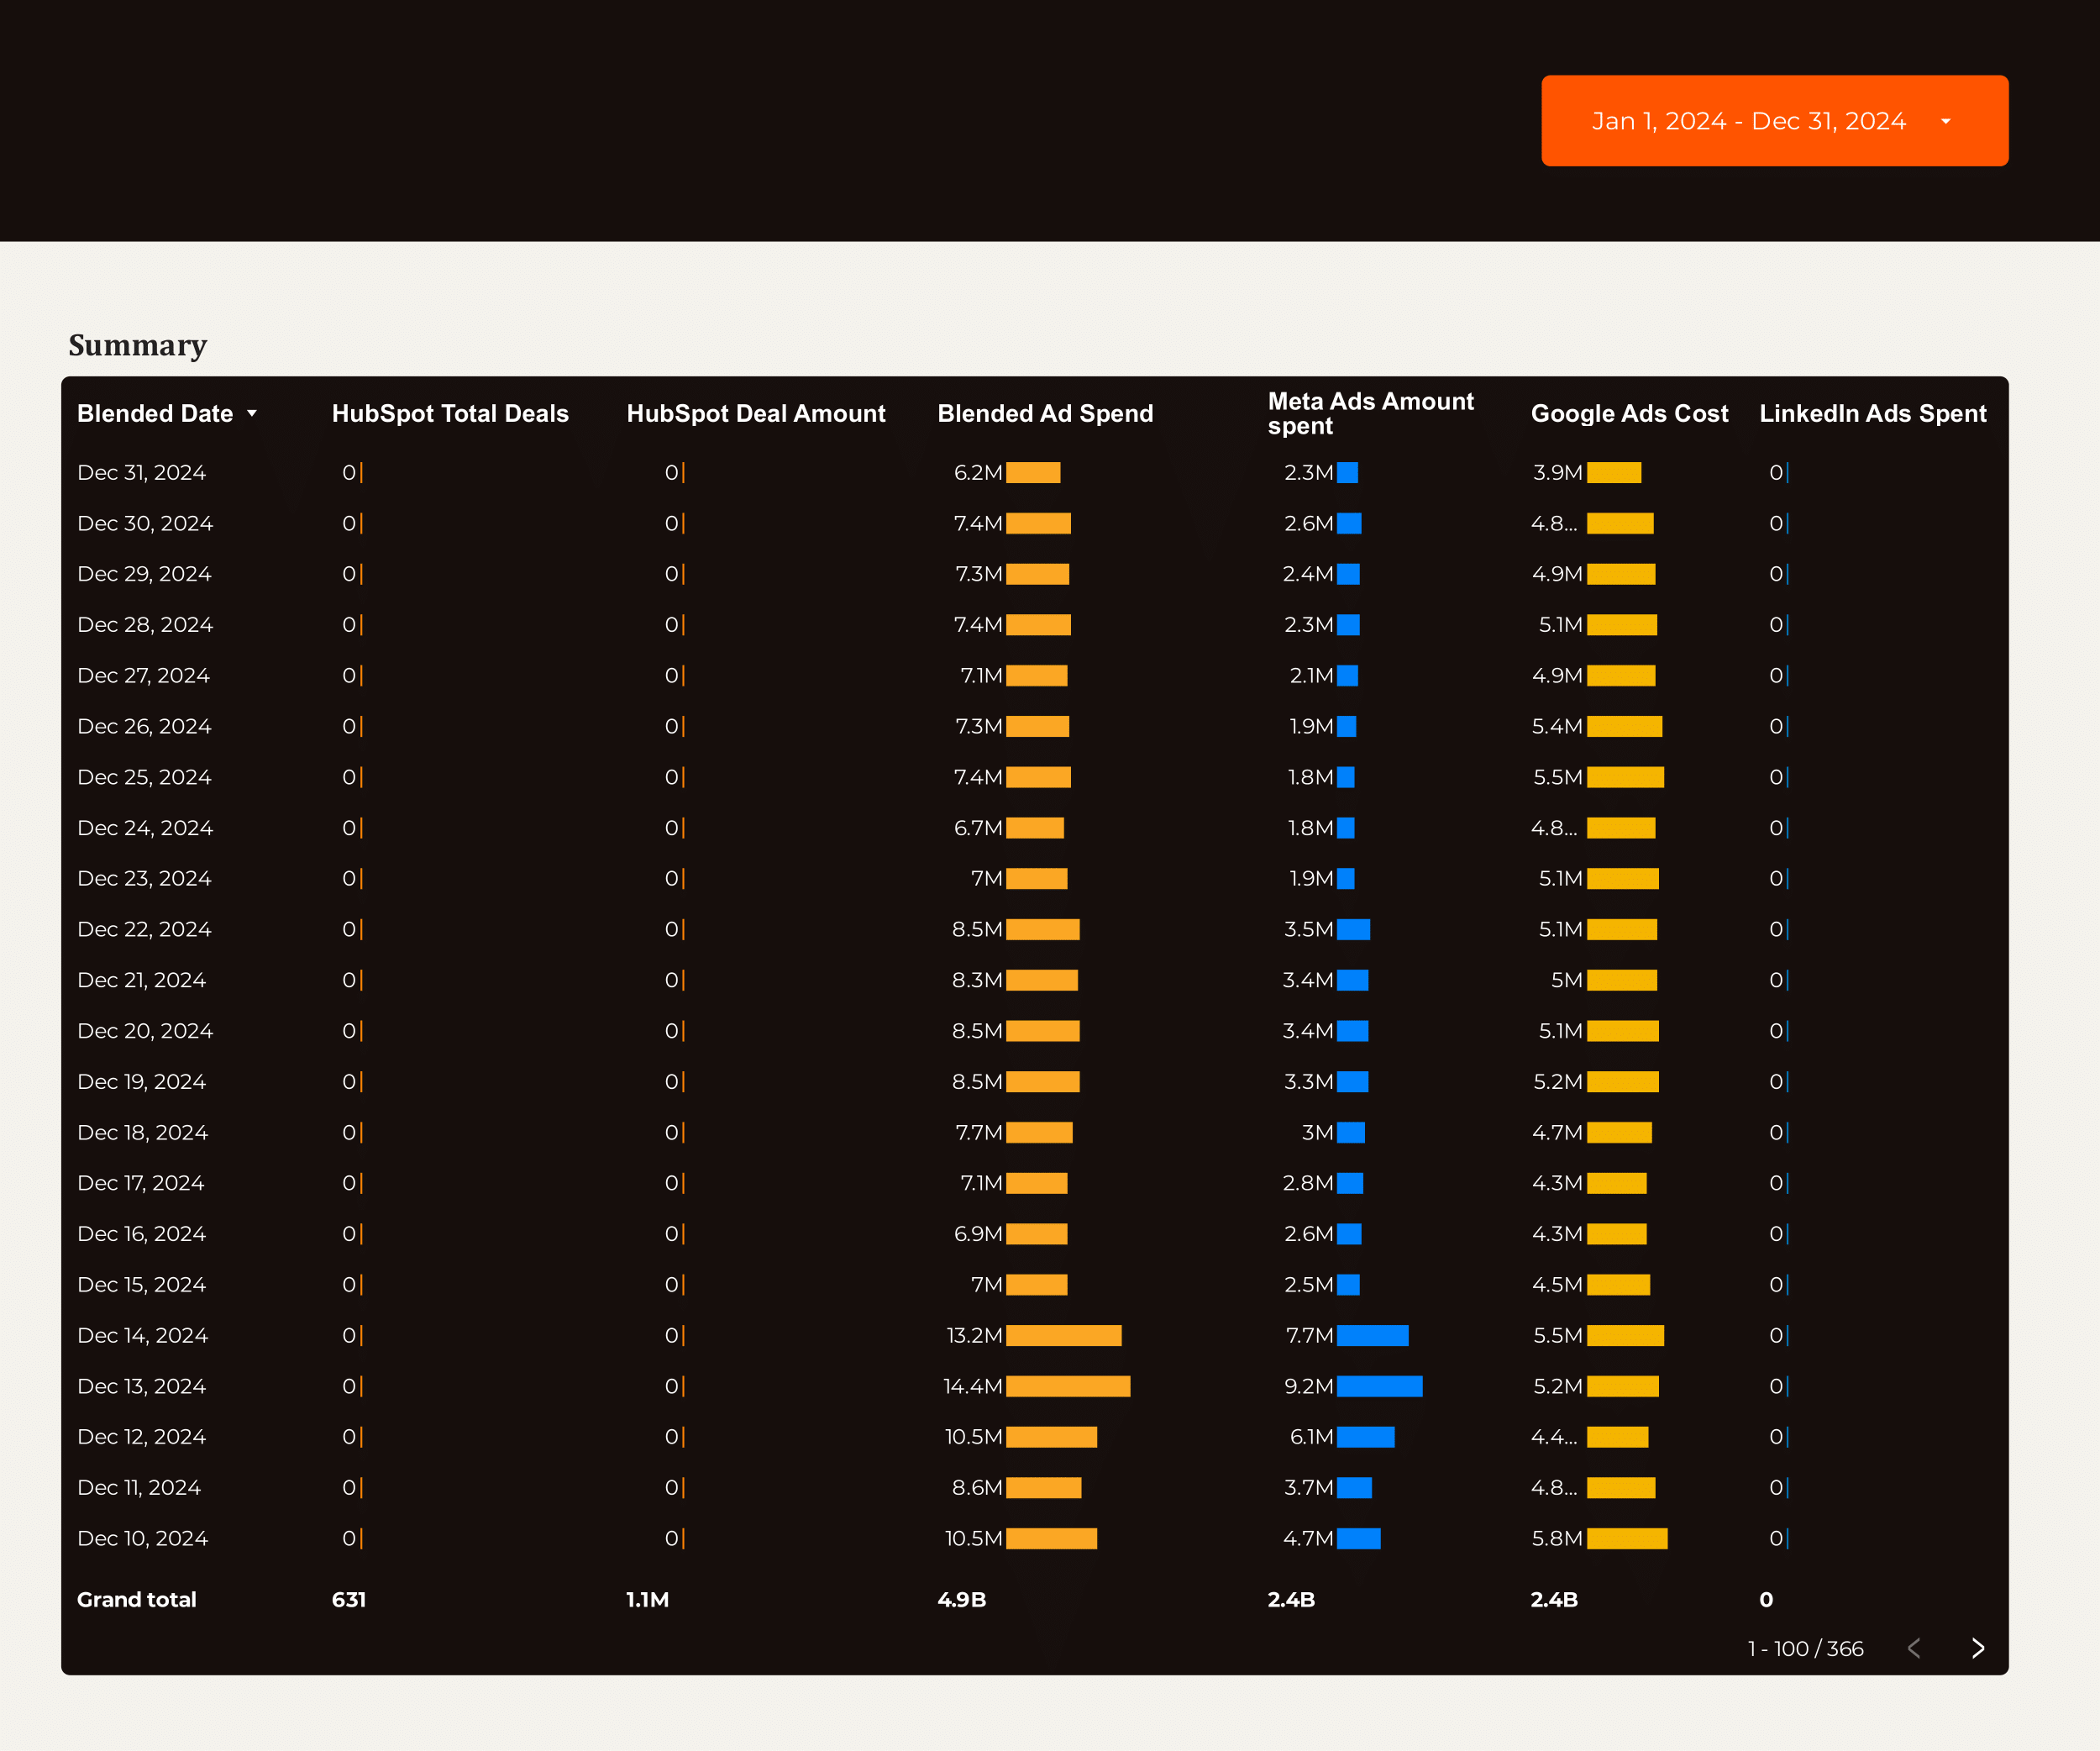
B2B Dashboard template
The B2B Dashboard template integrates with HubSpot, Facebook Ads, Google Ads, LinkedIn Ads, and Google Analytics 4 to provide a centralized view of your marketing and sales data.
Utilize this dashboard to track and analyze:
- CRM Data from HubSpot for lead management and sales performance.
- PPC Campaigns across Facebook, Google, and LinkedIn Ads to monitor ad spend and ROI.
- SEO Metrics to assess organic search performance and traffic sources.
- Website Analytics through Google Analytics 4 for user behavior insights and conversion tracking.
This template is designed for B2B marketers seeking to streamline data from multiple platforms into a single, actionable interface.