
The best free e-commerce dashboard templates in 2026 connect your Shopify, Google Analytics 4, and ad platforms to Data Studio (formerly Looker Studio) — tracking revenue, orders, AOV, ROAS, and product performance automatically.
Built and tested by Porter Metrics, used by +10,000 marketing teams worldwide.
Quick answer — 10 Best Free E-commerce Dashboard Templates in 2026
Quick Comparison
| Template | Best For | Setup |
|---|---|---|
 Shopify Most Popular Shopify Most Popular | 2 min | |
| Shopify Store Performance | 2 min | |
| Shopify KPIs | 2 min | |
| Shopify Attribution | 2 min | |
| E-commerce Popular | 2 min | |
 Paid Media E-commerce Paid Media E-commerce | 2 min | |
| AOV | 2 min | |
| DTC | 2 min | |
| Dropshipping | 2 min | |
| Amazon Seller Central | 2 min |
The 10 Best Templates
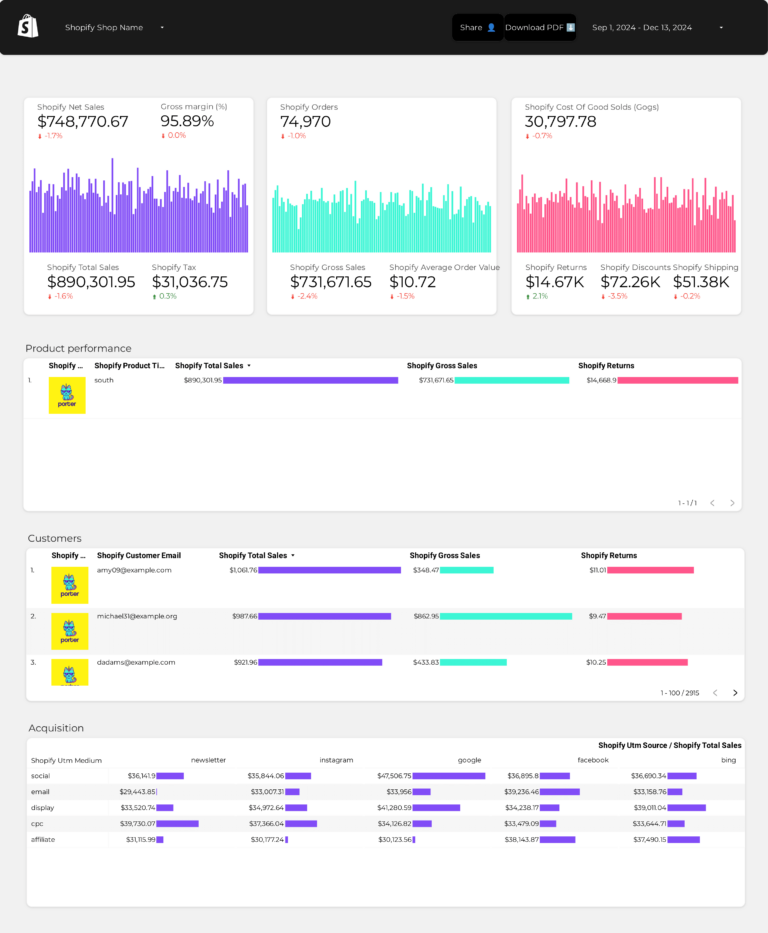
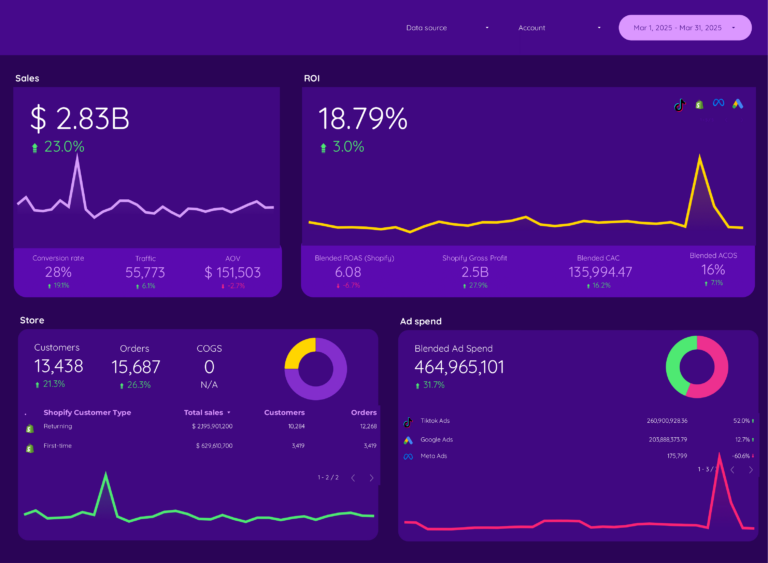
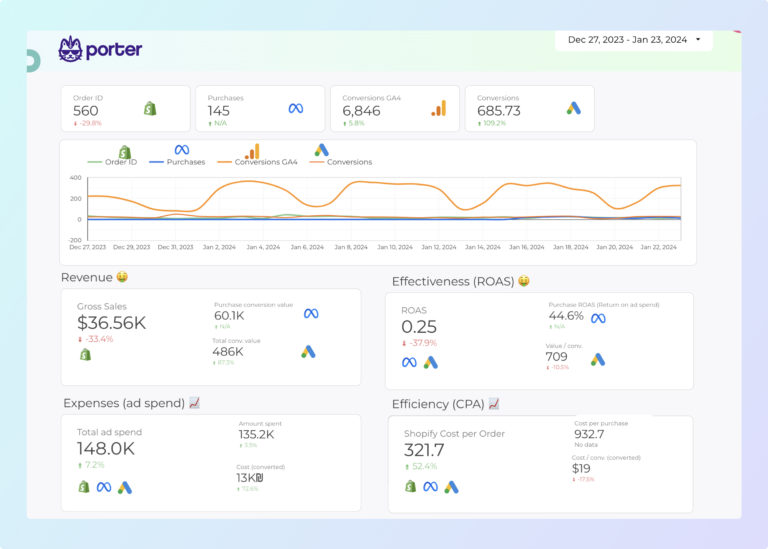
Shopify Dashboard Template
Most PopularShopify store funnel: sessions and traffic sources (visibility — who’s arriving), product views and add-to-cart rate (engagement — what interests them), orders and revenue (conversion — what they bought). Session-to-order conversion rate is the headline metric — everything else explains why it moves.
Key metrics visualized
- Visibility: sessions, users, traffic sources
- Engagement: product views, add to cart, cart abandonment rate
- Conversion: orders, revenue, AOV, customer lifetime value, ROAS
- Set up period-over-period comparisons to track trends, not just totals
- Segment by audience or campaign to find what drives the best results
- Focus on conversion metrics first — visibility and engagement only matter if they lead to outcomes
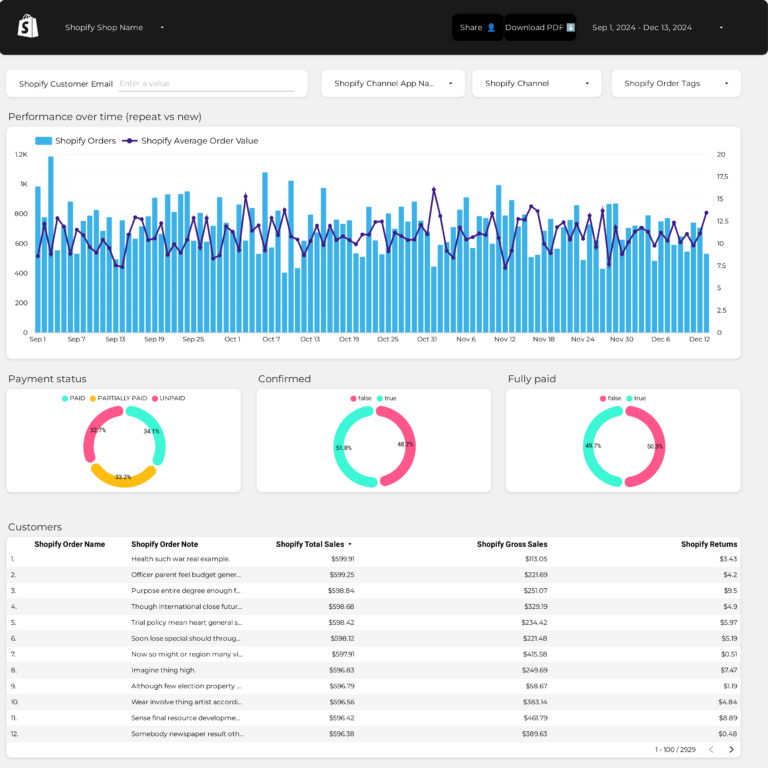
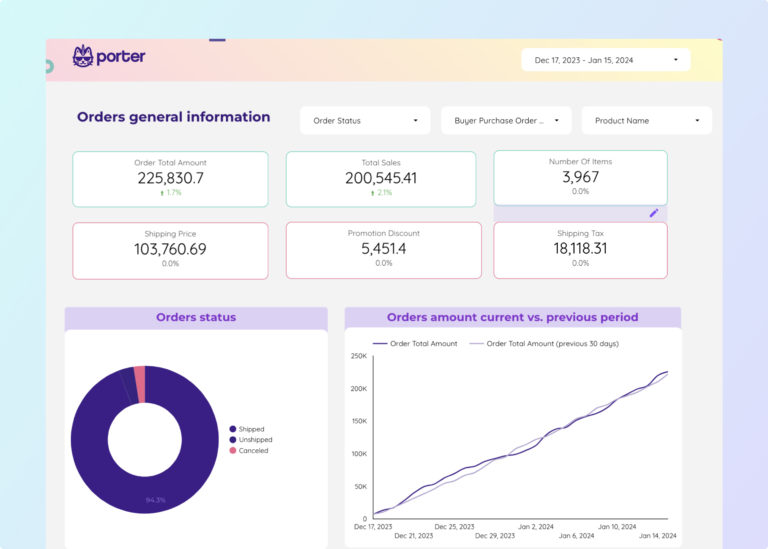
Shopify Store Performance Dashboard Template
Store performance by product: revenue, units sold, and average selling price per SKU. Shows which products drive revenue vs which sit in inventory. Combined with traffic source data, tells you which marketing channels bring buyers for your most profitable products — not just any products.
Key metrics visualized
- Visibility: sessions, users, traffic sources
- Engagement: product views, add to cart, cart abandonment rate
- Conversion: orders, revenue, AOV, customer lifetime value, ROAS
- Set up period-over-period comparisons to track trends, not just totals
- Segment by audience or campaign to find what drives the best results
- Focus on conversion metrics first — visibility and engagement only matter if they lead to outcomes
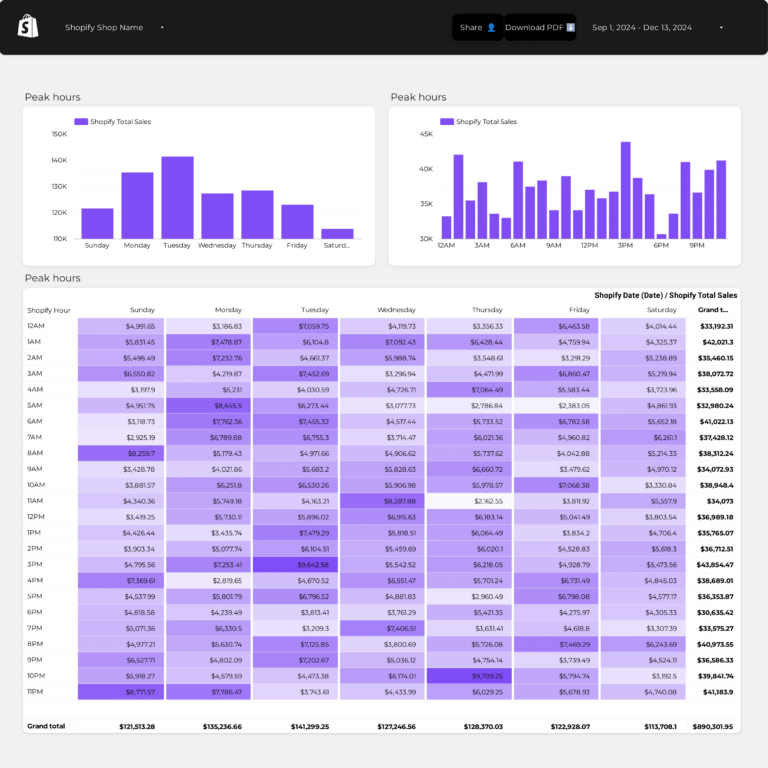
Shopify KPIs Dashboard Template
Shopify scorecard: revenue, orders, AOV, conversion rate — each with targets and period-over-period deltas showing whether you’re improving (engagement and conversion efficiency) or declining. A 30-second morning check that tells you which funnel stage needs attention today.
Key metrics visualized
- Visibility: sessions, users, traffic sources
- Engagement: product views, add to cart, cart abandonment rate
- Conversion: orders, revenue, AOV, customer lifetime value, ROAS
- Set up period-over-period comparisons to track trends, not just totals
- Segment by audience or campaign to find what drives the best results
- Focus on conversion metrics first — visibility and engagement only matter if they lead to outcomes
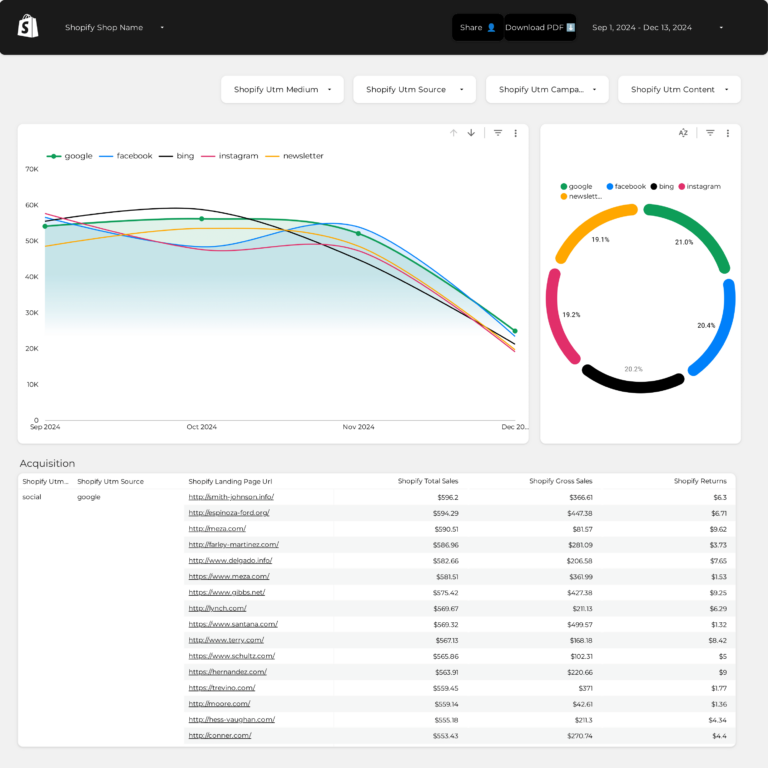
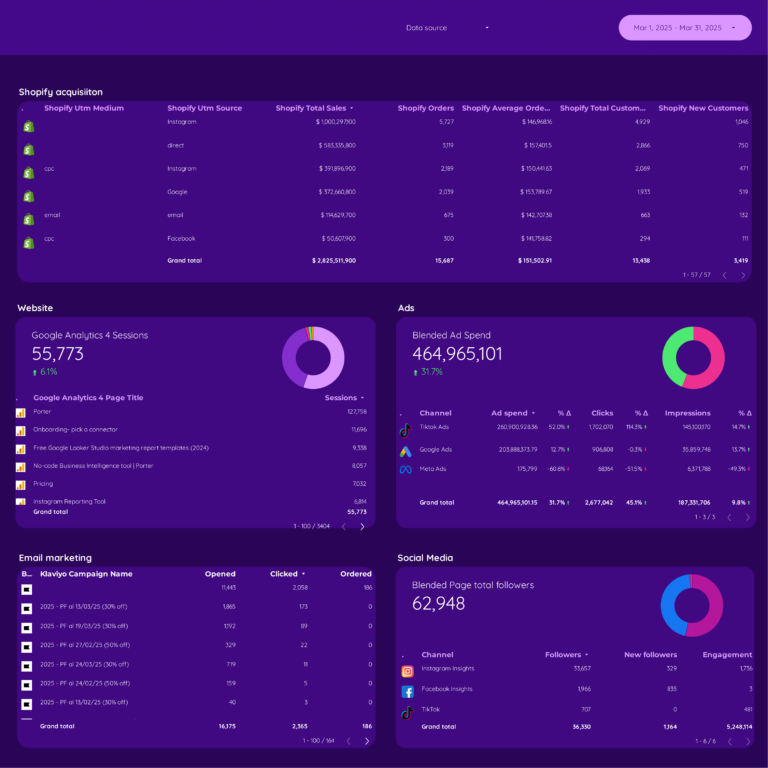
Shopify Attribution Dashboard Template
Traffic attribution: revenue and orders by UTM source, medium, and campaign. Connects ad spend to actual store sales — not just clicks. Shows true ROAS per channel. A Facebook campaign might drive 5,000 clicks but only $200 in orders, while email drives 500 clicks and $3,000 in orders.
Key metrics visualized
- Visibility: sessions, users, traffic sources
- Engagement: product views, add to cart, cart abandonment rate
- Conversion: orders, revenue, AOV, customer lifetime value, ROAS
- Set up period-over-period comparisons to track trends, not just totals
- Segment by audience or campaign to find what drives the best results
- Focus on conversion metrics first — visibility and engagement only matter if they lead to outcomes
E-commerce Dashboard Template
PopularE-commerce funnel with GA4 behavior data: sessions (visibility), scroll depth and time on page (engagement quality), cart abandonment rate (conversion leak), and revenue by product. Shows not just what people buy, but how they browse — the engagement context that Shopify data alone doesn’t provide.
Key metrics visualized
- Visibility: sessions, users, traffic sources
- Engagement: product views, add to cart, cart abandonment rate
- Conversion: orders, revenue, AOV, customer lifetime value, ROAS
- Set up period-over-period comparisons to track trends, not just totals
- Segment by audience or campaign to find what drives the best results
- Focus on conversion metrics first — visibility and engagement only matter if they lead to outcomes
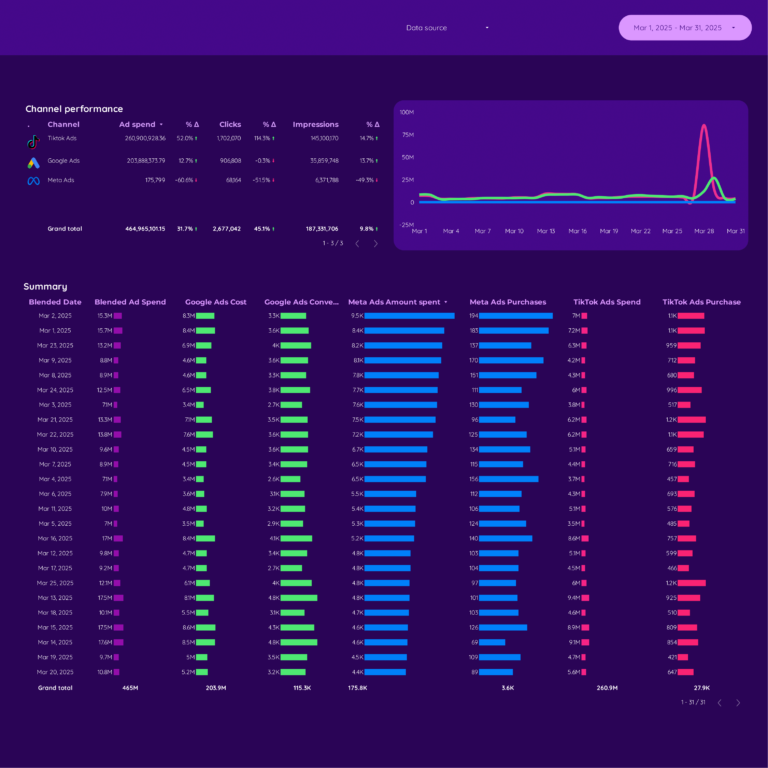
Paid Media E-commerce Dashboard Template
Paid media ROI for e-commerce: ad spend from Google and Meta vs Shopify revenue. Calculates true ROAS per campaign and per product category. A campaign with 2x ROAS on shoes but 0.5x on accessories tells you to reallocate budget, not just scale everything equally.
AOV Dashboard Template
Average order value segmented by acquisition source, product collection, and customer type. Reveals which channels bring high-value buyers (conversion quality) vs bargain shoppers. If email traffic has 2.4x the AOV of Facebook traffic, your conversion value per visitor differs dramatically by channel.
DTC Dashboard Template
DTC unit economics across the funnel: CAC (cost of visibility and engagement that leads to a first purchase), first-order AOV (initial conversion value), repeat purchase rate (retention), and LTV (total conversion value over time). Shows whether growth is profitable: LTV should be at least 3x CAC.
Dropshipping Dashboard Template
Per-product profitability after all costs: revenue (conversion value) minus ad spend (acquisition cost) minus product cost minus returns = actual margin. Most dropshipping stores have 3 profitable products hidden among 17 losers. This template surfaces which products earn money at every funnel stage.
Amazon Seller Central Dashboard Template
Amazon Seller Central: units ordered, revenue, Buy Box percentage (visibility), sessions and conversion rate (engagement and purchase intent), ACoS for sponsored products (ad efficiency). Buy Box % is the key metric — if you don’t own the Buy Box, traffic goes to competitors regardless of your product.
How to Use a Template
- Choose a template from the list above
- Click "Get this template"
- Copy to your Data Studio account
- Connect your data
- Customize with your branding
What Should a E-commerce Dashboard Include?
The most effective e-commerce dashboards are organized around three layers of the marketing funnel, with context and segmentation to make the data actionable:
1. Visibility metrics (is your audience seeing your content?)
Start with top-of-funnel metrics that tell you whether your e-commerce efforts are generating reach: sessions, users, traffic sources. These are the leading indicators that show if your campaigns are getting in front of the right audience.
2. Engagement metrics (are they interacting?)
Once your audience sees your content, are they responding? Track product views, add to cart, cart abandonment rate. The gap between visibility and engagement reveals whether your messaging, creative, or targeting needs adjustment.
3. Conversion metrics (are they taking action?)
The bottom line: orders, revenue, AOV, customer lifetime value, ROAS. A dashboard without conversion data is just a vanity report. Connect engagement to business outcomes to prove ROI and justify budget.
4. Add context to every metric
Raw numbers mean nothing without comparison. Include period-over-period trends, efficiency rates (CTR, conversion rate, CPA), and progress against goals. This turns data into decisions.
5. Segment to find insights
Aggregate data hides opportunities. Segment by campaign, audience, content type, device, and time period to find what actually drives results.
E-commerce Dashboard Best Practices
- Match the dashboard to the audience. A media buyer needs granular campaign data. A CMO needs a high-level summary. Build the right view for the reader.
- Use period-over-period comparisons, not just totals. “5,000 clicks” is meaningless. “5,000 clicks, up 18% month over month” tells a story.
- Include conversion data, not just engagement. Impressions and clicks are leading indicators. Revenue, leads, and ROAS are what the business cares about.
- Automate the data refresh. Manual exports kill consistency. Use Data Studio with native connectors so the dashboard updates every time you open it.
- Set goals with pacing indicators. The first question stakeholders ask is “are we on track?” Add progress bars or target lines for top KPIs.
- Segment by campaign and audience. Site-wide or account-wide averages hide your best and worst performers. Always include a breakdown table.
- Keep it focused. A dashboard with 50 charts is a data dump, not a dashboard. Aim for 5–8 key visualizations per view.
FAQ
What is an e-commerce dashboard?
An e-commerce dashboard tracks your online store performance: revenue, orders, average order value (AOV), product sales, customer acquisition, and marketing ROI. It connects your store platform (Shopify, WooCommerce) with ad platforms and analytics to show the full picture from ad spend to revenue.
Can I connect Shopify to Data Studio?
Yes, through Porter Metrics. Shopify is not a native Data Studio data source, but Porter connects your Shopify data and stores it in BigQuery for fast, reliable reporting. This solves the API timeout issues that other connectors have with large Shopify stores.
How do I track e-commerce ROAS across channels?
Use our E-commerce Overview template, which combines Shopify revenue data with Meta Ads and Google Ads spend data. Porter automatically blends the data so you see true ROAS per channel — how much revenue each ad platform actually drives.
What KPIs should an e-commerce dashboard include?
Revenue, orders, AOV (average order value), conversion rate, customer acquisition cost (CAC), ROAS by channel, top-selling products, and returning vs. new customer ratio. Our templates include all of these pre-configured.
Can I see product-level performance in Data Studio?
Yes. The Shopify template includes product-level sales data: revenue per product, units sold, and variant breakdowns. Combined with GA4 data, you can also see which products get the most traffic and highest conversion rates.
What metrics should I track in a e-commerce dashboard?
Organize metrics in three layers. Visibility: sessions, users, traffic sources. Engagement: product views, add to cart, cart abandonment rate. Conversion: orders, revenue, AOV, customer lifetime value, ROAS. Add context with period-over-period comparisons and segment by campaign, audience, or content type to find actionable insights.
How often should I check my e-commerce dashboard?
For operational monitoring, check daily or every few days. For performance management and client reporting, weekly or monthly. The right cadence depends on your role: media buyers need daily data, account managers need weekly summaries, executives need monthly overviews.
Can I white-label these templates for my clients?
Yes. Every Data Studio template is fully customizable. Add your logo, change colors, adjust date ranges, and remove Porter Metrics branding. Share via live link (always updated) or scheduled PDF export for professional, branded reporting.
Do I need a connector to use these templates?
It depends on the data source. Google-native sources (Google Ads, GA4, Search Console) connect directly to Data Studio for free. For non-Google sources (Facebook, Instagram, Shopify, HubSpot, LinkedIn, etc.), you need a connector like Porter Metrics to bridge the data.
What should an e-commerce dashboard track?
An e-commerce dashboard should track the full purchase funnel: sessions and traffic sources (visibility), product views and add-to-cart rate (engagement), and orders, revenue, and AOV (conversion). Add efficiency metrics like ROAS and cost per order. The best ecommerce dashboard design also includes an e-commerce report template view for periodic client or stakeholder presentations.
Start with a free template
Every template is free, white-label ready, and takes under 5 minutes to set up.
Browse all 110+ templates →Other Dashboard Templates
Explore more free Data Studio templates by category: