

The best free lead generation dashboard templates in 2026 track your leads from first click to closed deal — connecting ad platforms, CRM, and analytics to measure cost per lead, conversion rates, and pipeline value in Data Studio (formerly Looker Studio).
Built and tested by Porter Metrics, used by +10,000 marketing teams worldwide.
Quick answer — 8 Best Free Lead Generation Dashboard Templates in 2026
- HubSpot CRM — Contacts, deals, pipeline, and email
- B2B Marketing — B2B lead gen and nurturing metrics
- Demand Generation — Demand gen pipeline tracking
- Lead Generation — Lead tracking and cost-per-lead
- LinkedIn Ads — B2B lead gen campaigns on LinkedIn
- CRM — CRM overview and contact management
- Google Ads — Search campaign lead generation
- Acquisition — Traffic acquisition and lead sources
Inbound Marketing Dashboard Template 
Inbound lead pipeline: blog traffic → content downloads → email subscribers → MQLs. Tracks which content pieces generate leads (not just traffic) and whether those leads move through the funnel. A blog post with 10K views and zero leads isn’t content marketing — it’s a hobby.
ActiveCampaign Dashboard Template 
ActiveCampaign email and CRM: email open rates and click rates (engagement), automation completion rates (nurturing), contact lifecycle stages and deal pipeline (conversion). Shows whether your email sequences move contacts through the funnel or just generate opens that never become customers.
Quick Comparison
| Template | Best For | Setup |
|---|---|---|
| HubSpot CRM Most Popular | Contacts, deals, pipeline, and email | 2 min |
| B2B Marketing | B2B lead gen and nurturing metrics | 2 min |
 Demand Generation Demand Generation | Demand gen pipeline tracking | 2 min |
| Lead Generation | Lead tracking and cost-per-lead | 2 min |
 LinkedIn Ads LinkedIn Ads | B2B lead gen campaigns on LinkedIn | 2 min |
| CRM | CRM overview and contact management | 2 min |
| Search campaign lead generation | 2 min | |
| Acquisition | Traffic acquisition and lead sources | 2 min |
The 10 Best Templates
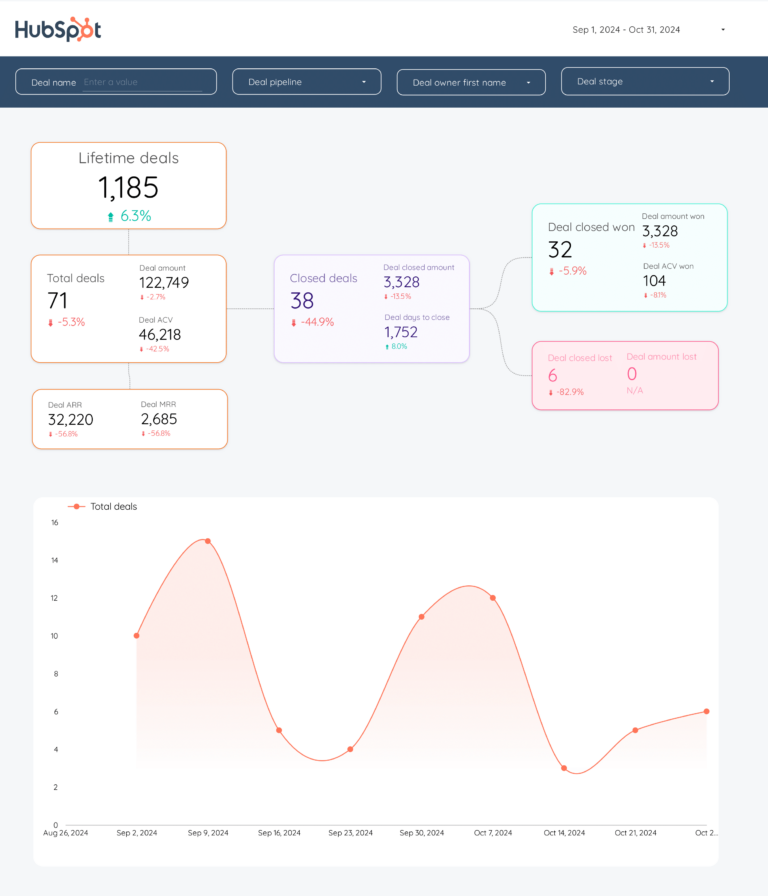
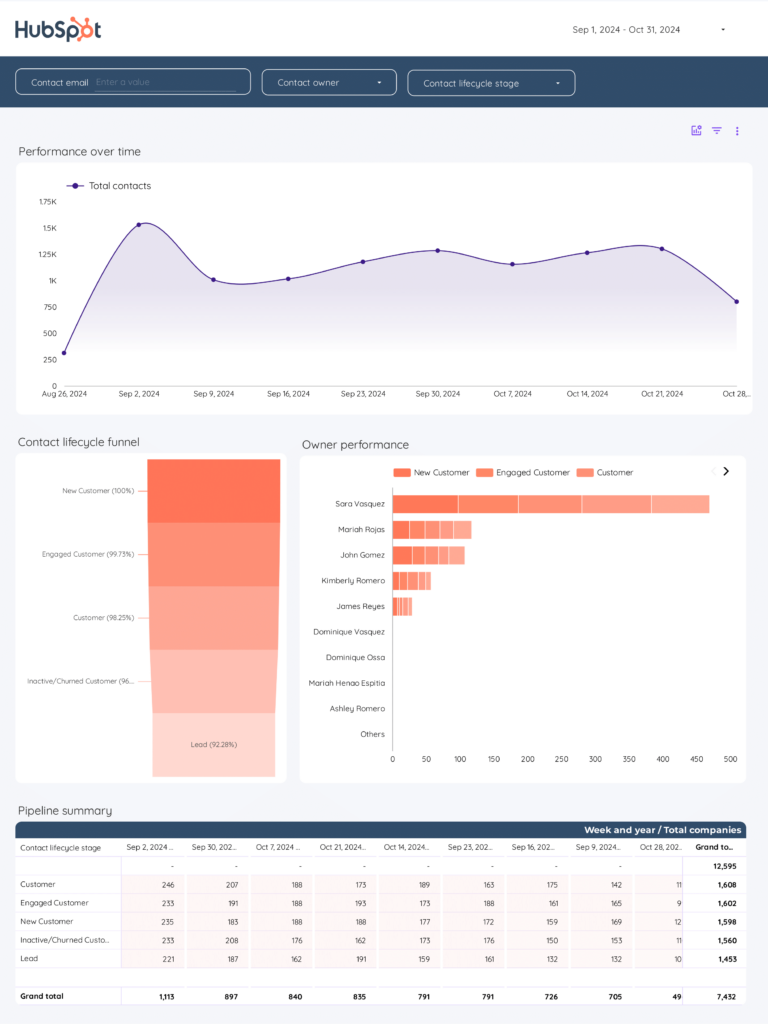
HubSpot CRM Dashboard Template
Most PopularHubSpot CRM funnel in Data Studio: contacts → lifecycle stages → deals → revenue. Shows where leads get stuck (stage duration), which sources produce leads that actually close (conversion rate by source), and whether the pipeline has enough volume to hit revenue targets.
Key metrics visualized
- Visibility: website sessions, ad impressions, form views
- Engagement: form submissions, CTA clicks, content downloads
- Conversion: MQLs, SQLs, CPL, conversion rate by source
- Set up period-over-period comparisons to track trends, not just totals
- Segment by audience or campaign to find what drives the best results
- Focus on conversion metrics first — visibility and engagement only matter if they lead to outcomes
B2B Marketing Dashboard Template
B2B lead gen metrics organized by funnel stage: MQLs (marketing qualified), SQLs (sales accepted), opportunities (in pipeline), and closed-won (revenue). The conversion rate between MQL and SQL tells you whether marketing and sales agree on what a qualified lead looks like.
Key metrics visualized
- Visibility: website sessions, ad impressions, form views
- Engagement: form submissions, CTA clicks, content downloads
- Conversion: MQLs, SQLs, CPL, conversion rate by source
- Set up period-over-period comparisons to track trends, not just totals
- Segment by audience or campaign to find what drives the best results
- Focus on conversion metrics first — visibility and engagement only matter if they lead to outcomes
Demand Generation Dashboard Template
Demand gen across the full funnel: content views and downloads (visibility and interest), demo requests and trial starts (engagement and intent), customers and revenue (conversion and outcome). Calculates marketing-sourced pipeline — the metric that connects top-funnel content to bottom-funnel revenue.
Key metrics visualized
- Visibility: website sessions, ad impressions, form views
- Engagement: form submissions, CTA clicks, content downloads
- Conversion: MQLs, SQLs, CPL, conversion rate by source
- Set up period-over-period comparisons to track trends, not just totals
- Segment by audience or campaign to find what drives the best results
- Focus on conversion metrics first — visibility and engagement only matter if they lead to outcomes
Lead Generation Dashboard Template
Lead funnel organized by efficiency: total leads at each stage (volume), CPL by source (acquisition cost), lead-to-customer rate by channel (conversion quality). A channel producing $10 leads with 1% close rate costs more per customer than $50 leads with 20% close rate. This template shows that math.
Key metrics visualized
- Visibility: website sessions, ad impressions, form views
- Engagement: form submissions, CTA clicks, content downloads
- Conversion: MQLs, SQLs, CPL, conversion rate by source
- Set up period-over-period comparisons to track trends, not just totals
- Segment by audience or campaign to find what drives the best results
- Focus on conversion metrics first — visibility and engagement only matter if they lead to outcomes
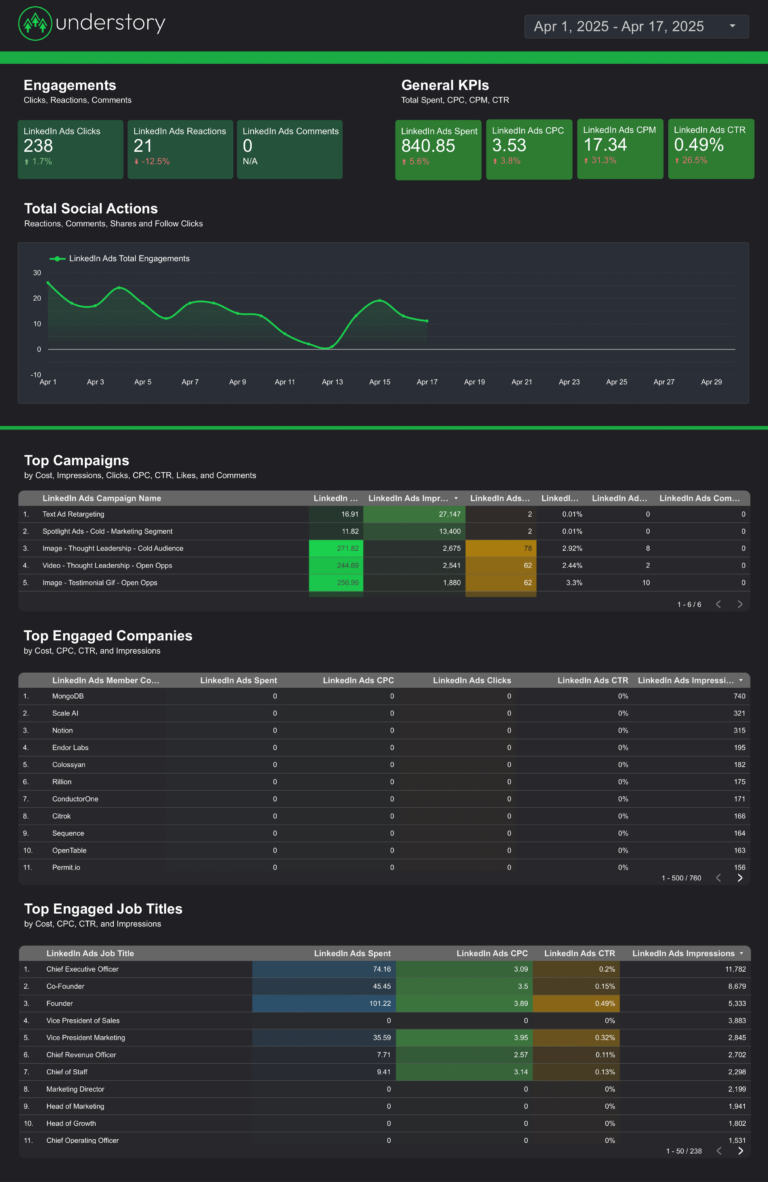
LinkedIn Ads Dashboard Template
LinkedIn Ads for lead gen: lead form submissions (volume), cost per lead (efficiency), and lead-to-opportunity rate by audience segment — job title, seniority, company size (quality). Shows whether your highest-CPL audiences are also your highest-quality leads, or if you’re overpaying for the wrong people.
CRM Dashboard Template
CRM pipeline funnel: contacts → MQLs → SQLs → opportunities → closed-won. Conversion rate between stages, deal velocity (days per stage), and pipeline value by source. When marketing says ‘we sent 500 leads’ and sales says ‘we got nothing good,’ this template shows where the disconnect happens.
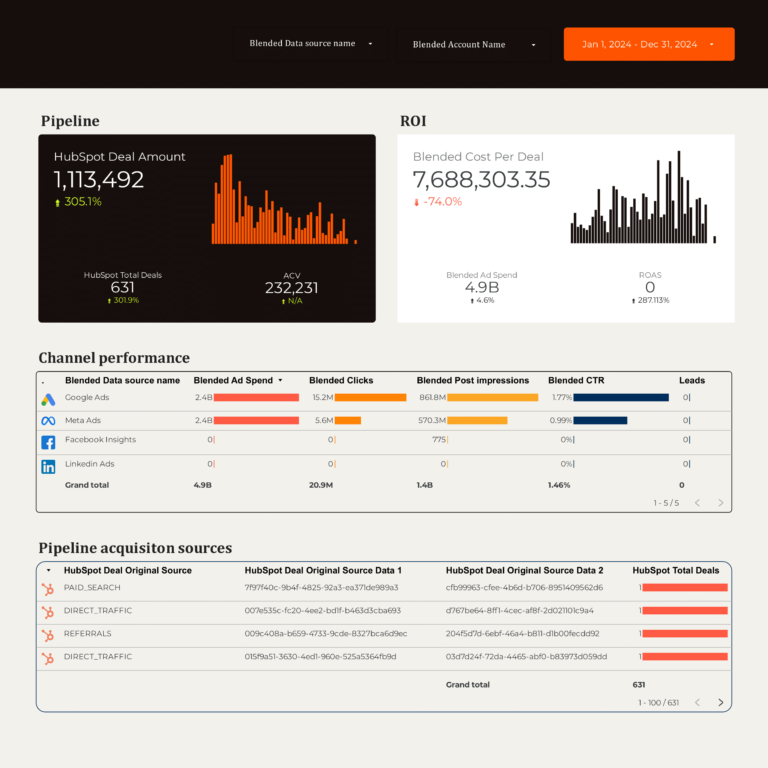
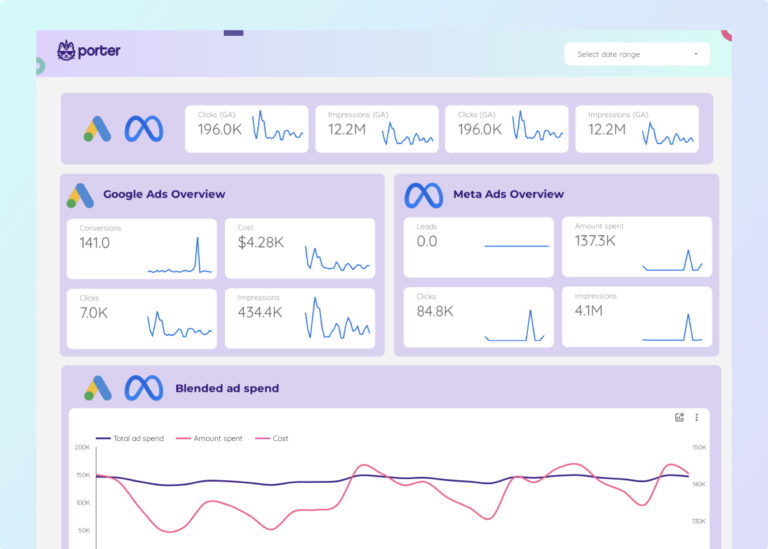
Google Ads Dashboard Template 
Google Ads lead funnel: impressions and clicks (visibility and interest), leads and CPL by campaign (conversion volume and cost), lead-to-customer rate by keyword (conversion quality). Optimizes for keywords that produce customers, not just form fills — because a cheap lead that never closes isn’t cheap.
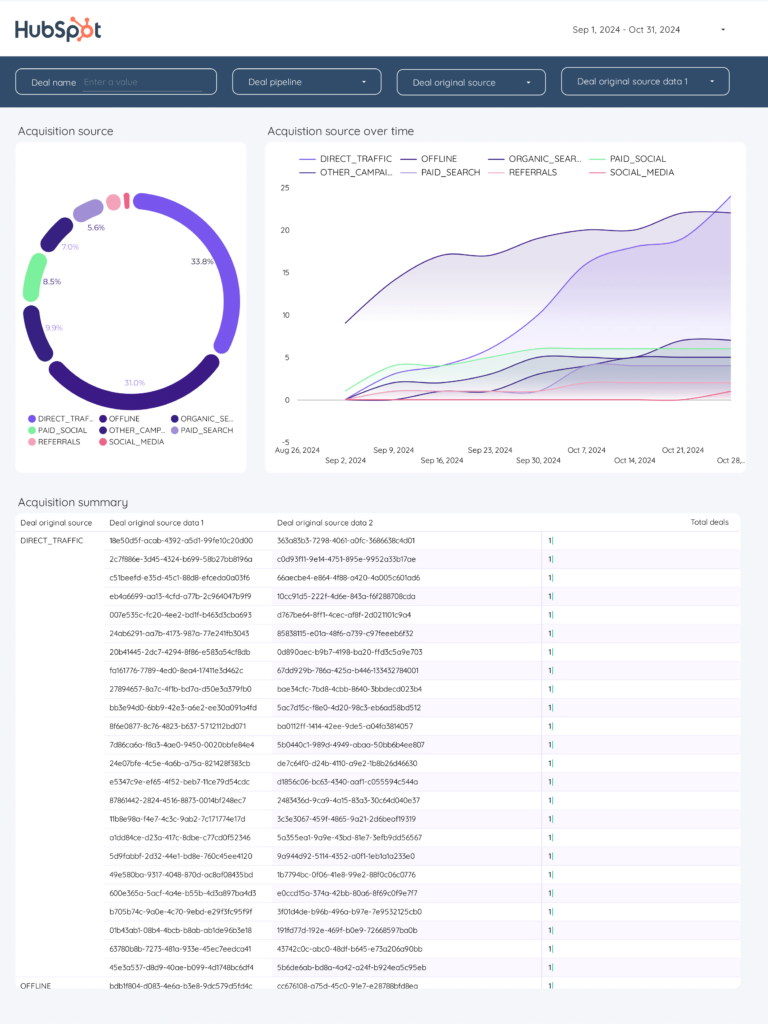
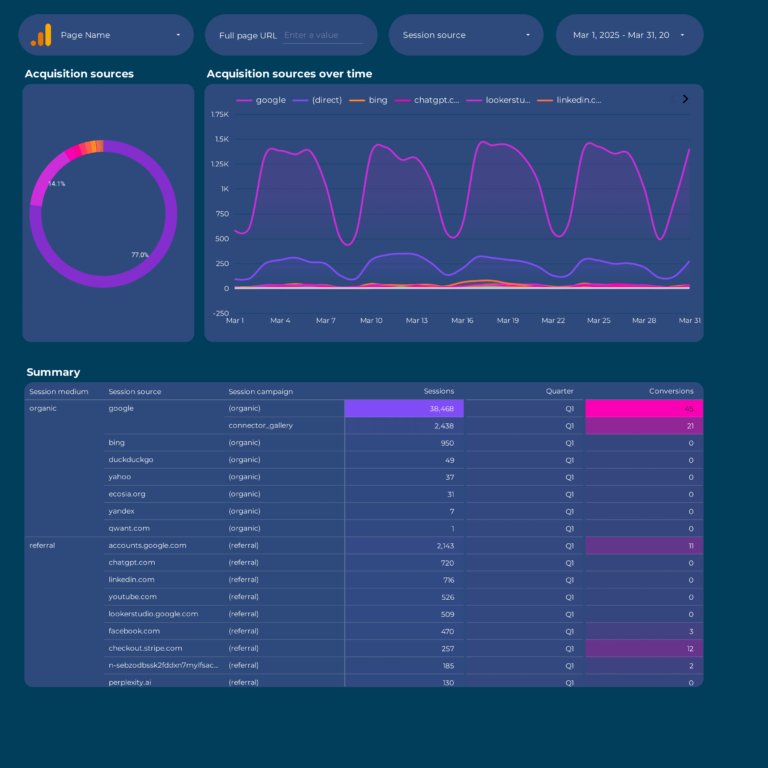
Acquisition Dashboard Template
Acquisition funnel by source: traffic → form views → submissions → qualified leads → customers. Shows the full journey from first click to closed deal per channel. Organic might bring more traffic but paid might bring visitors who actually fill forms — this template surfaces that difference.
How to Use a Template
- Choose a template from the list above
- Click "Get this template"
- Copy to your Data Studio account
- Connect your data
- Customize with your branding
What Should a Lead generation Dashboard Include?
The most effective lead generation dashboards are organized around three layers of the marketing funnel, with context and segmentation to make the data actionable:
1. Visibility metrics (is your audience seeing your content?)
Start with top-of-funnel metrics that tell you whether your lead generation efforts are generating reach: website sessions, ad impressions, form views. These are the leading indicators that show if your campaigns are getting in front of the right audience.
2. Engagement metrics (are they interacting?)
Once your audience sees your content, are they responding? Track form submissions, CTA clicks, content downloads. The gap between visibility and engagement reveals whether your messaging, creative, or targeting needs adjustment.
3. Conversion metrics (are they taking action?)
The bottom line: MQLs, SQLs, CPL, conversion rate by source. A dashboard without conversion data is just a vanity report. Connect engagement to business outcomes to prove ROI and justify budget.
4. Add context to every metric
Raw numbers mean nothing without comparison. Include period-over-period trends, efficiency rates (CTR, conversion rate, CPA), and progress against goals. This turns data into decisions.
5. Segment to find insights
Aggregate data hides opportunities. Segment by campaign, audience, content type, device, and time period to find what actually drives results.
Lead generation Dashboard Best Practices
- Match the dashboard to the audience. A media buyer needs granular campaign data. A CMO needs a high-level summary. Build the right view for the reader.
- Use period-over-period comparisons, not just totals. “5,000 clicks” is meaningless. “5,000 clicks, up 18% month over month” tells a story.
- Include conversion data, not just engagement. Impressions and clicks are leading indicators. Revenue, leads, and ROAS are what the business cares about.
- Automate the data refresh. Manual exports kill consistency. Use Data Studio with native connectors so the dashboard updates every time you open it.
- Set goals with pacing indicators. The first question stakeholders ask is “are we on track?” Add progress bars or target lines for top KPIs.
- Segment by campaign and audience. Site-wide or account-wide averages hide your best and worst performers. Always include a breakdown table.
- Keep it focused. A dashboard with 50 charts is a data dump, not a dashboard. Aim for 5–8 key visualizations per view.
FAQ
What is a lead generation dashboard?
A lead generation dashboard tracks your leads from first click to closed deal. It shows lead volume, cost per lead, lead source attribution, conversion rates by channel, and pipeline value. Our templates connect ad platforms and CRMs (HubSpot) to show the full lead journey.
How to track leads from ads to CRM?
Connect your ad platforms (Google Ads, Meta Ads, LinkedIn Ads) and your CRM (HubSpot) to Data Studio through Porter Metrics. Our B2B Marketing template shows which campaigns generate leads and how those leads move through your sales pipeline.
What is a good cost per lead?
It varies by industry. B2B SaaS typically sees $50-200 CPL, e-commerce $10-50, and professional services $20-100. Our Lead Generation template tracks CPL by channel so you can compare which platforms deliver the most cost-efficient leads for your specific business.
Can I connect HubSpot to Data Studio?
Yes, through Porter Metrics. HubSpot is not a native Data Studio data source, but Porter connects your CRM data (contacts, deals, pipeline stages, email marketing) and stores it in BigQuery for fast, reliable reporting.
How to measure lead quality, not just volume?
Track conversion rates from lead to customer, not just lead count. Our HubSpot template shows lifecycle stage progression (lead → MQL → SQL → customer) and deal close rates, so you can see which channels generate leads that actually convert to revenue.
What metrics should I track in a lead generation dashboard?
Organize metrics in three layers. Visibility: website sessions, ad impressions, form views. Engagement: form submissions, CTA clicks, content downloads. Conversion: MQLs, SQLs, CPL, conversion rate by source. Add context with period-over-period comparisons and segment by campaign, audience, or content type to find actionable insights.
How often should I check my lead generation dashboard?
For operational monitoring, check daily or every few days. For performance management and client reporting, weekly or monthly. The right cadence depends on your role: media buyers need daily data, account managers need weekly summaries, executives need monthly overviews.
Can I white-label these templates for my clients?
Yes. Every Data Studio template is fully customizable. Add your logo, change colors, adjust date ranges, and remove Porter Metrics branding. Share via live link (always updated) or scheduled PDF export for professional, branded reporting.
Do I need a connector to use these templates?
It depends on the data source. Google-native sources (Google Ads, GA4, Search Console) connect directly to Data Studio for free. For non-Google sources (Facebook, Instagram, Shopify, HubSpot, LinkedIn, etc.), you need a connector like Porter Metrics to bridge the data.
What are the most important lead generation KPIs?
The core lead generation KPIs are: total leads, cost per lead (CPL), lead-to-customer conversion rate, lead generation metrics by source (organic, paid, social, referral), and marketing qualified leads (MQLs) vs. sales qualified leads (SQLs). A good lead generation dashboard tracks these across the full funnel — from lead dashboard overview to sales and marketing dashboard alignment views.
Is there a lead generation report template for agencies?
Yes. Every template on this page works as a lead generation report template for agency or in-house use. Track lead generation metrics dashboard KPIs like CPL, conversion rate by source, and pipeline value. Export to PDF for monthly lead generation report format presentations, or share a live Data Studio link that updates automatically. Combine with your CRM data for a complete leads dashboard view.
Start with a free template
Every template is free, white-label ready, and takes under 5 minutes to set up.
Browse all 110+ templates →Other Dashboard Templates
Explore more free Data Studio templates by category: