
The best free Facebook Ads dashboard templates in 2026 give you full visibility into your Meta ad campaigns — spend, ROAS, audience demographics, creative performance, and conversion funnels — updated automatically in Data Studio (formerly Looker Studio).
We have built and tested over 100 Data Studio templates at Porter Metrics over the past 6 years, used by +10,000 marketing teams and agencies in 60 countries.
Quick answer — 12 Best Free Facebook Ads Dashboard Templates in 2026
- Facebook Ads
- Facebook Ads Campaign Performance
- Facebook Ads Creative Performance
- Facebook Ads Funnel
- Facebook Ads Attribution
- Facebook Ads Audience
- Facebook Ads Budget Tracking
- Facebook Ads KPI Tracker
- Facebook Ads + Google Ads
- Facebook Ads (by Heineken)
All templates free and white-label ready. Browse all 110+ templates →
Quick Comparison Table
| Template | Best For | Setup |
|---|---|---|
 Facebook Ads Most Popular Facebook Ads Most Popular | 2 min | |
| Facebook Ads Campaign Performance | 2 min | |
| Facebook Ads Creative Performance | 2 min | |
| Facebook Ads Funnel | 2 min | |
| Facebook Ads Attribution | 2 min | |
| Facebook Ads Audience | 2 min | |
| Facebook Ads Budget Tracking | 2 min | |
| Facebook Ads KPI Tracker | 2 min | |
| Facebook Ads + Google Ads Multi-source | 2 min | |
| Facebook Ads (by Heineken) | 2 min |
The 10 Best Templates
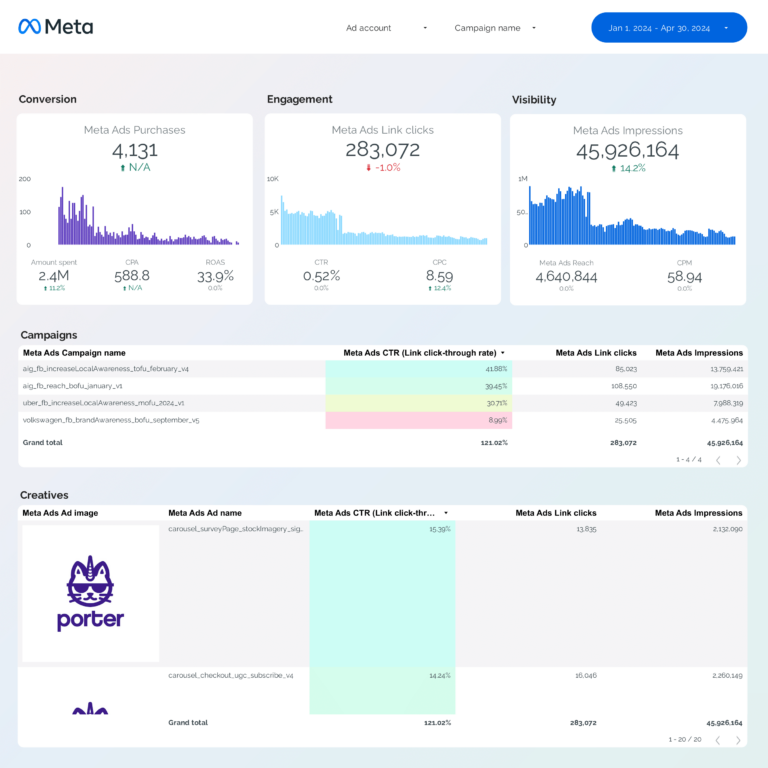
Facebook Ads Dashboard Template
Most PopularTracks Facebook Ads from reach to revenue: how many people saw your ads (impressions, reach, frequency), how many engaged (clicks, CTR, CPC), and how many converted (leads, purchases, ROAS). Compare campaigns on cost efficiency — CPA and ROAS — to shift budget toward what generates results, not just impressions.
Key metrics visualized
- Visibility: impressions, reach, frequency
- Engagement: clicks, CTR, CPC, video views
- Conversion: leads, purchases, cost per lead, ROAS
- Set up period-over-period comparisons to track trends, not just totals
- Segment by audience or campaign to find what drives the best results
- Focus on conversion metrics first — visibility and engagement only matter if they lead to outcomes
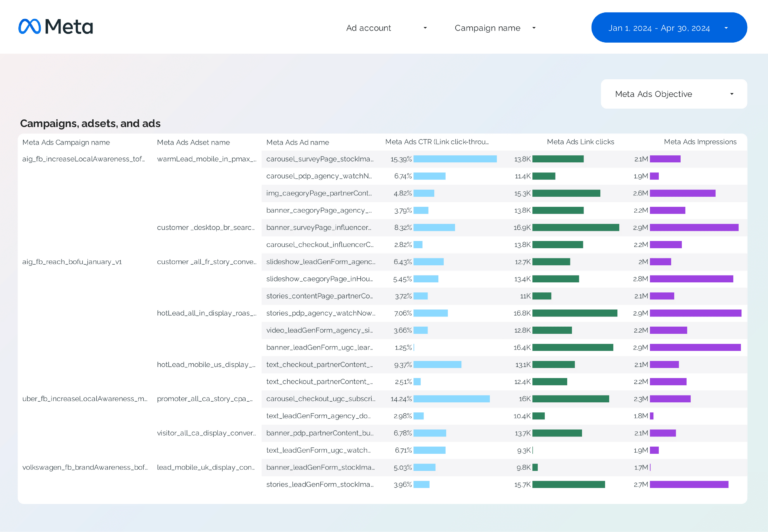
Facebook Ads Campaign Performance Dashboard Template
Campaign-level drill-down: each campaign shows spend, results, cost per result, and ROAS in a sortable table. The goal isn’t to see all campaigns — it’s to quickly find which ones to scale (high ROAS), which to fix (high spend, low ROAS), and which to pause (no conversions).
Key metrics visualized
- Visibility: impressions, reach, frequency
- Engagement: clicks, CTR, CPC, video views
- Conversion: leads, purchases, cost per lead, ROAS
- Set up period-over-period comparisons to track trends, not just totals
- Segment by audience or campaign to find what drives the best results
- Focus on conversion metrics first — visibility and engagement only matter if they lead to outcomes
Facebook Ads Creative Performance Dashboard Template
Measures ad creative effectiveness: CTR shows if people notice your ad, CPC shows what that attention costs, conversion rate shows if attention becomes action. Tracks frequency vs CTR to detect creative fatigue — when your audience has seen the same ad too many times and stops clicking.
Key metrics visualized
- Visibility: impressions, reach, frequency
- Engagement: clicks, CTR, CPC, video views
- Conversion: leads, purchases, cost per lead, ROAS
- Set up period-over-period comparisons to track trends, not just totals
- Segment by audience or campaign to find what drives the best results
- Focus on conversion metrics first — visibility and engagement only matter if they lead to outcomes
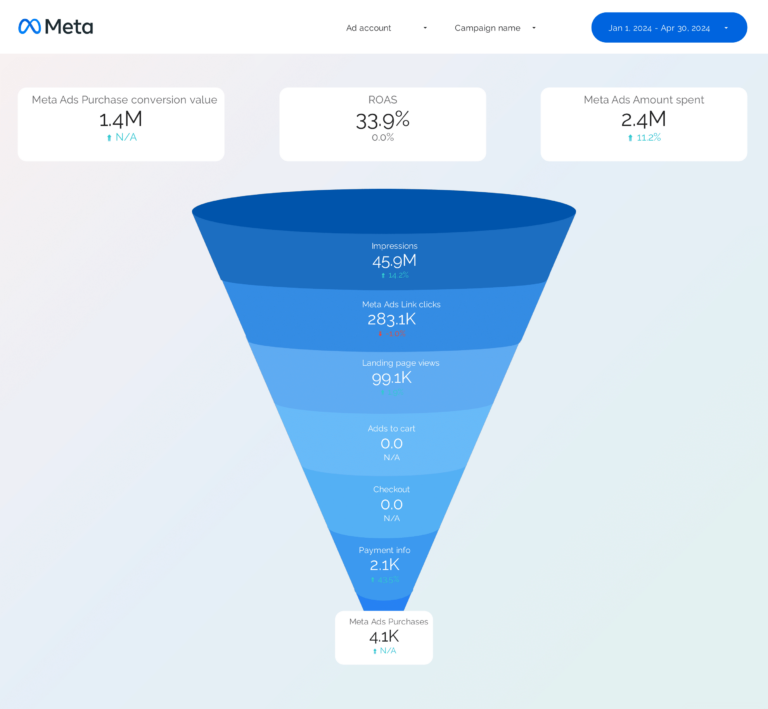
Facebook Ads Funnel Dashboard Template
Meta Ads purchase funnel: impressions → link clicks → landing page views → add to cart → purchase. Shows drop-off and conversion rate at each step. If 80% of clickers never reach the landing page, the problem is page load speed — not your ad or your offer.
Key metrics visualized
- Visibility: impressions, reach, frequency
- Engagement: clicks, CTR, CPC, video views
- Conversion: leads, purchases, cost per lead, ROAS
- Set up period-over-period comparisons to track trends, not just totals
- Segment by audience or campaign to find what drives the best results
- Focus on conversion metrics first — visibility and engagement only matter if they lead to outcomes
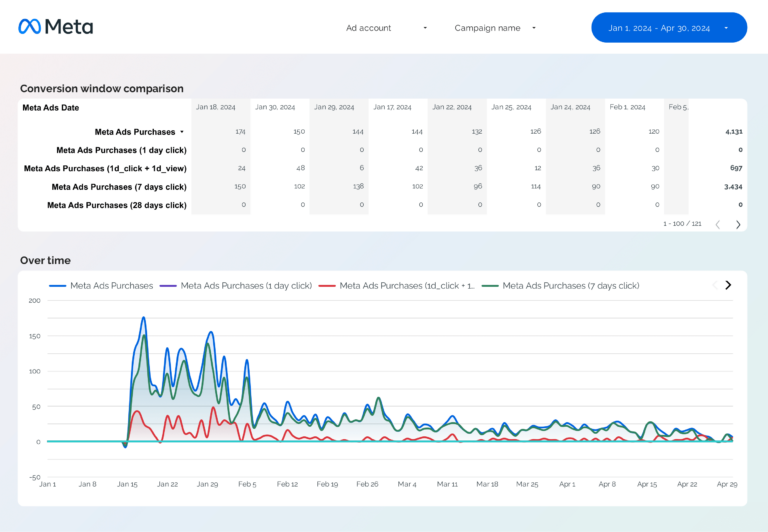
Facebook Ads Attribution Dashboard Template
Compares attribution windows side by side: 1-day click, 7-day click, and 1-day view. Shows how your reported conversions change depending on the window. After iOS 14, many conversions shifted from 7-day to 1-day click — this template shows the gap so you don’t undercount results.
Key metrics visualized
- Visibility: impressions, reach, frequency
- Engagement: clicks, CTR, CPC, video views
- Conversion: leads, purchases, cost per lead, ROAS
- Set up period-over-period comparisons to track trends, not just totals
- Segment by audience or campaign to find what drives the best results
- Focus on conversion metrics first — visibility and engagement only matter if they lead to outcomes
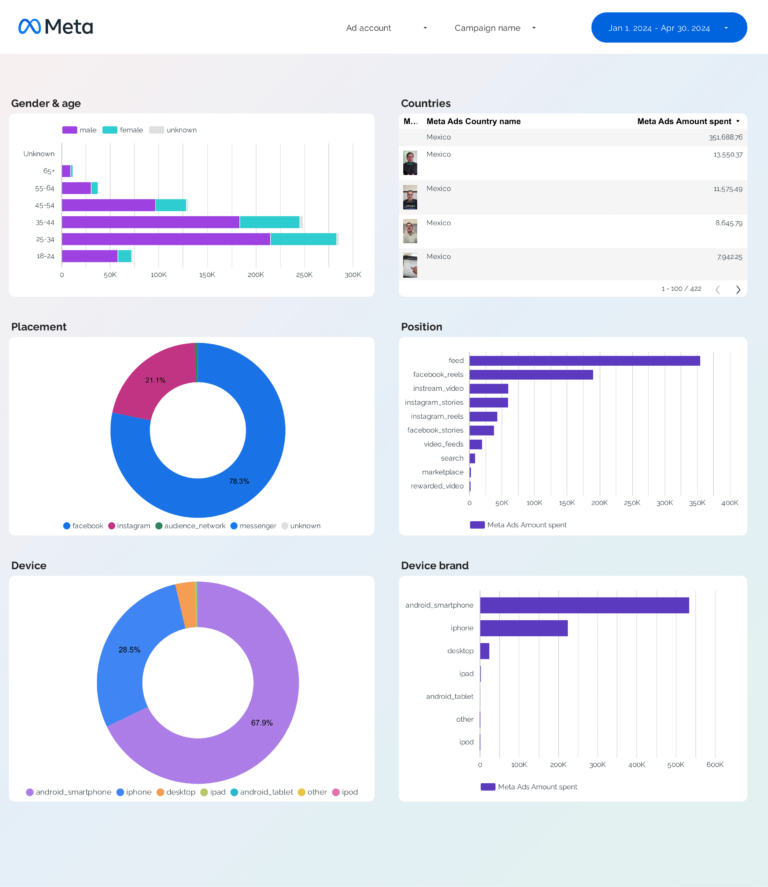
Facebook Ads Audience Dashboard Template
Audience segmentation by funnel stage: which demographics see your ads (reach by age/gender), which engage (CTR by placement), and which convert (CPA by audience segment). If 25-34 women have 3x the ROAS of 18-24 men, you know where to concentrate budget.
Facebook Ads Budget Tracking Dashboard Template
Budget pacing tied to efficiency: daily spend vs plan and projected month-end total (are you on budget?), but also CPC and CPA trends by day (is the budget being spent efficiently?). A campaign on track for budget but with rising CPA is spending correctly but converting poorly — this template catches both.
Facebook Ads KPI Tracker Dashboard Template
KPI scorecard comparing results against targets: reach vs goal, clicks vs goal, conversions vs goal, ROAS vs goal. Progress bars answer ‘are we on track?’ at a glance. Built for stakeholder presentations where the audience wants outcomes, not granular campaign data.
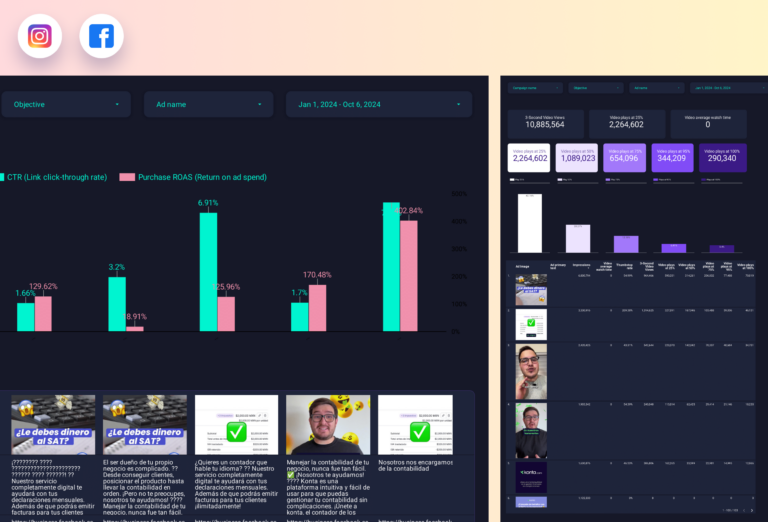
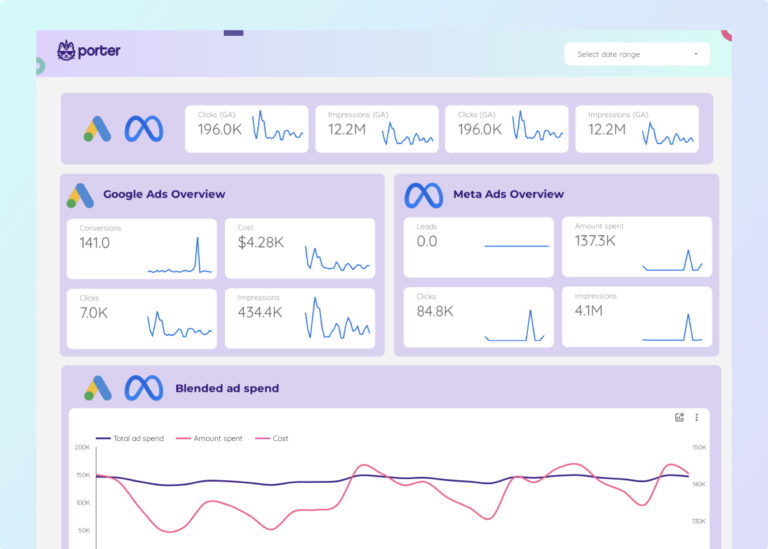
Facebook Ads + Google Ads Dashboard Template
Multi-sourceCross-platform comparison: Facebook vs Google on the same metrics — spend, clicks, CTR, CPC, conversions, CPA, ROAS. Answers the budget allocation question: which platform gives you more conversions per dollar? Some products convert better on search intent (Google), others on social discovery (Meta).
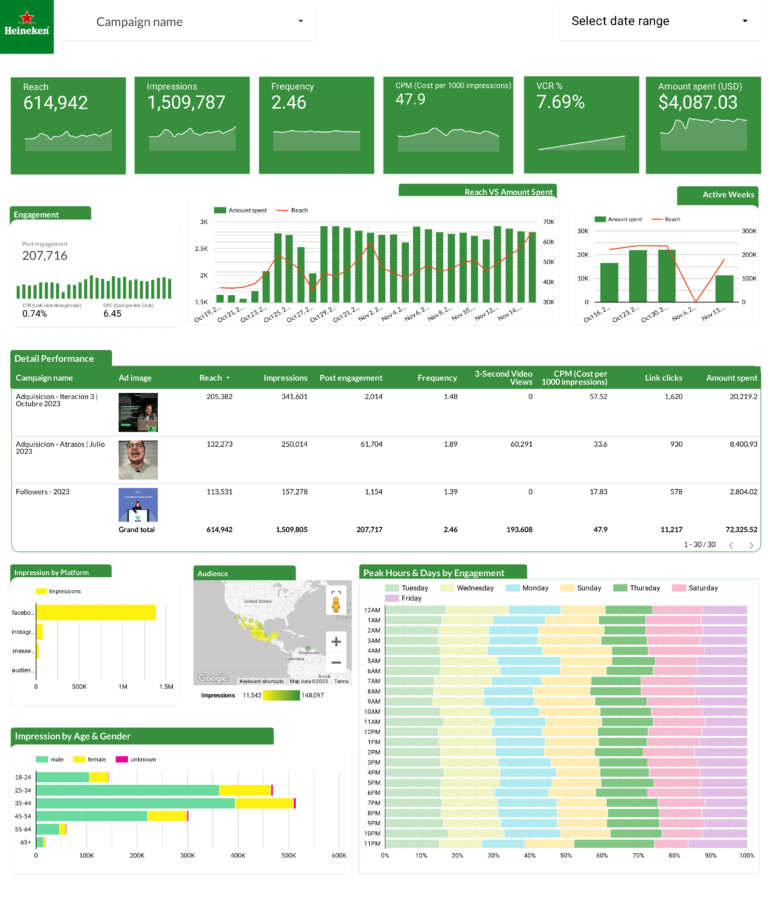
Facebook Ads (by Heineken) Dashboard Template
A real-world Facebook Ads dashboard built for Heineken’s paid social campaigns. Shows campaign-level spend, reach, frequency, and conversion breakdown with branded design. Demonstrates how enterprise teams structure their reporting around creative performance, audience reach, and cost efficiency at scale.
How to Use a Template
- Choose a template from the list above or browse all 110+ templates
- Click "Get this template" to open the template page
- Copy the template to your own Data Studio account
- Connect your data source — Google-native sources connect directly; others connect through Porter Metrics connectors
- Customize — add your logo, change colors, adjust date ranges
What Should a Facebook Ads Dashboard Include?
The most effective facebook ads dashboards are organized around three layers of the marketing funnel, with context and segmentation to make the data actionable:
1. Visibility metrics (is your audience seeing your content?)
Start with top-of-funnel metrics that tell you whether your facebook ads efforts are generating reach: impressions, reach, frequency. These are the leading indicators that show if your campaigns are getting in front of the right audience.
2. Engagement metrics (are they interacting?)
Once your audience sees your content, are they responding? Track clicks, CTR, CPC, video views. The gap between visibility and engagement reveals whether your messaging, creative, or targeting needs adjustment.
3. Conversion metrics (are they taking action?)
The bottom line: leads, purchases, cost per lead, ROAS. A dashboard without conversion data is just a vanity report. Connect engagement to business outcomes to prove ROI and justify budget.
4. Add context to every metric
Raw numbers mean nothing without comparison. Include period-over-period trends, efficiency rates (CTR, conversion rate, CPA), and progress against goals. This turns data into decisions.
5. Segment to find insights
Aggregate data hides opportunities. Segment by campaign, audience, content type, device, and time period to find what actually drives results.
Facebook Ads Dashboard Best Practices
- Match the dashboard to the audience. A media buyer needs granular campaign data. A CMO needs a high-level summary. Build the right view for the reader.
- Use period-over-period comparisons, not just totals. “5,000 clicks” is meaningless. “5,000 clicks, up 18% month over month” tells a story.
- Include conversion data, not just engagement. Impressions and clicks are leading indicators. Revenue, leads, and ROAS are what the business cares about.
- Automate the data refresh. Manual exports kill consistency. Use Data Studio with native connectors so the dashboard updates every time you open it.
- Set goals with pacing indicators. The first question stakeholders ask is “are we on track?” Add progress bars or target lines for top KPIs.
- Segment by campaign and audience. Site-wide or account-wide averages hide your best and worst performers. Always include a breakdown table.
- Keep it focused. A dashboard with 50 charts is a data dump, not a dashboard. Aim for 5–8 key visualizations per view.
Frequently Asked Questions
How to create a dashboard for Meta ads?
Connect your Meta Ads account to Data Studio through a connector like Porter Metrics (Facebook Ads is not a native Data Studio data source). Then copy a Meta Ads template and your campaign data populates automatically — spend, ROAS, CPC, CTR, audience demographics, and creative performance.
How to check Facebook ad performance?
You can check performance in Meta Ads Manager, but a Data Studio dashboard gives you a better view: historical trends, cross-campaign comparisons, creative analysis, and automated reports. Our Facebook Ads templates pull all this data automatically and refresh daily.
How to measure Facebook ad success?
Track these KPIs: ROAS (return on ad spend), CPA (cost per acquisition), CTR (click-through rate), conversion rate, and frequency. A good Facebook Ads dashboard shows all of these by campaign, ad set, and ad level — with time-series trends so you can spot changes quickly.
Can I track Facebook and Instagram ads in one dashboard?
Yes. Meta Ads data includes both Facebook and Instagram ad performance since they run through the same Ads Manager. All our Meta Ads templates show combined data by default, with breakdowns by placement (Facebook Feed, Instagram Stories, Reels, etc.).
Do I need a connector for Facebook Ads on Data Studio?
Yes. Facebook/Meta Ads is not a native Data Studio data source. You need a third-party connector like Porter Metrics to pull the data. Porter offers a free plan with 3 data source accounts and sets up in under 2 minutes.
What metrics should I track in a facebook ads dashboard?
Organize metrics in three layers. Visibility: impressions, reach, frequency. Engagement: clicks, CTR, CPC, video views. Conversion: leads, purchases, cost per lead, ROAS. Add context with period-over-period comparisons and segment by campaign, audience, or content type to find actionable insights.
How often should I check my facebook ads dashboard?
For operational monitoring, check daily or every few days. For performance management and client reporting, weekly or monthly. The right cadence depends on your role: media buyers need daily data, account managers need weekly summaries, executives need monthly overviews.
Can I white-label these templates for my clients?
Yes. Every Data Studio template is fully customizable. Add your logo, change colors, adjust date ranges, and remove Porter Metrics branding. Share via live link (always updated) or scheduled PDF export for professional, branded reporting.
Do I need a connector to use these templates?
It depends on the data source. Google-native sources (Google Ads, GA4, Search Console) connect directly to Data Studio for free. For non-Google sources (Facebook, Instagram, Shopify, HubSpot, LinkedIn, etc.), you need a connector like Porter Metrics to bridge the data.
Is there a Facebook Ads report template I can download?
Yes. Every template on this page works as a Facebook Ads report template in Data Studio — no download needed. Unlike a static Facebook Ads report template Excel file, these dashboards update automatically with live data. You can also export them as PDF for Facebook ad reports for clients on a scheduled basis.
Can I combine Facebook Ads and Google Ads in one dashboard?
Yes. The cross-channel template on this page is a combined Facebook Ads dashboard and Google Ads dashboard that shows spend, clicks, conversions, and ROAS from both platforms side by side. This is the fastest way to compare ads dashboard Facebook performance against Google and reallocate budget based on actual results.
How do I create a Facebook Ads monthly report?
Use any of these templates as a Facebook Ads monthly report. Set the date range to the last month, review the KPI summary (spend, reach, clicks, conversions, ROAS), and export to PDF or share the live link. For agencies, schedule automated email delivery so reporting on Facebook Ads happens without manual work.
Start with a free template
Every template in this list is free, white-label ready, and takes under 5 minutes to set up. Choose the template that matches your use case, connect your data, and start reporting today.
Browse all 110+ templates →Other Dashboard Templates
Explore more free Data Studio templates by category: