

An SEO dashboard pulls your Google Search Console and Google Analytics data into a single Data Studio (formerly Looker Studio) report — so you can track keyword rankings, organic traffic, click-through rates, and conversions without switching between tools. The best free SEO dashboard templates do this automatically, updating every time you open them.
We have built and tested over 100 Data Studio templates at Porter Metrics over the past 6 years, used by +10,000 marketing teams and agencies in 60 countries. Below, we break down each SEO report template by use case — what it tracks, who it is for, and which SEO metrics it visualizes — so you can pick the right analytics dashboard for your workflow.
Quick answer — 12 Best Free SEO Dashboard Templates in 2026
- SEO
- SEO Keyword Ranking Tracker
- SEO Keyword Research
- SEO SERP Tracking
- Local SEO
- Google Analytics 4
- Google Business Profile
- Content Performance
- Website Performance
- AI Ranking Tracker NEW
All templates free and white-label ready. Browse all 110+ templates →
Quick Comparison Table
| Template | Best For | Data Source | Setup |
|---|---|---|---|
| Full organic search reporting — impressions, clicks, CTR, position | Google Search Console | 2 min | |
| Monitoring position changes and ranking trends over time | Google Search Console | 2 min | |
| Finding untapped queries with high impressions but low clicks | Google Search Console | 2 min | |
| Tracking SERP features and position distribution by search type | Google Search Console | 2 min | |
 Local SEO Local SEO | Google Maps visibility, calls, directions, and foot traffic | Google Business Profile | 2 min |
 Google Analytics 4 Google Analytics 4 | Website traffic, user behavior, and organic conversions | Google Analytics 4 | 2 min |
| Google Business Profile | Review monitoring, search vs. map impressions, customer actions | Google Business Profile | 2 min |
| Content Performance | Measuring which pages drive the most organic traffic and engagement | Google Analytics 4 | 2 min |
| Website Performance | Page speed, bounce rate, and technical SEO health metrics | Google Analytics 4 | 2 min |
| AI Ranking Tracker New | Tracking traffic from ChatGPT, Perplexity, Gemini, and other AI search | Google Analytics 4 | 2 min |
The 10 Best Templates
SEO Dashboard Template 
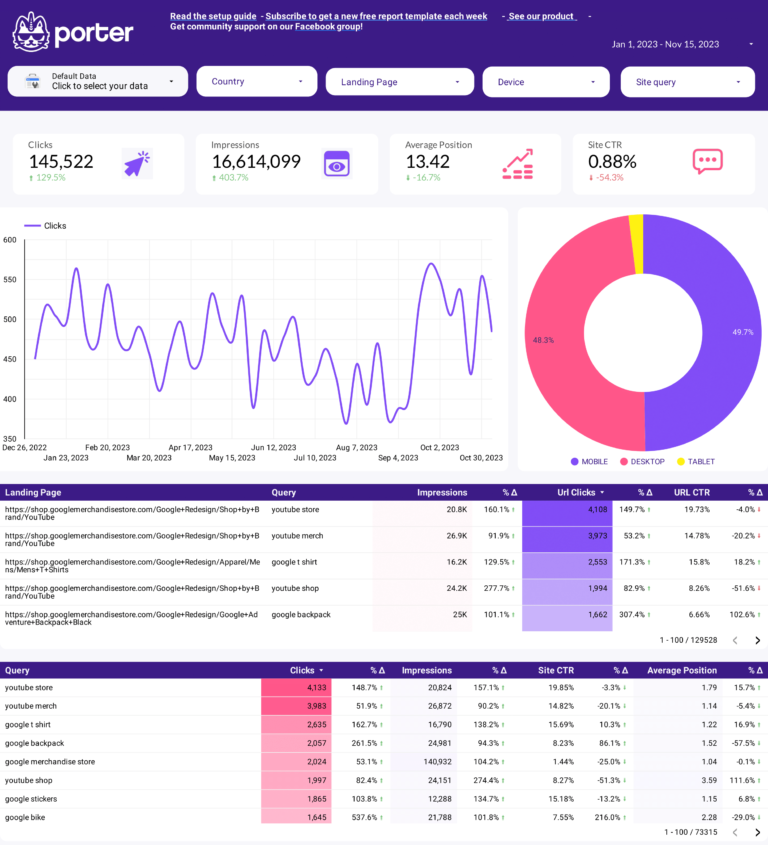
Most PopularYour complete Google SEO dashboard for organic search performance. This free SEO dashboard template connects directly to Google Search Console and visualizes the three layers of the SEO funnel: visibility (impressions and average position by query), engagement (clicks, CTR, and click distribution by page), and conversion signals (which keywords and pages actually drive traffic to your site). Compare branded vs. non-branded queries, track keyword ranking changes period over period, and identify pages losing position before they lose traffic. Best for weekly SEO reporting, client updates, or any team that needs a single dashboard to answer “is organic search growing?”
Key metrics visualized
- Visibility: Total impressions, average position, keywords indexed, position distribution (top 3, top 10, top 20)
- Engagement: Total clicks, CTR by query and page, click trends over time
- Context: Period-over-period comparison, branded vs. non-branded split, device breakdown
- Separate branded vs. non-branded queries to show real SEO growth, not just brand awareness traffic
- Set up a 28-day comparison (this month vs. last month) as your default date range for consistent reporting
- Focus on the top 20 keywords by impressions first — these have the highest potential traffic impact
SEO Keyword Ranking Tracker Dashboard Template
PopularMonitor your entire keyword portfolio and catch ranking changes before they impact traffic. This template tracks the organic traffic KPIs that matter for rank monitoring: average position by keyword, position distribution (how many keywords sit in top 3, top 10, top 20), new keywords gained, and keywords lost — all pulled directly from Google Search Console. Set up weekly or monthly comparisons to see which queries are climbing and which are dropping. Use it to prove ranking progress to clients with concrete position data, segment by branded vs. non-branded to isolate real SEO gains, and spot pages slipping to page 2 before they lose traffic.
Key metrics visualized
- Visibility: Position distribution, keywords gained/lost, average position trend
- Engagement: Clicks and CTR per keyword, click share by position bucket
- Segments: Branded vs. non-branded, by page, by device, by country
- Track position buckets (top 3, top 10, top 20) instead of obsessing over individual keyword ranks — bucket movement is a stronger signal
- Review weekly to catch drops before they impact traffic — a keyword falling from position 8 to 12 often loses 60%+ of its clicks
- Export your top keyword data monthly to build a historical baseline, since Search Console data only goes back 16 months
SEO Keyword Research Dashboard Template
Surfaces keyword gaps by analyzing Search Console query data: which keywords drive impressions but low clicks (CTR opportunity), which have high clicks but declining position (defend), and which competitors rank for that you don’t (content gaps). Turns raw query data into a prioritized action list.
Key metrics visualized
- Visibility: Impressions by query, position range distribution
- Engagement: CTR by position bucket, click potential for underperforming queries
- Context: Impressions vs. clicks scatter, period comparison for trending queries
- Sort by impressions descending and look for queries with CTR below 2% — these are your biggest quick-win opportunities
- Filter to positions 11–20 (page 2) to find keywords one optimization away from page 1 visibility
- Group related queries by topic cluster to prioritize which content pieces to update first
SEO SERP Tracking Dashboard Template
Track how your pages perform across different Google search features and result types. This SEO performance dashboard breaks down your visibility by search type (web, image, video), shows position trends over custom date ranges, and highlights which queries drive the most SERP real estate. Compare your current ranking distribution against previous periods to see whether your SEO efforts are moving the needle on high-value queries. Particularly useful for agencies managing multiple clients who need a clear, at-a-glance view of SERP movement across accounts.
Key metrics visualized
- Visibility: Position by search type (web, image, video), SERP feature presence
- Engagement: CTR by search type, click trends by result format
- Context: Position volatility over time, period-over-period ranking shifts
- Compare web vs. image vs. video impressions separately — a drop in web impressions with rising image impressions often means Google is shifting SERP layout
- Monitor position volatility: if your average position fluctuates more than 3 spots week over week, investigate algorithm updates or competitor changes
- Use this alongside the Keyword Research template for a complete picture: SERP Tracking shows where you stand, Keyword Research shows where to go next
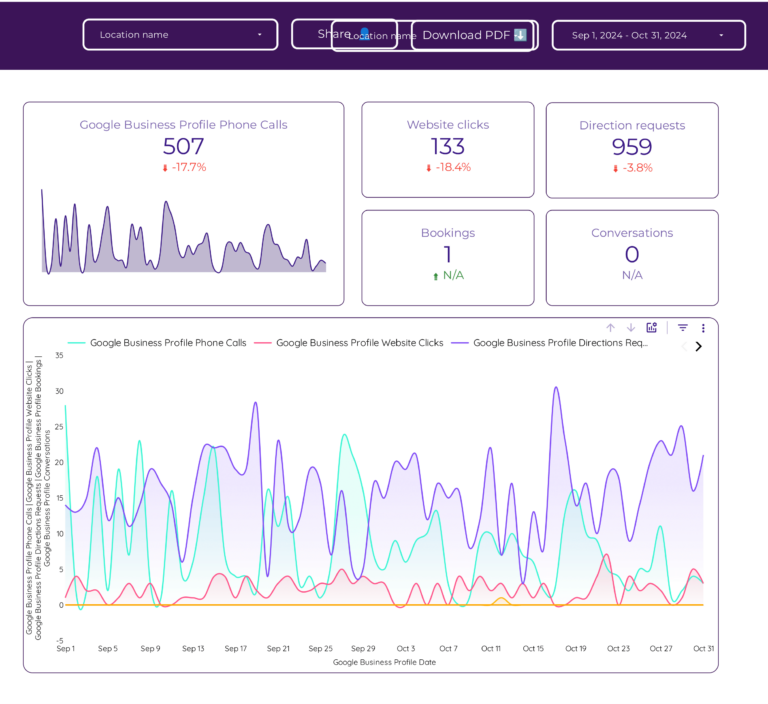
Local SEO Dashboard Template
Measure your local search visibility across Google Search and Google Maps — the metrics that actually drive foot traffic. This template connects Google Business Profile to track the full local SEO funnel: visibility (search impressions and map impressions), engagement (phone calls, direction requests, website clicks), and conversion signals (which actions customers take after finding your listing). Monitor review volume and average rating over time, compare search vs. maps impression trends, and segment by desktop vs. mobile. Best for local businesses, franchise operators, and agencies managing brick-and-mortar clients where “near me” searches directly translate to store visits and revenue.
Key metrics visualized
- Visibility: Search impressions, map impressions, photo views
- Engagement: Phone calls, direction requests, website clicks, messages
- Conversion: Total customer actions, action breakdown by type, review rating trend
- Track search impressions and map impressions separately — a drop in one but not the other points to different issues (website problem vs. listing problem)
- Monitor the ratio of impressions to customer actions monthly — if actions drop while impressions stay flat, your listing may need updated photos, hours, or description
- Compare mobile vs. desktop performance, since local searches skew 70%+ mobile — a gap there usually signals a profile optimization issue
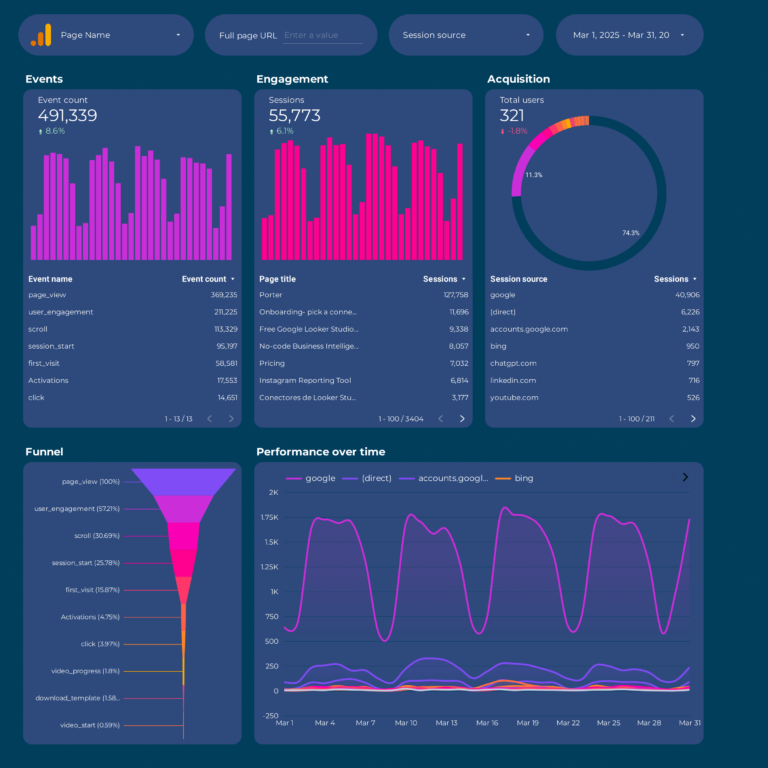
Google Analytics 4 Dashboard Template
Understand what your organic visitors actually do once they land on your site. This Google Analytics website traffic dashboard tracks the on-site layer of SEO: sessions, users, and new users (visibility), engagement rate, pages per session, and event counts (engagement), and conversions, revenue, and transactions (conversion) — all segmented by traffic channel so you can isolate organic search from paid, direct, and referral. The best SEO strategies combine this with Google Search Console data: GSC tells you what ranks, GA4 tells you what converts. Use this template to identify which landing pages have high traffic but low engagement, spot device-level performance gaps, and connect SEO and Google Analytics data in a single view for complete organic performance reporting.
Key metrics visualized
- Visibility: Sessions, total users, new users, sessions by channel
- Engagement: Engagement rate, events per session, average session duration, pages per session
- Conversion: Conversions, conversion rate, revenue, transactions by landing page
- Filter to organic traffic channel only before sharing with clients — mixing in paid and direct traffic muddies the SEO story
- Track engagement rate alongside sessions: a drop in sessions with stable engagement means you are losing top-of-funnel traffic but your core audience is still engaged
- Use the landing page table to identify pages with high sessions but low conversion rate — these are the pages where CTA or content improvements will have the biggest revenue impact
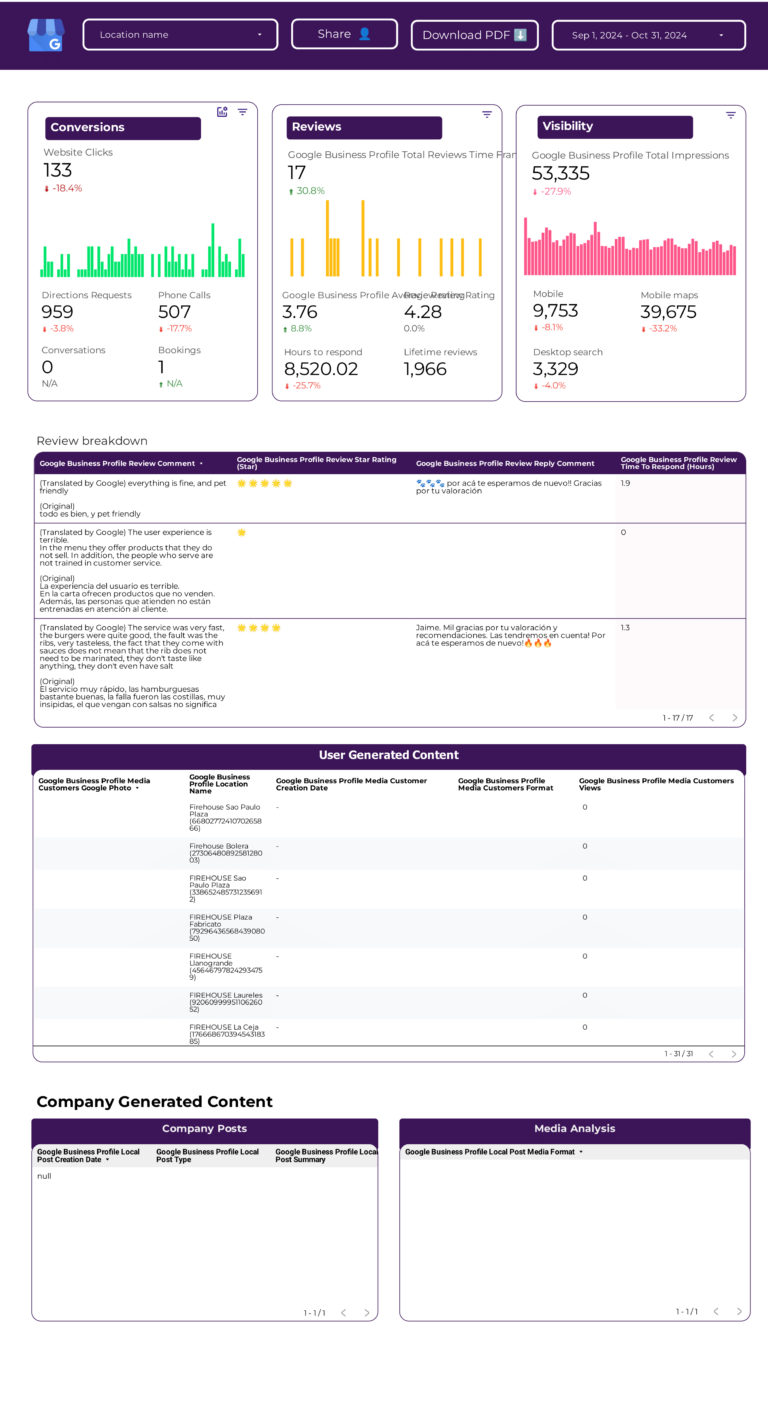
Google Business Profile Dashboard Template
Get a complete view of your Google Business Profile performance in Data Studio. While the Local SEO template above focuses on the search-to-action funnel, this dashboard goes deeper into GBP-specific metrics: search and map impressions split, photo views and photo quantity vs. competitors, review volume and rating trends, and customer action breakdown (calls, directions, website visits, bookings). Compare desktop vs. mobile performance, monitor how your listing appears across Google Search and Maps, and track whether profile optimizations (new photos, updated descriptions, post activity) correlate with more customer actions. Essential for multi-location businesses managing multiple GBP listings.
Key metrics visualized
- Visibility: Search impressions, map impressions, photo views, listing views by source
- Engagement: Calls, messages, direction requests, website clicks, bookings
- Context: Review count, average rating, rating trend, desktop vs. mobile split
- Monitor review rating alongside customer actions monthly — rating drops and action drops tend to move together, and spotting that early gives you something to act on
- For multi-location businesses, compare listings side by side to identify which locations underperform and need profile updates
- Track photo views as a leading indicator — listings with more photos typically get more customer actions
Content Performance Dashboard Template
Measure which content pieces drive the most organic traffic, engagement, and conversions — so you can double down on what works and fix what does not. This template turns Google Analytics 4 data into a content ROI view: sessions and users per page (which content attracts the audience), engagement rate and average time on page (which content holds attention), and conversions and revenue by URL (which content drives business results). Track content decay by comparing current performance against previous periods, identify pages with high traffic but low engagement that need improvement, and prioritize your editorial calendar based on actual SEO traffic metrics. This is the dashboard that connects your content strategy to measurable outcomes.
Key metrics visualized
- Visibility: Sessions, page views, and users per URL
- Engagement: Engagement rate, average time on page, scroll depth, bounce rate
- Conversion: Conversions, revenue, and conversion rate by content piece
- Sort pages by sessions and look for those with engagement rate below 40% — high traffic + low engagement means the content isn’t matching search intent
- Compare current month vs. 3 months ago to spot content decay early, before traffic drops become hard to reverse
- Use the conversions-by-URL table to identify your money pages and prioritize them for content updates and internal linking
Website Performance Dashboard Template
Monitor your website health and user experience from an SEO perspective. This template tracks the technical signals that directly affect your Google rankings: session duration and pages per session (engagement quality), bounce rate by landing page (content relevance), and device and geography segmentation (where performance gaps hurt organic traffic). Use it to identify landing pages where mobile users drop off faster than desktop, spot geographic regions with unusually high bounce rates, and track whether site improvements correlate with better SEO performance over time. Best for technical SEO teams, webmasters, and anyone who needs to connect website speed and UX metrics to organic search outcomes.
Key metrics visualized
- Visibility: Sessions, users, page views by device and geography
- Engagement: Bounce rate, session duration, pages per session, engagement rate
- Segments: By device (mobile vs. desktop), by country, by landing page
- Compare mobile vs. desktop bounce rates — a mobile bounce rate significantly higher than desktop usually signals a page speed or layout issue worth fixing
- Cross-reference pages with high bounce rate against their Google Search Console position — poor UX on a ranking page is a double loss (traffic + rankings)
- Track session duration trends monthly and correlate with any site changes (redesigns, new content, speed optimizations) to measure their actual impact
AI Ranking Tracker Dashboard Template
NewTrack how your website performs in AI-powered search engines like ChatGPT, Perplexity, Gemini, and Claude — alongside traditional Google organic traffic. This template isolates AI-referred sessions by filtering GA4 traffic from sources like chatgpt.com, perplexity.ai, and gemini.google.com, so you can see exactly how much traffic AI search is sending you. Compare GEO (Generative Engine Optimization) sessions vs. traditional SEO sessions side by side, track which landing pages get cited by LLMs, and monitor whether AI traffic is growing month over month. As AI search becomes a larger share of discovery, this is the template that keeps you ahead of the curve.
Key metrics visualized
- Visibility: Sessions from AI sources (ChatGPT, Perplexity, Gemini, Claude, Copilot), GEO vs. SEO session split
- Engagement: Events per session from AI sources, engagement rate by AI referrer, pages per session
- Conversion: Conversions and revenue from AI-referred traffic, landing page performance by AI source
- Set up a GA4 source filter using regex to capture all AI referrers (chatgpt.com|perplexity.ai|gemini.google.com|claude.ai|copilot.microsoft.com)
- Compare GEO landing pages vs. SEO landing pages — the pages cited by LLMs are often different from those ranking on Google, and that gap is a content opportunity
- Track AI traffic monthly even if volumes are small today — establishing a baseline now lets you measure growth as AI search adoption accelerates
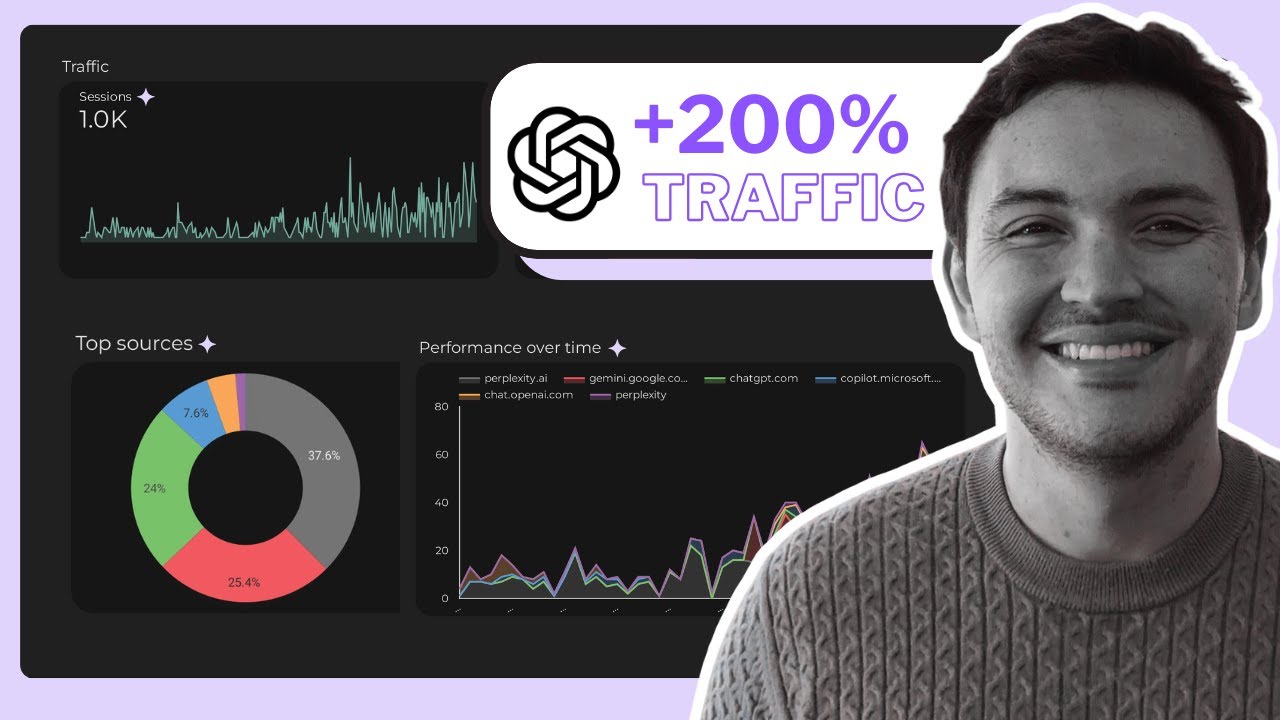
Tracking AI and GEO Traffic in SEO Dashboards
A growing share of website traffic now comes from AI-powered search sources like ChatGPT, Perplexity, Gemini, and Claude. If your SEO dashboard only tracks Google organic traffic, you are missing part of the picture.
In Google Analytics 4, you can identify AI-referred traffic by filtering sessions by source. Look for referrals from chatgpt.com, perplexity.ai, gemini.google.com, claude.ai, and copilot.microsoft.com. While volumes are still small for most sites, tracking this early gives you a baseline and shows clients you are ahead of the curve.
How to add AI traffic to your Data Studio SEO dashboard
- Create a GA4 filter using session source/medium. Include referrals from chatgpt.com, perplexity.ai, and other AI sources.
- Add a comparison widget showing AI sessions vs. organic search sessions side by side to track the ratio over time.
- Monitor landing pages that receive AI traffic — the pages cited by LLMs are often different from the ones ranking on Google, and that gap is a content opportunity.
How to Use a Template
- Choose a template from the list above or browse all 110+ templates
- Click "Get this template" to open the template page
- Copy the template to your own Data Studio account
- Connect your data source — Google-native sources connect directly; others connect through Porter Metrics connectors
- Customize — add your logo, change colors, adjust date ranges
What Should an SEO Dashboard Include?
Most SEO dashboards either show too much (every metric from every tool, no hierarchy) or too little (a few vanity numbers disconnected from business outcomes). The best analytics dashboards are organized around a clear framework. Here is what to include, structured using the marketing measurement funnel:
1. Visibility metrics (are people seeing your content?)
These are the top-of-funnel SEO traffic metrics that tell you whether your pages are appearing in search results. Track impressions (how often your pages show up), average position (where they rank), and keywords indexed (how many queries your site appears for). Without visibility data, you cannot tell the difference between a traffic drop caused by ranking loss and one caused by CTR degradation. Pull this from Google Search Console.
2. Engagement metrics (are people interacting?)
Once someone sees your listing, do they click? Track clicks, click-through rate (CTR), and click distribution by page from Search Console. On the site side, use Google Analytics to track engagement rate, average session duration, and pages per session. The gap between visibility and engagement — high impressions but low CTR — is where the biggest SEO optimization opportunities live.
3. Conversion metrics (are they doing something valuable?)
An SEO dashboard without conversion data is just a traffic report. Track organic conversions, conversion rate by landing page, and revenue attributed to organic search in GA4. This is what turns SEO from a visibility exercise into a revenue conversation and lets you calculate real ROI on your organic traffic efforts.
4. Context (are we improving or declining?)
Raw numbers mean nothing without comparison. Every metric should include:
- Time comparison: Period-over-period (week over week, month over month) to spot trends
- Effectiveness rates: CTR, conversion rate, engagement rate — not just totals
- Efficiency: If you are running paid campaigns alongside SEO, compare organic CPA vs. paid CPA
- Goals: Track progress against monthly or quarterly SEO targets with pacing indicators
5. Segments (where do you focus?)
Aggregate data hides the insights. The best SEO dashboard examples segment data by:
- Branded vs. non-branded queries: The only way to prove organic growth is real and not just brand awareness
- By page or content group: Identify which pages drive results and which need work
- By device: Mobile vs. desktop performance often diverges significantly
- By geography: Especially important for local SEO and international sites
SEO Dashboard Best Practices
Based on building dashboards for 10,000+ marketing teams, here are the practices that separate useful SEO dashboards from ones that collect dust:
- Separate branded from non-branded traffic. Branded queries (people searching your company name) inflate results and mask real SEO progress. Split them in every report.
- Combine Google Search Console and Google Analytics. GSC tells you what ranks, GA4 tells you what converts. A free SEO dashboard with only one source gives you half the picture. The best SEO report templates connect both.
- Use period-over-period comparisons, not just totals. “10,000 clicks” is meaningless without context. “10,000 clicks, up 23% month over month” tells a story.
- Track keywords by position buckets, not individual ranks. Instead of obsessing over one keyword, track how many keywords sit in positions 1–3, 4–10, 11–20. Movement between buckets is a stronger signal than any single rank.
- Include page-level data. Site-wide averages hide your best and worst performers. Always include a table showing performance by URL so you know exactly where to focus.
- Set goals and pacing indicators. The first question clients and executives ask is “are we on track?” Add progress bars or goal pacing for your top KPIs.
- Match the dashboard to the audience. An SEO specialist needs keyword-level granularity. A CMO needs a high-level summary with three numbers. Build the right view for the right reader.
- Automate the update cycle. Manual data exports kill consistency. Use Data Studio with native Google connectors (Search Console, GA4) so the dashboard updates automatically every time you open it. This is what makes a Data Studio marketing dashboard template more reliable than a manual SEO dashboard template Excel spreadsheet. With live data connections, your Google SEO dashboard updates automatically every time you open it.
Frequently Asked Questions
What is an SEO dashboard?
An SEO dashboard is a visual report that tracks your organic search performance: keyword rankings, organic traffic, click-through rates, impressions, and top-performing pages. It typically combines data from Google Search Console (search-side data) and Google Analytics 4 (site-side data) into one view.
How do you track SEO performance?
Connect Google Search Console and GA4 to a Data Studio template. Track impressions, clicks, CTR, average position by keyword and page. Compare periods to see growth. The best SEO dashboards also track branded vs. non-branded traffic, keyword ranking changes, and organic conversions.
Do I need a connector for Google Search Console?
No. Google Search Console is a native Data Studio data source — it connects directly for free, no third-party connector needed. Same for GA4 and Google Ads. You only need a connector for non-Google sources like social media, CRMs, or e-commerce platforms.
Can I track keyword rankings over time in Data Studio?
Yes. Our SEO Keyword Ranking Tracker template shows position changes, new keywords gained, and keywords lost over any date range. It uses Google Search Console data, which tracks average position for every query your site appears for.
What is the difference between an SEO and a GA4 template?
SEO templates focus on search performance using Google Search Console data: queries, impressions, clicks, positions. GA4 templates focus on website behavior: sessions, page views, engagement, conversions. The best SEO reports combine both for a complete picture of organic performance.
How do you combine SEO and Google Analytics in one dashboard?
Use Data Studio with two data sources: Google Search Console for search-side metrics (impressions, clicks, CTR, position) and Google Analytics 4 for site-side metrics (sessions, engagement, conversions). Our SEO dashboard template connects both natively — no third-party connector needed. This gives you a complete view: GSC shows what ranks and gets clicked, GA4 shows what that traffic does once it lands. You can build cross-source charts that show, for example, which keywords drive the most conversions.
What are the best SEO dashboard examples?
The best dashboard examples depend on your use case. For full organic search reporting, use an SEO template that combines Search Console and GA4 data. For keyword monitoring, use a ranking tracker focused on position changes. For local businesses, a Google Business Profile dashboard tracking map impressions, calls, and directions. For content teams, a content performance dashboard measuring traffic and engagement by URL. Every template in this list is a working Data Studio dashboard you can copy and connect to your own data in minutes — not just a static screenshot.
Can I build a free SEO dashboard in Data Studio (formerly Looker Studio)?
Yes. Data Studio (formerly Looker Studio) is free and connects natively to Google Search Console and Google Analytics 4 — the two essential data sources for an SEO dashboard. You can either start from scratch or use a pre-built template like the ones in this list. Every template here is free, works in Data Studio, and takes under 5 minutes to set up. For non-Google data sources (Ahrefs, SEMrush, social media), you would need a connector like Porter Metrics.
What SEO metrics should I track in a dashboard?
Organize your SEO metrics in three layers. Visibility: impressions, average position, and total keywords indexed (from Google Search Console). Engagement: clicks, CTR, sessions, engagement rate (from GSC and GA4). Conversion: organic conversions, revenue, and conversion rate (from GA4). Add context by comparing periods, segmenting branded vs. non-branded queries, and breaking down by device and geography. Avoid tracking too many metrics without hierarchy — one KPI per funnel stage is enough to start.
What is the difference between an SEO dashboard and an SEO report template?
An SEO dashboard is a live, interactive view that updates automatically every time you open it — ideal for daily or weekly monitoring. An SEO report template is structured for sharing with clients or stakeholders, usually on a monthly or quarterly basis, with summaries, context, and recommendations. In practice, many teams use the same Data Studio template for both: they monitor it as a live dashboard during the week and share it as a report at the end of the month. All templates in this list work for both use cases.
How do I track local SEO performance?
Connect your Google Business Profile to a Data Studio template. Track search impressions (how often your listing appears), map impressions (visibility in Google Maps), and customer actions (calls, direction requests, website clicks). Monitor your review count and average rating over time. For multi-location businesses, segment by location to see which listings need attention. Our Local SEO and Google Business Profile templates are built specifically for this.
What is the difference between an SEO dashboard and a marketing dashboard?
An SEO dashboard focuses specifically on organic search performance: keyword rankings, impressions, clicks, and organic conversions. A marketing dashboard template is broader and combines data from multiple channels — SEO, paid ads, social media, email — into a single cross-channel view. If you need to report on SEO alongside other channels, start with a broader digital marketing dashboard template and add SEO-specific tabs for deeper analysis.
How often should I check my SEO dashboard?
It depends on the use case. For operational monitoring (checking if something broke), daily or every few days. For performance management (tracking progress against goals), weekly. For client reporting or strategic reviews, monthly. SEO changes tend to show up slower than paid channels, so daily obsessing over rankings is rarely productive. A weekly cadence for most teams, with monthly deep dives, strikes the right balance between staying informed and staying sane.
Can I white-label these SEO dashboard templates for my clients?
Yes. Every Data Studio template in this list is fully customizable. You can add your agency logo, change the color scheme to match your brand, adjust date ranges, and remove Porter Metrics branding. Data Studio lets you share dashboards via link (live, always updated) or as a scheduled PDF export. For agencies, this means you can send professional, branded SEO reports to clients without building anything from scratch.
How do I build a free SEO dashboard?
You can build a free SEO dashboard using Data Studio (formerly Looker Studio) with native Google Search Console and Google Analytics connectors. Start by connecting your Google Analytics account and Search Console property. Add KPI scorecards for organic sessions, impressions, clicks, and CTR. Then add a keyword ranking table and a page-level performance breakdown. All Porter Metrics SEO templates are free to copy and customize.
Can I track organic traffic KPIs in a dashboard template?
Yes. The best SEO dashboard templates track organic traffic KPIs like sessions, users, bounce rate, and conversions from organic search. They also include SEO and Google Analytics metrics side by side: keyword impressions and clicks from Search Console, plus on-site behavior from GA4. This combination lets you connect SEO traffic metrics to actual business outcomes.
Start with a free SEO dashboard template
Every template in this list is free, white-label ready, and takes under 5 minutes to set up. Whether you need a Google SEO dashboard for keyword tracking, a GA4 template for organic conversion reporting, or a local SEO dashboard for Google Business Profile — pick the template that matches your use case, connect your data source, and start reporting today. No coding required, no manual exports, no third-party connectors for Google-native data.
Browse all 110+ templates →Other Dashboard Templates
Explore more free Data Studio templates by category: