

The best free digital marketing dashboard templates in 2026 unify all your marketing channels — paid ads, SEO, social media, email, CRM, and web analytics — into a single Data Studio (formerly Looker Studio) dashboard.
Built and tested by Porter Metrics, used by +10,000 marketing teams worldwide.
Quick answer — 10 Best Free Digital Marketing Dashboard Templates in 2026
- Cross-channel Marketing — All channels unified: ads, SEO, social, web
- Digital Marketing — Complete digital marketing overview
- Agency — Multi-client agency reporting
- PPC KPIs — Marketing KPIs and goal tracking
- Google Analytics 4 — Website traffic and conversions
- SEO — Organic search performance
- Social Media — Multi-platform social metrics
- PPC Multi-channel — All paid advertising channels
- Email Marketing — Email campaign performance
- Content Marketing — Content performance and ROI
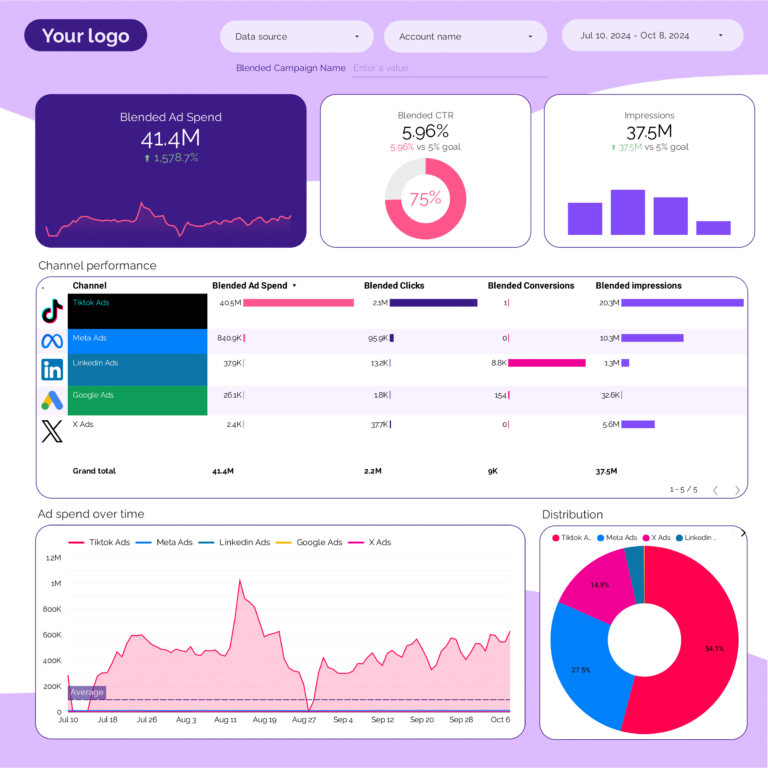
Cross-Channel Attribution Template
Cross-channel attribution: revenue and conversions by channel (organic, paid, social, email, direct, referral). Shows each channel’s contribution to total results. When organic drives 40% of revenue but gets 5% of the budget, this template makes the misalignment impossible to ignore.
A/B Testing Dashboard Template 
A/B test tracking: variant performance, conversion lift, and statistical significance. Tracks email subject line tests, landing page variants, and ad creative experiments in one view. Shows not just which variant won, but whether the sample size is large enough to trust the result.
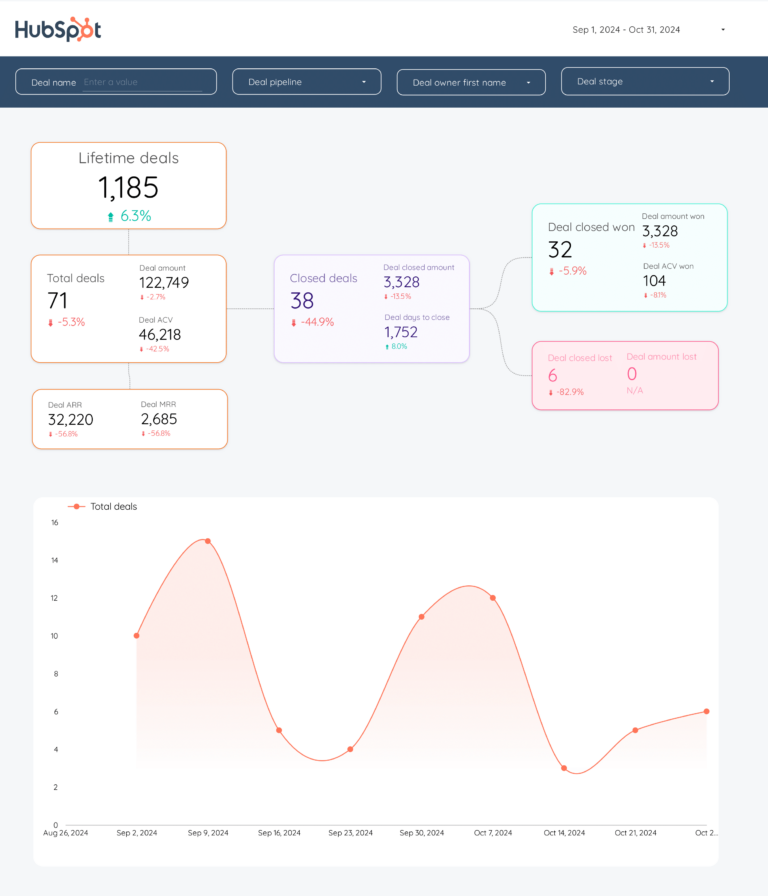
Sales Dashboard Template 
Marketing-to-sales bridge: pipeline value, deals closed, win rate, average deal size, and sales cycle length by marketing source. Connects top-funnel marketing effort to bottom-line revenue. When marketing says ‘we sent 500 leads’ this template shows how many became deals and at what value.
Quick Comparison
| Template | Best For | Setup |
|---|---|---|
| PPC KPIs | Marketing KPIs and goal tracking | 2 min |
| Google Analytics 4 | Website traffic and conversions | 2 min |
| Organic search performance | 2 min | |
 Social Media Social Media | Multi-platform social metrics | 2 min |
| All paid advertising channels | 2 min | |
 Email Marketing Email Marketing | Email campaign performance | 2 min |
| Content Marketing | Content performance and ROI | 2 min |
The 10 Best Templates
PPC KPIs Dashboard Template
Marketing KPI scorecard spanning the full funnel: sessions and reach (visibility), engagement rate (response), leads and revenue (conversion), CAC and ROAS (efficiency context). For CMOs who need the funnel health check in 60 seconds — green means healthy, red means investigate.
Key metrics visualized
- Visibility: impressions, reach, sessions across all channels
- Engagement: clicks, CTR, engagement rate by channel
- Conversion: leads, sales, ROAS, revenue, CAC by channel
- Set up period-over-period comparisons to track trends, not just totals
- Segment by audience or campaign to find what drives the best results
- Focus on conversion metrics first — visibility and engagement only matter if they lead to outcomes
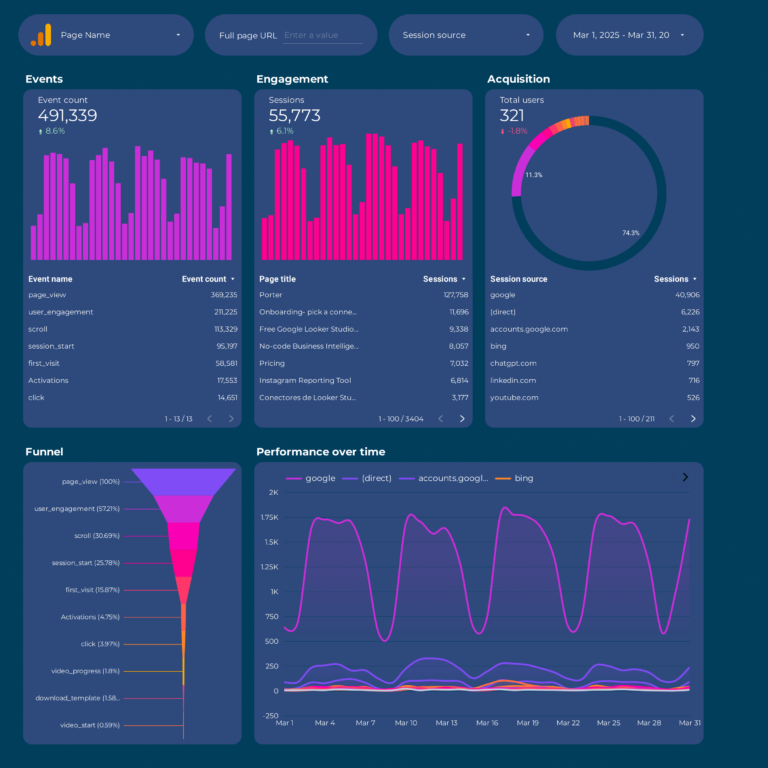
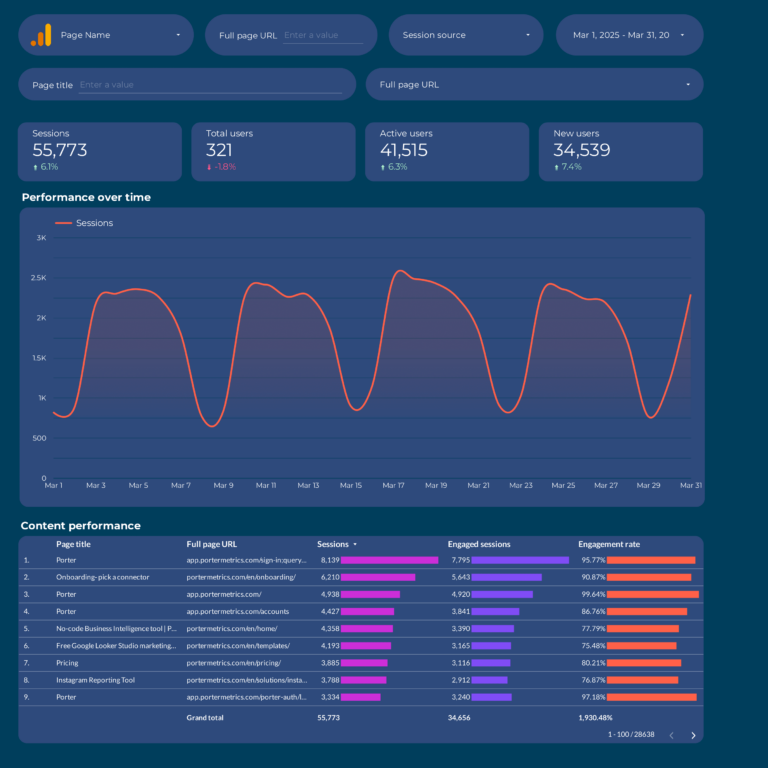
Google Analytics 4 Dashboard Template
GA4 website layer: users and sessions (traffic volume), engagement rate and events (behavior quality), conversions and revenue (business outcomes). The foundation of your digital marketing stack — everything else (ads, social, email) drives people here, and GA4 measures what they do after arrival.
Key metrics visualized
- Visibility: impressions, reach, sessions across all channels
- Engagement: clicks, CTR, engagement rate by channel
- Conversion: leads, sales, ROAS, revenue, CAC by channel
- Set up period-over-period comparisons to track trends, not just totals
- Segment by audience or campaign to find what drives the best results
- Focus on conversion metrics first — visibility and engagement only matter if they lead to outcomes
SEO Dashboard Template 
SEO channel view: organic sessions, keyword impressions and clicks (Search Console), and organic conversions (GA4). Shows whether organic search is growing or declining as a traffic source and whether that traffic converts into business outcomes — not just rankings.
Key metrics visualized
- Visibility: impressions, reach, sessions across all channels
- Engagement: clicks, CTR, engagement rate by channel
- Conversion: leads, sales, ROAS, revenue, CAC by channel
- Set up period-over-period comparisons to track trends, not just totals
- Segment by audience or campaign to find what drives the best results
- Focus on conversion metrics first — visibility and engagement only matter if they lead to outcomes
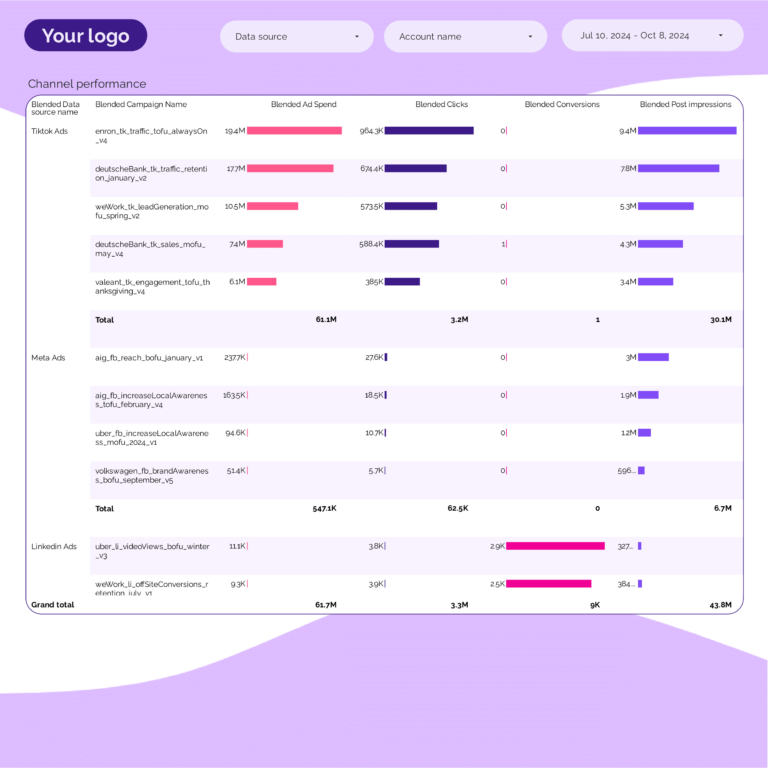
PPC Multi-channel Dashboard Template 
PPC channel summary: total paid spend, ROAS, CPA, and conversion volume across Google and Meta. A macro view — drill into the dedicated PPC template for campaign details. Shows whether your paid investment generates positive returns at the portfolio level.
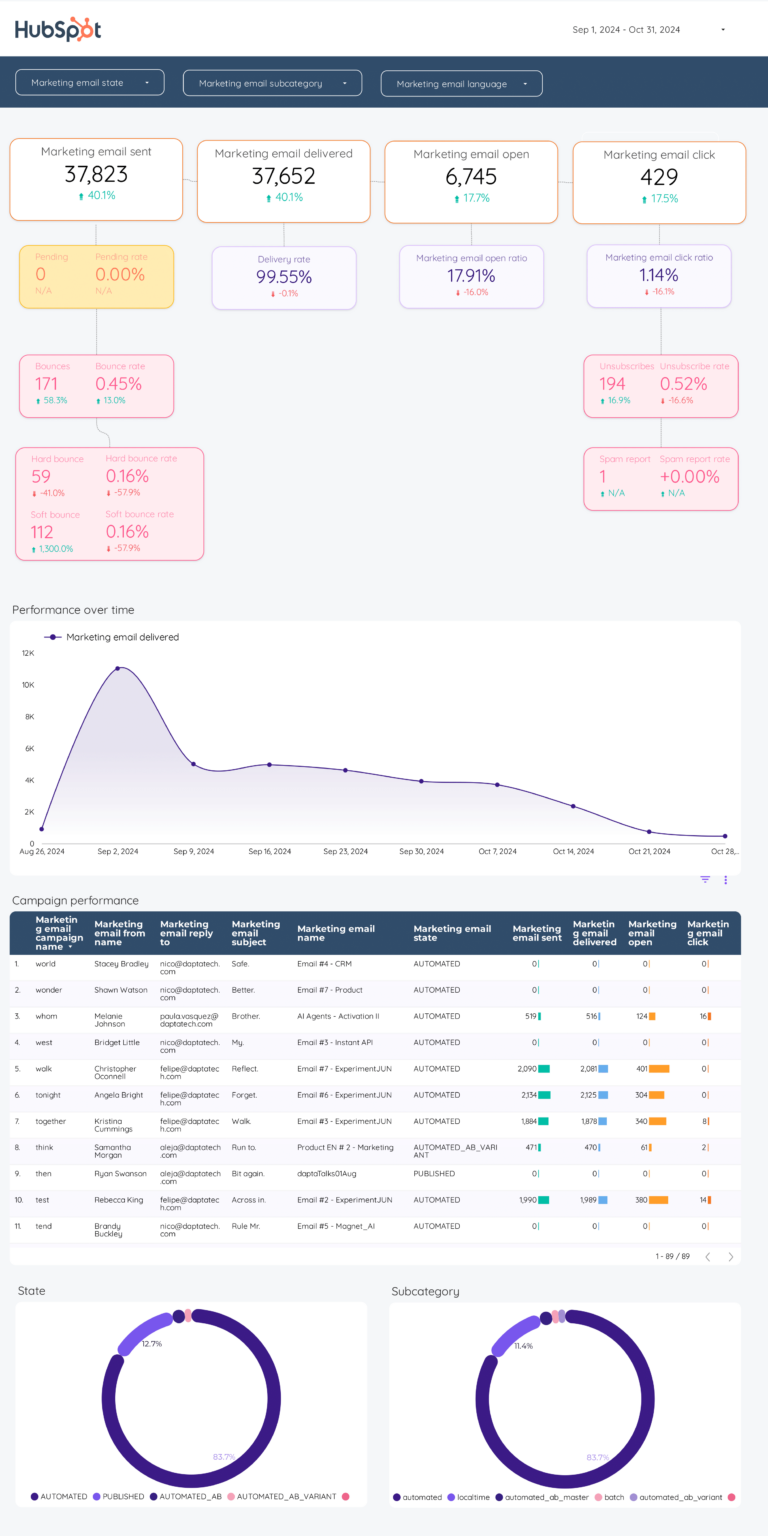
Email Marketing Dashboard Template
Email funnel: sends → delivered (deliverability), opens (subject line quality), clicks (content relevance), conversions (business impact). A 40% open rate with 1% click rate means your subject lines work but your content doesn’t. This template pinpoints where in the email funnel you lose people.
Content Marketing Dashboard Template
Content performance: organic sessions by URL, time on page and scroll depth (engagement quality), and content-attributed conversions (business value). A blog post with 10K views and zero conversions is entertainment, not marketing. This template separates content that drives business from content that drives vanity metrics.
How to Use a Template
- Choose a template from the list above
- Click "Get this template"
- Copy to your Data Studio account
- Connect your data
- Customize with your branding
What Should a Digital marketing Dashboard Include?
The most effective digital marketing dashboards — from KPI dashboard examples to executive dashboard examples and CMO dashboard templates — are organized around three layers of the marketing funnel, with context and segmentation to make the data actionable:
1. Visibility metrics (is your audience seeing your content?)
Start with top-of-funnel metrics that tell you whether your digital marketing efforts are generating reach: impressions, reach, sessions across all channels. These are the leading indicators that show if your campaigns are getting in front of the right audience.
2. Engagement metrics (are they interacting?)
Once your audience sees your content, are they responding? Track clicks, CTR, engagement rate by channel. The gap between visibility and engagement reveals whether your messaging, creative, or targeting needs adjustment.
3. Conversion metrics (are they taking action?)
The bottom line: leads, sales, ROAS, revenue, CAC by channel. A dashboard without conversion data is just a vanity report. Connect engagement to business outcomes to prove ROI and justify budget.
4. Add context to every metric
Raw numbers mean nothing without comparison. Include period-over-period trends, efficiency rates (CTR, conversion rate, CPA), and progress against goals. This turns data into decisions.
5. Segment to find insights
Aggregate data hides opportunities. Segment by campaign, audience, content type, device, and time period to find what actually drives results.
Digital marketing Dashboard Best Practices
- Match the dashboard to the audience. A media buyer needs granular campaign data. A CMO needs a high-level summary. Build the right view for the reader.
- Use period-over-period comparisons, not just totals. “5,000 clicks” is meaningless. “5,000 clicks, up 18% month over month” tells a story.
- Include conversion data, not just engagement. Impressions and clicks are leading indicators. Revenue, leads, and ROAS are what the business cares about.
- Automate the data refresh. Manual exports kill consistency. Use Data Studio with native connectors so the dashboard updates every time you open it.
- Set goals with pacing indicators. The first question stakeholders ask is “are we on track?” Add progress bars or target lines for top KPIs.
- Segment by campaign and audience. Site-wide or account-wide averages hide your best and worst performers. Always include a breakdown table.
- Keep it focused. A dashboard with 50 charts is a data dump, not a dashboard. Aim for 5–8 key visualizations per view.
FAQ
What is a digital marketing dashboard?
A digital marketing dashboard unifies all your marketing channels — paid ads, SEO, social media, email, CRM, and web analytics — into a single view. It gives marketing directors and CMOs a complete picture of performance without logging into multiple platforms.
How to create a marketing dashboard in Data Studio?
Start with a cross-channel template that connects to all your data sources. Porter Metrics handles the data blending automatically — unifying metrics like spend, impressions, clicks, and conversions across Google Ads, Meta Ads, GA4, and social media.
What KPIs should a marketing dashboard include?
Total marketing spend, total conversions, overall ROAS, cost per acquisition, organic vs. paid traffic split, channel-by-channel performance, and top campaigns. Our Cross-channel template includes all of these with automatic data blending.
Can I see all marketing channels in one dashboard?
Yes. The Cross-channel Marketing template combines Google Ads, Meta Ads, TikTok Ads, LinkedIn Ads, Google Analytics 4, Google Search Console, and social media data into a single unified dashboard.
How often should I review a marketing dashboard?
Daily for campaign monitoring, weekly for optimization decisions, monthly for strategic reviews and client reports. Data Studio dashboards refresh automatically, so your data is always current.
What metrics should I track in a digital marketing dashboard?
Organize metrics in three layers. Visibility: impressions, reach, sessions across all channels. Engagement: clicks, CTR, engagement rate by channel. Conversion: leads, sales, ROAS, revenue, CAC by channel. Add context with period-over-period comparisons and segment by campaign, audience, or content type to find actionable insights.
How often should I check my digital marketing dashboard?
For operational monitoring, check daily or every few days. For performance management and client reporting, weekly or monthly. The right cadence depends on your role: media buyers need daily data, account managers need weekly summaries, executives need monthly overviews.
Can I white-label these templates for my clients?
Yes. Every Data Studio template is fully customizable. Add your logo, change colors, adjust date ranges, and remove Porter Metrics branding. Share via live link (always updated) or scheduled PDF export for professional, branded reporting.
Do I need a connector to use these templates?
It depends on the data source. Google-native sources (Google Ads, GA4, Search Console) connect directly to Data Studio for free. For non-Google sources (Facebook, Instagram, Shopify, HubSpot, LinkedIn, etc.), you need a connector like Porter Metrics to bridge the data.
What are good KPI dashboard examples for marketing?
The best KPI dashboard examples for marketing track 3-5 key metrics per channel. For PPC: ROAS, CPA, CTR. For SEO: organic sessions, keyword rankings, conversions. For social: engagement rate, reach, follower growth. For email: open rate, click rate, conversions. A good marketing KPI dashboard shows all these in one view with period-over-period trends, not just raw numbers. See the templates above for executive dashboard examples that work for CMO and VP-level reporting.
What marketing dashboard software should I use?
For Data Studio users, Porter Metrics provides the largest template gallery — every digital marketing dashboard template on this page is free. For broader marketing dashboard software, options include Databox, DashThis, and Whatagraph. The advantage of Data Studio is zero software cost, full customization, and native Google integrations. These management dashboard examples work for agencies and in-house teams alike.
Is there a digital marketing report template I can customize?
Yes. Every template on this page is a customizable digital marketing report template. Change the date range, add your logo, adjust the layout, and connect your data sources. Unlike a static digital marketing dashboard template Excel, these Data Studio templates update automatically. You can also find specialized views: social media dashboard template, sales dashboard template, and SEO marketing dashboard.
Start with a free template
Every template is free, white-label ready, and takes under 5 minutes to set up.
Browse all 110+ templates →Other Dashboard Templates
Explore more free Data Studio templates by category:
Social Media Dashboard Template
Social media channel summary: reach, engagement, and follower growth across platforms. Not a deep-dive — a channel-level view showing social’s contribution to the overall marketing mix. When 60% of budget goes to paid but social drives 30% of leads, this template makes that visible.
Key metrics visualized