

The best free Google Ads dashboard templates in 2026 give you full visibility into your paid search campaigns — CPC, CTR, ROAS, quality score, keyword performance, and budget pacing — all automated in Data Studio (formerly Looker Studio).
Built and tested by Porter Metrics, used by +10,000 marketing teams worldwide.
Quick answer — 10 Best Free Google Ads Dashboard Templates in 2026
SEM Dashboard Template 
Combines Google Ads paid data with organic Search Console data. Shows where you rank organically vs where you’re paying — if you rank #1 organically for a keyword but also run ads on it, you might be cannibalizing free traffic. Identifies gaps where paid should fill what organic can’t reach yet.
ROAS Dashboard Template
ROAS as the conversion-to-cost ratio: revenue divided by ad spend per campaign and time period. Shows which campaigns generate profitable returns (scale), which break even (optimize), and which lose money (restructure). The efficiency context that raw conversion counts don’t provide.
Quick Comparison
| Template | Best For | Setup |
|---|---|---|
| 2 min | ||
| 2 min | ||
| 2 min | ||
| 2 min | ||
| 2 min | ||
| 2 min | ||
| 2 min | ||
| 2 min |
The 10 Best Templates
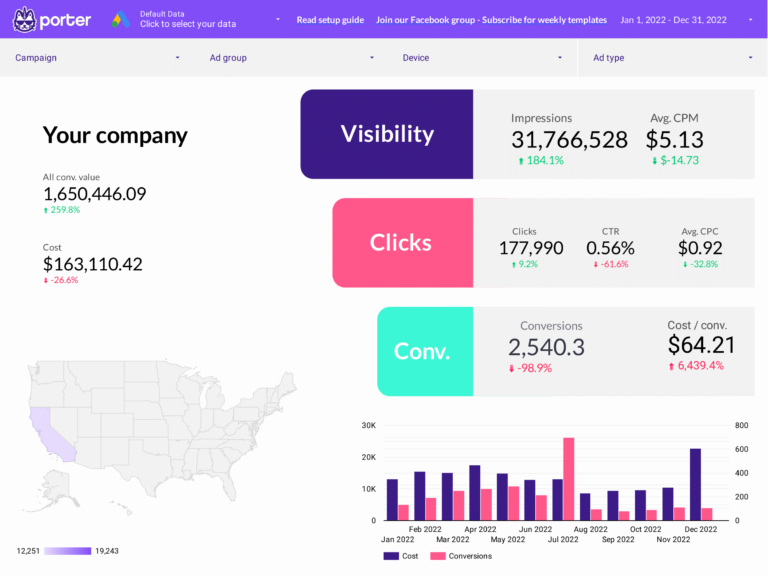
Google Ads Dashboard Template
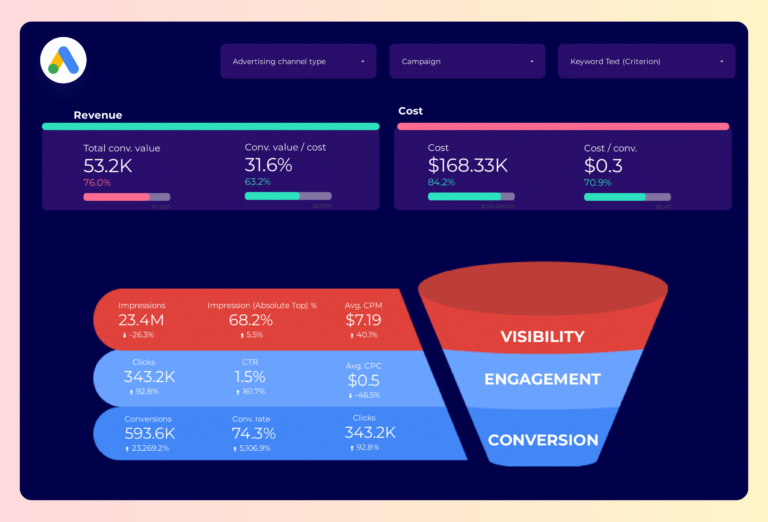
Most PopularAccount overview showing the full funnel: impressions and impression share (are you visible?), clicks and CTR (are people interested?), conversions and CPA (are they taking action?), ROAS (is it profitable?). Daily trends reveal whether performance is improving or degrading before monthly reports catch it.
Key metrics visualized
- Visibility: impressions, impression share, search impression share
- Engagement: clicks, CTR, CPC, quality score
- Conversion: conversions, cost per conversion, ROAS, conversion value
- Set up period-over-period comparisons to track trends, not just totals
- Segment by audience or campaign to find what drives the best results
- Focus on conversion metrics first — visibility and engagement only matter if they lead to outcomes
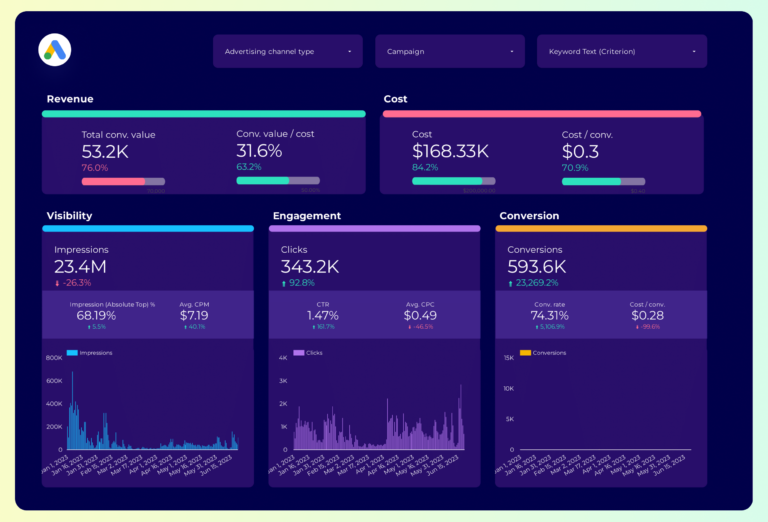
Google Ads (Overview) Dashboard Template
Performance Max dashboard: since PMax automates targeting and placements, visibility into what works is limited. This template surfaces what Google does report — conversions by asset group, conversion value trends, and CPA by campaign. The context you need to decide whether to scale or restructure PMax.
Key metrics visualized
- Visibility: impressions, impression share, search impression share
- Engagement: clicks, CTR, CPC, quality score
- Conversion: conversions, cost per conversion, ROAS, conversion value
- Set up period-over-period comparisons to track trends, not just totals
- Segment by audience or campaign to find what drives the best results
- Focus on conversion metrics first — visibility and engagement only matter if they lead to outcomes
Google Ads PMax Dashboard Template
PopularPMax deep-dive: audience signals, asset performance ratings, search themes, and conversion breakdown. Google controls where PMax spends your budget — this template shows the output so you can adjust inputs (assets, signals, budgets) based on which combinations produce profitable conversions.
Key metrics visualized
- Visibility: impressions, impression share, search impression share
- Engagement: clicks, CTR, CPC, quality score
- Conversion: conversions, cost per conversion, ROAS, conversion value
- Set up period-over-period comparisons to track trends, not just totals
- Segment by audience or campaign to find what drives the best results
- Focus on conversion metrics first — visibility and engagement only matter if they lead to outcomes
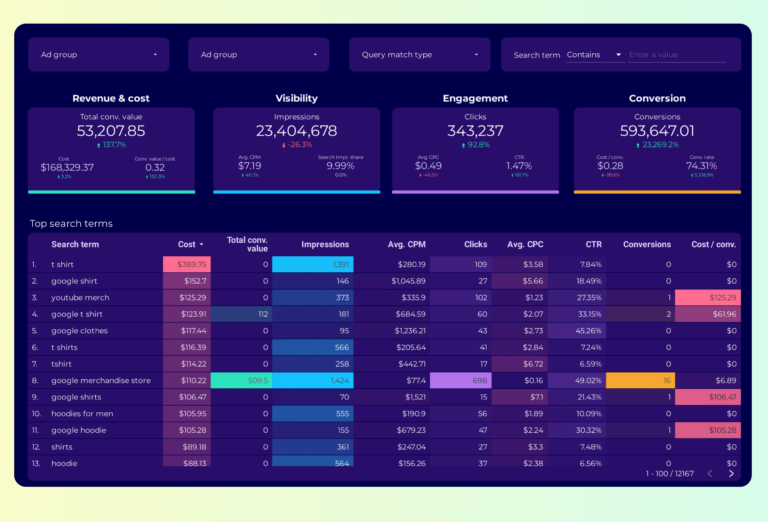
Google Ads Keyword Analysis Dashboard Template
Keyword-level funnel: impressions (visibility in search), clicks and CTR (relevance of your ad to the query), conversions and CPA (business value of each keyword). Includes quality score to show where Google penalizes you, and search terms to find what people actually typed. The core optimization tool.
Key metrics visualized
- Visibility: impressions, impression share, search impression share
- Engagement: clicks, CTR, CPC, quality score
- Conversion: conversions, cost per conversion, ROAS, conversion value
- Set up period-over-period comparisons to track trends, not just totals
- Segment by audience or campaign to find what drives the best results
- Focus on conversion metrics first — visibility and engagement only matter if they lead to outcomes
Google Ads Funnel Dashboard Template
Click-to-conversion funnel: impressions → clicks → landing page views → conversions → revenue. Each step shows volume and drop-off rate. If 40% of clicks don’t reach the landing page, your site speed or mobile experience is leaking budget — before you even get to optimize the offer.
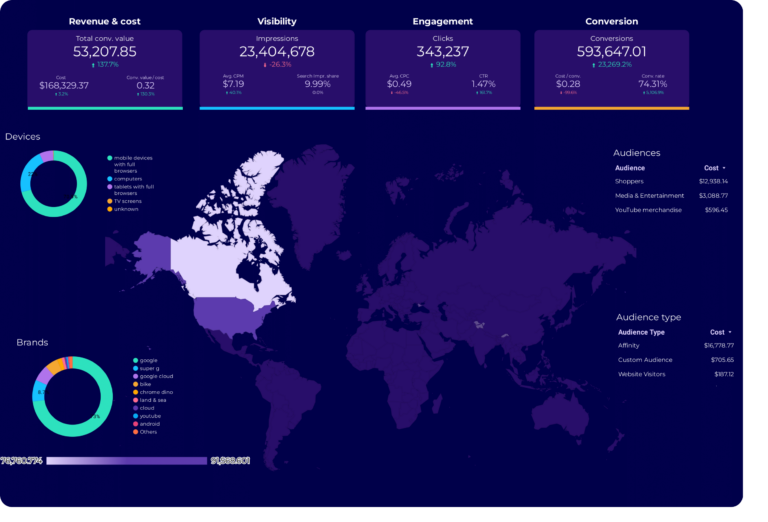
Google Ads Audience Dashboard Template
Segments Google Ads performance by who sees the ads: age, gender, device, and network. Shows CTR (interest), conversion rate (intent), and CPA (cost to convert) per segment. Identifies which audiences convert profitably and which ones spend budget without returning value.
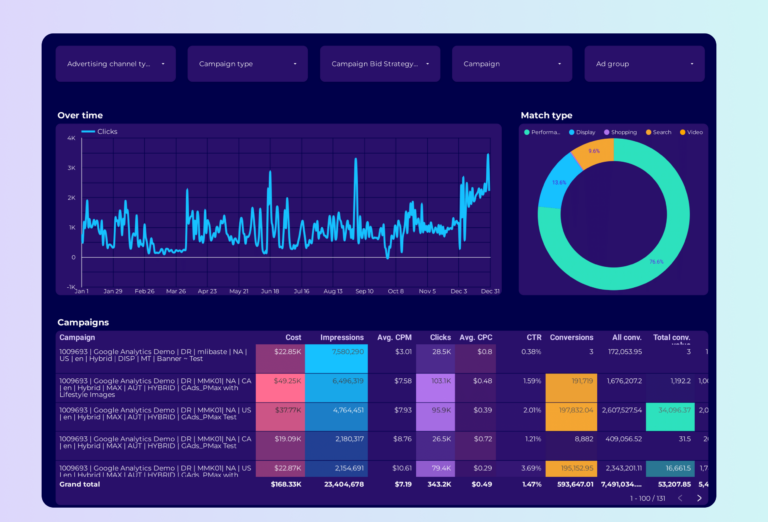
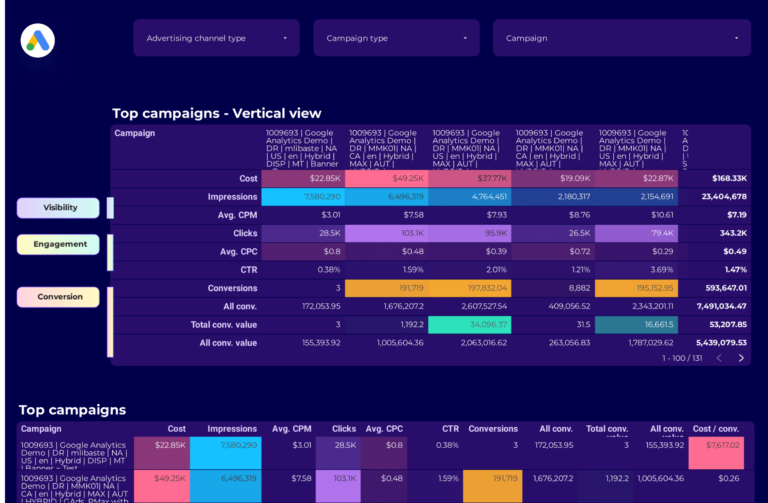
Google Ads Campaign Performance Dashboard Template
Campaign table sortable by any metric: spend, conversions, CPA, ROAS, impression share. Impression share is the key context metric — it shows how much of the available market you’re capturing. A campaign with 30% impression share and strong ROAS has room to scale. One at 90% doesn’t.
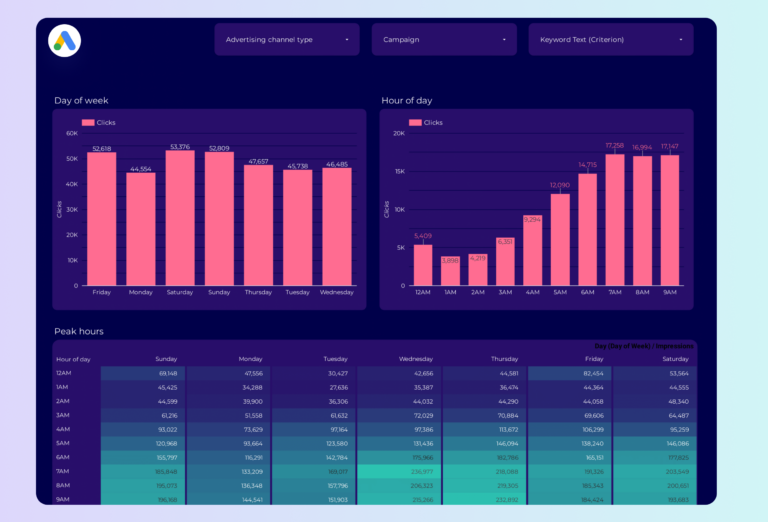
Google Ads Peak Hours Dashboard Template
Performance by hour and day of week in a heat map: when do conversions peak and when does CPA spike? Use it to set ad scheduling — bid higher during high-conversion hours, reduce spend during dead zones. The pattern often reveals that weekday mornings convert at half the CPA of weekends.
How to Use a Template
- Choose a template from the list above
- Click "Get this template"
- Copy to your Data Studio account
- Connect your data
- Customize with your branding
What Should a Google Ads Dashboard Include?
The most effective Google Ads dashboards — whether in the native Google Ads interface, a Google Data Studio report, or a third-party tool — are organized around three layers of the marketing funnel, with context and segmentation to make the data actionable:
1. Visibility metrics (is your audience seeing your content?)
Start with top-of-funnel metrics that tell you whether your google ads efforts are generating reach: impressions, impression share, search impression share. These are the leading indicators that show if your campaigns are getting in front of the right audience.
2. Engagement metrics (are they interacting?)
Once your audience sees your content, are they responding? Track clicks, CTR, CPC, quality score. The gap between visibility and engagement reveals whether your messaging, creative, or targeting needs adjustment.
3. Conversion metrics (are they taking action?)
The bottom line: conversions, cost per conversion, ROAS, conversion value. A dashboard without conversion data is just a vanity report. Connect engagement to business outcomes to prove ROI and justify budget.
4. Add context to every metric
Raw numbers mean nothing without comparison. Include period-over-period trends, efficiency rates (CTR, conversion rate, CPA), and progress against goals. This turns data into decisions.
5. Segment to find insights
Aggregate data hides opportunities. Segment by campaign, audience, content type, device, and time period to find what actually drives results.
Google Ads Dashboard Best Practices
- Match the dashboard to the audience. A media buyer needs granular campaign data. A CMO needs a high-level summary. Build the right view for the reader.
- Use period-over-period comparisons, not just totals. “5,000 clicks” is meaningless. “5,000 clicks, up 18% month over month” tells a story.
- Include conversion data, not just engagement. Impressions and clicks are leading indicators. Revenue, leads, and ROAS are what the business cares about.
- Automate the data refresh. Manual exports kill consistency. Use Data Studio with native connectors so the dashboard updates every time you open it.
- Set goals with pacing indicators. The first question stakeholders ask is “are we on track?” Add progress bars or target lines for top KPIs.
- Segment by campaign and audience. Site-wide or account-wide averages hide your best and worst performers. Always include a breakdown table.
- Keep it focused. A dashboard with 50 charts is a data dump, not a dashboard. Aim for 5–8 key visualizations per view.
FAQ
How to create a dashboard in Google Ads?
Google Ads has built-in reporting, but for professional dashboards with custom visualizations, use Data Studio. Google Ads connects natively to Data Studio for free. Copy a Google Ads template, select your account, and your dashboard is ready in 2 minutes.
How do I check the performance of Google Ads?
In Data Studio, a Google Ads template shows campaign performance at a glance: spend, impressions, clicks, conversions, CPC, CTR, and ROAS. Unlike the native Google Ads interface, you get time-series trends, keyword-level tables, and device/network breakdowns in a single view.
How to measure performance of Google Ads?
Track these KPIs: ROAS (return on ad spend), CPC (cost per click), CTR (click-through rate), conversion rate, quality score, and impression share. Our Google Ads template calculates all of these automatically and shows trends over time.
Does Google Ads connect directly to Data Studio?
Yes. Google Ads is a native Data Studio connector — no third-party tool needed. Just select your Google Ads account when you copy a template and your data appears instantly.
Can I track Performance Max campaigns in Data Studio?
Yes. Our Google Ads PMax template is specifically designed for Performance Max campaigns, showing asset group performance, search term insights, and conversion data that is harder to see in the native Google Ads interface.
What metrics should I track in a google ads dashboard?
Organize metrics in three layers. Visibility: impressions, impression share, search impression share. Engagement: clicks, CTR, CPC, quality score. Conversion: conversions, cost per conversion, ROAS, conversion value. Add context with period-over-period comparisons and segment by campaign, audience, or content type to find actionable insights.
How often should I check my google ads dashboard?
For operational monitoring, check daily or every few days. For performance management and client reporting, weekly or monthly. The right cadence depends on your role: media buyers need daily data, account managers need weekly summaries, executives need monthly overviews.
Can I white-label these templates for my clients?
Yes. Every Data Studio template is fully customizable. Add your logo, change colors, adjust date ranges, and remove Porter Metrics branding. Share via live link (always updated) or scheduled PDF export for professional, branded reporting.
Do I need a connector to use these templates?
It depends on the data source. Google-native sources (Google Ads, GA4, Search Console) connect directly to Data Studio for free. For non-Google sources (Facebook, Instagram, Shopify, HubSpot, LinkedIn, etc.), you need a connector like Porter Metrics to bridge the data.
Is there a Google Ads report template for client reporting?
Yes. Every template here doubles as a Google Ads report template for client presentations. Unlike the native Google Ads dashboard (formerly AdWords dashboard), these Data Studio reports let you add your branding, combine with GA4 data, and share via link or scheduled PDF. Much more professional than AdWords reporting screenshots.
Can I track Google Ads and Google Analytics together?
Yes. Several templates combine Google Ads campaign data with Google Analytics behavior data in one view. This lets you see not just clicks and conversions from the Google Ads status dashboard, but also what users do after clicking: bounce rate, pages per session, and goal completions. The Google Data Studio integration handles this automatically.
Start with a free template
Every template is free, white-label ready, and takes under 5 minutes to set up.
Browse all 110+ templates →Other Dashboard Templates
Explore more free Data Studio templates by category: