

The best free Facebook Insights dashboard templates in 2026 track your organic Facebook Page performance — followers, reach, engagement, post performance, and audience demographics — all in Data Studio (formerly Looker Studio).
Built and tested by Porter Metrics, used by +10,000 marketing teams worldwide.
Quick answer — 8 Best Free Facebook Insights Dashboard Templates in 2026
Community Manager Dashboard Template
Daily ops dashboard: post volume, response time to comments, engagement across Facebook, Instagram, and LinkedIn. Not a monthly report — a daily check-in tool. Shows whether you’re maintaining engagement velocity (posts per week) and audience responsiveness (comments per post trend).
Brand Awareness Dashboard Template 
Tracks top-of-funnel brand metrics: page reach over time, impression growth, follower acquisition rate, and share of voice. These are the leading indicators that show whether your audience is growing before conversion data kicks in. If reach is flat but you’re spending more, your content isn’t earning attention.

Inbound Marketing Dashboard Template 
Connects Facebook engagement to business results: page visits → content engagement → link clicks → website sessions → leads. Shows the conversion rate from social engagement to actual lead capture. For B2B teams that use Facebook as top-of-funnel and need to prove it generates pipeline, not just likes.
PESO Model Dashboard Template
PESO framework (Paid, Earned, Shared, Owned): categorizes your Facebook results by how they were generated. Paid reach vs organic reach, shared content (user-generated) vs owned content (your posts). Shows whether your growth depends on ad spend or organic momentum — and what happens if you reduce paid.
Quick Comparison
| Template | Best For | Setup |
|---|---|---|
| Facebook Insights Most Popular | 2 min | |
| Facebook Insights Competitors | 2 min | |
| Social Media | 2 min | |
| Social Media Engagement | 2 min | |
| Social Media Post Performance | 2 min | |
| Social Media Competitors | 2 min |
The 10 Best Templates
Facebook Insights Dashboard Template
Most PopularCore Facebook Page metrics organized by impact: how many people your posts reached (page reach, post reach), how they responded (reactions, comments, shares, video views), and whether they took action (link clicks, CTA clicks). Separates organic vs paid reach so you know what you earned vs what you bought.
Key metrics visualized
- Visibility: page reach, impressions, follower count
- Engagement: reactions, comments, shares, video views, post clicks
- Conversion: link clicks, CTA clicks, messages, leads
- Set up period-over-period comparisons to track trends, not just totals
- Segment by audience or campaign to find what drives the best results
- Focus on conversion metrics first — visibility and engagement only matter if they lead to outcomes
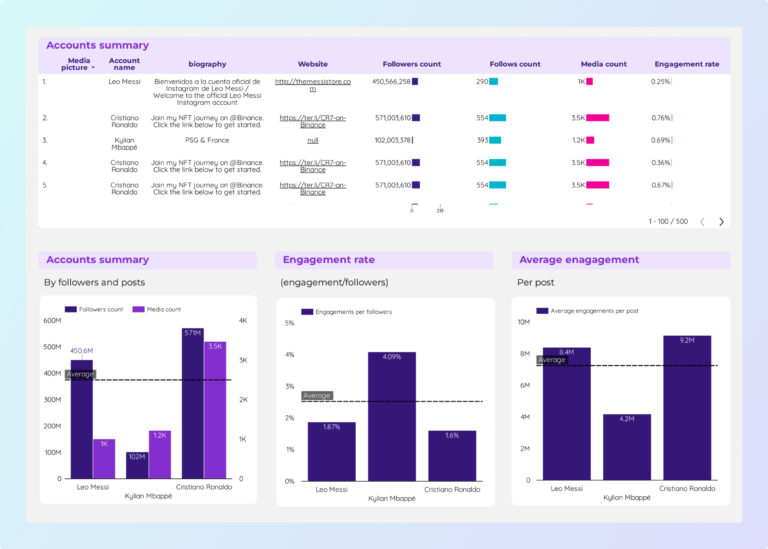
Facebook Insights Competitors Dashboard Template
Compares your Facebook Page against competitors on the metrics that matter: engagement per post (not just total followers), posting frequency, and content type distribution. A competitor with half your followers but double your engagement rate is winning the algorithm — this template shows you why.
Key metrics visualized
- Visibility: page reach, impressions, follower count
- Engagement: reactions, comments, shares, video views, post clicks
- Conversion: link clicks, CTA clicks, messages, leads
- Set up period-over-period comparisons to track trends, not just totals
- Segment by audience or campaign to find what drives the best results
- Focus on conversion metrics first — visibility and engagement only matter if they lead to outcomes
Social Media Engagement Dashboard Template
Engagement quality analysis: reactions (low-effort engagement), comments (medium-effort), shares and saves (high-effort — these extend your reach). A post with 100 shares has more visibility amplification than one with 5,000 likes. This template segments engagement by business value, not just volume.
Key metrics visualized
- Visibility: page reach, impressions, follower count
- Engagement: reactions, comments, shares, video views, post clicks
- Conversion: link clicks, CTA clicks, messages, leads
- Set up period-over-period comparisons to track trends, not just totals
- Segment by audience or campaign to find what drives the best results
- Focus on conversion metrics first — visibility and engagement only matter if they lead to outcomes
Social Media Post Performance Dashboard Template
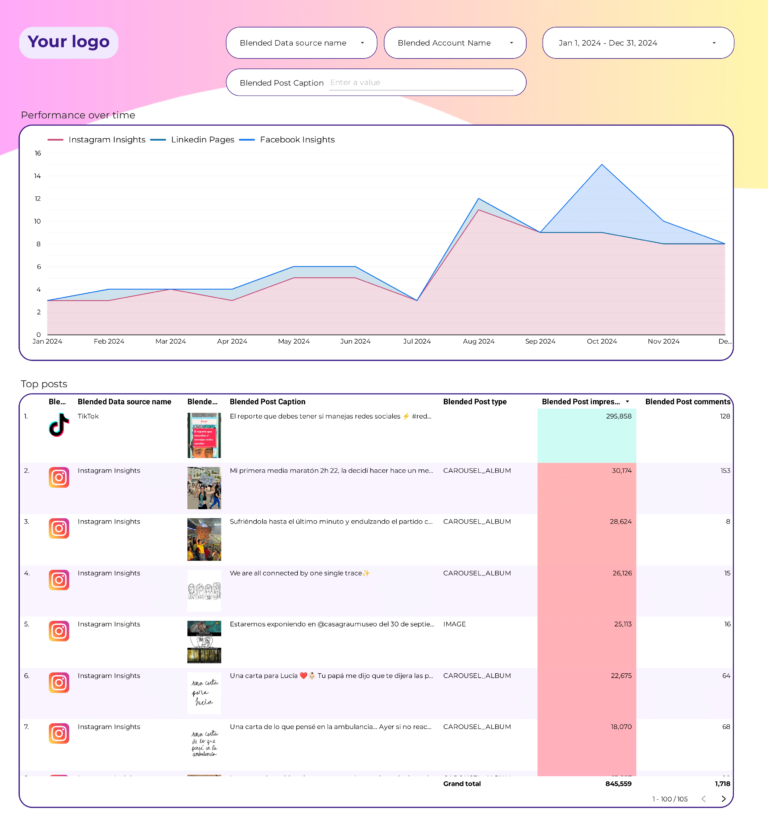
Post-level table for Facebook: reach, impressions, engagement rate, and clicks per post. Sort by engagement rate to surface top performers, filter by post type (link, photo, video) to find format patterns. The goal: figure out what kind of content earns the most reach organically.

Social Media Competitors Dashboard Template
Multi-platform competitive analysis including Facebook: compares your posting cadence, engagement rate, and audience growth against competitors. Identifies gaps in your strategy — if competitors get more reach from video posts and you mostly post links, that’s a testable hypothesis.
How to Use a Template
- Choose a template from the list above
- Click "Get this template"
- Copy to your Data Studio account
- Connect your data
- Customize with your branding
What Should a Facebook Insights Dashboard Include?
The most effective facebook insights dashboards are organized around three layers of the marketing funnel, with context and segmentation to make the data actionable:
1. Visibility metrics (is your audience seeing your content?)
Start with top-of-funnel metrics that tell you whether your facebook insights efforts are generating reach: page reach, impressions, follower count. These are the leading indicators that show if your campaigns are getting in front of the right audience.
2. Engagement metrics (are they interacting?)
Once your audience sees your content, are they responding? Track reactions, comments, shares, video views, post clicks. The gap between visibility and engagement reveals whether your messaging, creative, or targeting needs adjustment.
3. Conversion metrics (are they taking action?)
The bottom line: link clicks, CTA clicks, messages, leads. A dashboard without conversion data is just a vanity report. Connect engagement to business outcomes to prove ROI and justify budget.
4. Add context to every metric
Raw numbers mean nothing without comparison. Include period-over-period trends, efficiency rates (CTR, conversion rate, CPA), and progress against goals. This turns data into decisions.
5. Segment to find insights
Aggregate data hides opportunities. Segment by campaign, audience, content type, device, and time period to find what actually drives results.
Facebook Insights Dashboard Best Practices
- Match the dashboard to the audience. A media buyer needs granular campaign data. A CMO needs a high-level summary. Build the right view for the reader.
- Use period-over-period comparisons, not just totals. “5,000 clicks” is meaningless. “5,000 clicks, up 18% month over month” tells a story.
- Include conversion data, not just engagement. Impressions and clicks are leading indicators. Revenue, leads, and ROAS are what the business cares about.
- Automate the data refresh. Manual exports kill consistency. Use Data Studio with native connectors so the dashboard updates every time you open it.
- Set goals with pacing indicators. The first question stakeholders ask is “are we on track?” Add progress bars or target lines for top KPIs.
- Segment by campaign and audience. Site-wide or account-wide averages hide your best and worst performers. Always include a breakdown table.
- Keep it focused. A dashboard with 50 charts is a data dump, not a dashboard. Aim for 5–8 key visualizations per view.
FAQ
What is Facebook Insights?
Facebook Insights is the native analytics tool for Facebook Pages. It shows page followers, reach, engagement, and post performance. A Data Studio dashboard connected through Porter Metrics gives you the same data with better visualizations, historical trends, and the ability to combine with other platforms.
How to check Facebook Page performance?
In Data Studio, our Facebook Insights template shows followers, reach, impressions, engagement rate, and top posts — all with time-series trends. It is much easier to read than the native Facebook Insights interface and allows custom date ranges and comparisons.
Can I track Facebook and Instagram organic together?
Yes. Our Facebook + Instagram template combines organic data from both platforms into one dashboard: unified followers, engagement, reach, and content performance with per-platform breakdowns.
How to do competitor analysis on Facebook?
Our Facebook Competitors template lets you benchmark your Page against competitor Pages: compare follower growth, posting frequency, engagement rates, and content types. Track up to 10 competitor Pages.
What is the difference between Facebook Insights and Meta Ads?
Facebook Insights tracks organic Page performance (followers, reach, engagement). Meta Ads tracks paid advertising performance (spend, ROAS, conversions). They are different data sources. Our templates cover both separately and combined.
What metrics should I track in a facebook insights dashboard?
Organize metrics in three layers. Visibility: page reach, impressions, follower count. Engagement: reactions, comments, shares, video views, post clicks. Conversion: link clicks, CTA clicks, messages, leads. Add context with period-over-period comparisons and segment by campaign, audience, or content type to find actionable insights.
How often should I check my facebook insights dashboard?
For operational monitoring, check daily or every few days. For performance management and client reporting, weekly or monthly. The right cadence depends on your role: media buyers need daily data, account managers need weekly summaries, executives need monthly overviews.
Can I white-label these templates for my clients?
Yes. Every Data Studio template is fully customizable. Add your logo, change colors, adjust date ranges, and remove Porter Metrics branding. Share via live link (always updated) or scheduled PDF export for professional, branded reporting.
Do I need a connector to use these templates?
It depends on the data source. Google-native sources (Google Ads, GA4, Search Console) connect directly to Data Studio for free. For non-Google sources (Facebook, Instagram, Shopify, HubSpot, LinkedIn, etc.), you need a connector like Porter Metrics to bridge the data.
Is there a Facebook Insights report template?
Yes. The templates on this page work as a Facebook Insights report template in Data Studio. They pull page reach, post performance, follower growth, and engagement metrics directly from the Facebook API. Unlike exporting data manually from Facebook’s native Insights panel, these templates update automatically and let you create branded PDF reports for clients or stakeholders.
Start with a free template
Every template is free, white-label ready, and takes under 5 minutes to set up.
Browse all 110+ templates →Other Dashboard Templates
Explore more free Data Studio templates by category:
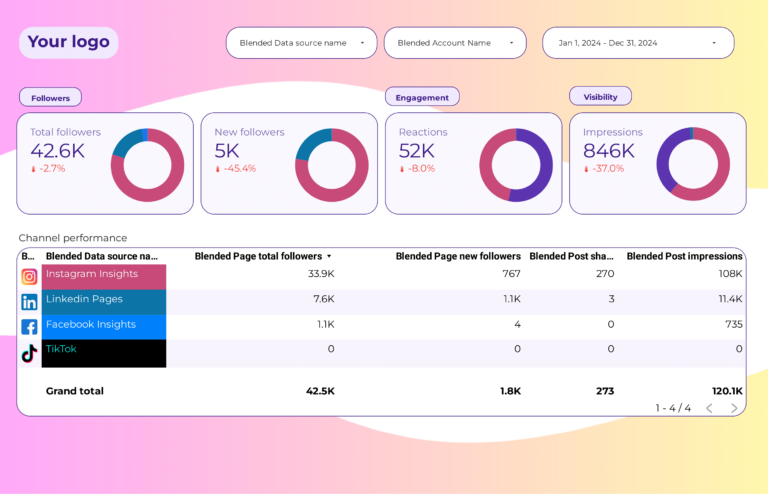
Social Media Dashboard Template
Cross-platform view: Facebook alongside Instagram, LinkedIn, and TikTok. Compares each channel on reach efficiency (impressions per post), engagement quality (engagement rate), and audience growth. Shows which platform deserves more content investment based on results, not assumptions.
Key metrics visualized