
The best free PPC dashboard templates in 2026 unify your Google Ads, Meta Ads, TikTok Ads, and LinkedIn Ads data into Data Studio (formerly Looker Studio) — tracking spend, ROAS, CPA, conversions, and campaign performance across all paid channels.
We have built and tested over 100 Data Studio templates at Porter Metrics over the past 6 years, used by +10,000 marketing teams and agencies in 60 countries.
Quick answer — 12 Best Free PPC Dashboard Templates in 2026
- PPC
- PPC Multi-channel
- PPC Campaign Performance
- PPC Creative Performance
- PPC Funnel
- PPC KPIs
- PPC Budget Tracking
- PPC Monthly
- Google Ads
- Meta/Facebook Ads
- TikTok Ads
- LinkedIn Ads
All templates free and white-label ready. Browse all 110+ templates →
Quick Comparison Table
| Template | Best For | Setup |
|---|---|---|
| 2 min | ||
| 2 min | ||
| 2 min | ||
| 2 min | ||
| 2 min | ||
| 2 min | ||
| 2 min | ||
| 2 min | ||
| 2 min | ||
 Meta/Facebook Ads Meta/Facebook Ads | 2 min | |
| 2 min | ||
 LinkedIn Ads LinkedIn Ads | 2 min |
The 12 Best Templates
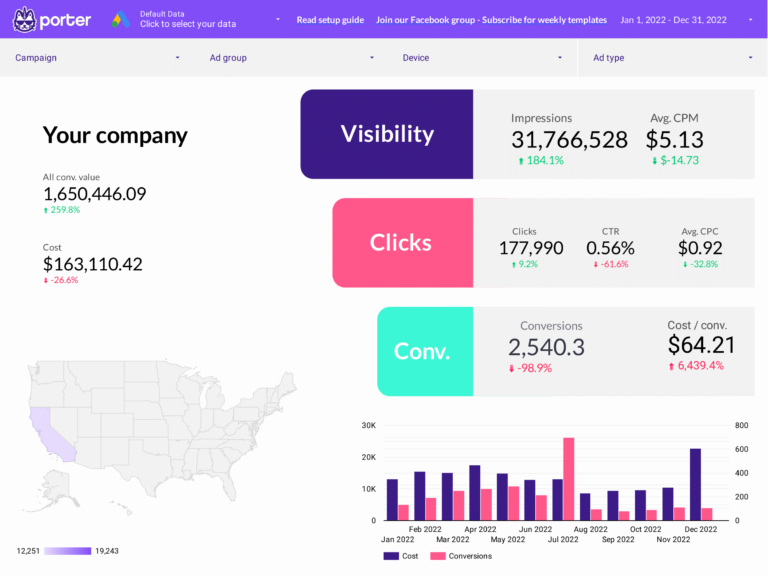
PPC Dashboard Template 
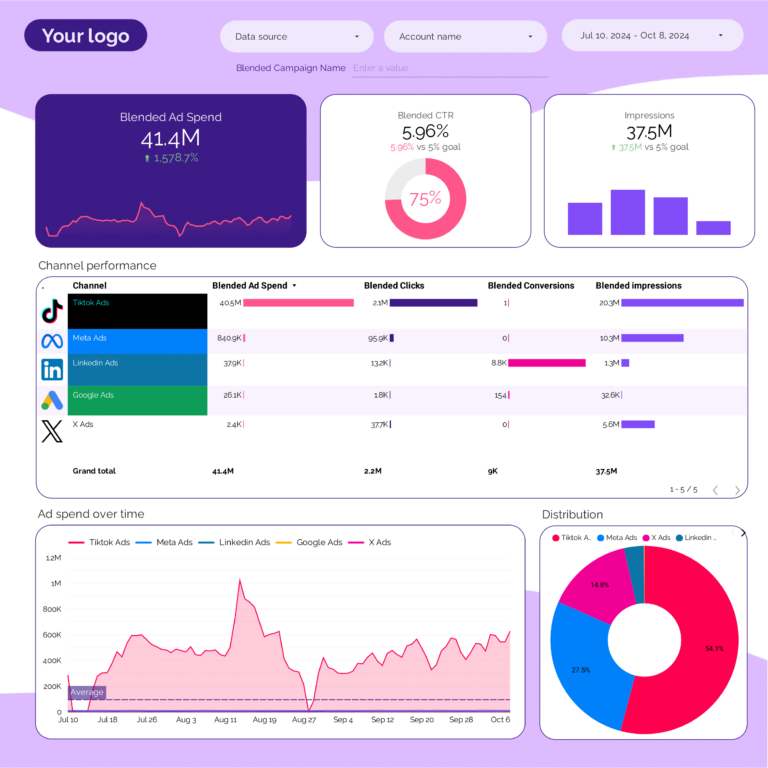
Most PopularCross-channel paid overview: total spend, impressions (visibility), clicks and CTR (engagement), conversions, CPA, and ROAS (outcomes) across Google, Meta, LinkedIn, and TikTok. The top-level view that shows whether your total paid investment is generating profitable returns before diving into any single platform.
Key metrics visualized
- Visibility: impressions, impression share, reach
- Engagement: clicks, CTR, CPC, quality score
- Conversion: conversions, CPA, ROAS, conversion value
- Set up period-over-period comparisons to track trends, not just totals
- Segment by audience or campaign to find what drives the best results
- Focus on conversion metrics first — visibility and engagement only matter if they lead to outcomes

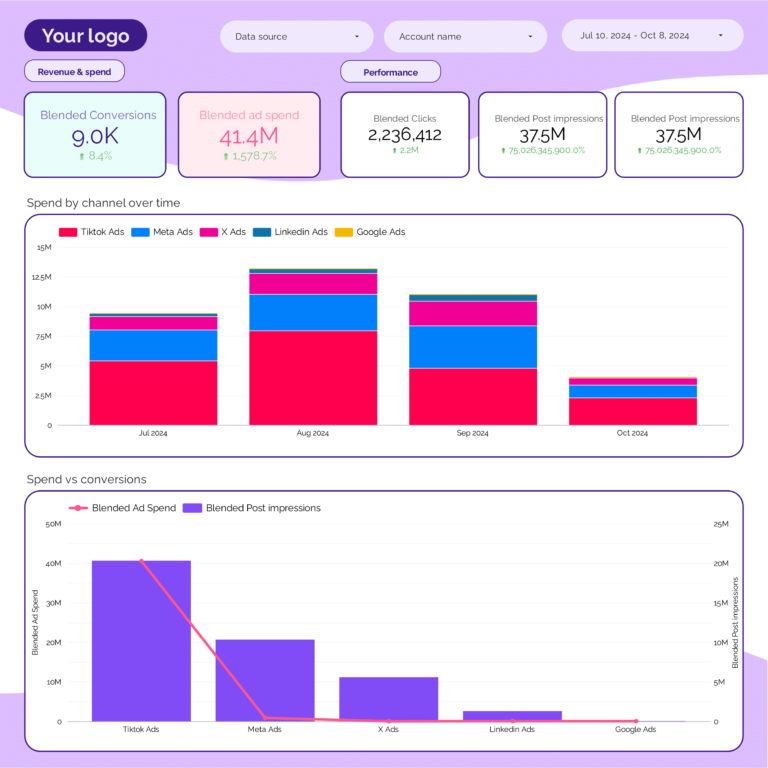
PPC Multi-channel Dashboard Template
PopularPlatform comparison: spend and ROAS side by side for each paid channel. Shows where each dollar works hardest. Google might deliver lower CPCs but Meta might deliver higher ROAS on retargeting. This template stops you from optimizing each platform in a silo and forces a budget allocation conversation.
Key metrics visualized
- Visibility: impressions, impression share, reach
- Engagement: clicks, CTR, CPC, quality score
- Conversion: conversions, CPA, ROAS, conversion value
- Set up period-over-period comparisons to track trends, not just totals
- Segment by audience or campaign to find what drives the best results
- Focus on conversion metrics first — visibility and engagement only matter if they lead to outcomes
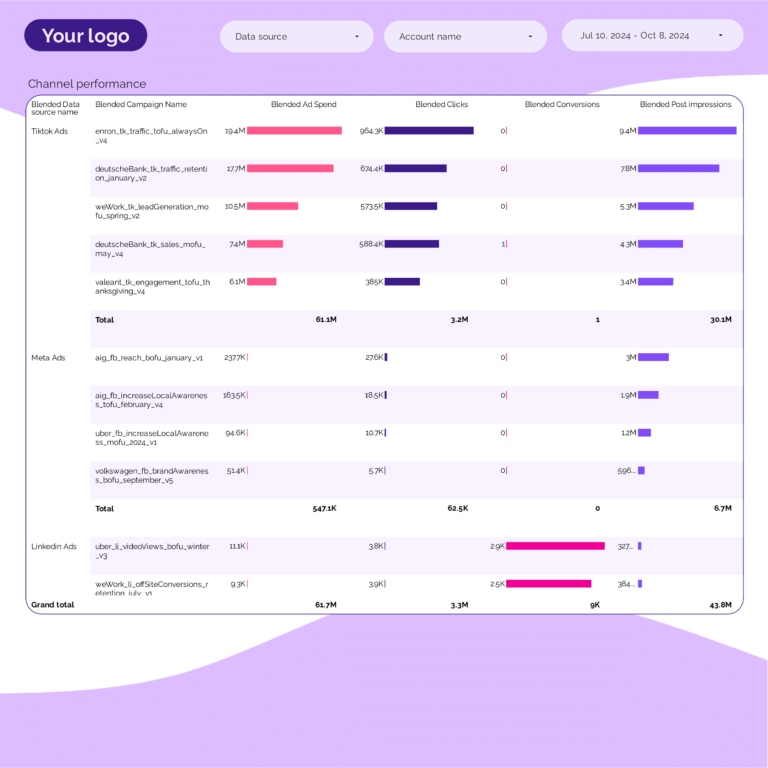
PPC Campaign Performance Dashboard Template
Campaign-level table across all platforms: name, channel, spend, clicks, conversions, CPA, ROAS. Sort by CPA to find your most efficient campaigns regardless of platform. A LinkedIn campaign at $50 CPL might outperform Google at $15 CPL if LinkedIn leads close at 5x the rate.
Key metrics visualized
- Visibility: impressions, impression share, reach
- Engagement: clicks, CTR, CPC, quality score
- Conversion: conversions, CPA, ROAS, conversion value
- Set up period-over-period comparisons to track trends, not just totals
- Segment by audience or campaign to find what drives the best results
- Focus on conversion metrics first — visibility and engagement only matter if they lead to outcomes
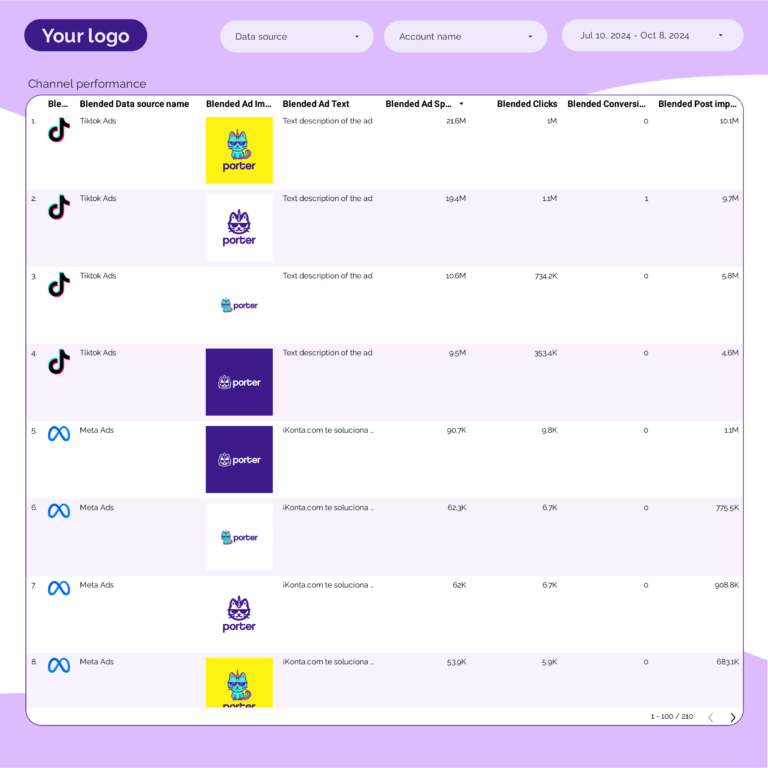
PPC Creative Performance Dashboard Template
Creative analysis by format: which ad types (image, video, carousel, text) drive the highest CTR (attention), lowest CPC (cost of attention), and best ROAS (business value) — compared across platforms. Informs whether to invest in video production for TikTok or static images for Google Display.
Key metrics visualized
- Visibility: impressions, impression share, reach
- Engagement: clicks, CTR, CPC, quality score
- Conversion: conversions, CPA, ROAS, conversion value
- Set up period-over-period comparisons to track trends, not just totals
- Segment by audience or campaign to find what drives the best results
- Focus on conversion metrics first — visibility and engagement only matter if they lead to outcomes
PPC Funnel Dashboard Template
Paid media funnel from impression to sale: impressions → clicks → landing page → conversion. Compares funnel shape by platform. If Meta drives 3x the clicks but half the landing page conversion rate, the issue isn’t Meta’s targeting — it’s your landing page experience for social traffic.
Key metrics visualized
- Visibility: impressions, impression share, reach
- Engagement: clicks, CTR, CPC, quality score
- Conversion: conversions, CPA, ROAS, conversion value
- Set up period-over-period comparisons to track trends, not just totals
- Segment by audience or campaign to find what drives the best results
- Focus on conversion metrics first — visibility and engagement only matter if they lead to outcomes
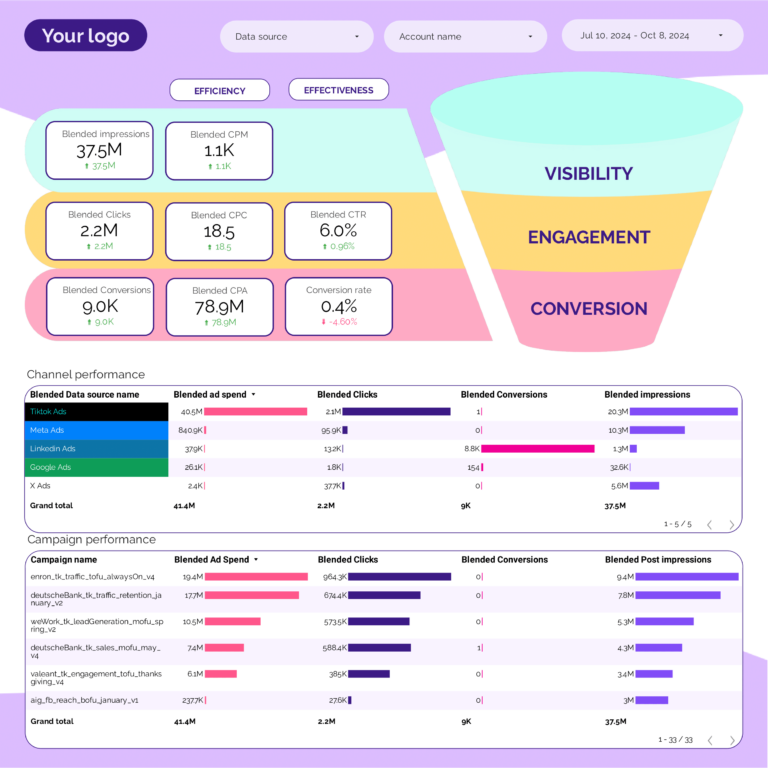
PPC KPIs Dashboard Template
PPC scorecard with targets: spend vs budget, ROAS vs goal, CPA vs benchmark, conversions vs target. Green/yellow/red indicators answer ‘are we on track?’ in 10 seconds. For monthly client presentations where decision-makers want outcomes, not platform-level details.
Key metrics visualized
- Visibility: impressions, impression share, reach
- Engagement: clicks, CTR, CPC, quality score
- Conversion: conversions, CPA, ROAS, conversion value
- Set up period-over-period comparisons to track trends, not just totals
- Segment by audience or campaign to find what drives the best results
- Focus on conversion metrics first — visibility and engagement only matter if they lead to outcomes
PPC Budget Tracking Dashboard Template
Budget pacing with funnel context: cumulative spend vs monthly budget (input tracking), projected month-end spend (forecast), and CPA trend by day (conversion efficiency). Shows not just whether you’ll hit budget, but whether the spend is producing results at an acceptable cost per conversion.
PPC Monthly Dashboard Template
Monthly summary report: top-line KPIs with month-over-month change, best and worst campaigns by ROAS, and channel-level spend breakdown. Designed to export as PDF for client delivery. Shows not just what happened, but whether it was better or worse than last month and why.
Google Ads Dashboard Template
Google Ads funnel within your PPC stack: keyword impressions and impression share (search visibility), clicks, CTR and quality score (engagement and relevance), conversions and CPA (outcomes). Shows the search-intent funnel that only Google provides — what people typed and what happened after.
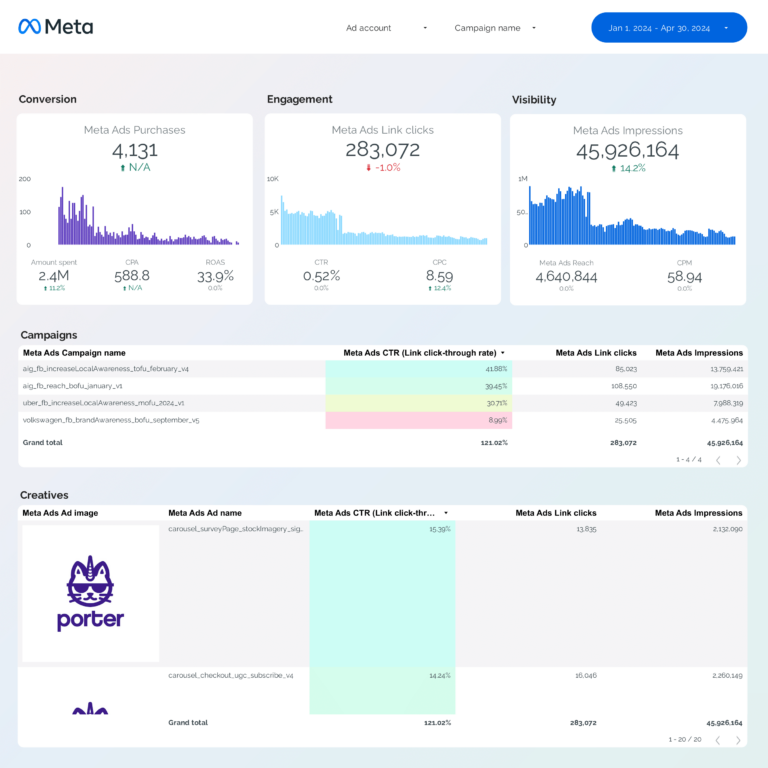
Meta/Facebook Ads Dashboard Template
Meta Ads within your PPC stack: ad set performance, audience demographics, placement breakdown, and frequency monitoring. Tracks creative fatigue — when frequency rises but CTR drops, your audience has seen the ad too many times. The signal to rotate creative before CPA climbs.
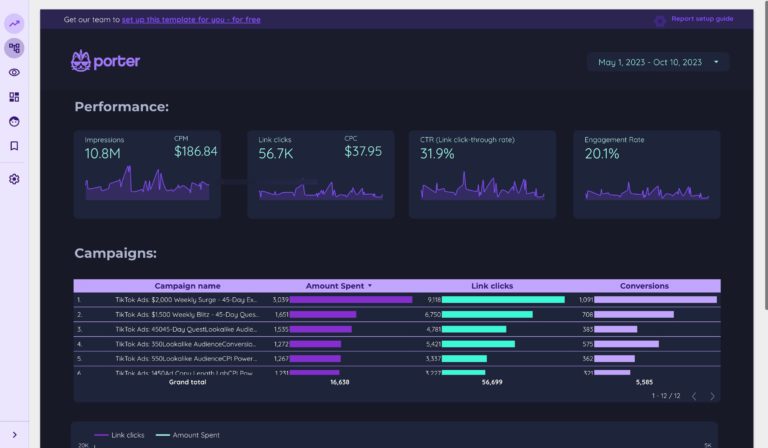
TikTok Ads Dashboard Template 
TikTok Ads metrics in your PPC dashboard: impressions, video view rate (did they watch?), clicks and CTR (did they engage?), conversions and CPC (did they act?). Compare in-feed vs spark ads vs top view to find which TikTok format delivers the best cost-per-conversion for your audience.
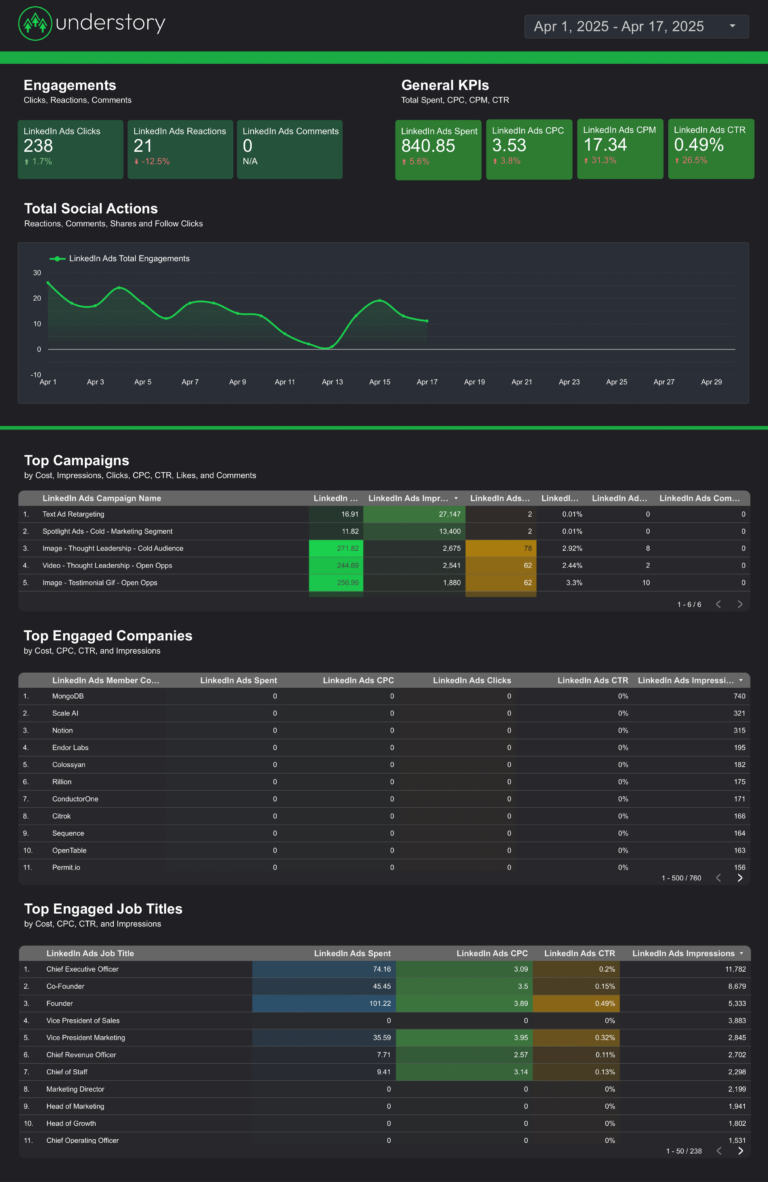
LinkedIn Ads Dashboard Template
LinkedIn Ads for B2B: impressions by company size and job title (are you reaching decision-makers?), clicks and CTR by audience segment (are they interested?), leads and CPL (are they converting?). CPCs are 3-5x higher than other platforms — this template shows whether the lead quality justifies it.
How to Use a Template
- Choose a template from the list above or browse all 110+ templates
- Click "Get this template" to open the template page
- Copy the template to your own Data Studio account
- Connect your data source — Google-native sources connect directly; others connect through Porter Metrics connectors
- Customize — add your logo, change colors, adjust date ranges
What Should a PPC Dashboard Include?
The most effective ppc dashboards are organized around three layers of the marketing funnel, with context and segmentation to make the data actionable:
1. Visibility metrics (is your audience seeing your content?)
Start with top-of-funnel metrics that tell you whether your ppc efforts are generating reach: impressions, impression share, reach. These are the leading indicators that show if your campaigns are getting in front of the right audience.
2. Engagement metrics (are they interacting?)
Once your audience sees your content, are they responding? Track clicks, CTR, CPC, quality score. The gap between visibility and engagement reveals whether your messaging, creative, or targeting needs adjustment.
3. Conversion metrics (are they taking action?)
The bottom line: conversions, CPA, ROAS, conversion value. A dashboard without conversion data is just a vanity report. Connect engagement to business outcomes to prove ROI and justify budget.
4. Add context to every metric
Raw numbers mean nothing without comparison. Include period-over-period trends, efficiency rates (CTR, conversion rate, CPA), and progress against goals. This turns data into decisions.
5. Segment to find insights
Aggregate data hides opportunities. Segment by campaign, audience, content type, device, and time period to find what actually drives results.
PPC Dashboard Best Practices
- Match the dashboard to the audience. A media buyer needs granular campaign data. A CMO needs a high-level summary. Build the right view for the reader.
- Use period-over-period comparisons, not just totals. “5,000 clicks” is meaningless. “5,000 clicks, up 18% month over month” tells a story.
- Include conversion data, not just engagement. Impressions and clicks are leading indicators. Revenue, leads, and ROAS are what the business cares about.
- Automate the data refresh. Manual exports kill consistency. Use Data Studio with native connectors so the dashboard updates every time you open it.
- Set goals with pacing indicators. The first question stakeholders ask is “are we on track?” Add progress bars or target lines for top KPIs.
- Segment by campaign and audience. Site-wide or account-wide averages hide your best and worst performers. Always include a breakdown table.
- Keep it focused. A dashboard with 50 charts is a data dump, not a dashboard. Aim for 5–8 key visualizations per view.
Frequently Asked Questions
What is a PPC report?
A PPC report tracks paid advertising performance across platforms like Google Ads, Meta Ads, TikTok Ads, and LinkedIn Ads. It shows spend, impressions, clicks, conversions, CPC, CPA, ROAS, and campaign-level breakdowns. Automated PPC reports in Data Studio refresh daily without manual data exports.
Can I compare ROAS across different ad platforms?
Yes. Porter Metrics automatically blends spend and conversion data across Google Ads, Meta Ads, TikTok, and LinkedIn into unified metrics. You see total ROAS and per-channel ROAS side by side in the PPC Multi-channel template, without spreadsheet formulas.
How is spend unified across channels in a PPC dashboard?
Porter Metrics uses automatic data blending to combine spend, impressions, clicks, and conversions from all connected ad platforms. The data is normalized by date and campaign, so you get accurate cross-channel totals without manual joins or SQL.
Do I need a connector for Google Ads on Data Studio?
No. Google Ads is a native Data Studio data source and connects directly for free. You only need a connector for Meta Ads, TikTok Ads, LinkedIn Ads, and other non-Google ad platforms.
Can I use PPC templates for client reporting?
Yes. All templates are white-label ready — add your agency logo, client branding, and custom colors. You can schedule automated PDF email delivery or share a live dashboard link with view-only access for clients.
What metrics should I track in a ppc dashboard?
Organize metrics in three layers. Visibility: impressions, impression share, reach. Engagement: clicks, CTR, CPC, quality score. Conversion: conversions, CPA, ROAS, conversion value. Add context with period-over-period comparisons and segment by campaign, audience, or content type to find actionable insights.
How often should I check my ppc dashboard?
For operational monitoring, check daily or every few days. For performance management and client reporting, weekly or monthly. The right cadence depends on your role: media buyers need daily data, account managers need weekly summaries, executives need monthly overviews.
Can I white-label these templates for my clients?
Yes. Every Data Studio template is fully customizable. Add your logo, change colors, adjust date ranges, and remove Porter Metrics branding. Share via live link (always updated) or scheduled PDF export for professional, branded reporting.
Do I need a connector to use these templates?
It depends on the data source. Google-native sources (Google Ads, GA4, Search Console) connect directly to Data Studio for free. For non-Google sources (Facebook, Instagram, Shopify, HubSpot, LinkedIn, etc.), you need a connector like Porter Metrics to bridge the data.
Is there a free PPC report template?
Yes. Every template on this page is a free PPC report template for Data Studio. They cover Google Ads, Facebook Ads, LinkedIn Ads, and TikTok Ads with pre-built KPI cards, trend charts, and campaign breakdowns. Unlike a paid marketing dashboard template, these are free to copy and fully customizable. Export to PDF for client-ready marketing dashboard examples.
Start with a free template
Every template in this list is free, white-label ready, and takes under 5 minutes to set up. Choose the template that matches your use case, connect your data, and start reporting today.
Browse all 110+ templates →Other Dashboard Templates
Explore more free Data Studio templates by category: