

Browse 30 SEA Report Templates for Data Studio
Choose from our library of free, white-label sea templates. Each template tracks the full marketing funnel: visibility (impressions, reach), engagement (CTR, interactions), and conversion (leads, revenue). Organized following the SUMAS framework with breakdowns by channel, campaign, audience, and time period.
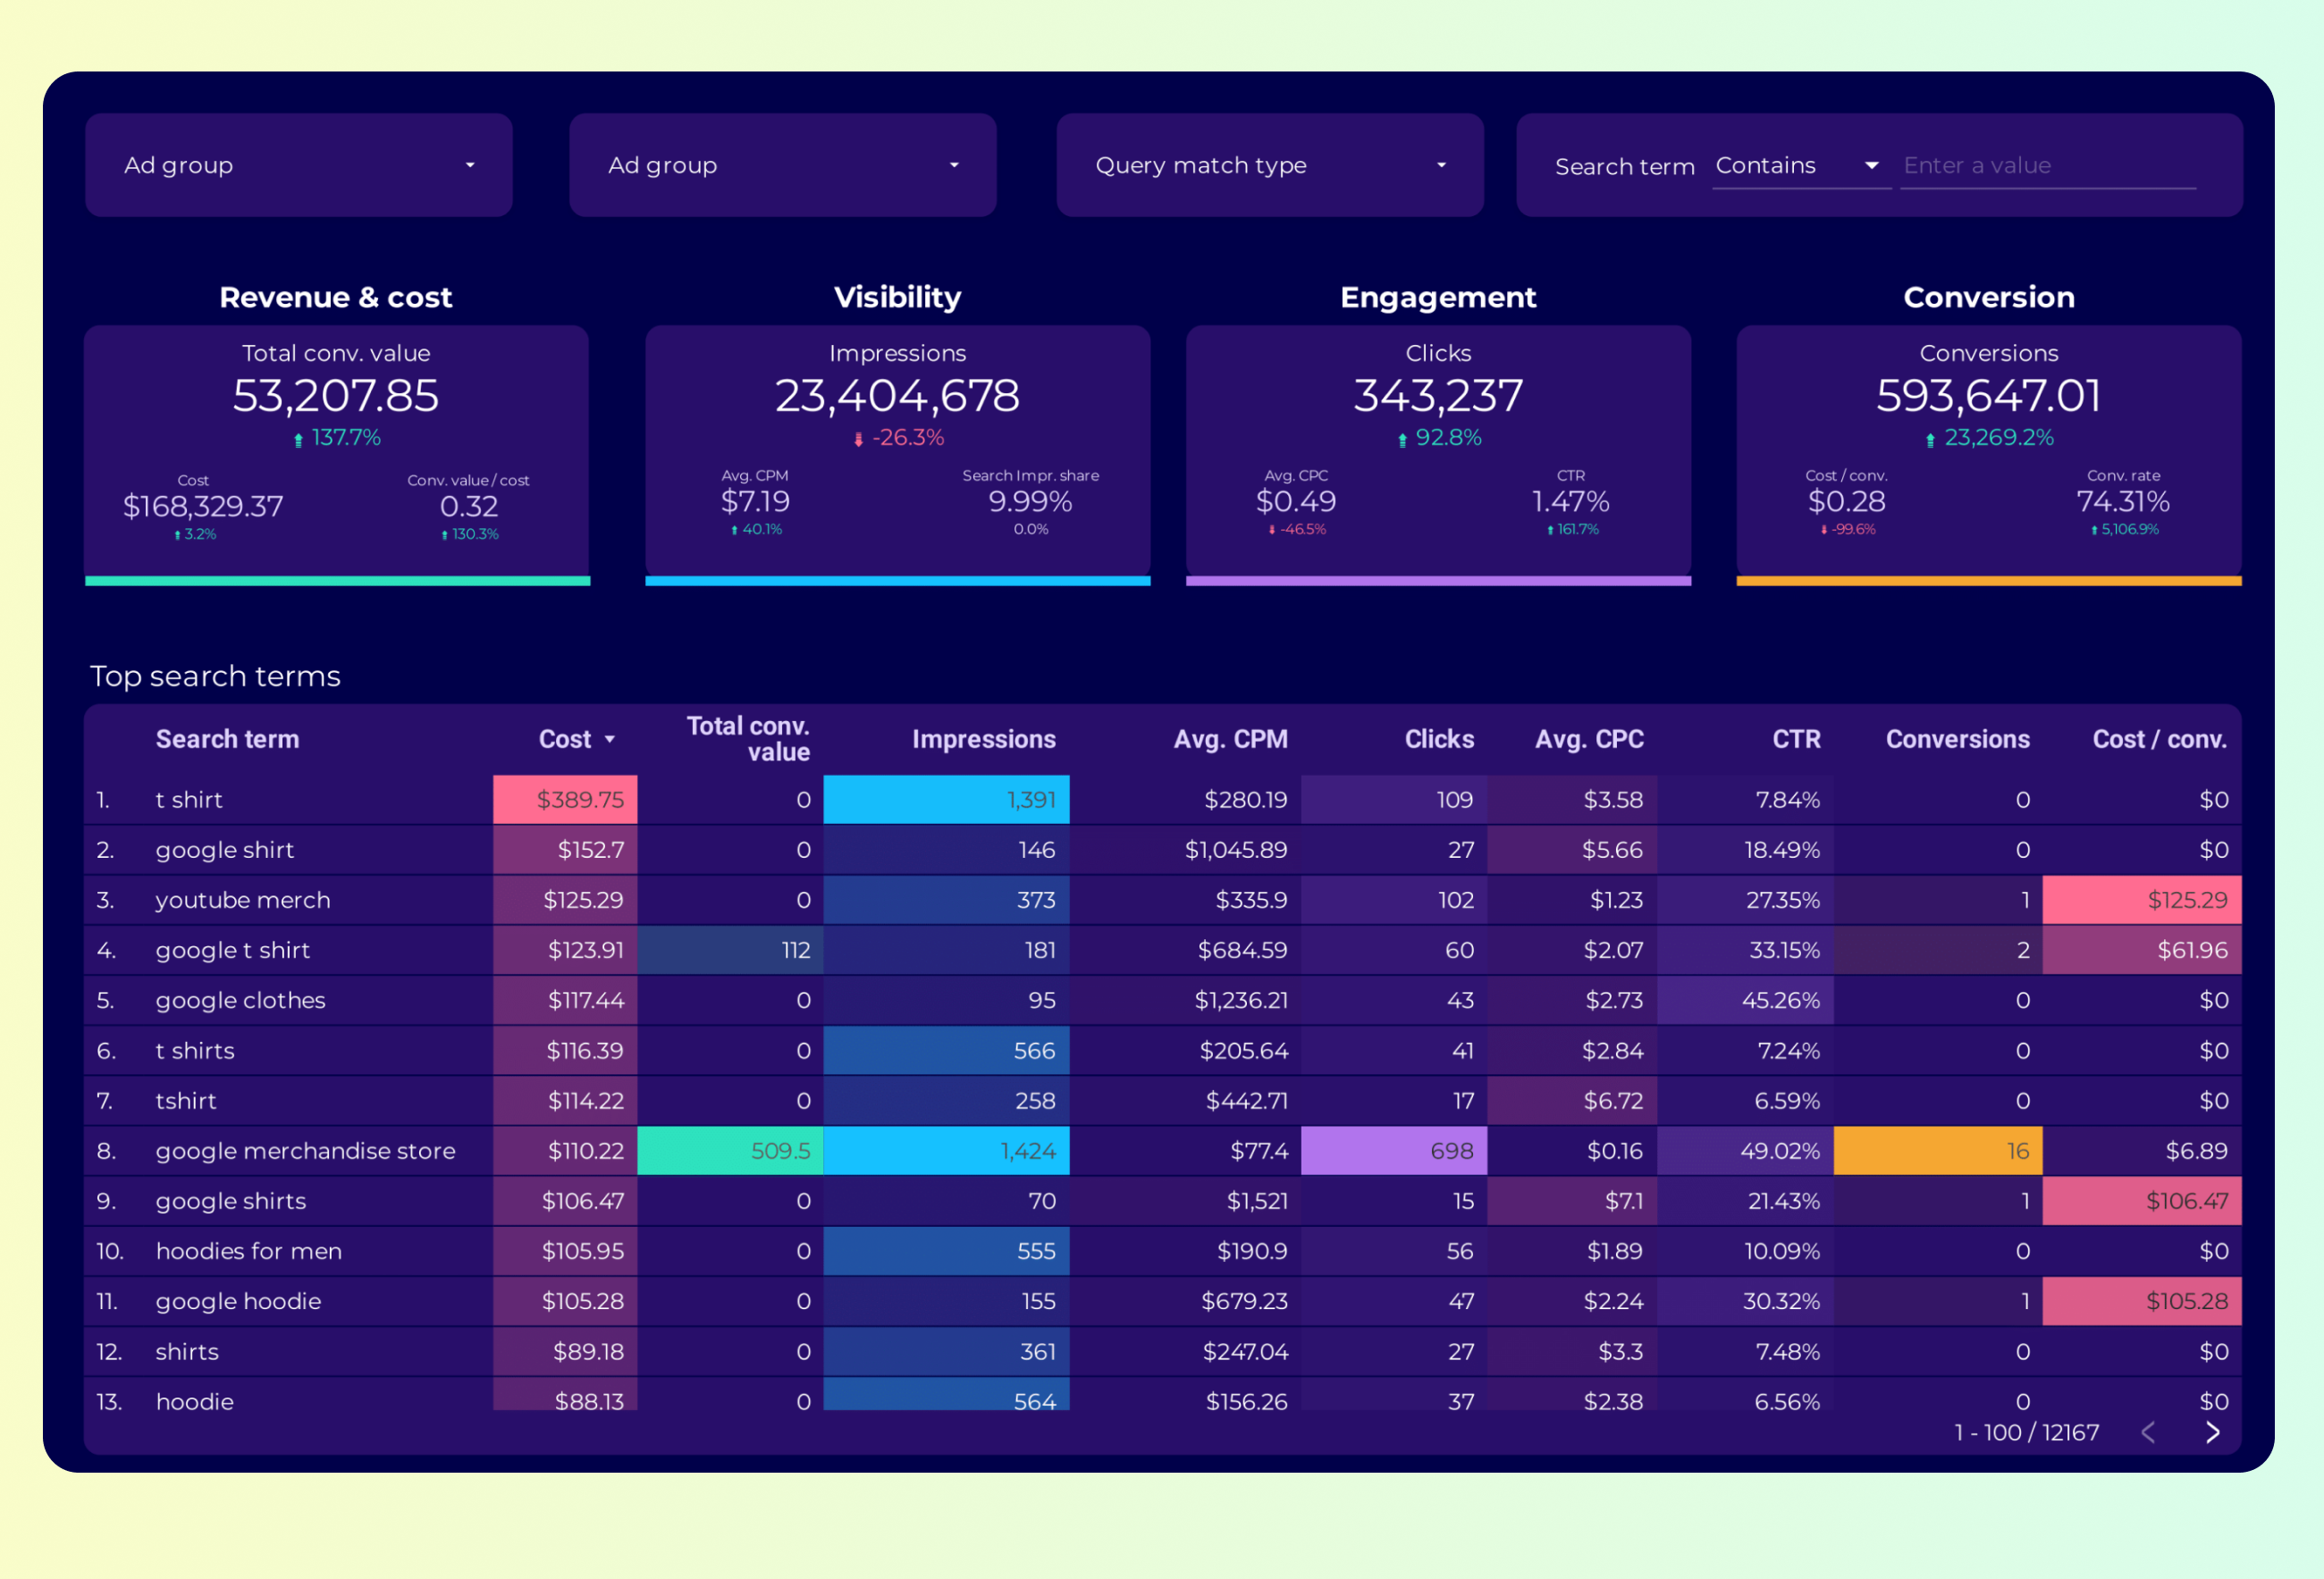
Google Ads Keyword analysis Report template for Data Studio by Porter
Track impression share, search volume → CTR by keyword, CPC trends → conversion rate, ROAS by keyword. Segment by keyword, match type.
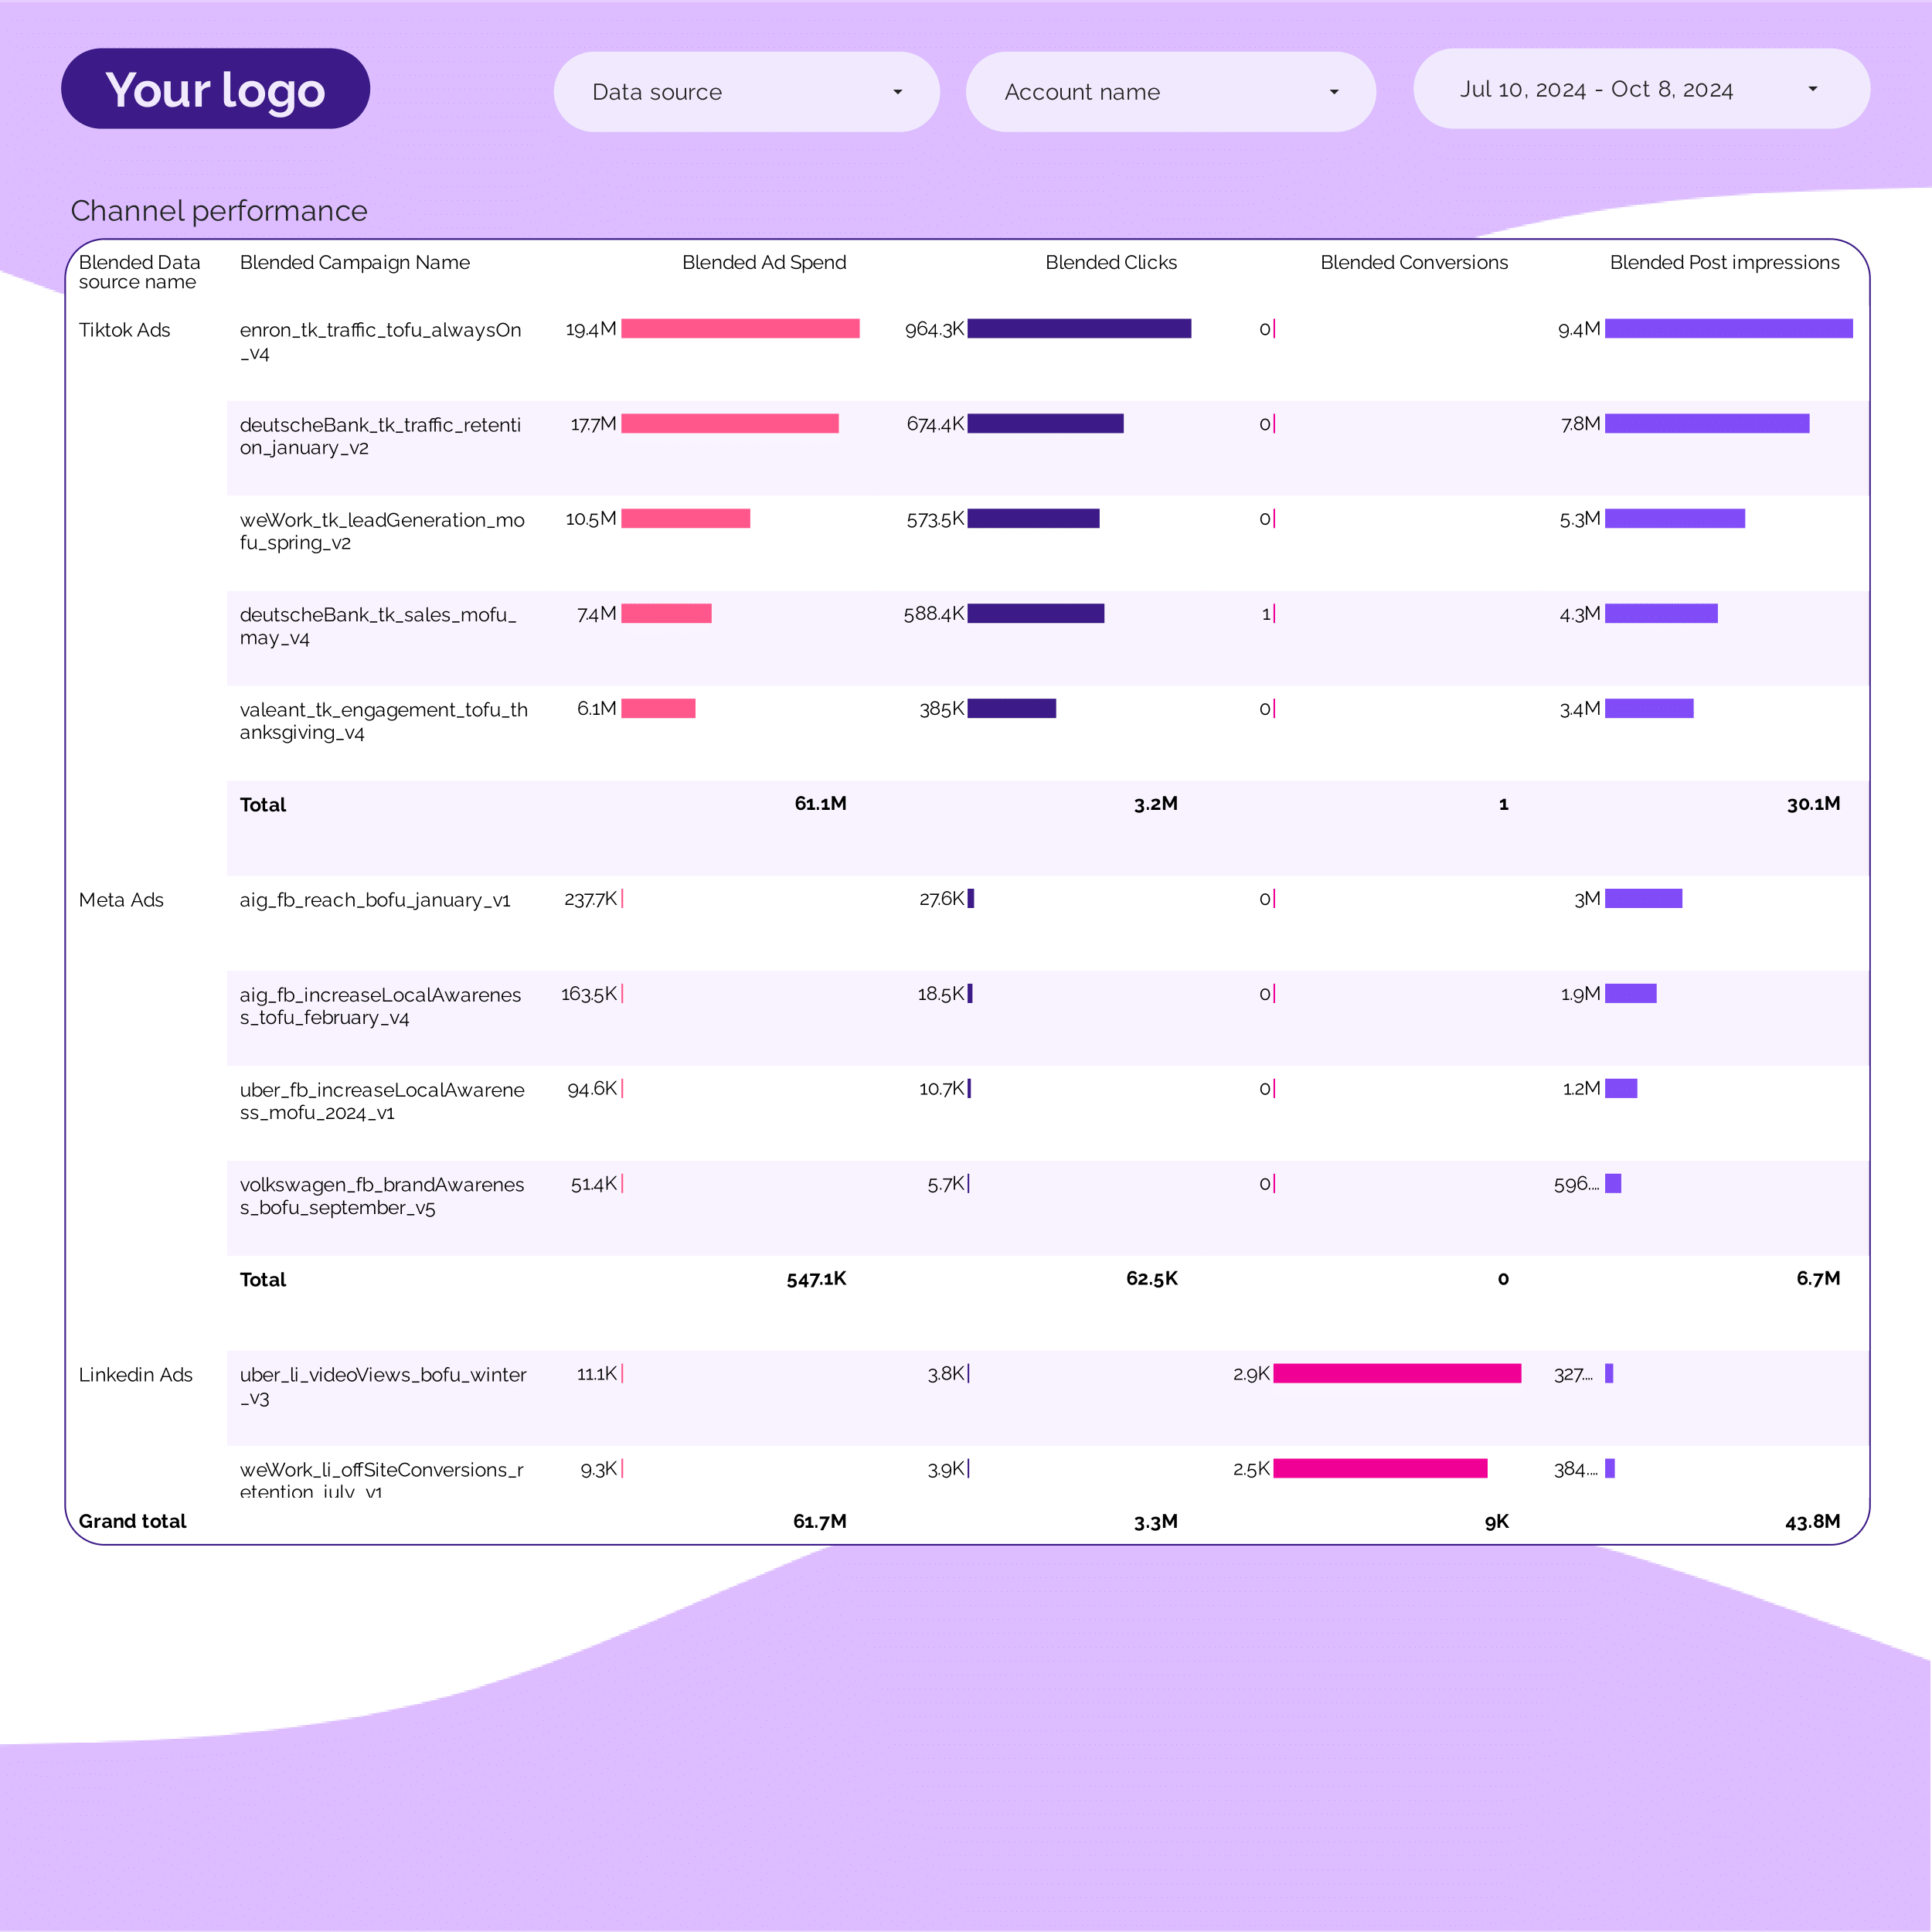
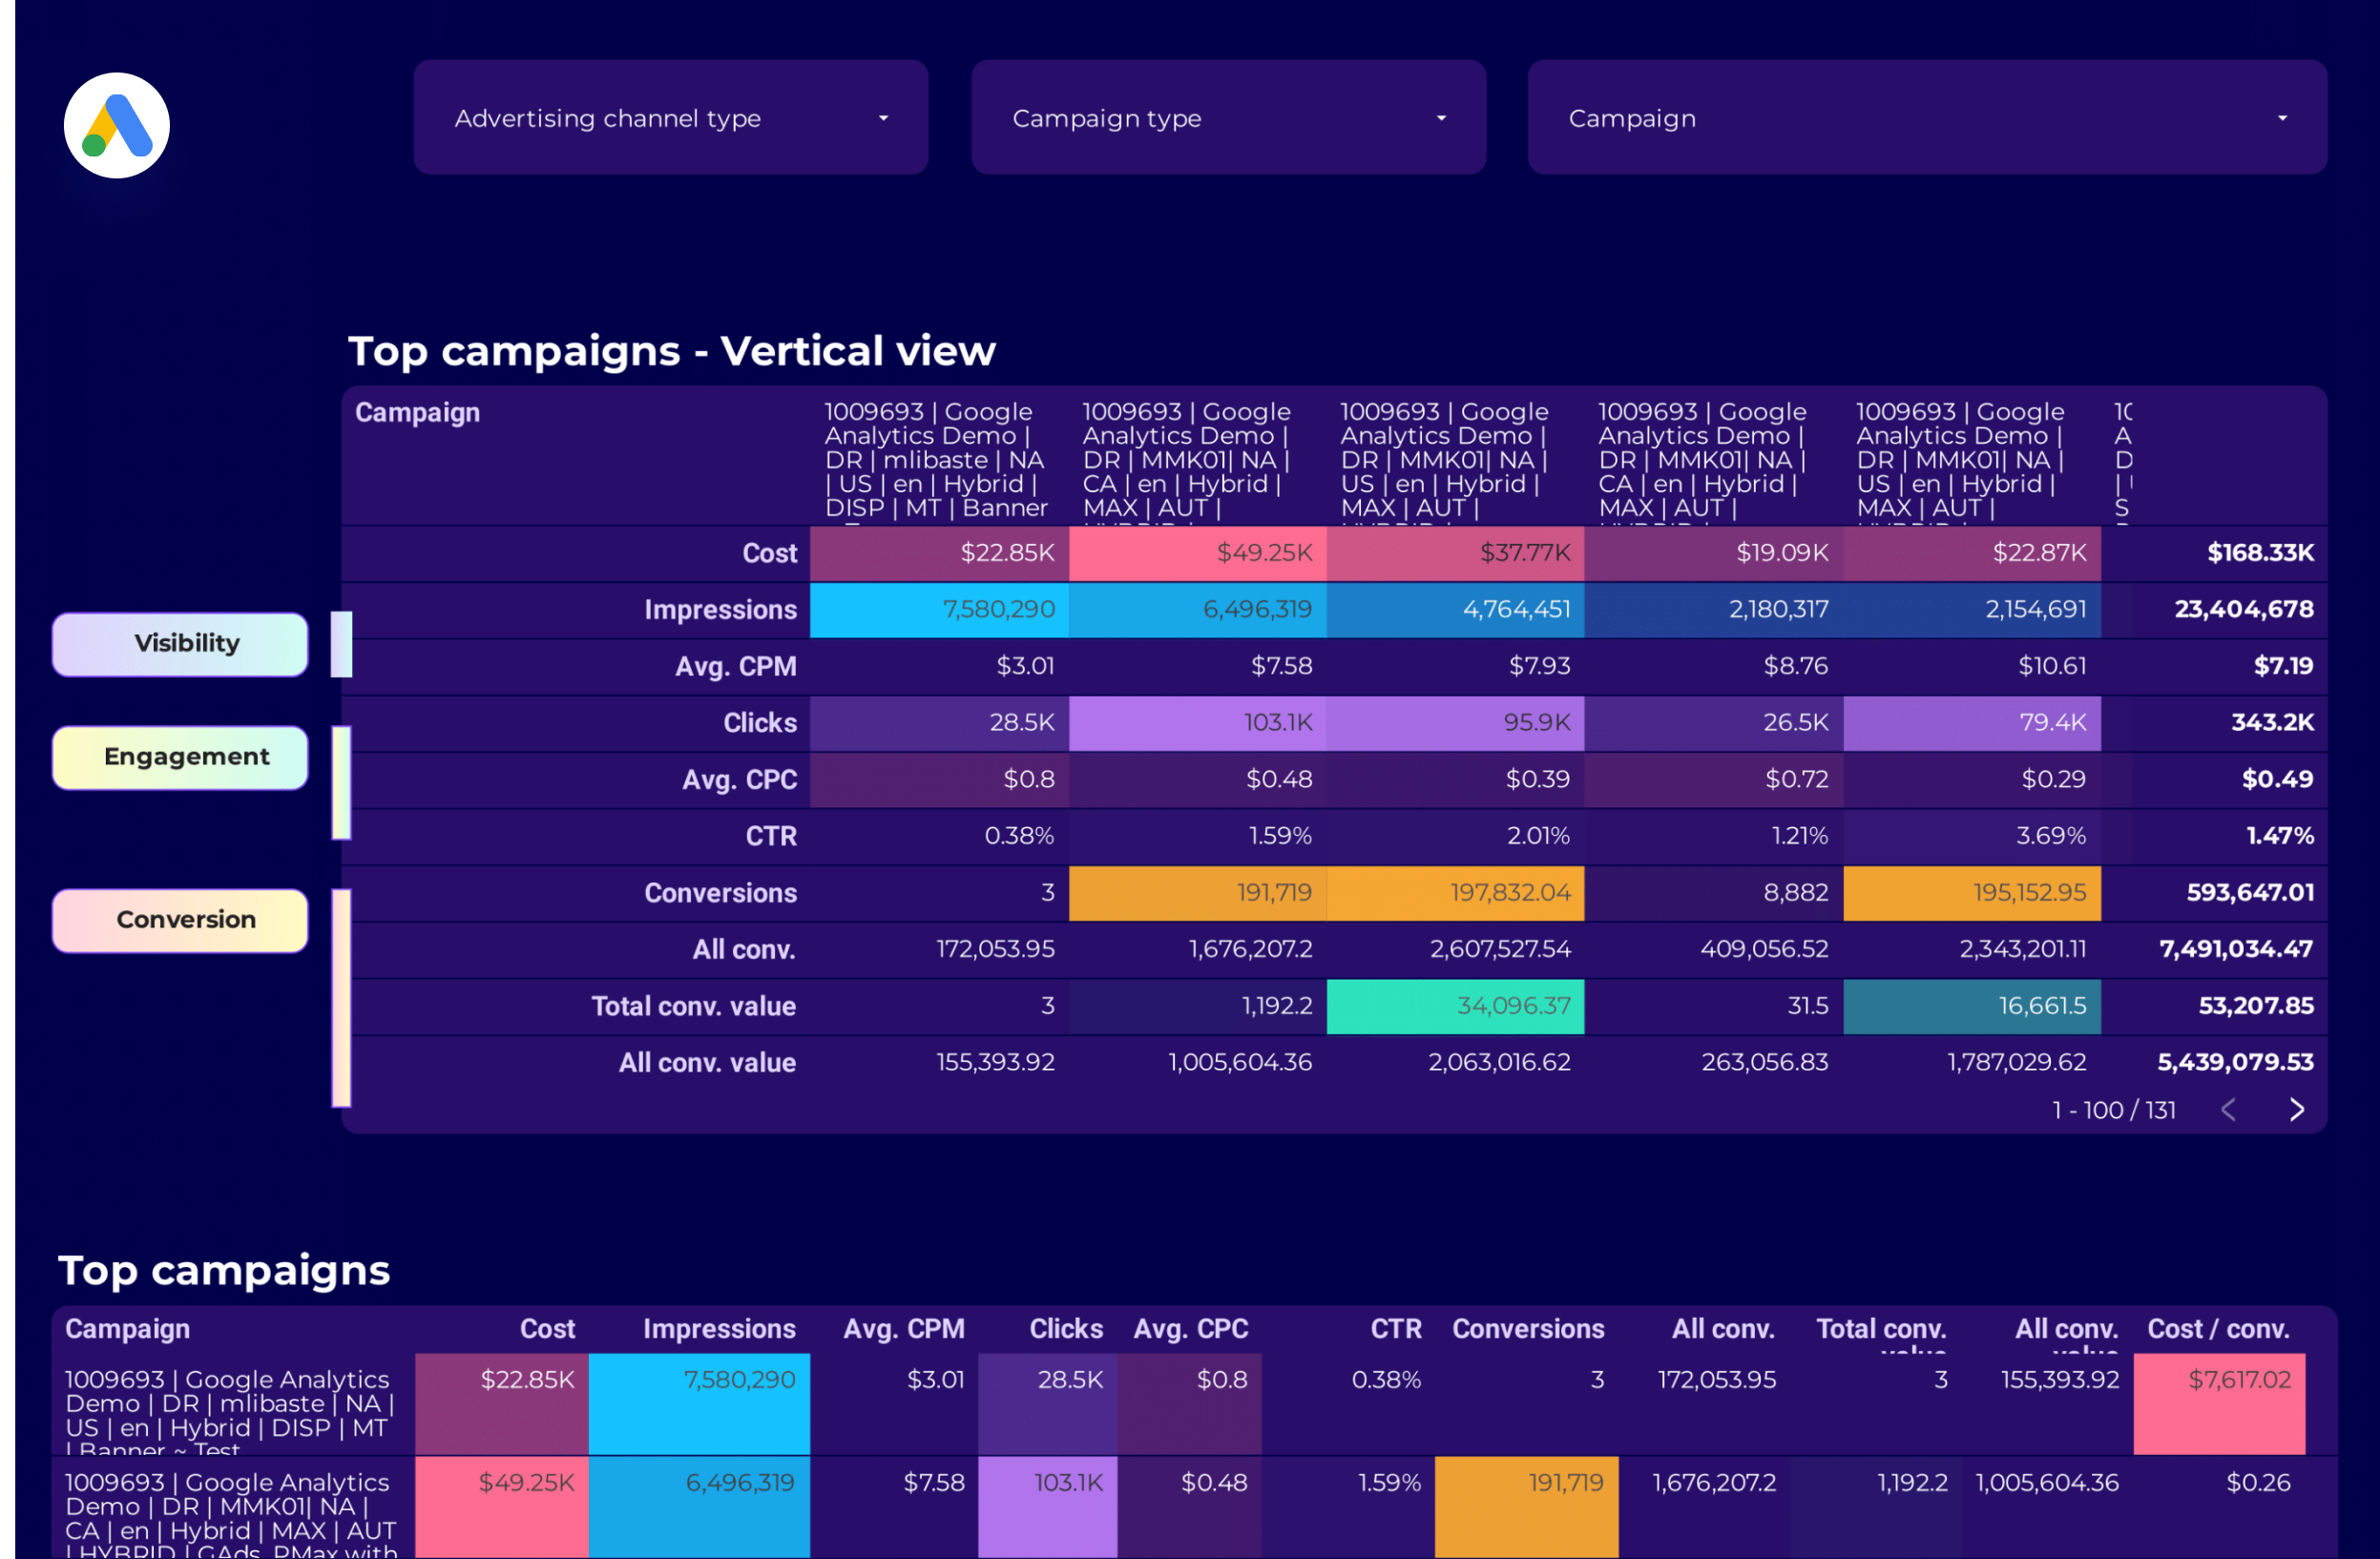
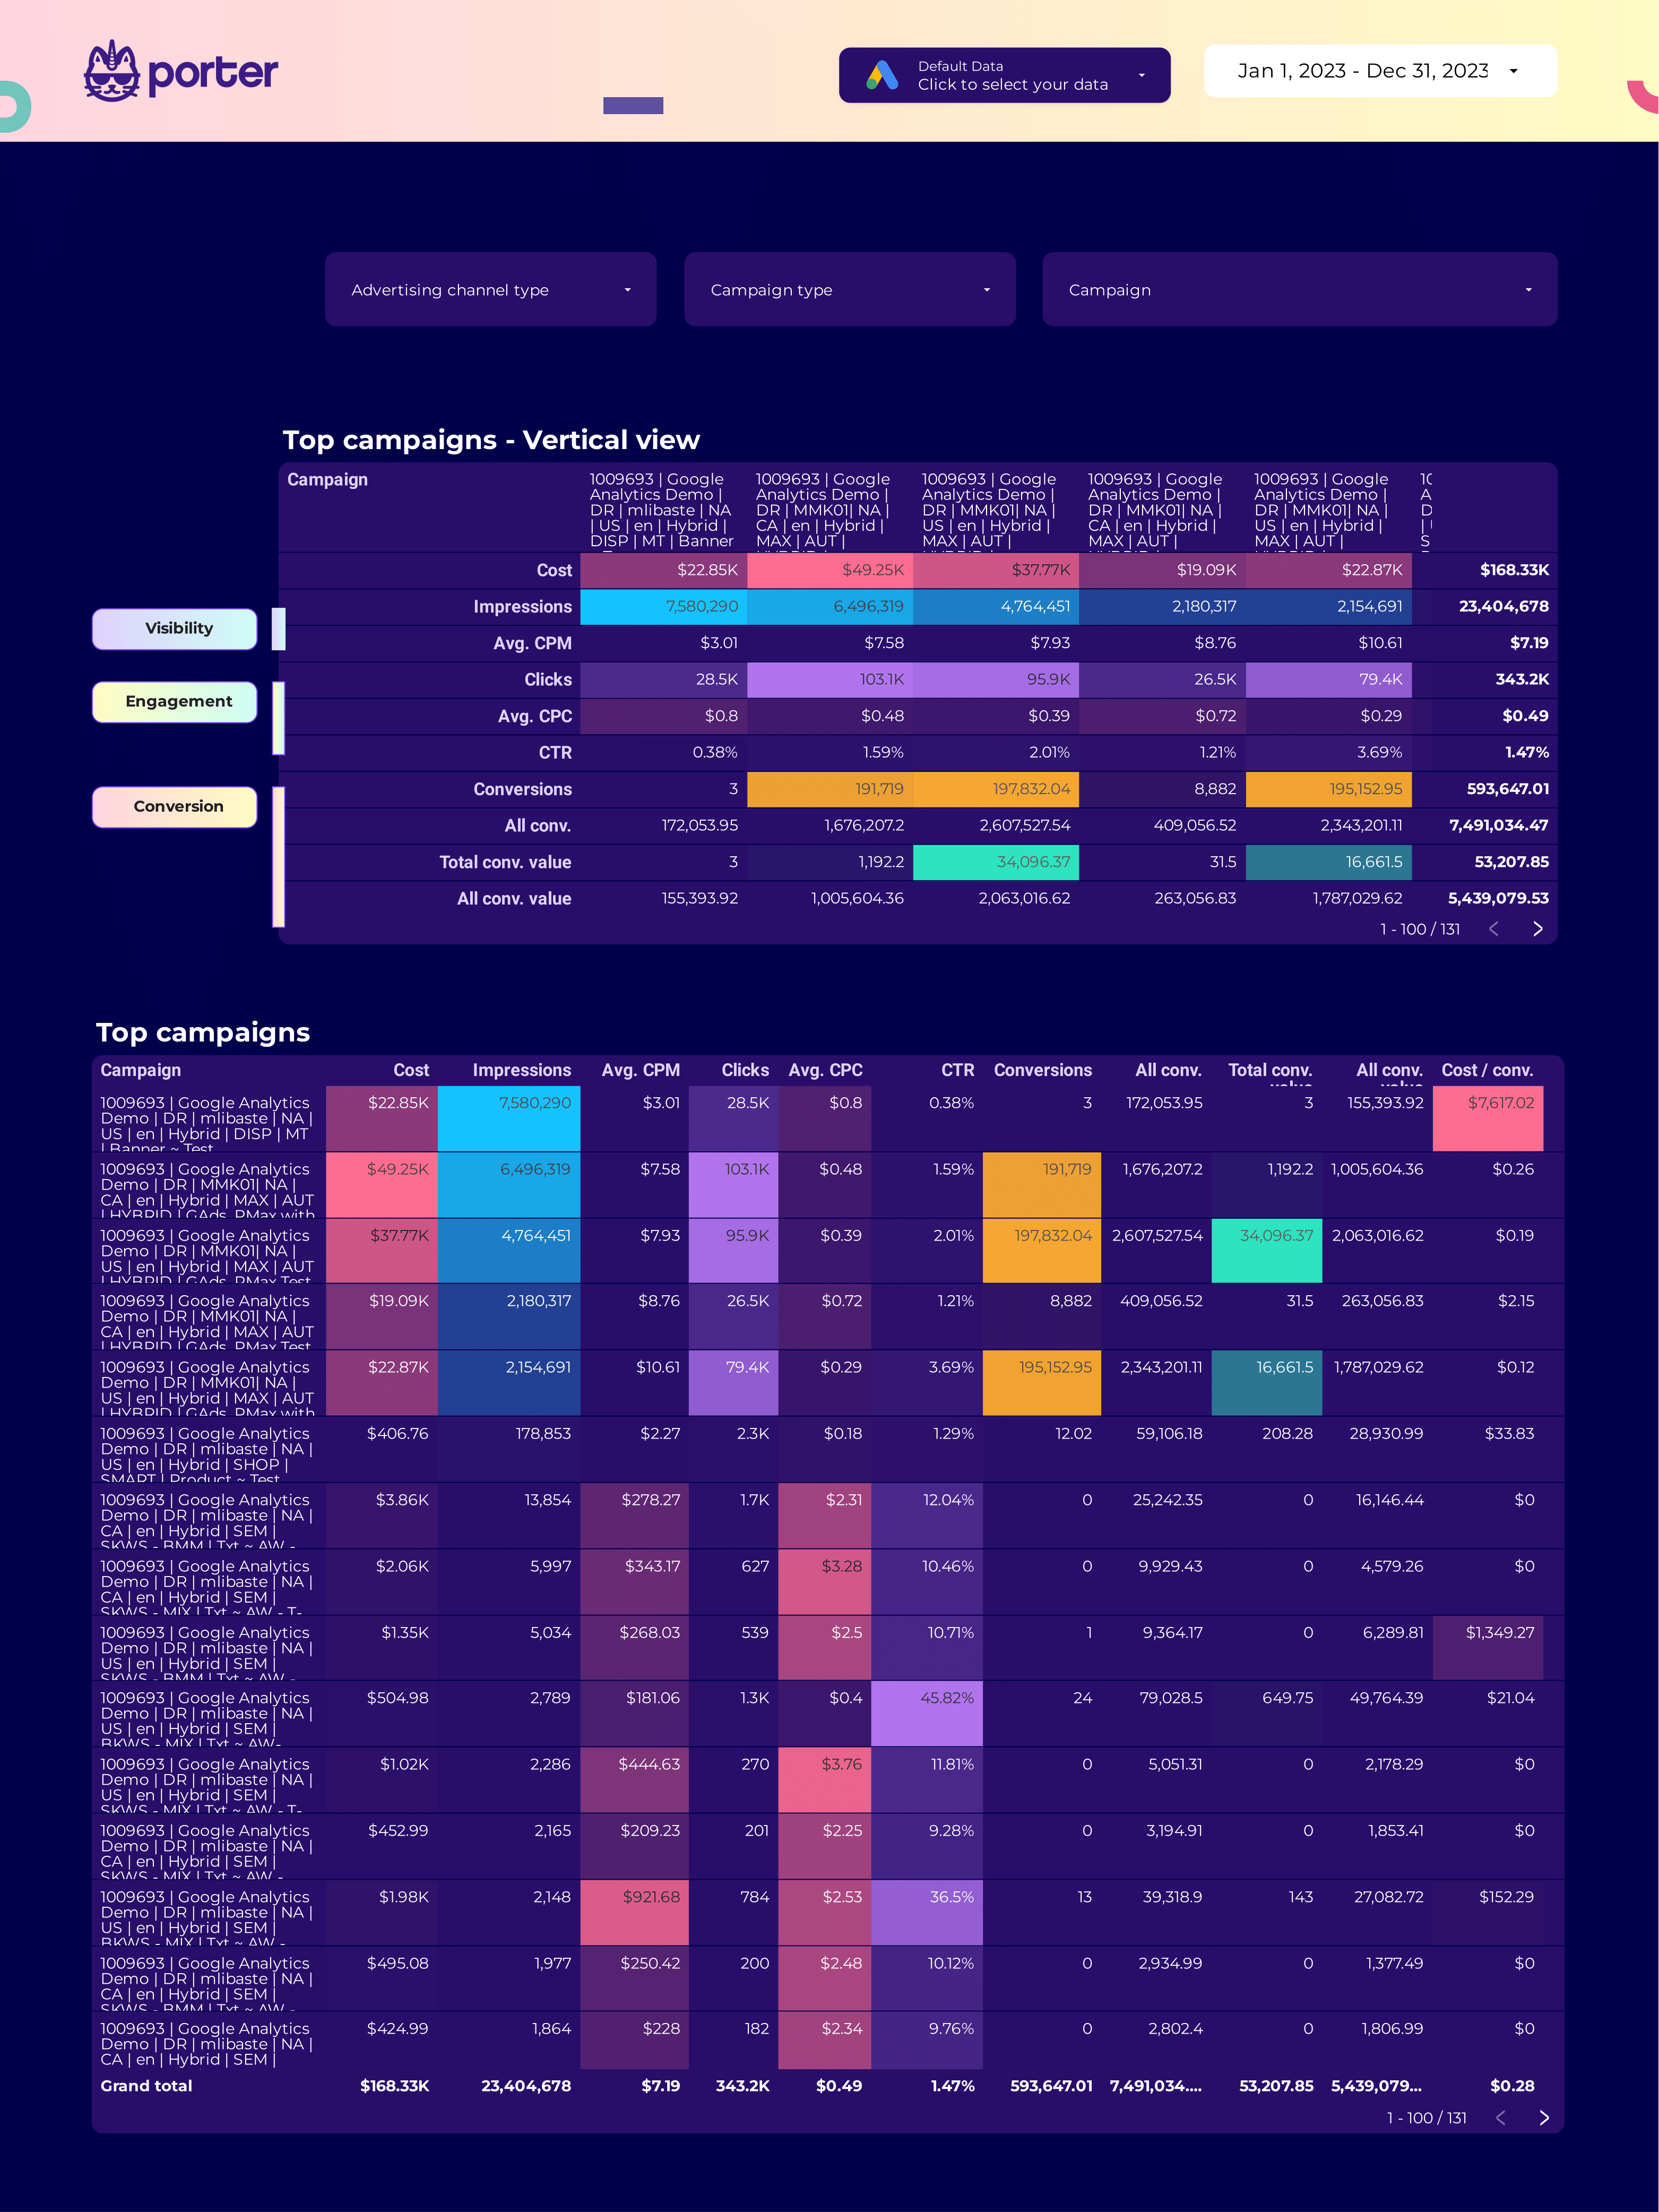
PPC Campaign performance Report template for Data Studio by Porter
Track campaign impressions, SOV → CTR, CPC per campaign → ROAS, conversions per campaign. Segment by campaign, ad group, date.
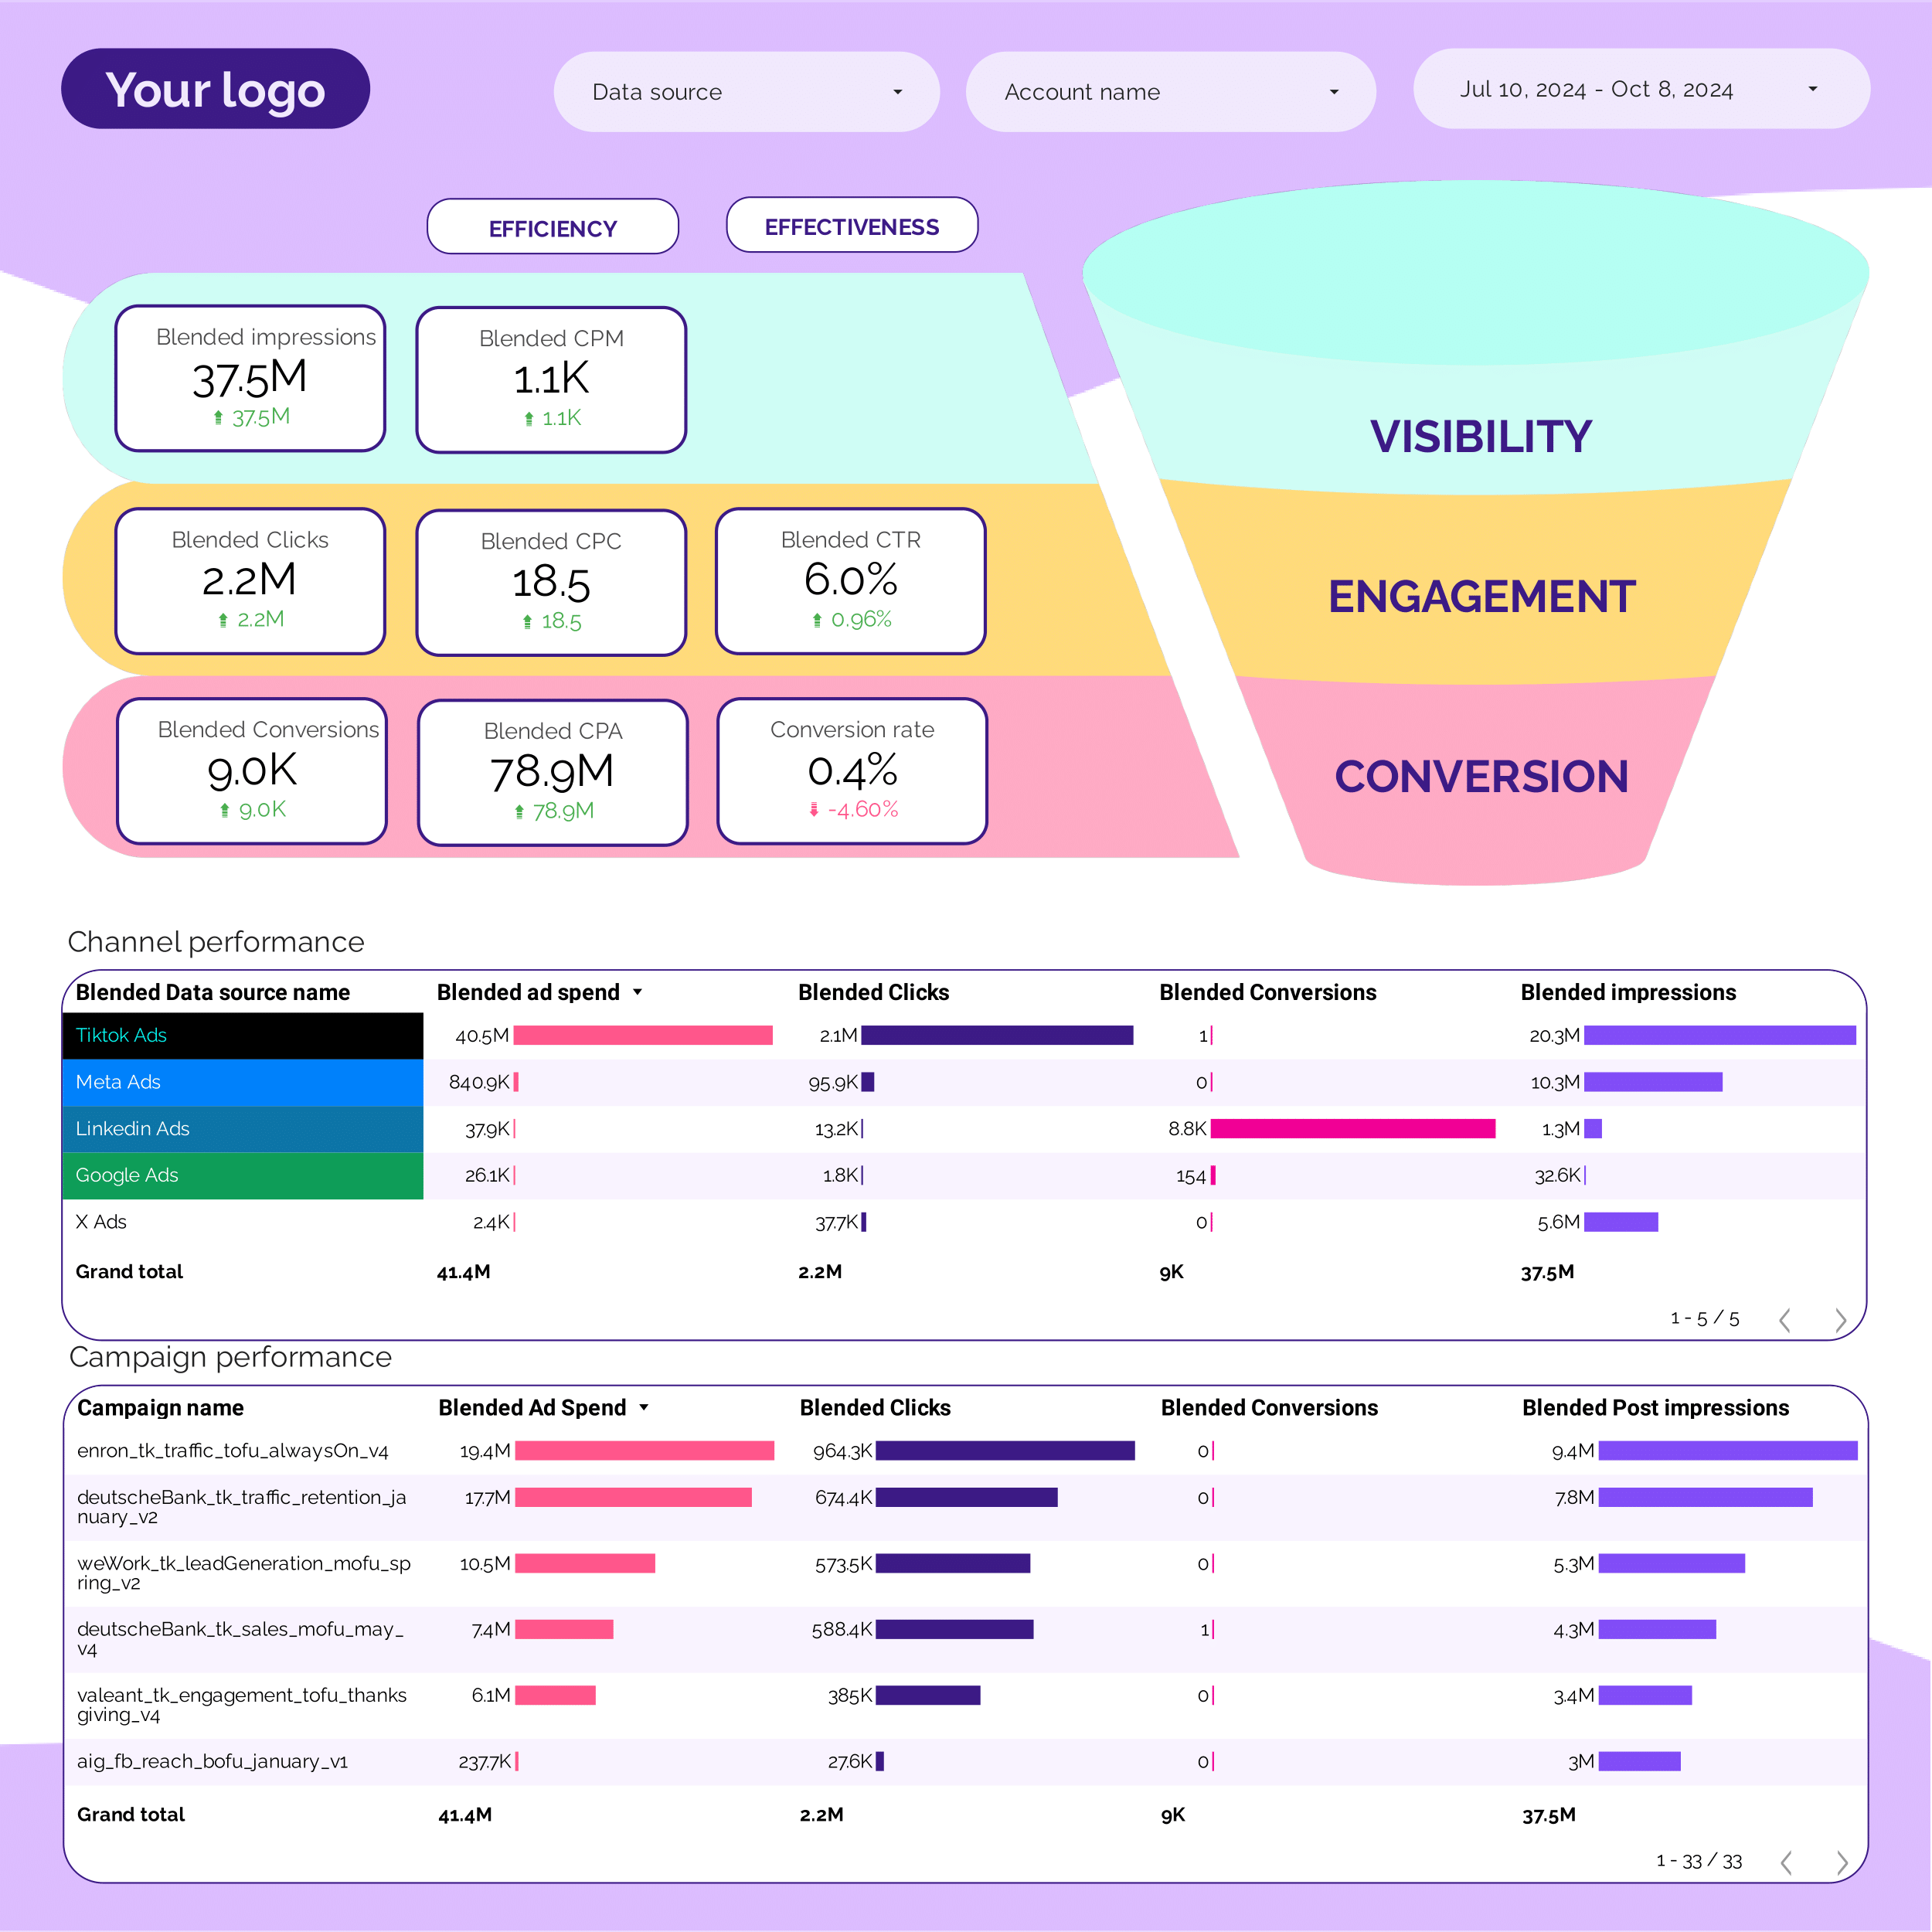
PPC Funnel Report template for Data Studio by Porter
Track top-funnel reach → mid-funnel engagement → bottom-funnel ROAS, CPA. Segment by funnel stage, campaign.
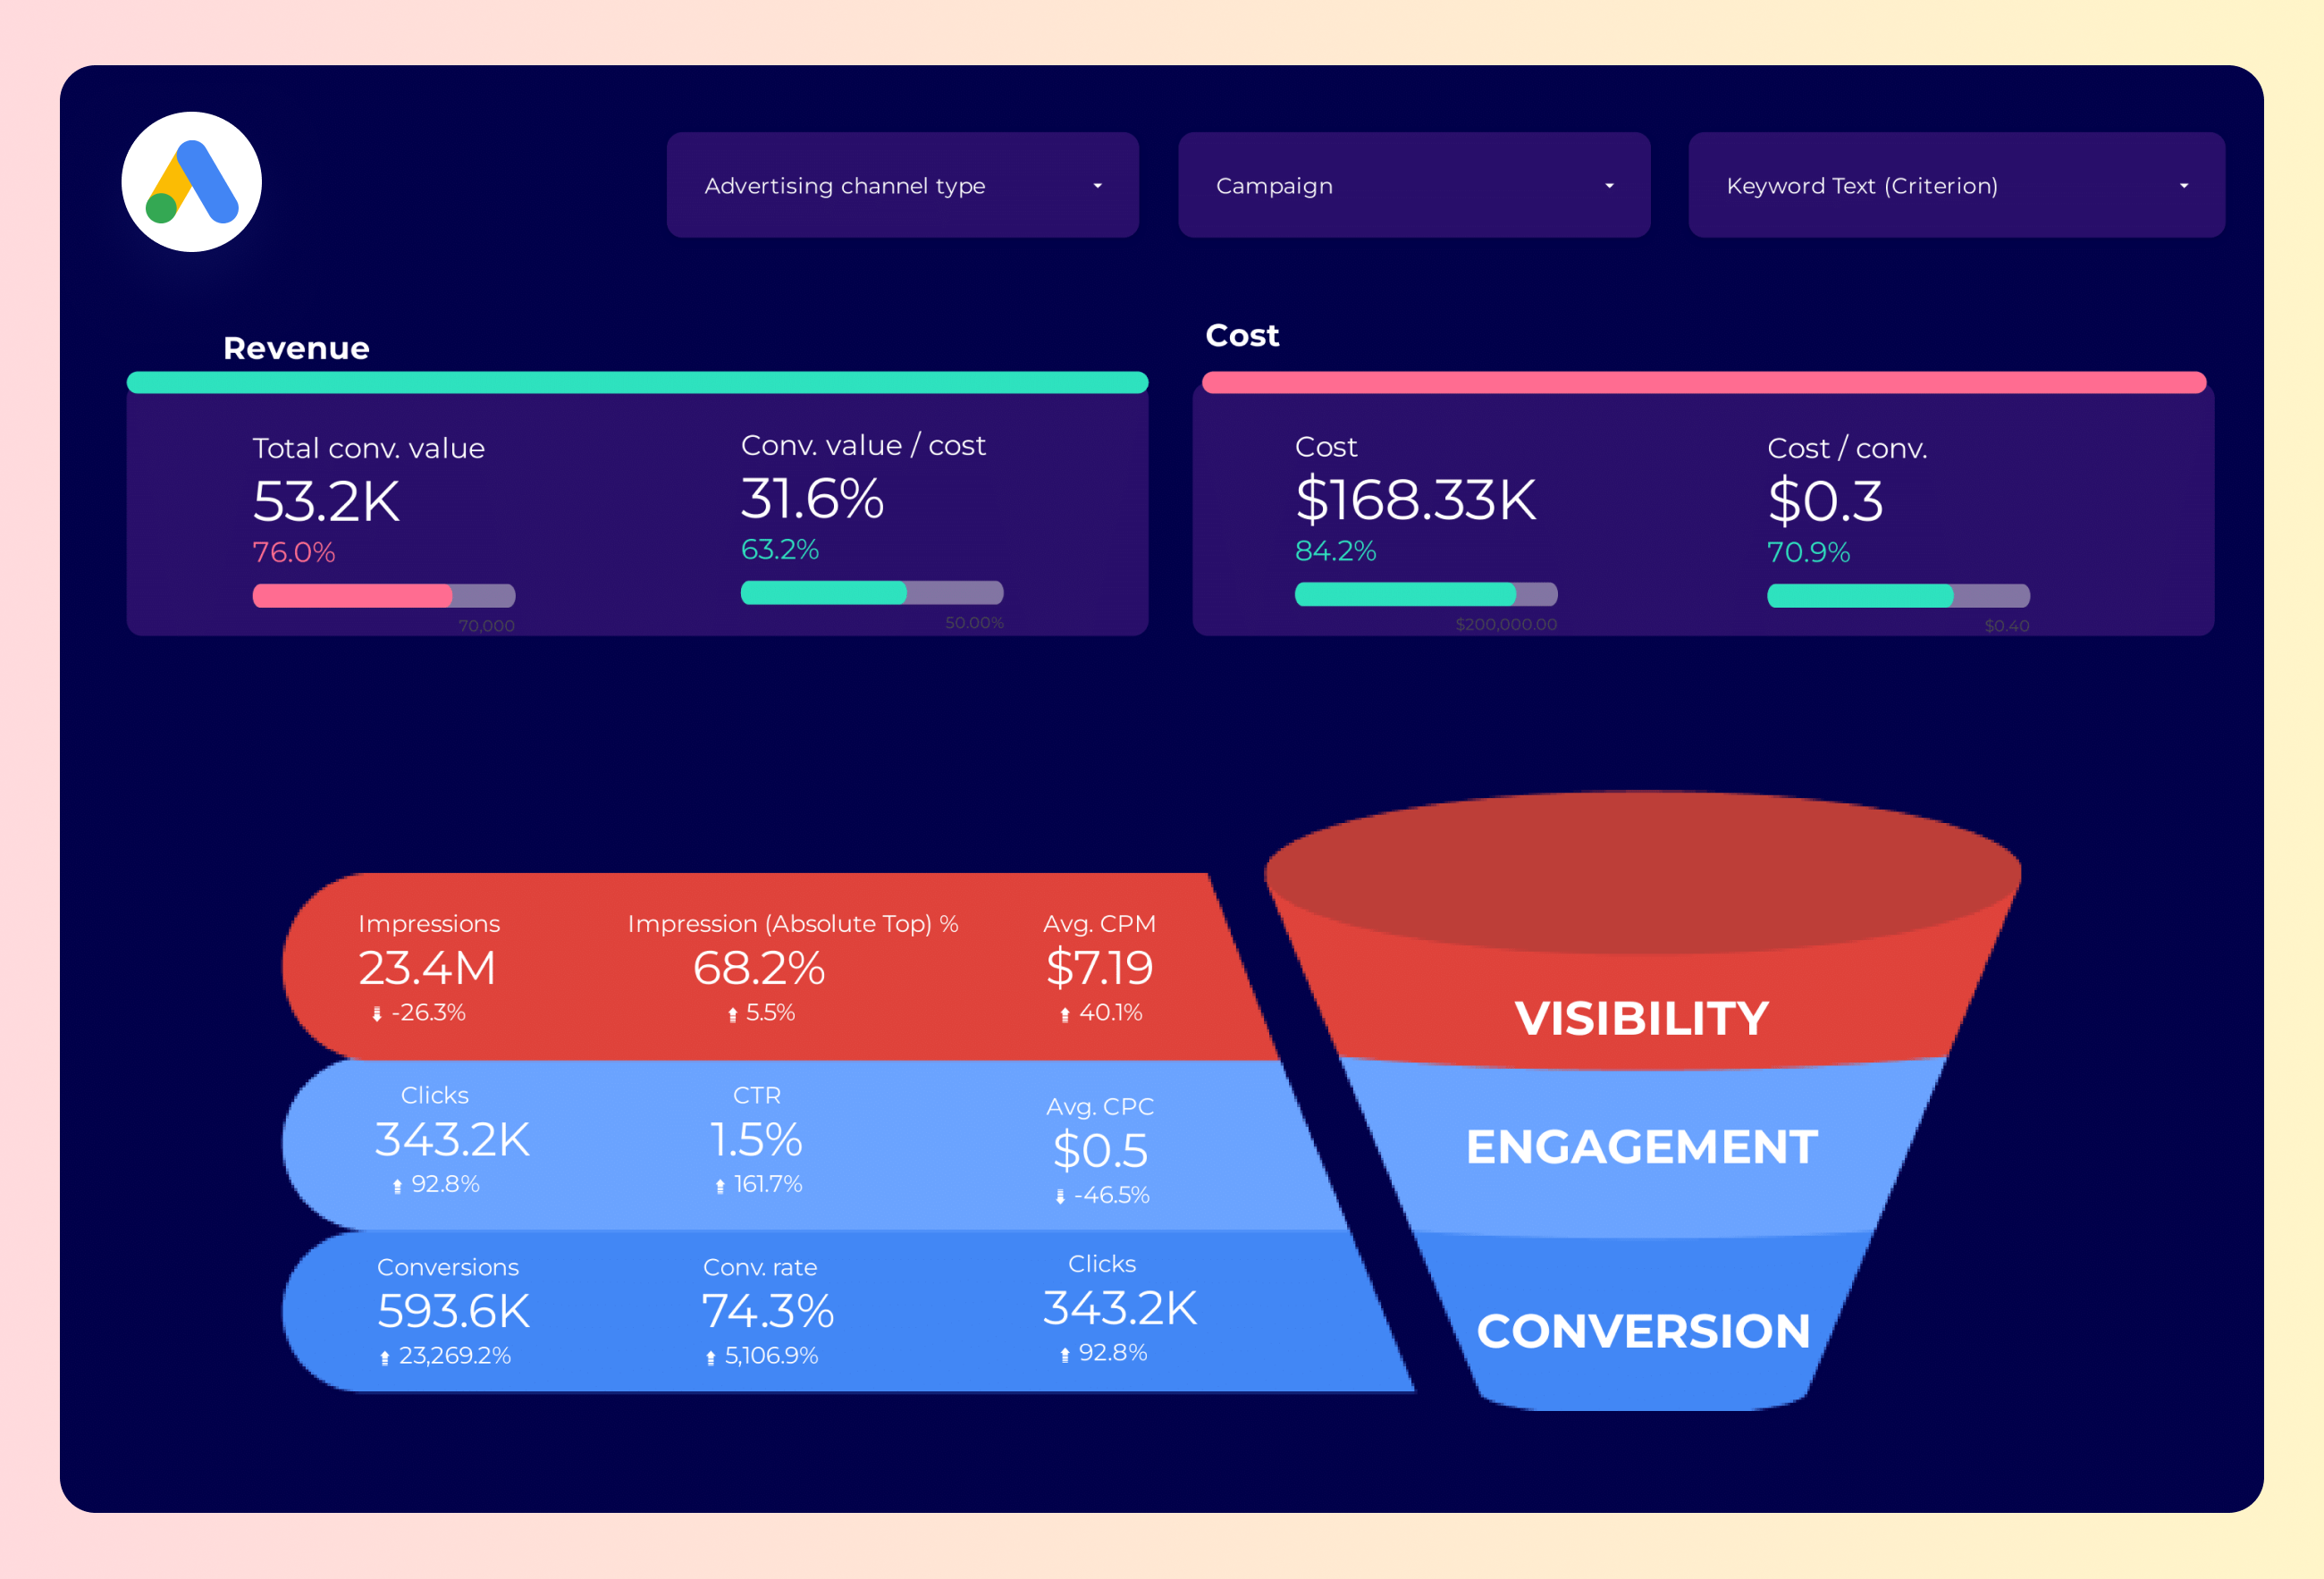
Google Ads Funnel Report template for Data Studio by Porter
Track top-funnel impressions → mid-funnel clicks → bottom-funnel conversions, ROAS. Segment by funnel stage, campaign.
PPC budget tracking and pacing Report template for Data Studio by Porter
Track budget utilization, spend pacing → efficiency (CPC, CPM) → ROAS vs target, CPA pacing. Segment by campaign, period, platform.
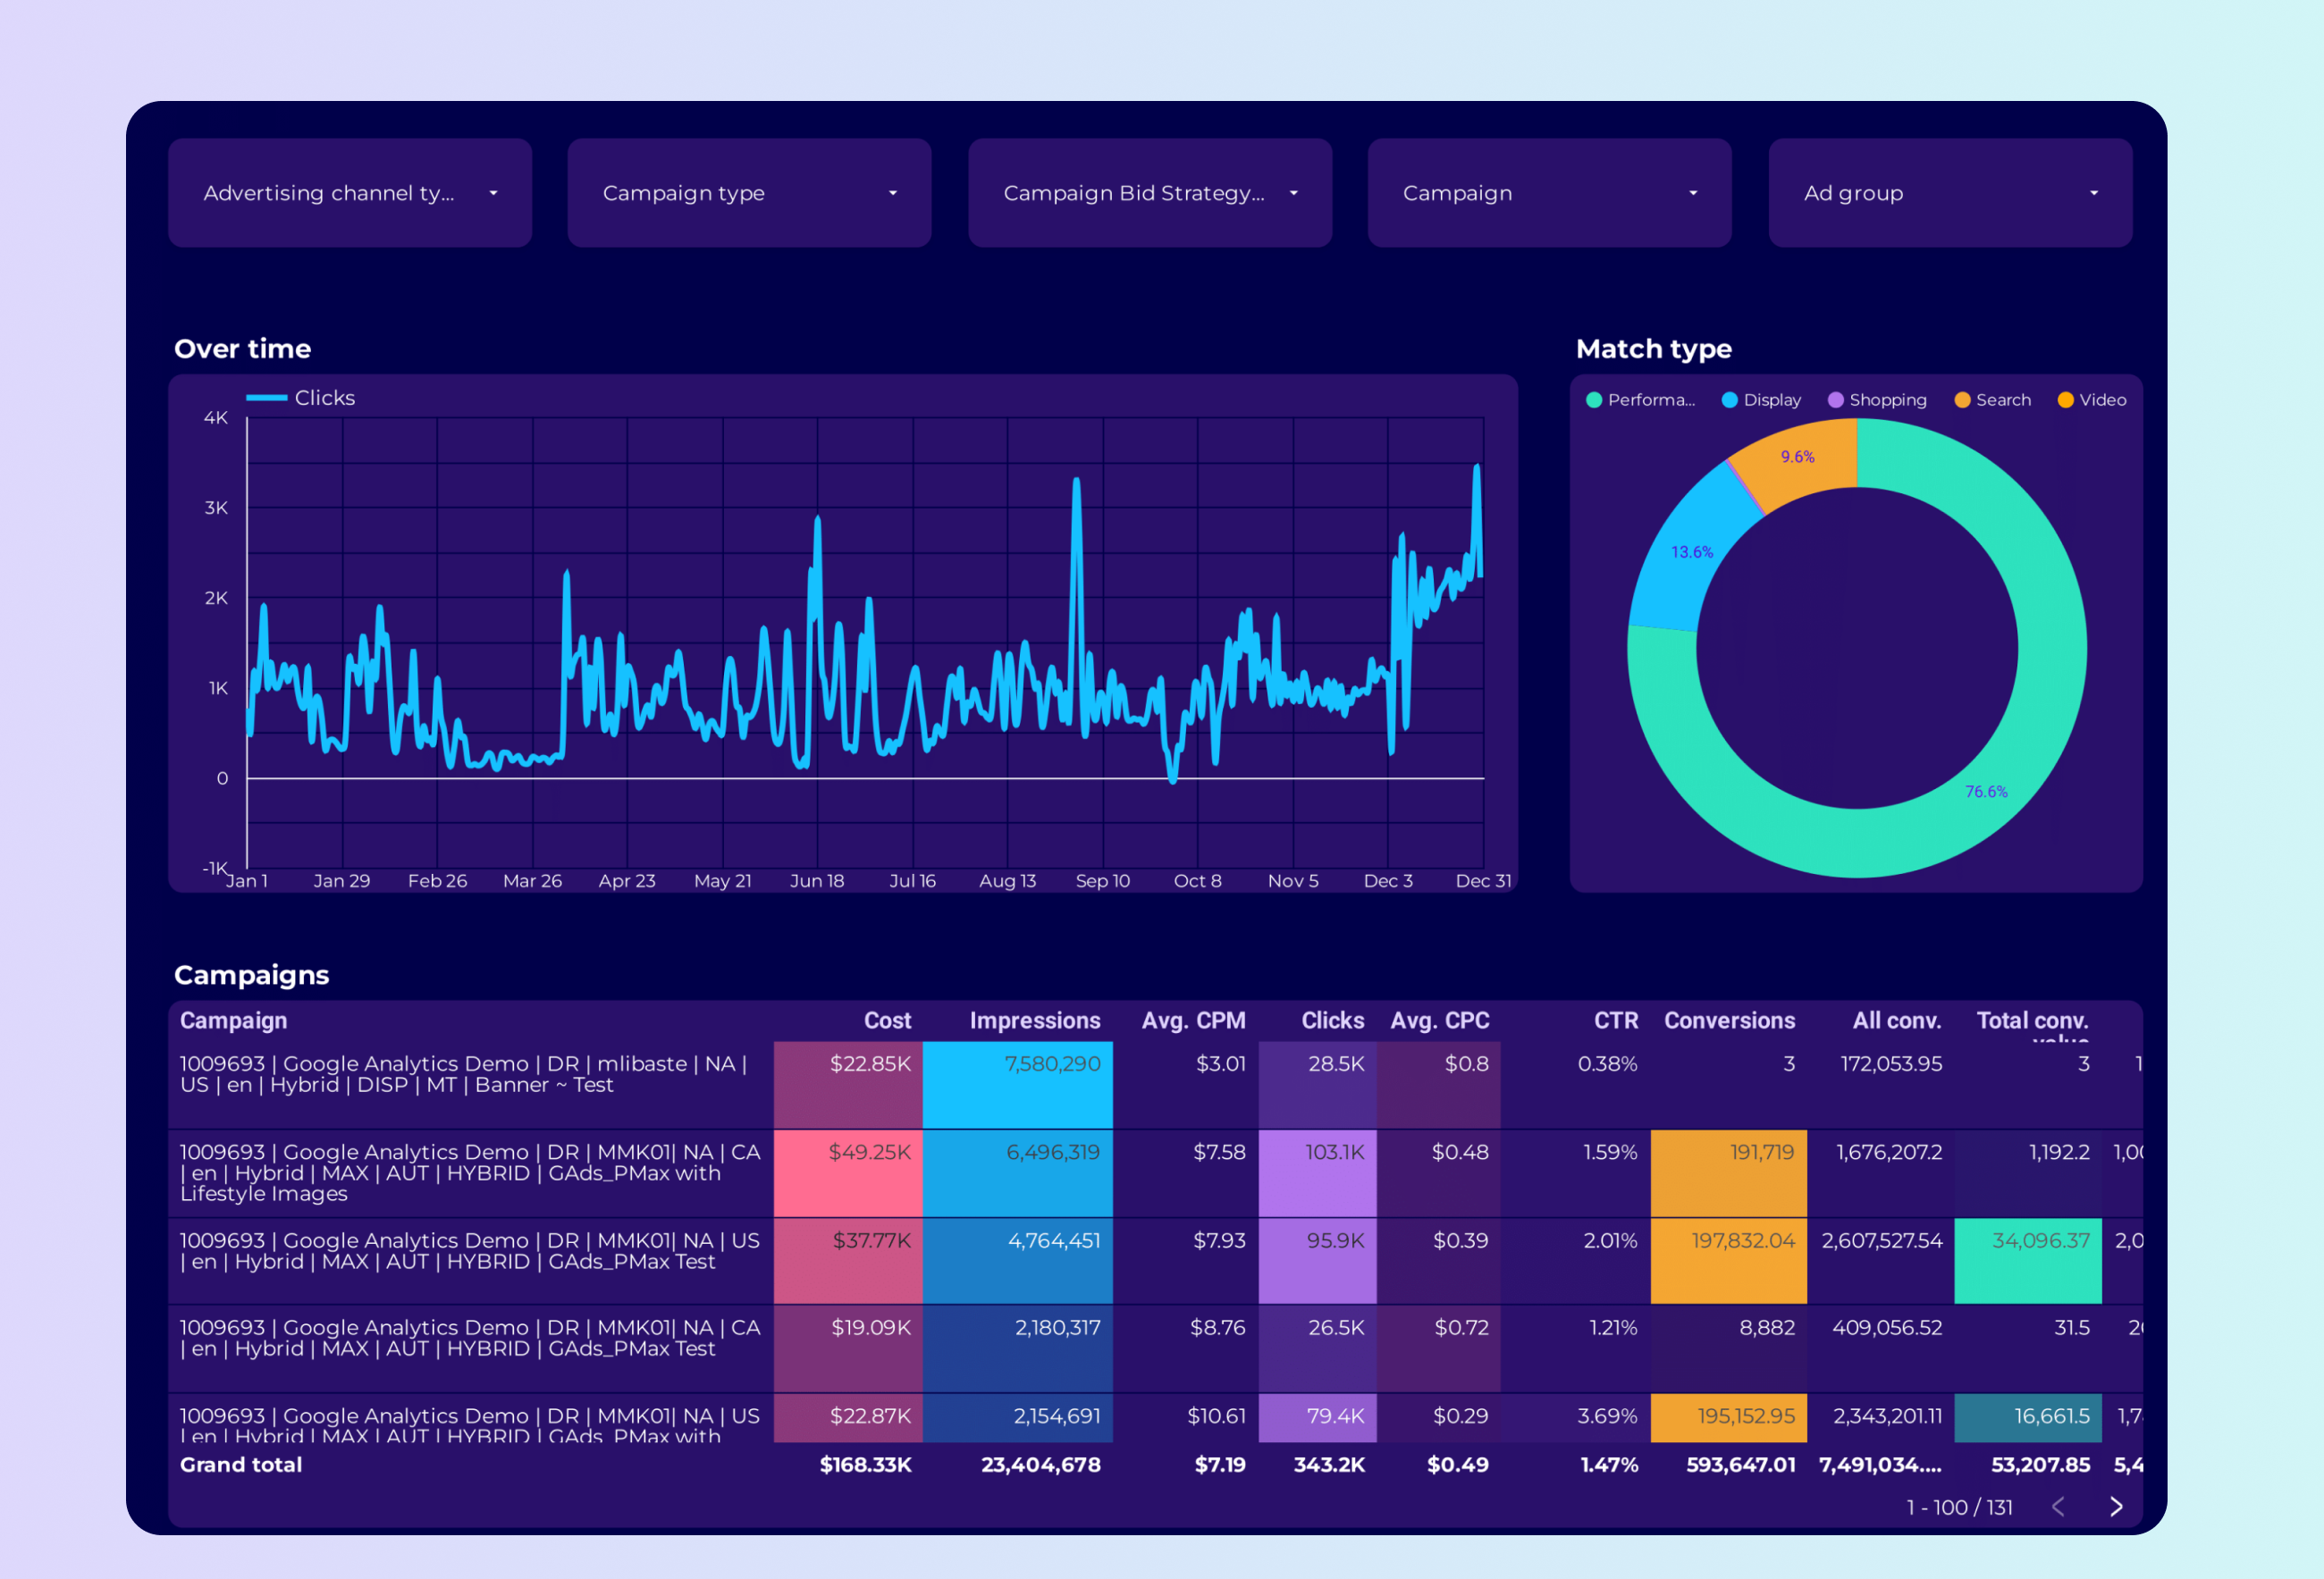
Google Ads Campaign performance Report template for Data Studio by Porter
Track campaign impressions, reach → CTR, CPC by campaign → ROAS, conversions per campaign. Segment by campaign, network, device.
SEM Report template for Data Studio by Porter
Track search impression share, ad rank → CTR, CPC, quality score → conversions, ROAS, CPA. Segment by keyword, match type, device.
PPC Creative performance Report template for Data Studio by Porter
Track creative impressions, frequency → CTR by creative, hook rate → ROAS per creative variant. Segment by creative, format, copy.

ROAS Report template for Data Studio by Porter
Track ad spend, impression volume → cost efficiency (CPC, CPM) → ROAS, revenue, profit margin. Segment by campaign, platform, product.
PPC KPIs Report template for Data Studio by Porter
Track impression trends vs target → CTR vs benchmark, CPC tracking → ROAS attainment, CPA vs target. Segment by KPI, platform, campaign.
PPC monthly Report template for Data Studio by Porter
Track monthly impression trends → monthly CTR, CPC trends → monthly ROAS, CPA. Segment by month, platform, campaign.
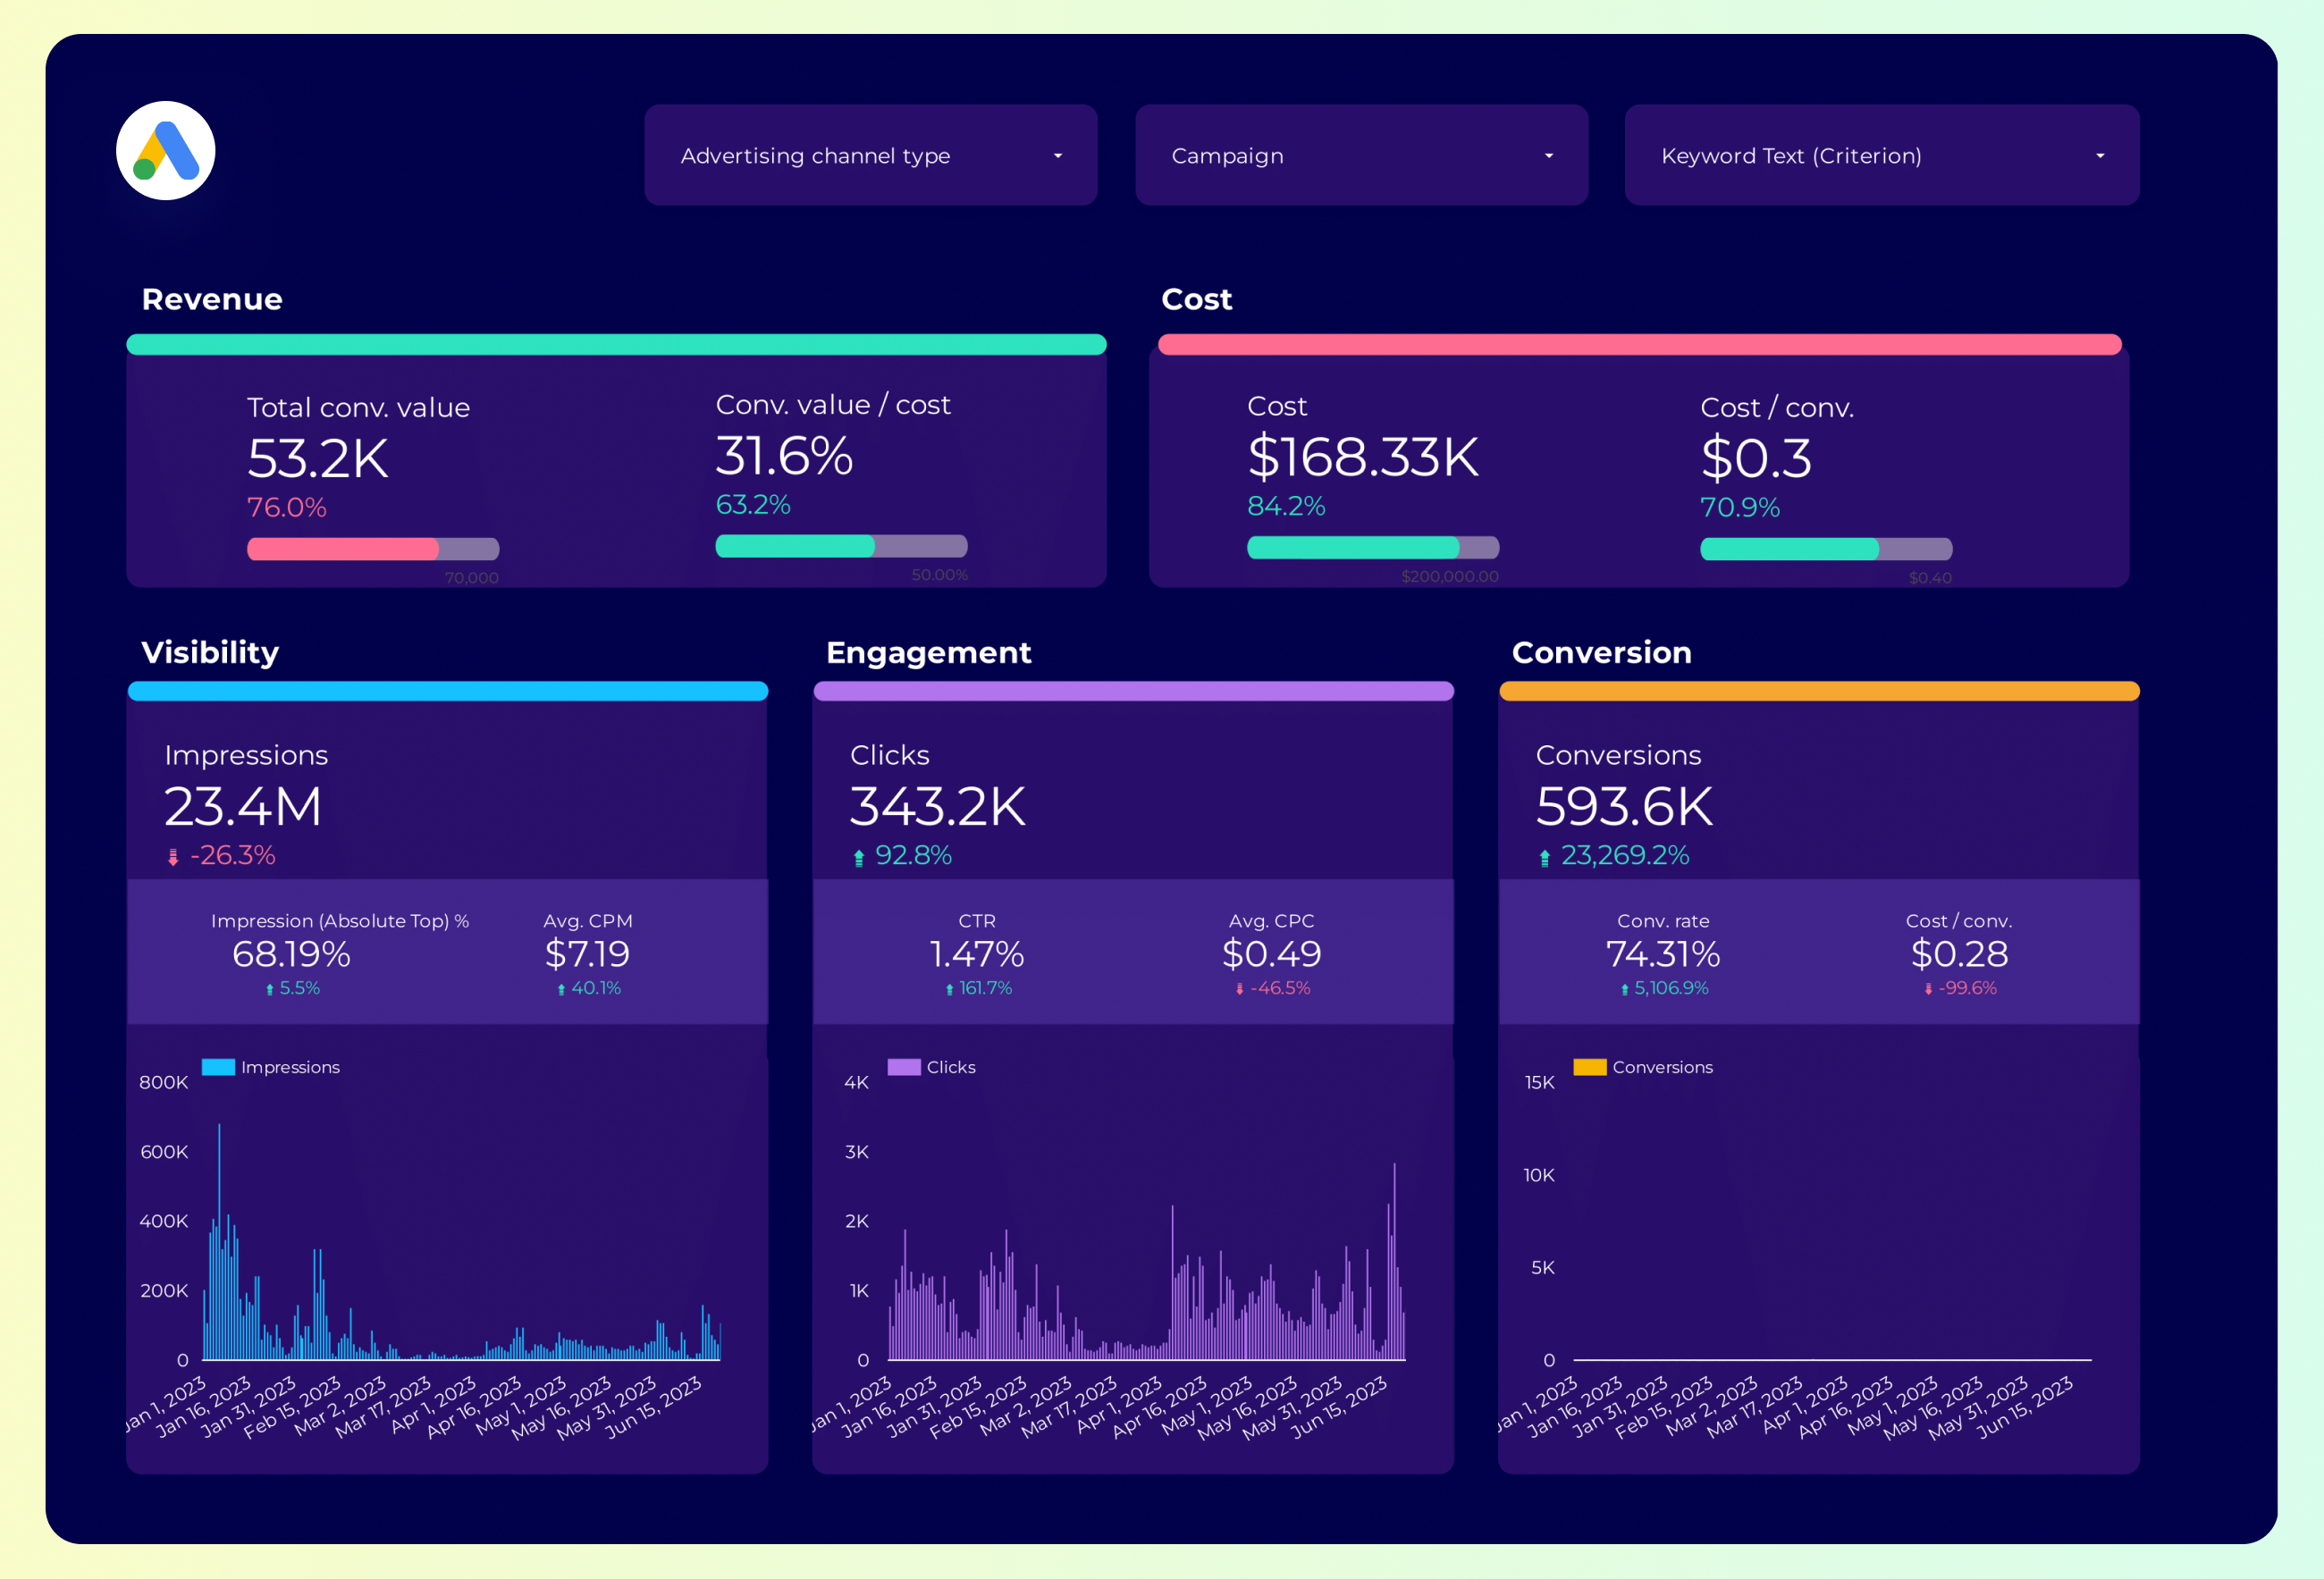
Google Ads Report template for Data Studio by Porter
Track impression share, search volume → CTR by keyword, CPC trends → conversion rate, ROAS by keyword. Segment by keyword, match type.

PPC Report template for Data Studio by Porter
Track impression trends vs target → CTR vs benchmark, CPC tracking → ROAS attainment, CPA vs target. Segment by KPI, platform, campaign.
Google Ads Report template for Data Studio by Porter
Track impression share, search volume → CTR by keyword, CPC trends → conversion rate, ROAS by keyword. Segment by keyword, match type.
Google Ads PMax Report template for Data Studio by Porter
Track asset coverage, reach → CTR by asset type → conversions, ROAS by asset group. Segment by asset group, audience signal.
Marketing Ad spend Report template for Data Studio by Porter
Track spend distribution, budget allocation → efficiency (CPC, CPM by channel) → ROAS by channel, blended CPA. Segment by channel, campaign, period.
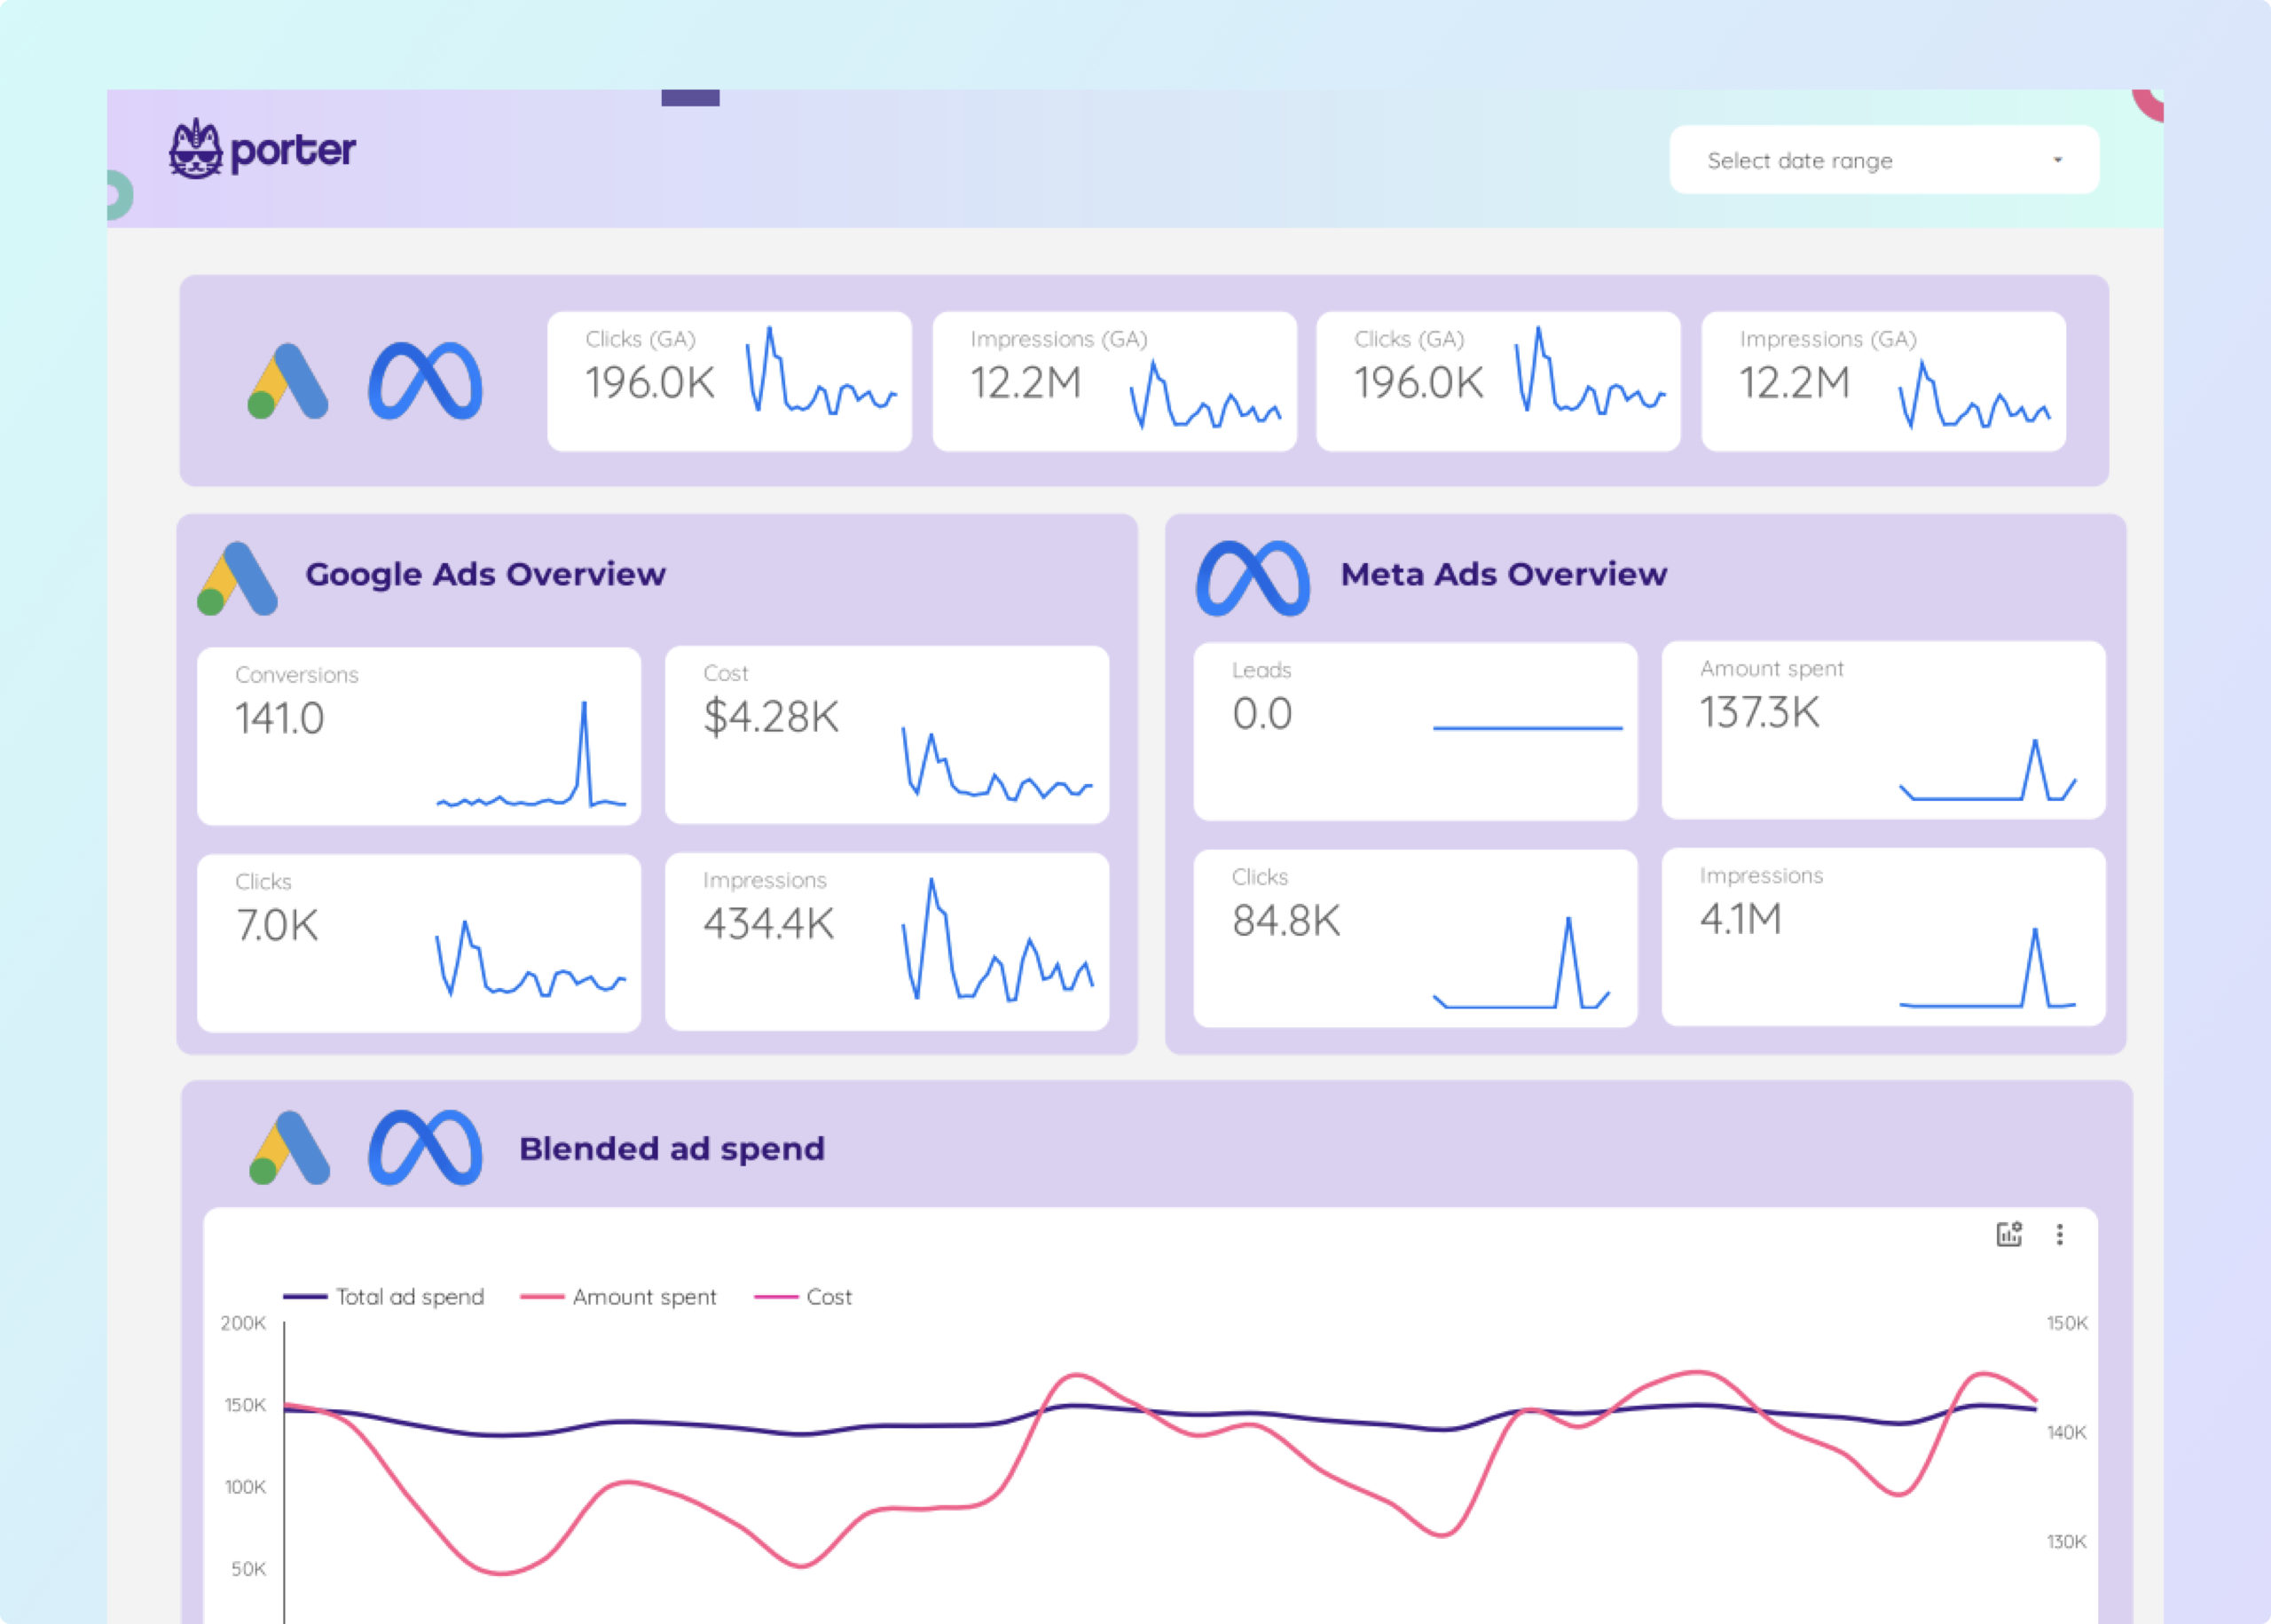
Facebook Ads + Google Ads Report template for Data Studio by Porter
Track impressions, impression share → CTR, CPC, quality score → conversions, ROAS, CPA. Segment by campaign, ad group, keyword.
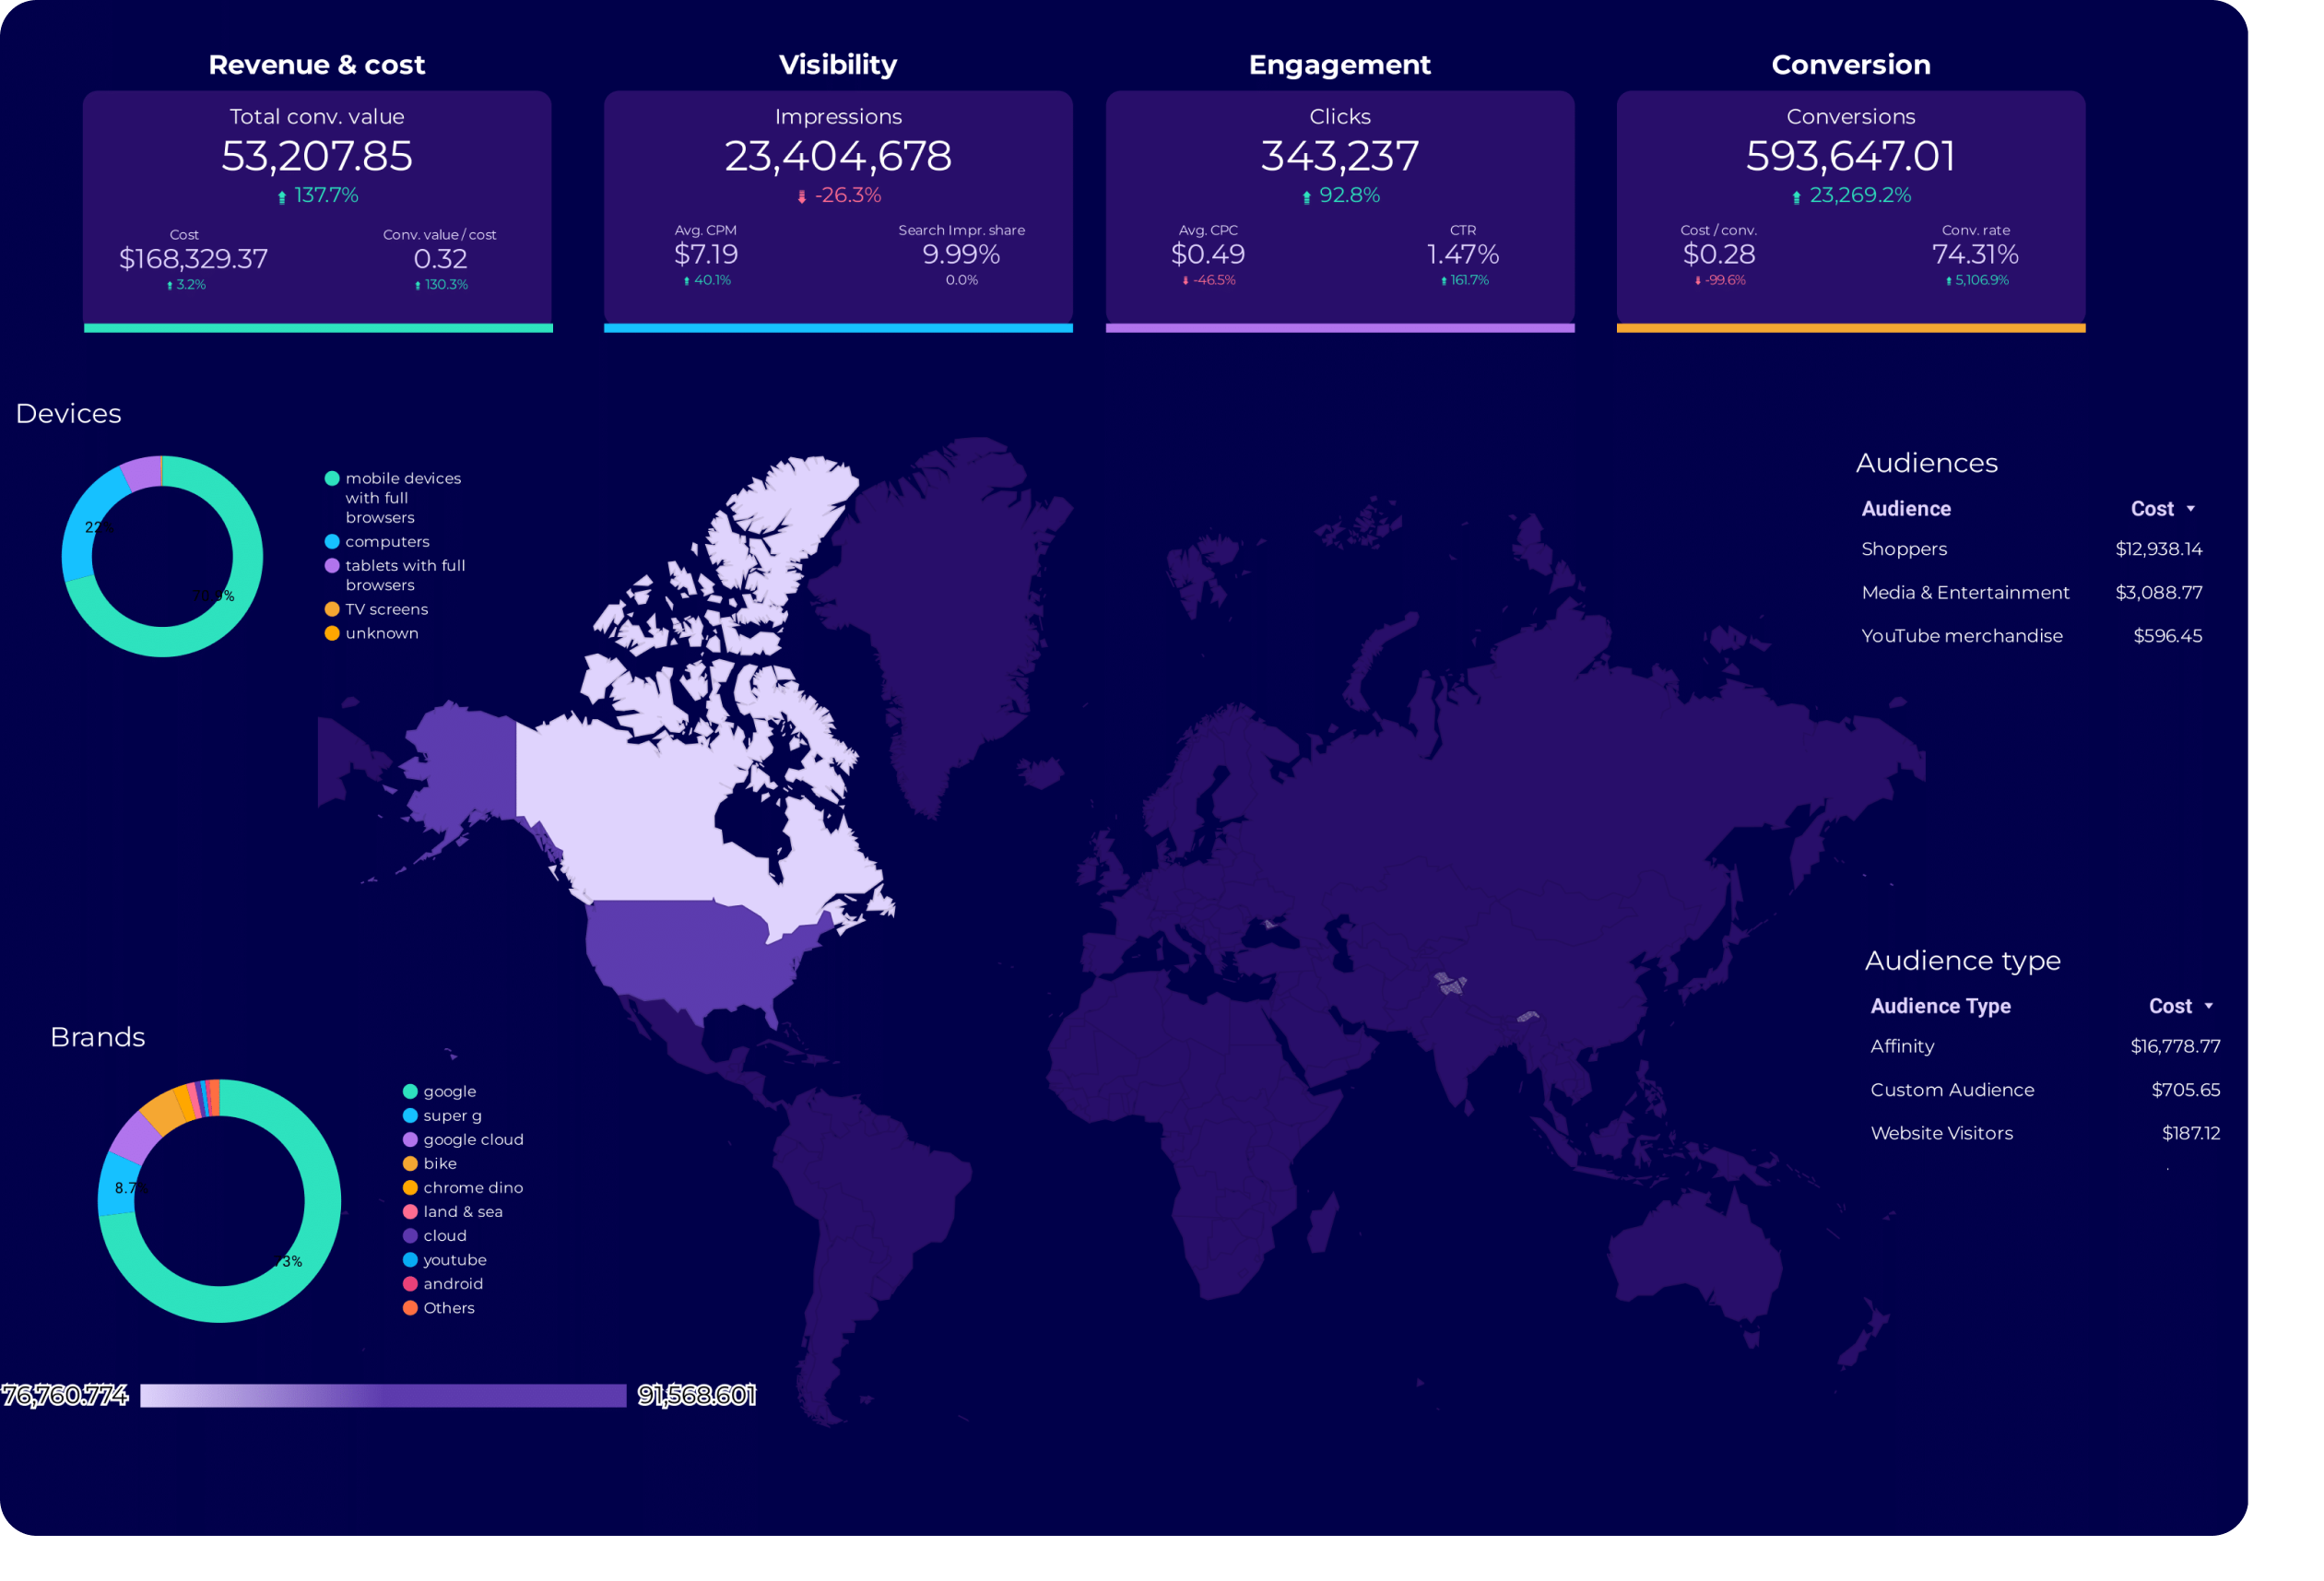
Google Ads Audience Report template for Data Studio by Porter
Track audience reach, impression share → CTR by audience segment → conversion rate by audience. Segment by audience type, remarketing.
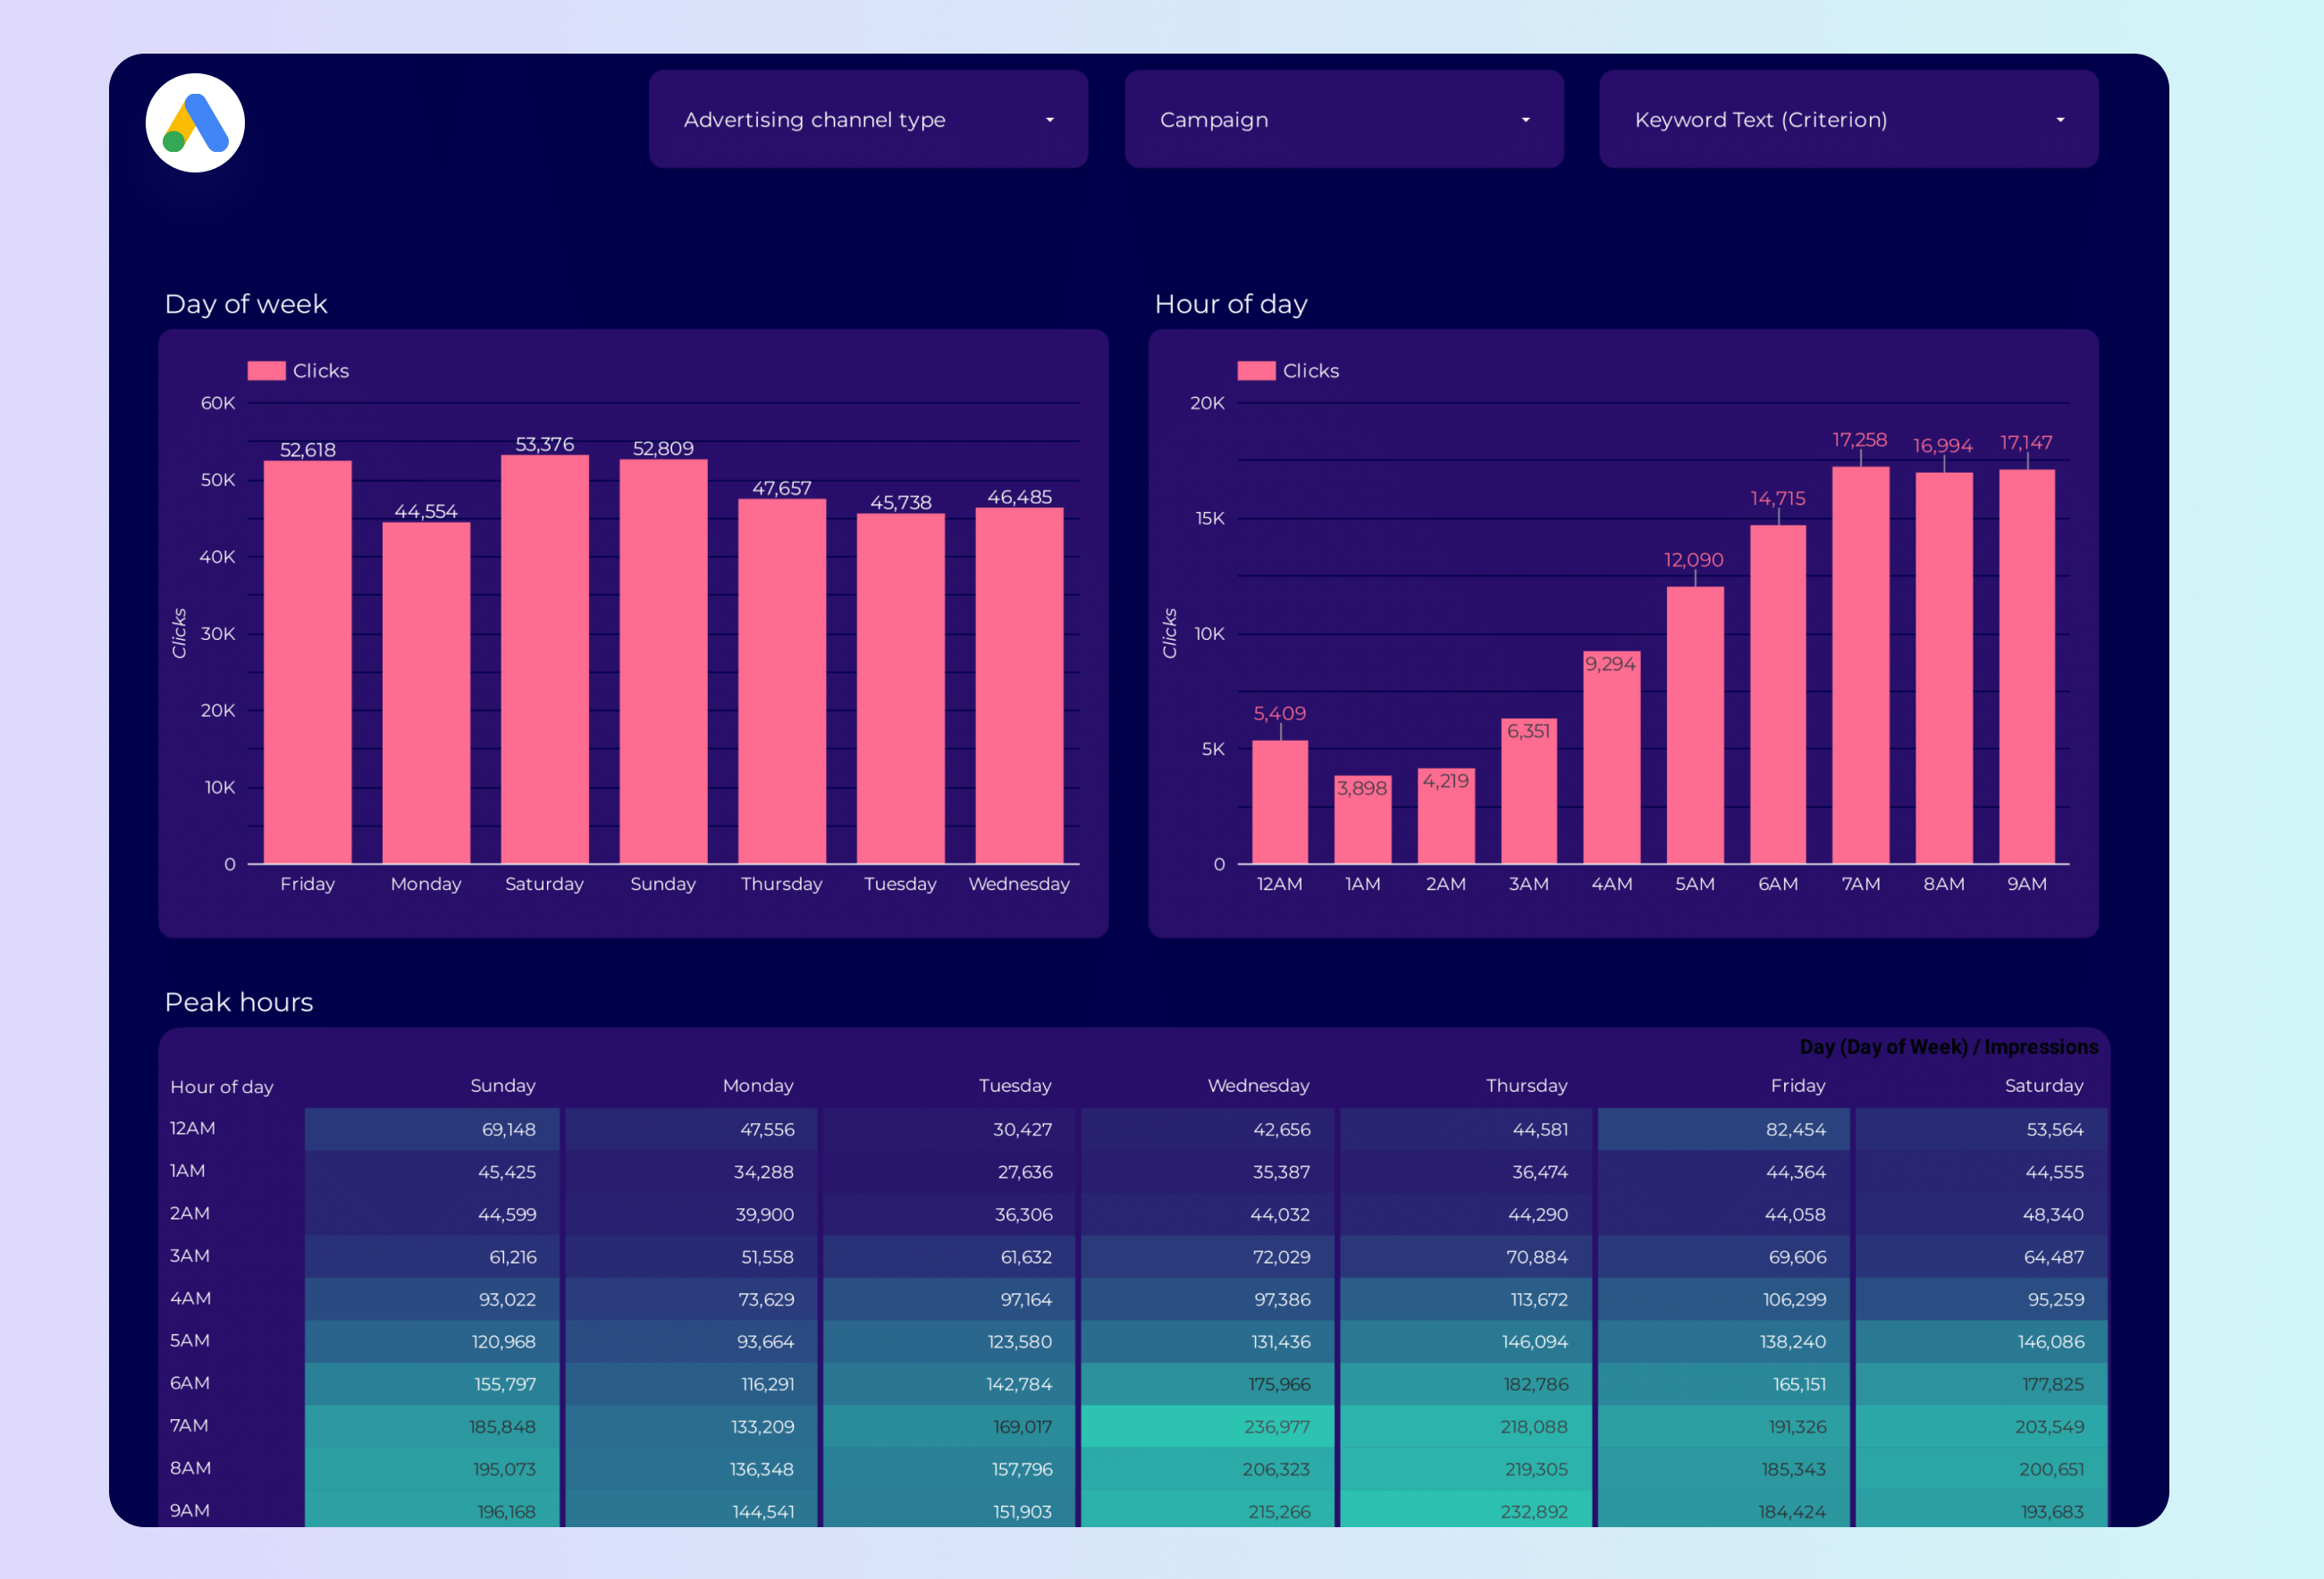
Google Ads Peak hours Report template for Data Studio by Porter
Track impression volume by hour → CTR by time of day → conversion rate by hour. Segment by hour, day, device.

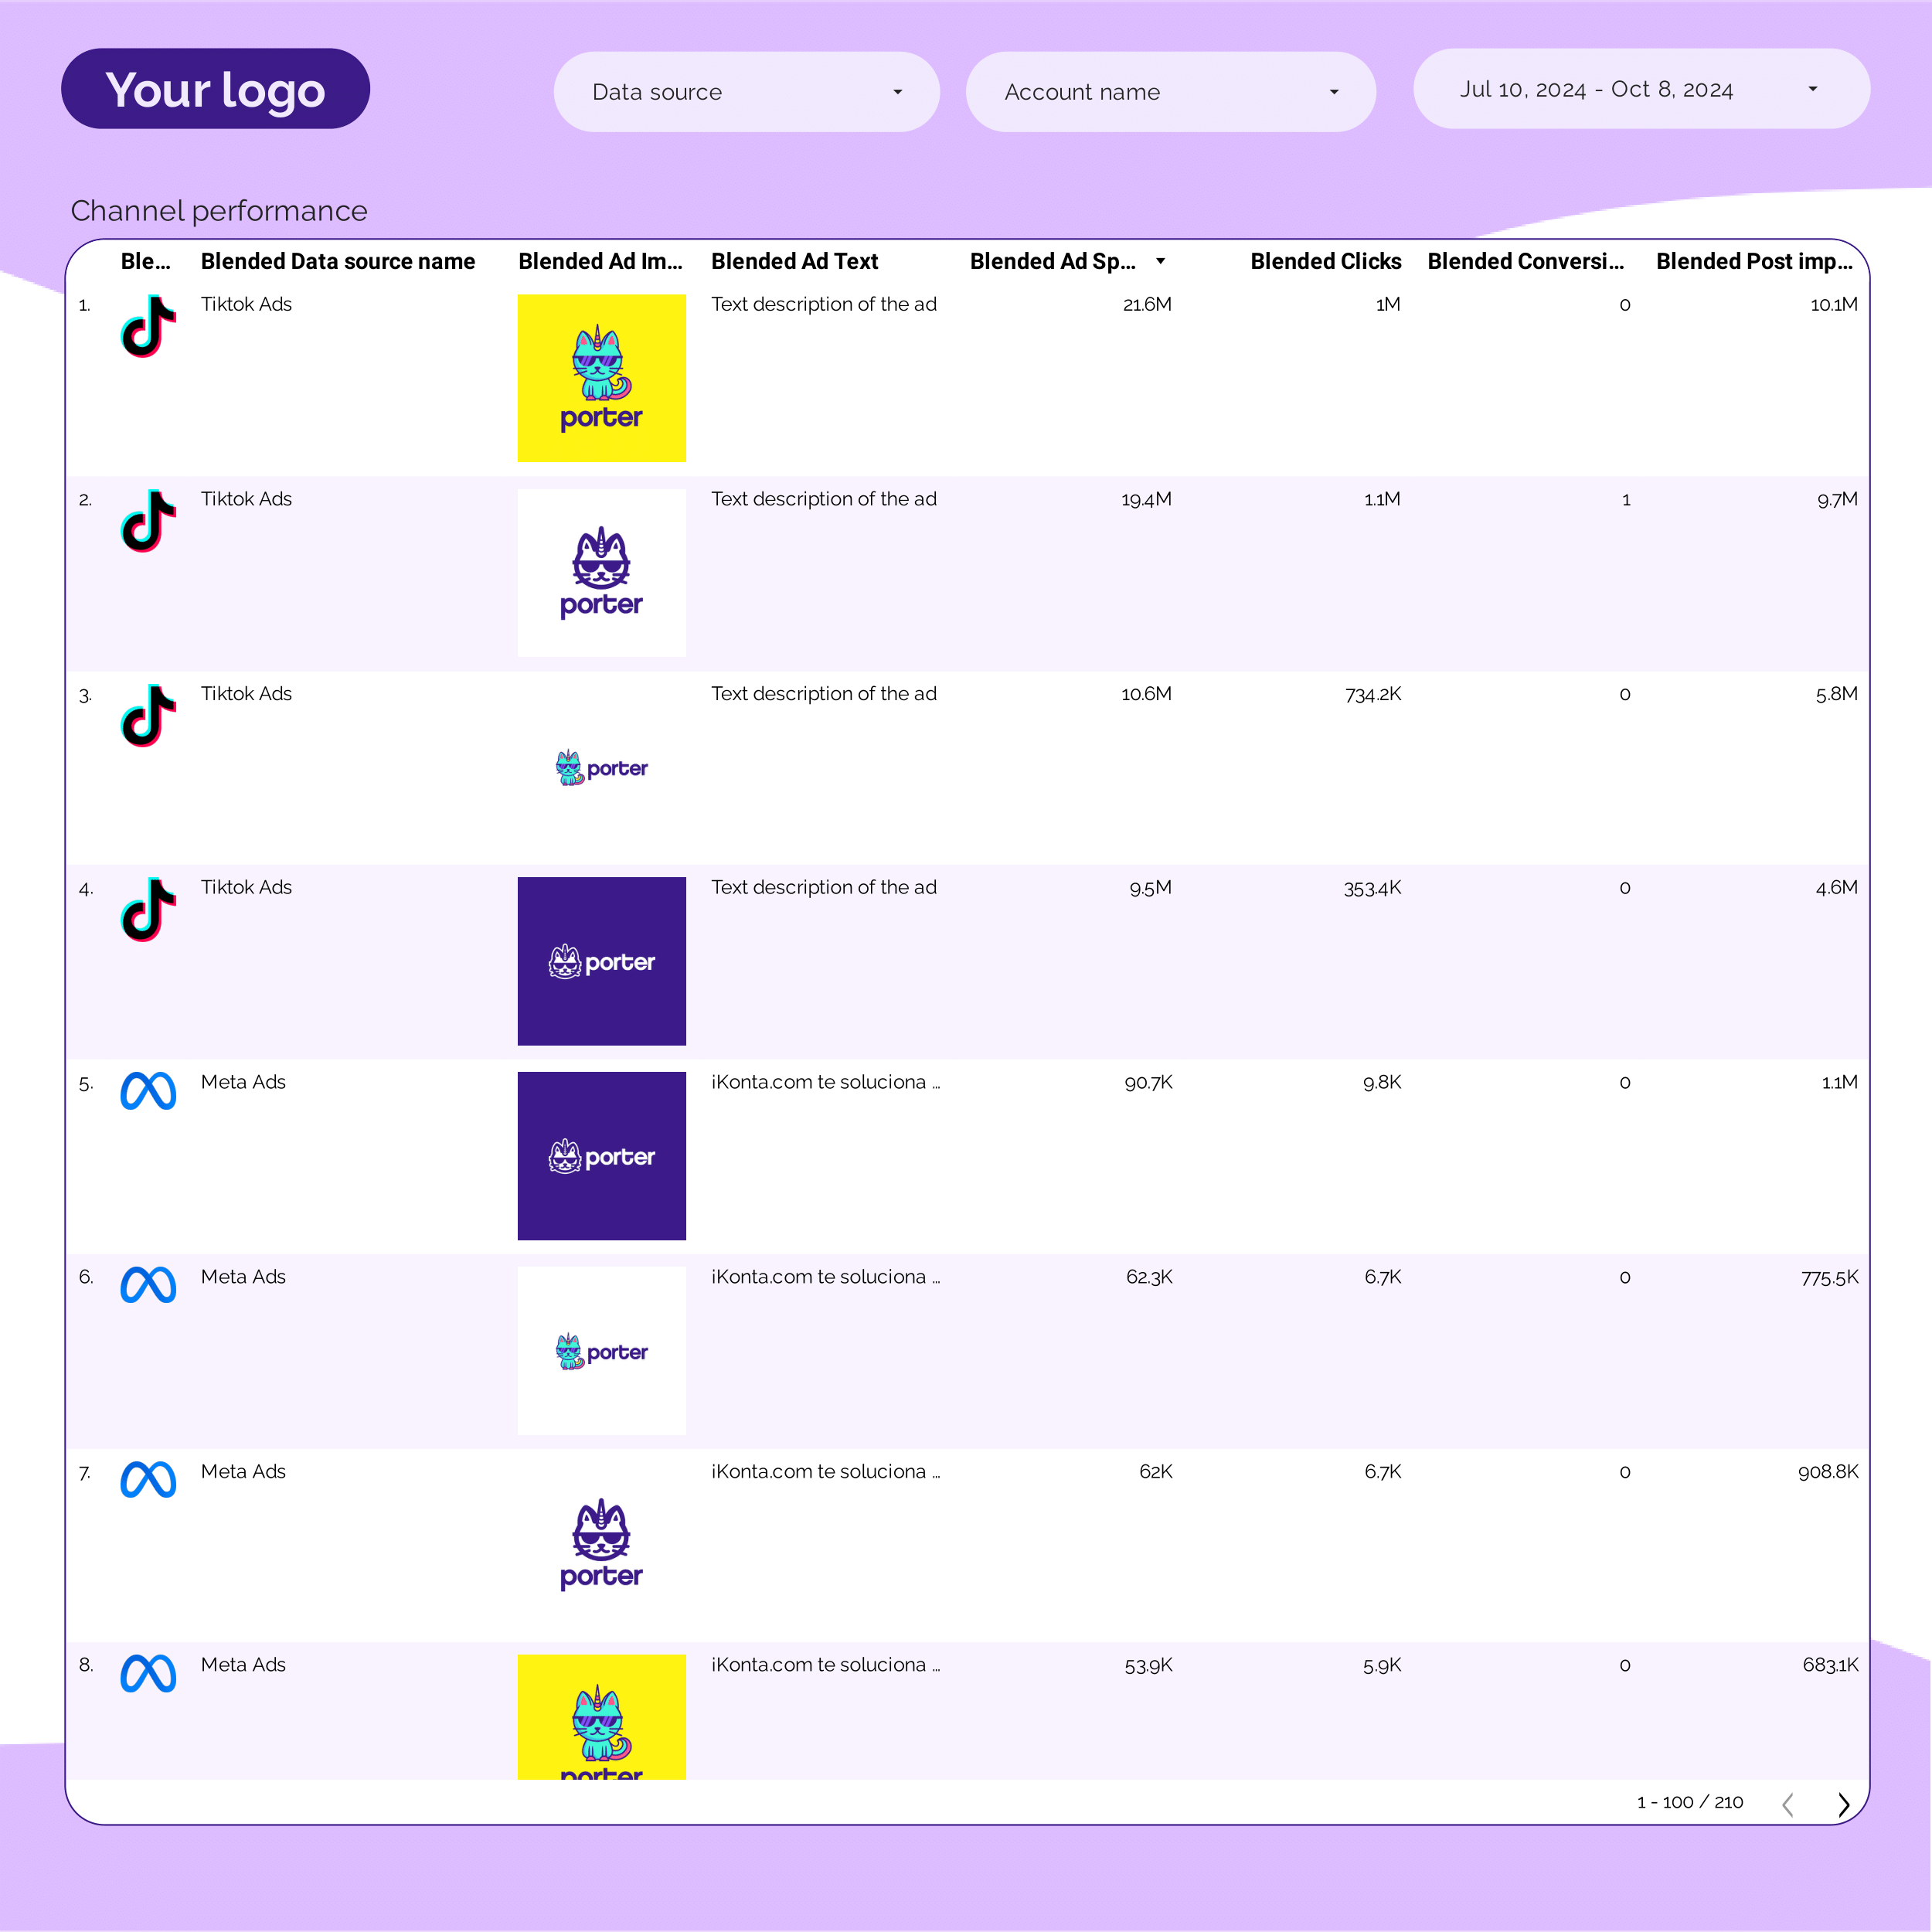
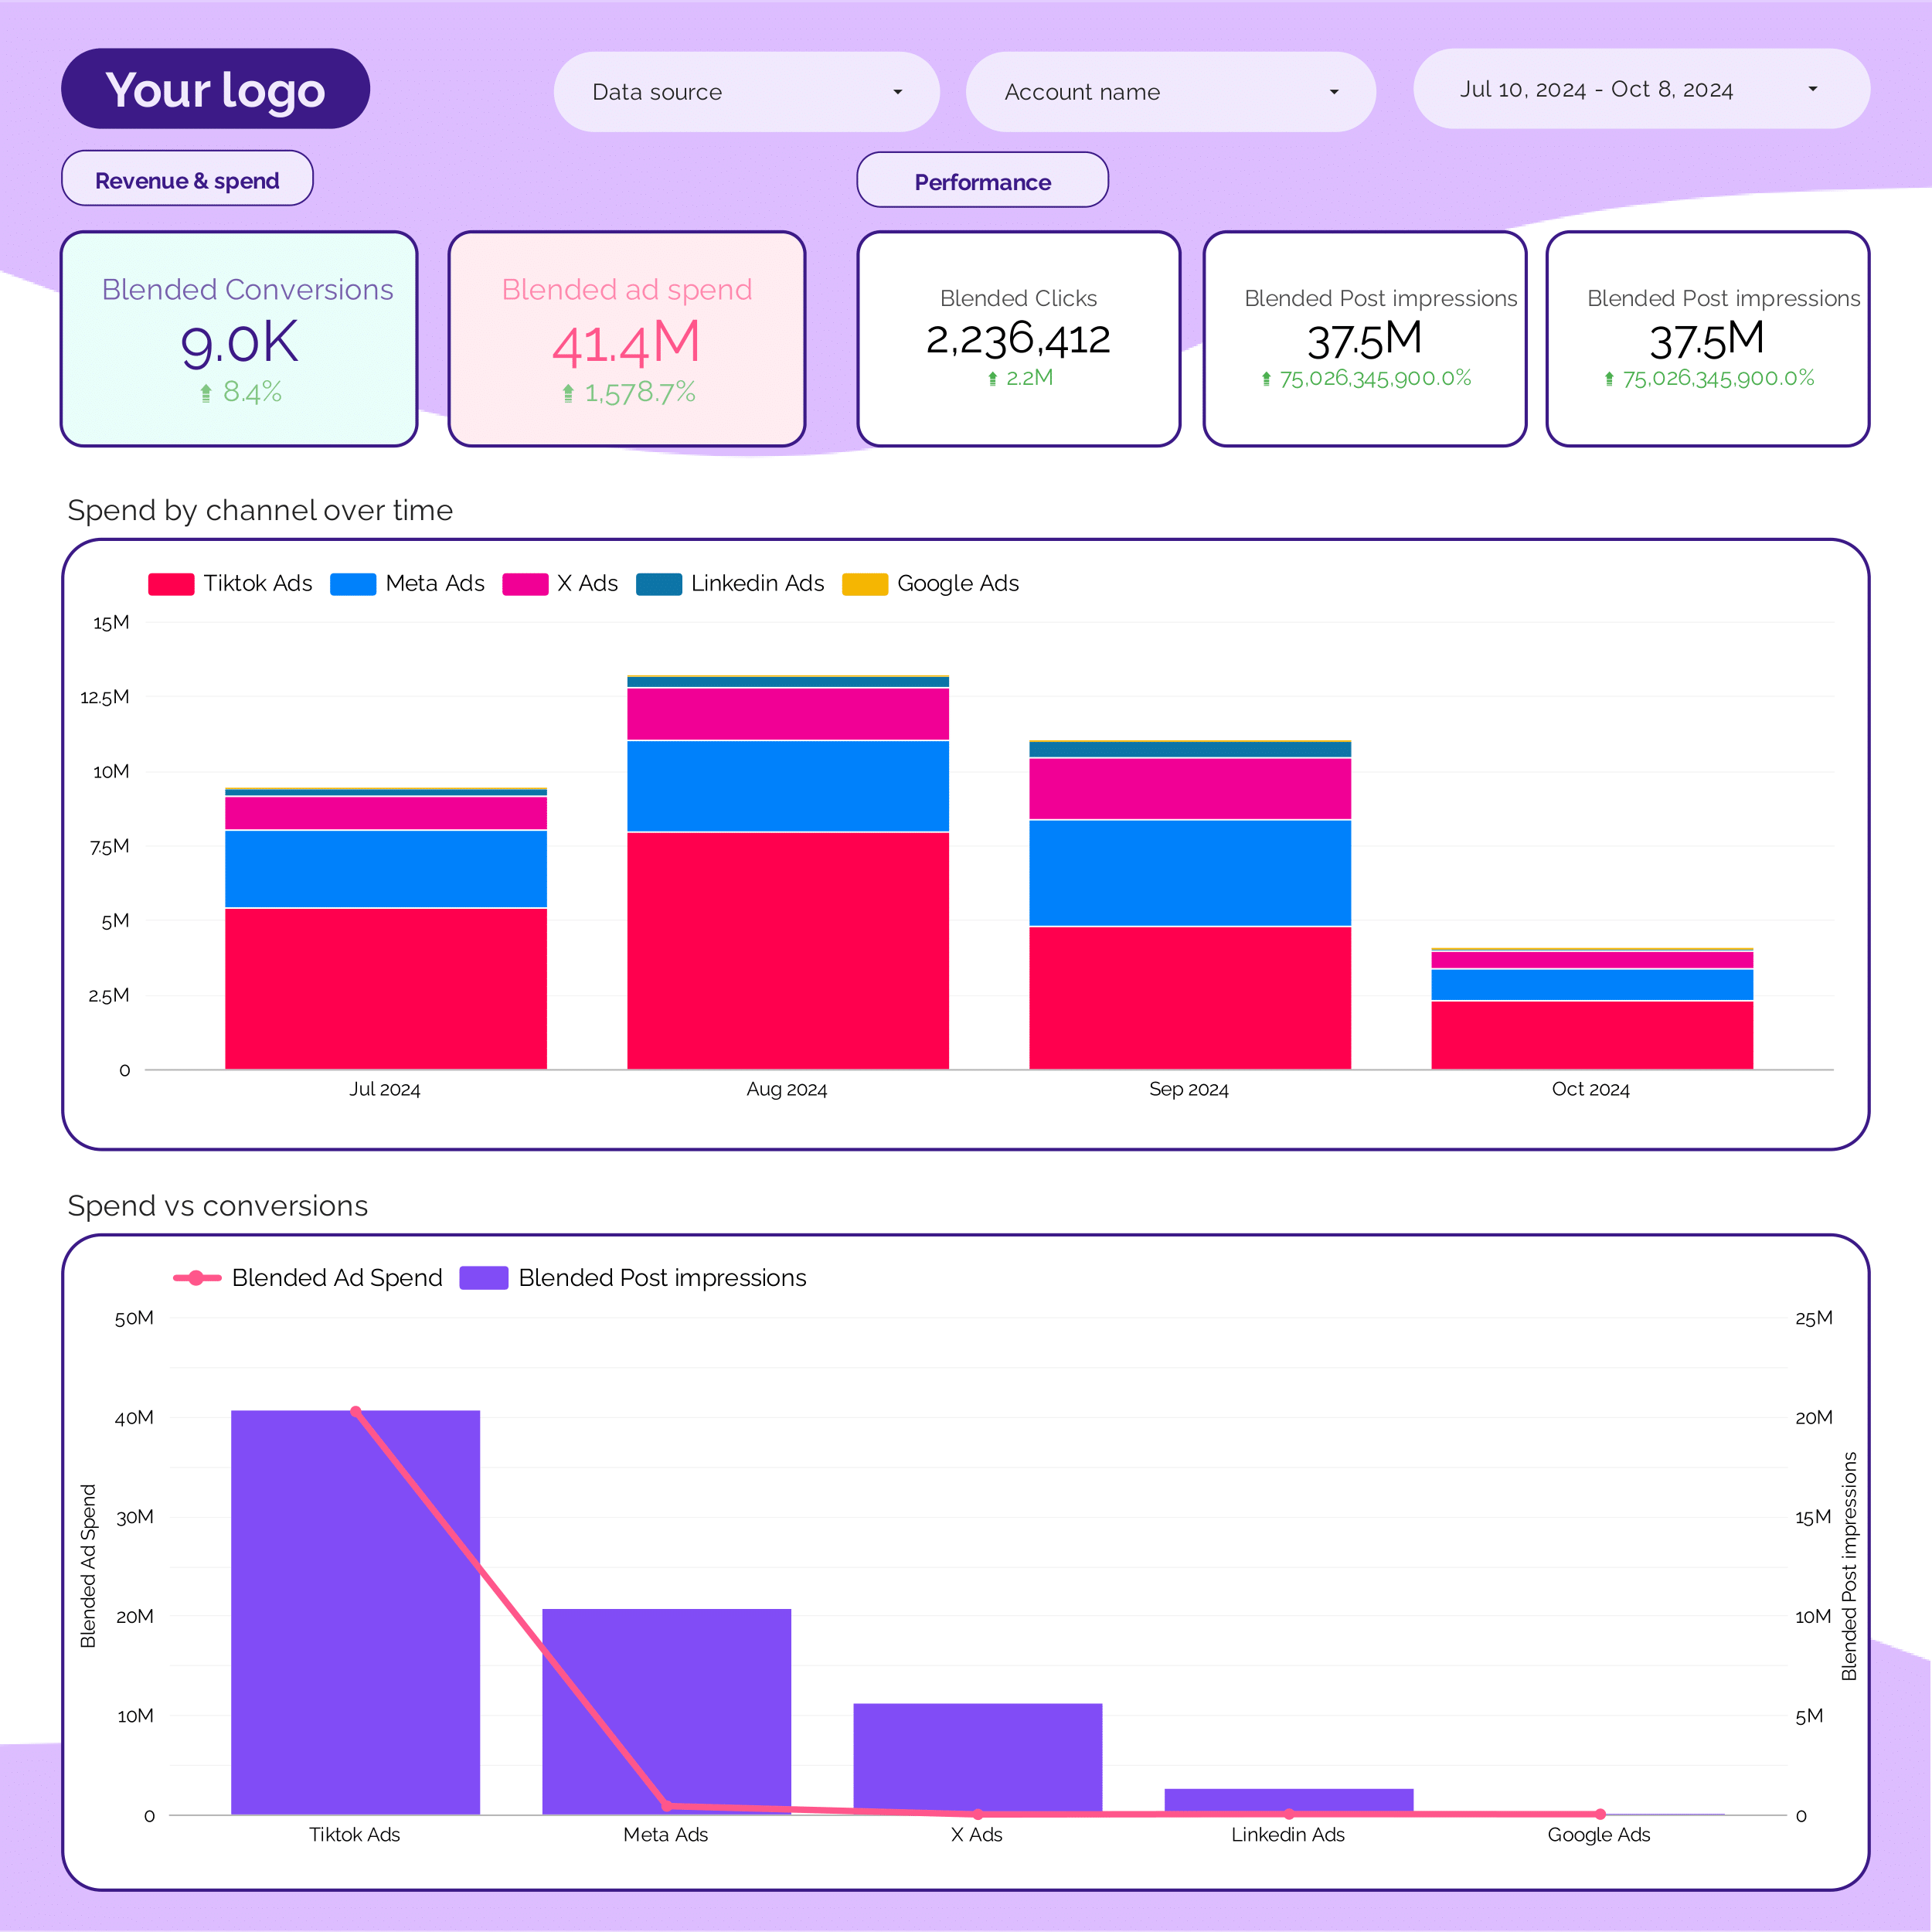
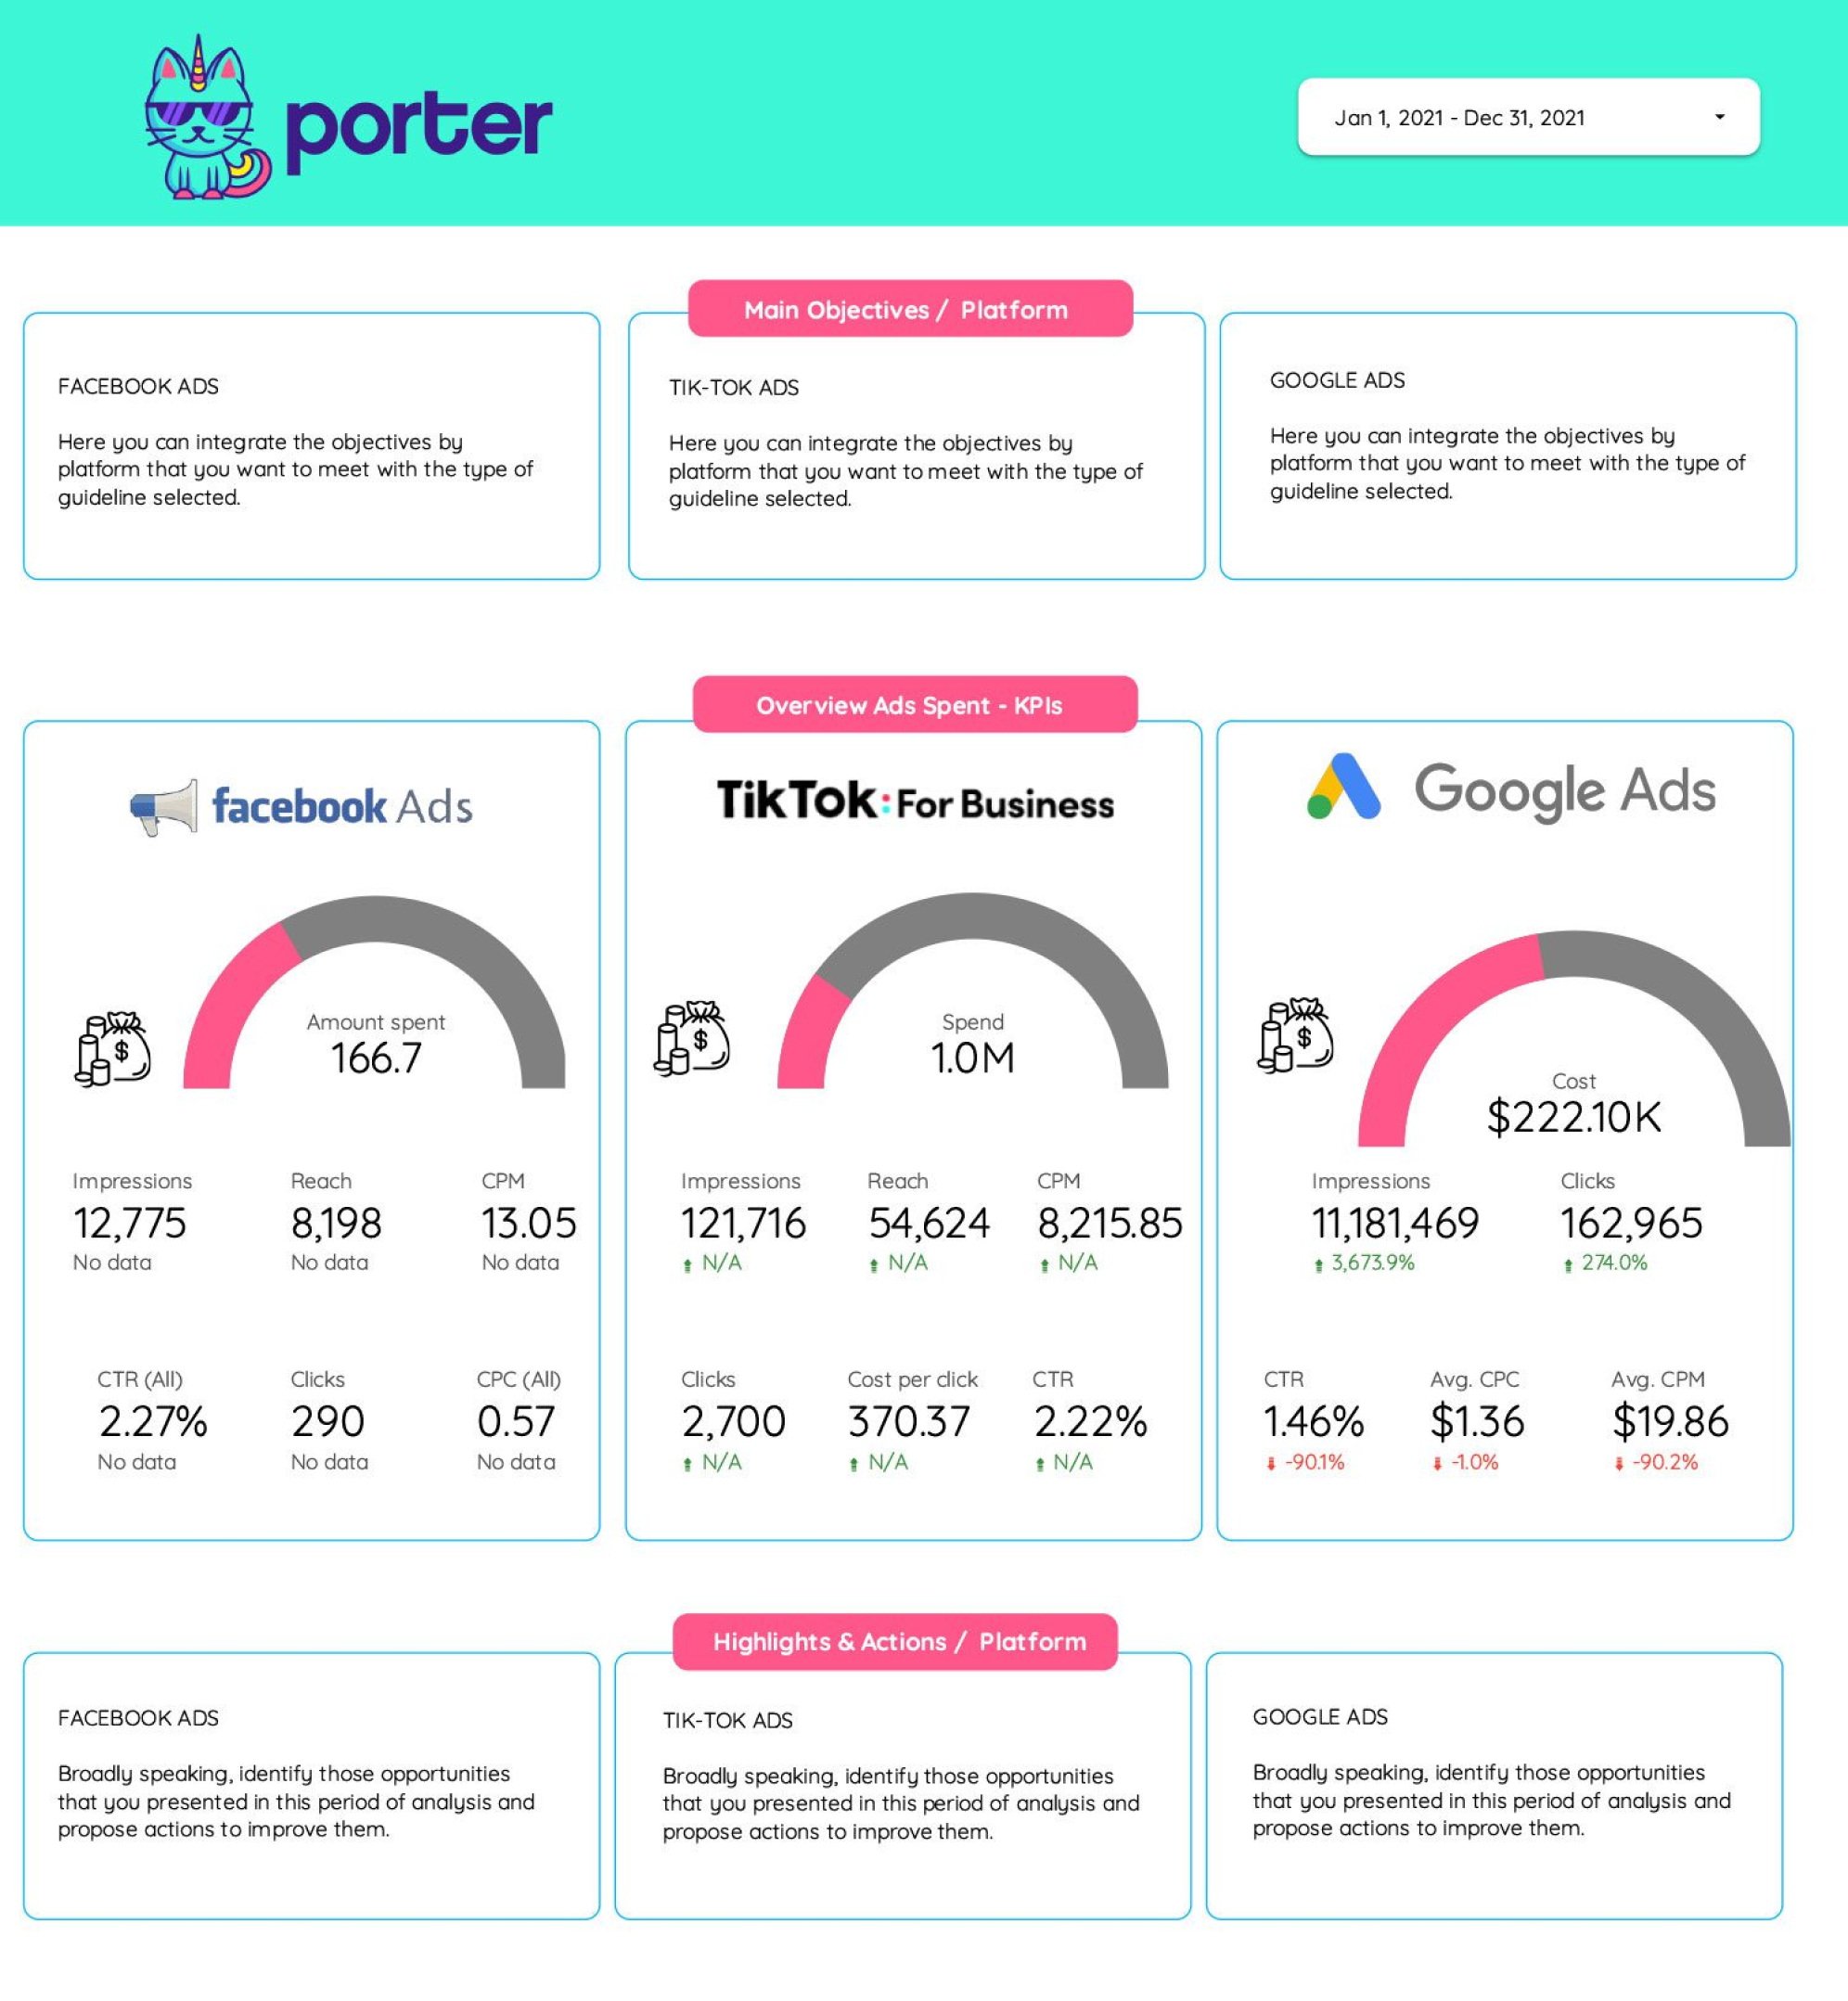
PPC multi-channel Report template for Data Studio by Porter
Track cross-platform impressions → CTR comparison by platform → blended ROAS, CPA by platform. Segment by platform, campaign type.
Facebook Ads budget tracking and pacing Report template for Data Studio by Porter
Track spend pacing, utilization → efficiency (CPC, CPM trends) → ROAS vs target, CPA pacing. Segment by campaign, ad set, day.
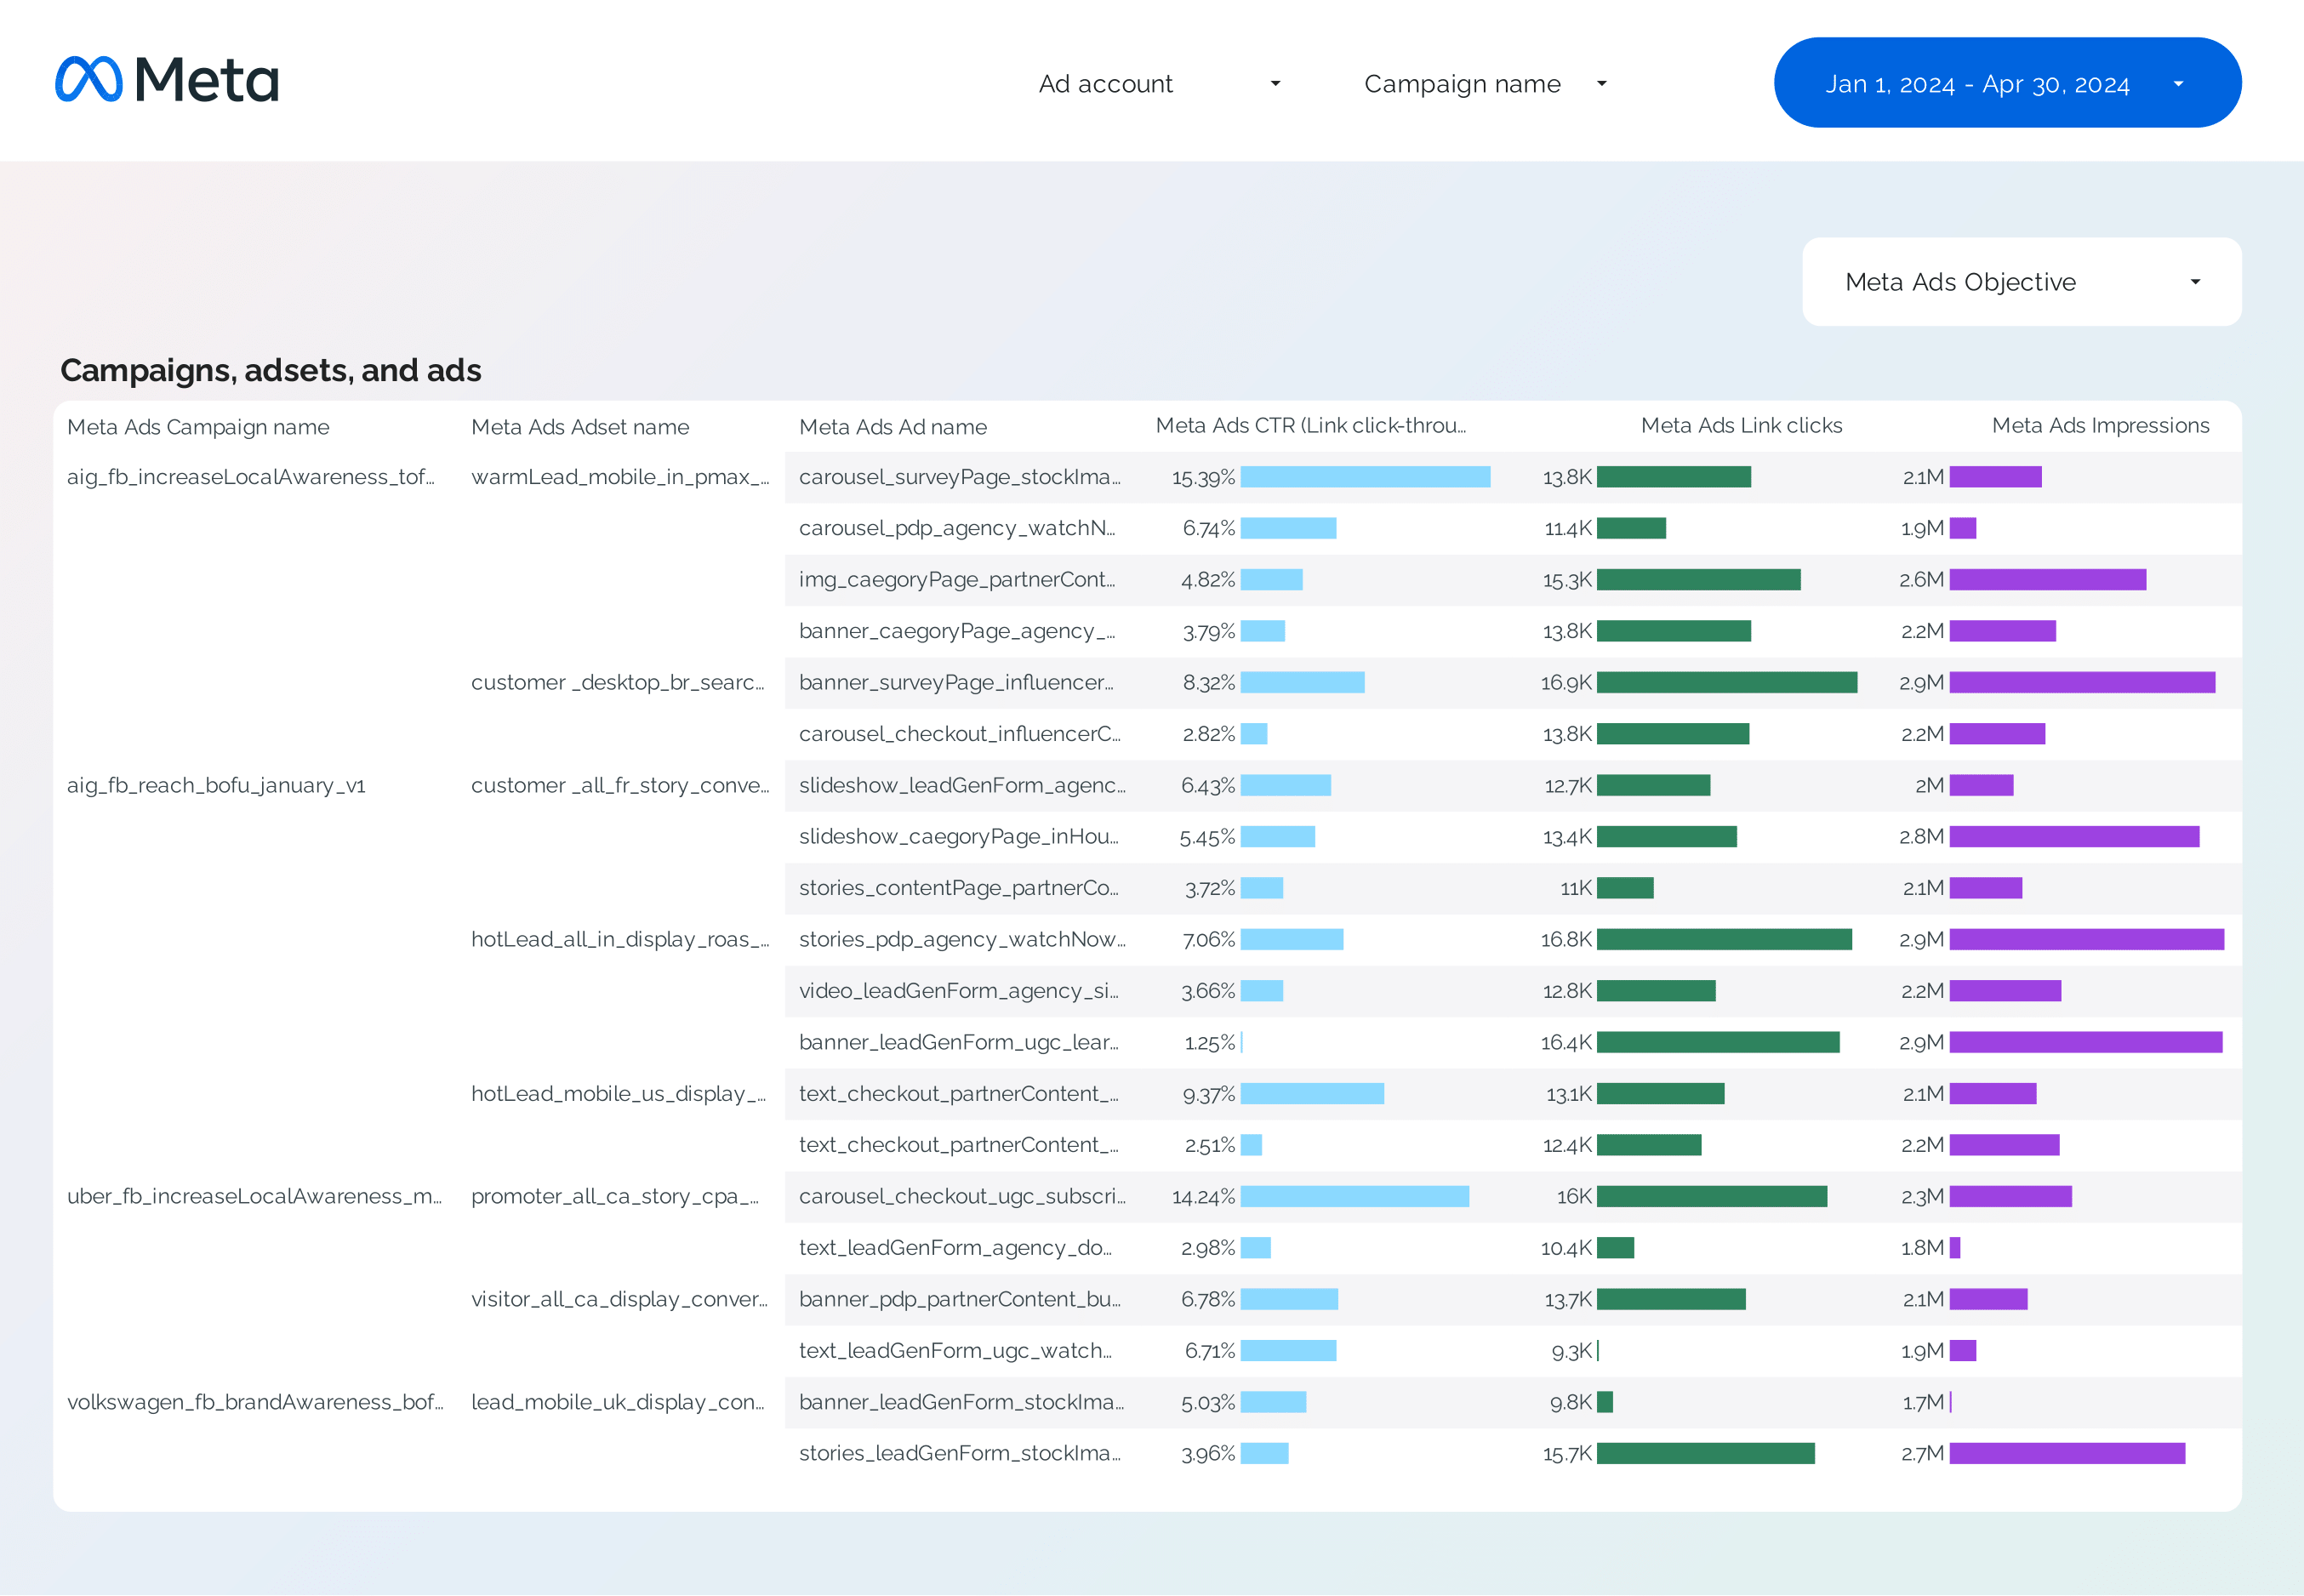
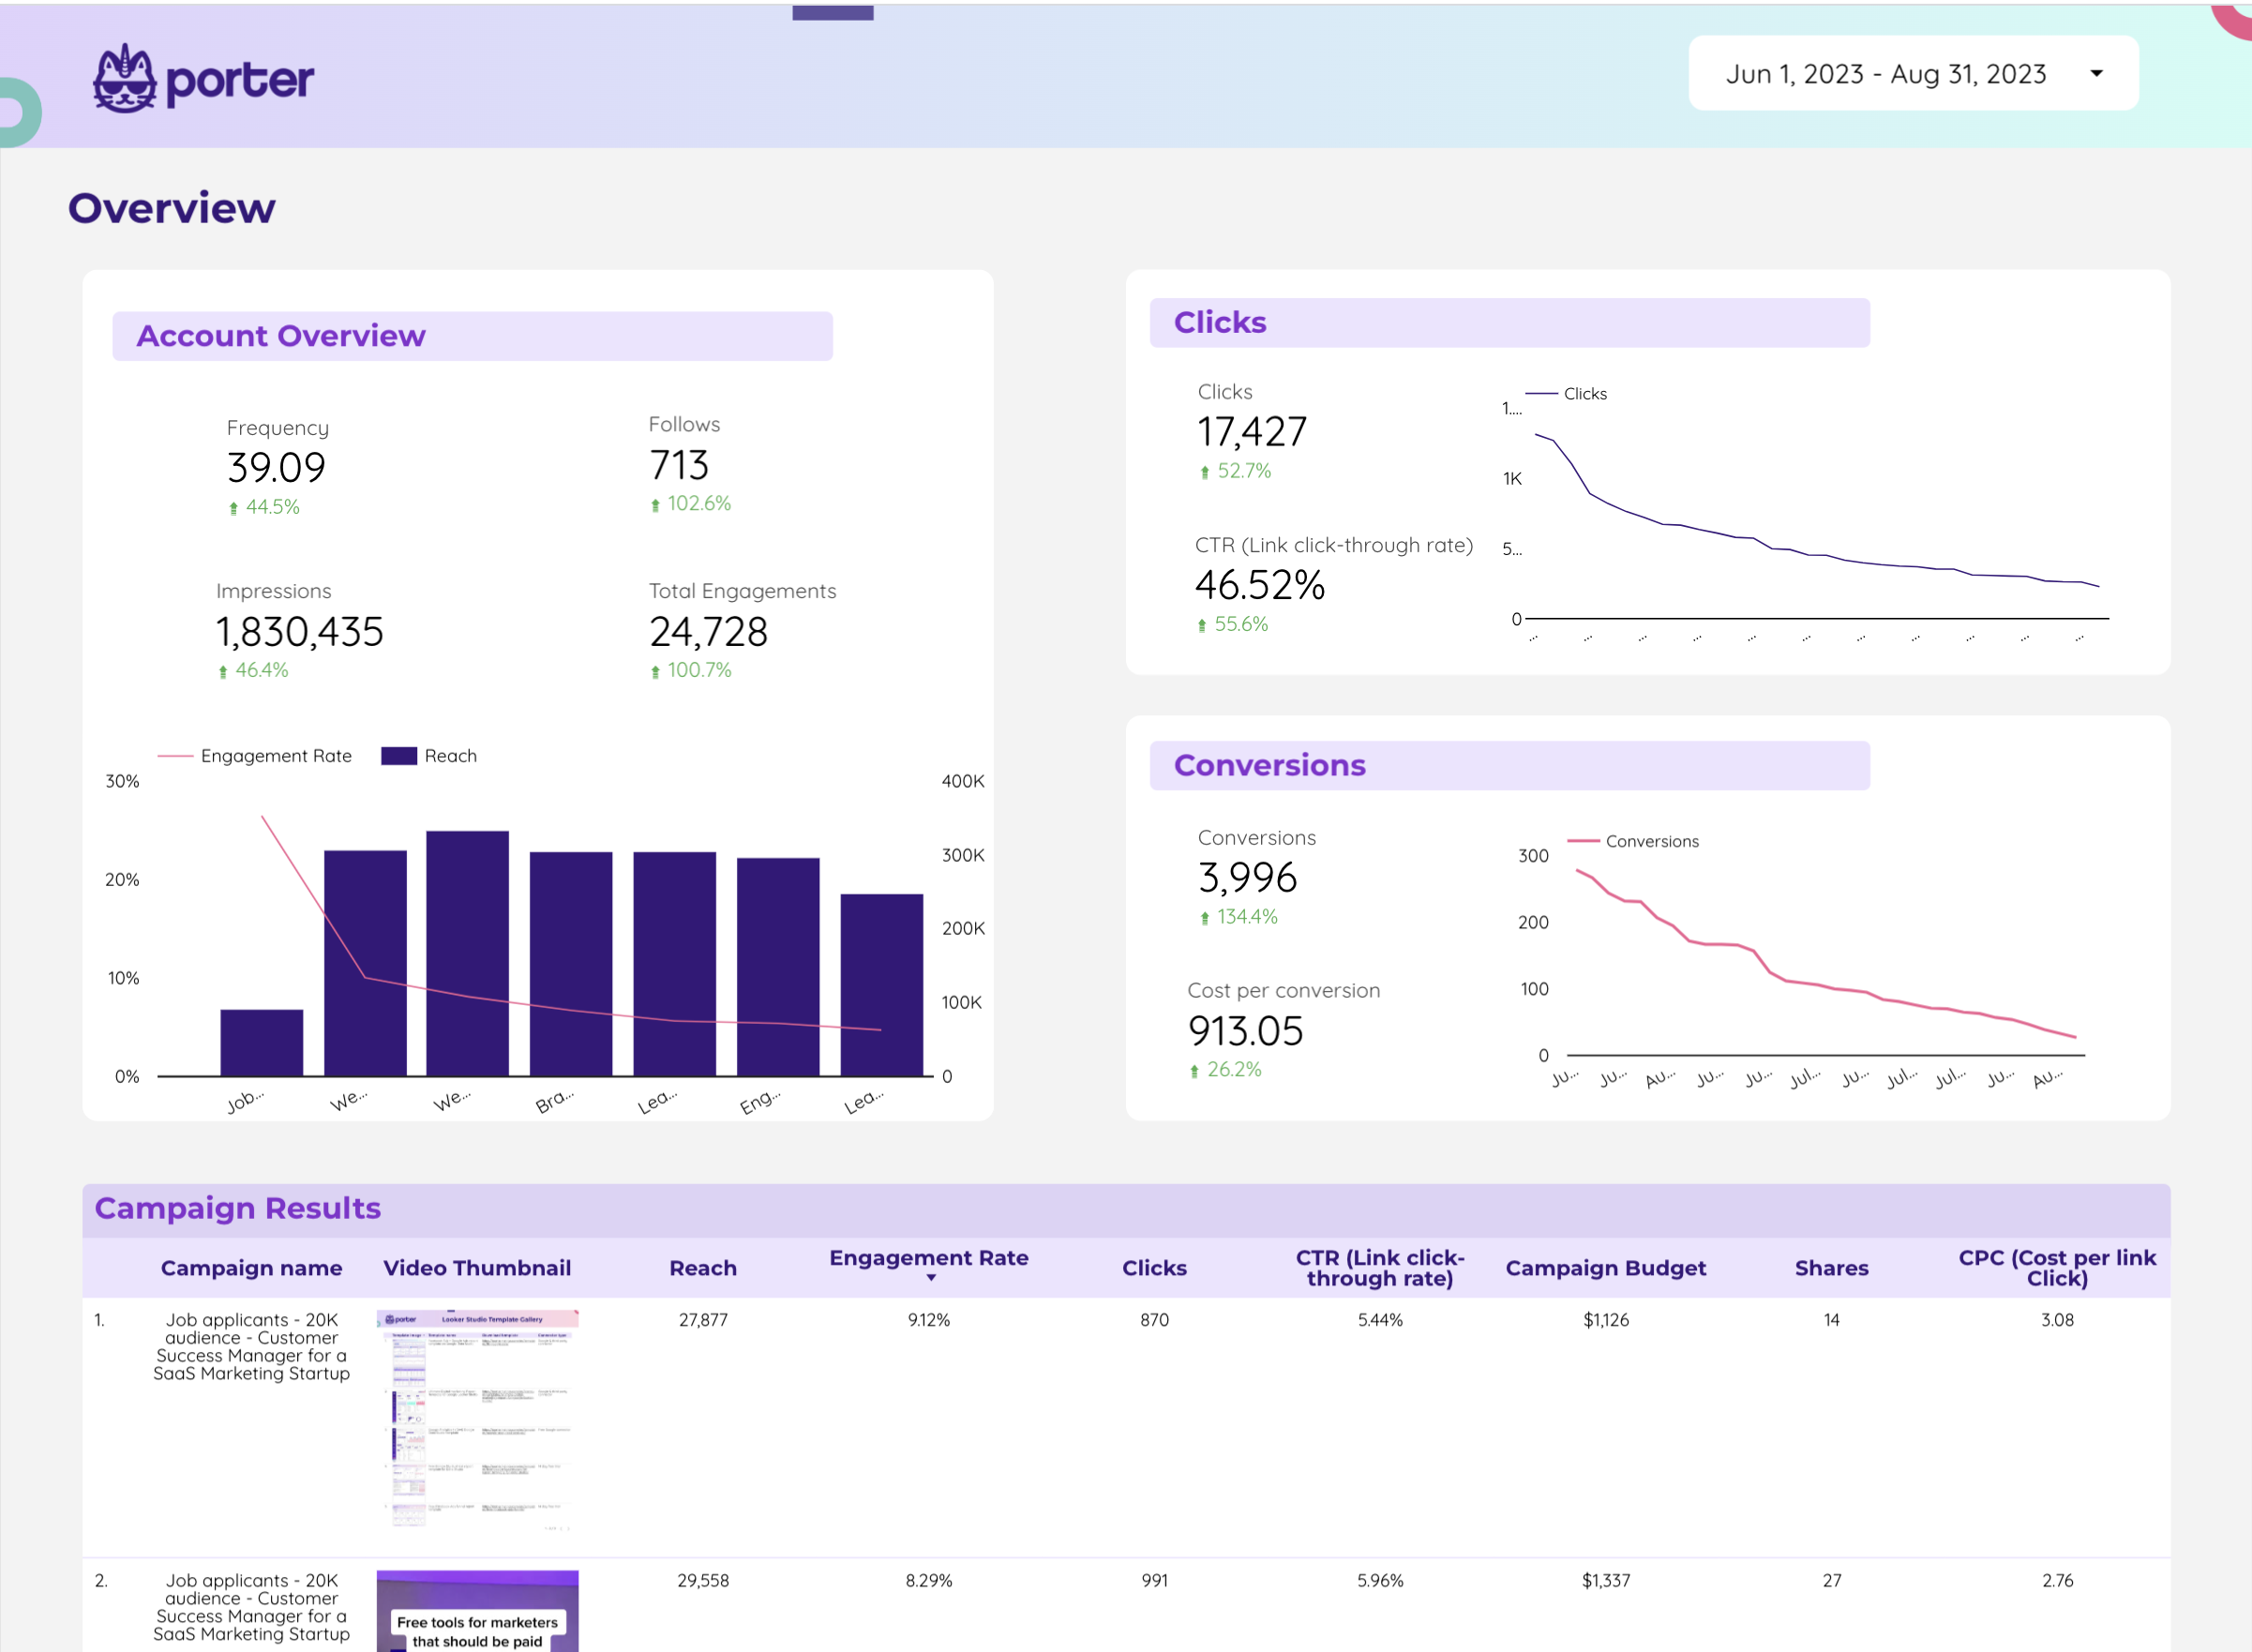
Facebook Ads Campaign performance Report template for Data Studio by Porter
Track campaign reach, impressions → CTR, CPC by campaign → ROAS, CPA per campaign. Segment by campaign, objective, audience.
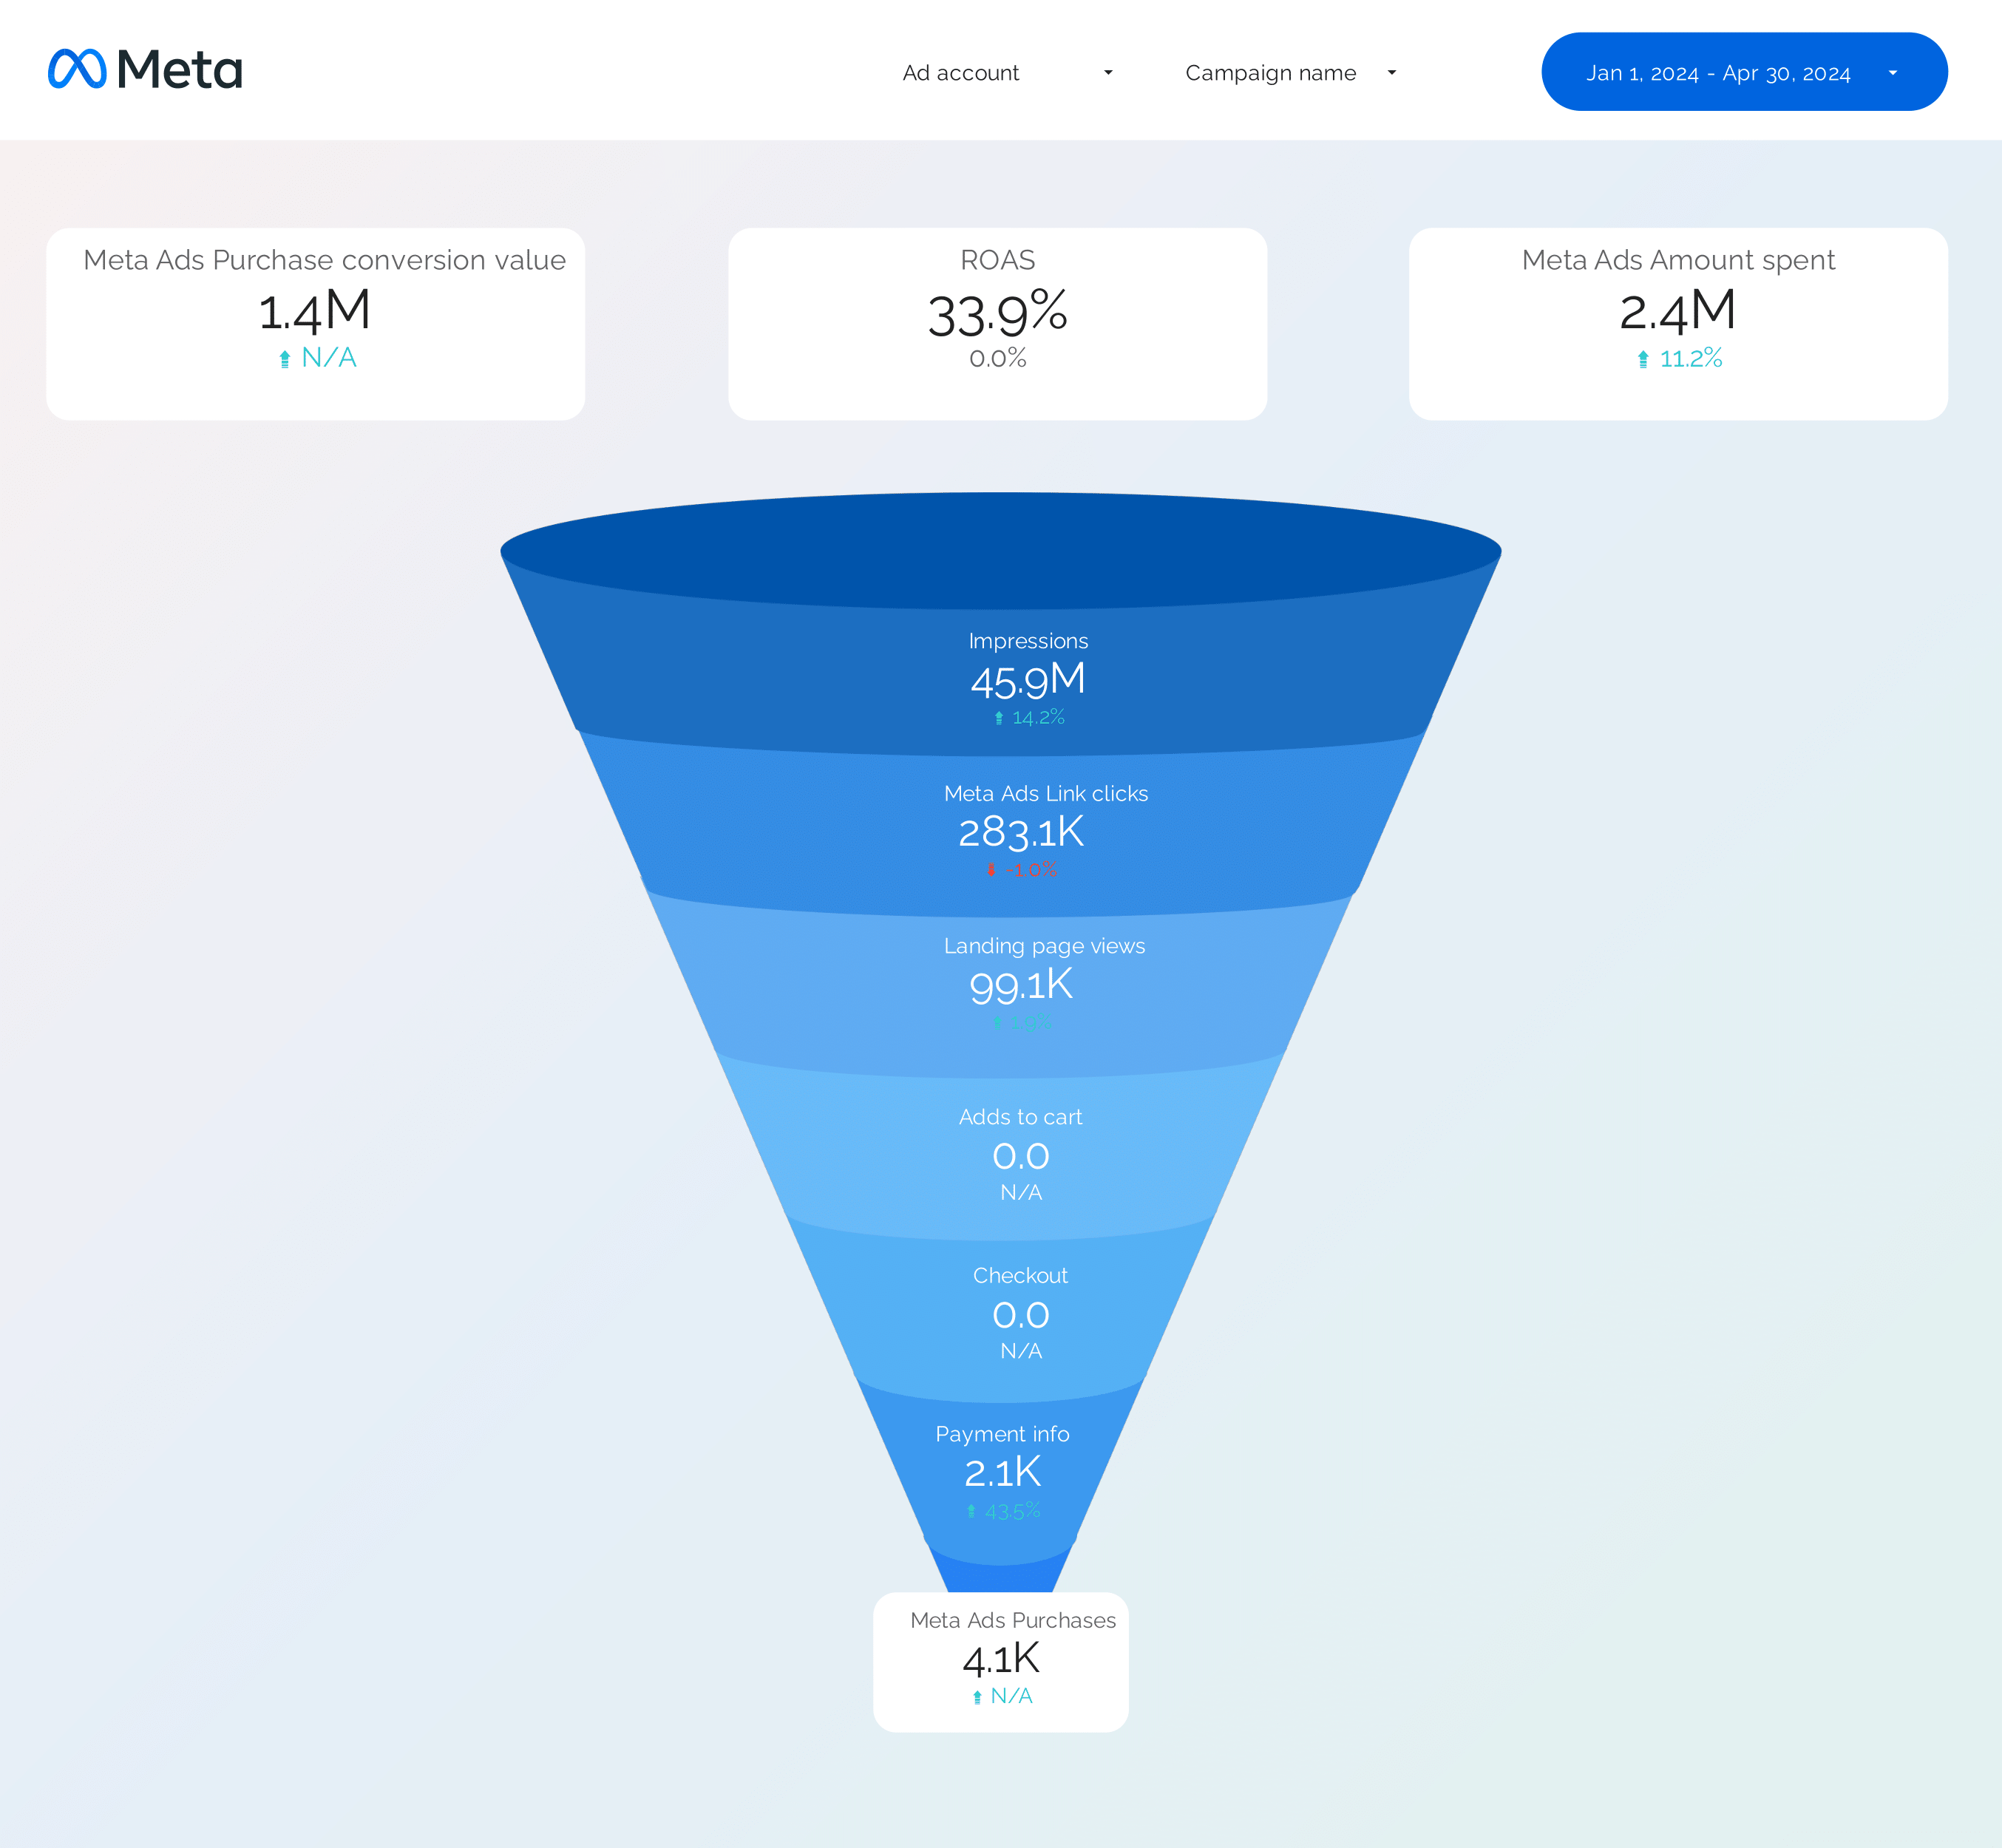
Facebook Ads Funnel Report template for Data Studio by Porter
Track awareness reach → consideration clicks → conversion ROAS by stage. Segment by funnel stage, audience.
Frequency Report template for Data Studio by Porter
Track reach, frequency cap utilization → CTR at different frequencies → conversion rate by frequency. Segment by platform, campaign, frequency.
Paid media Creative performance Report template for Data Studio by Porter
Track creative reach, frequency → CTR, view rate by creative → ROAS per creative, CPA. Segment by creative format, platform.
Twitter Ads Report template for Data Studio by Porter
Track impressions, reach → CTR, engagement rate, CPE → conversions, CPA. Segment by campaign, creative, audience.
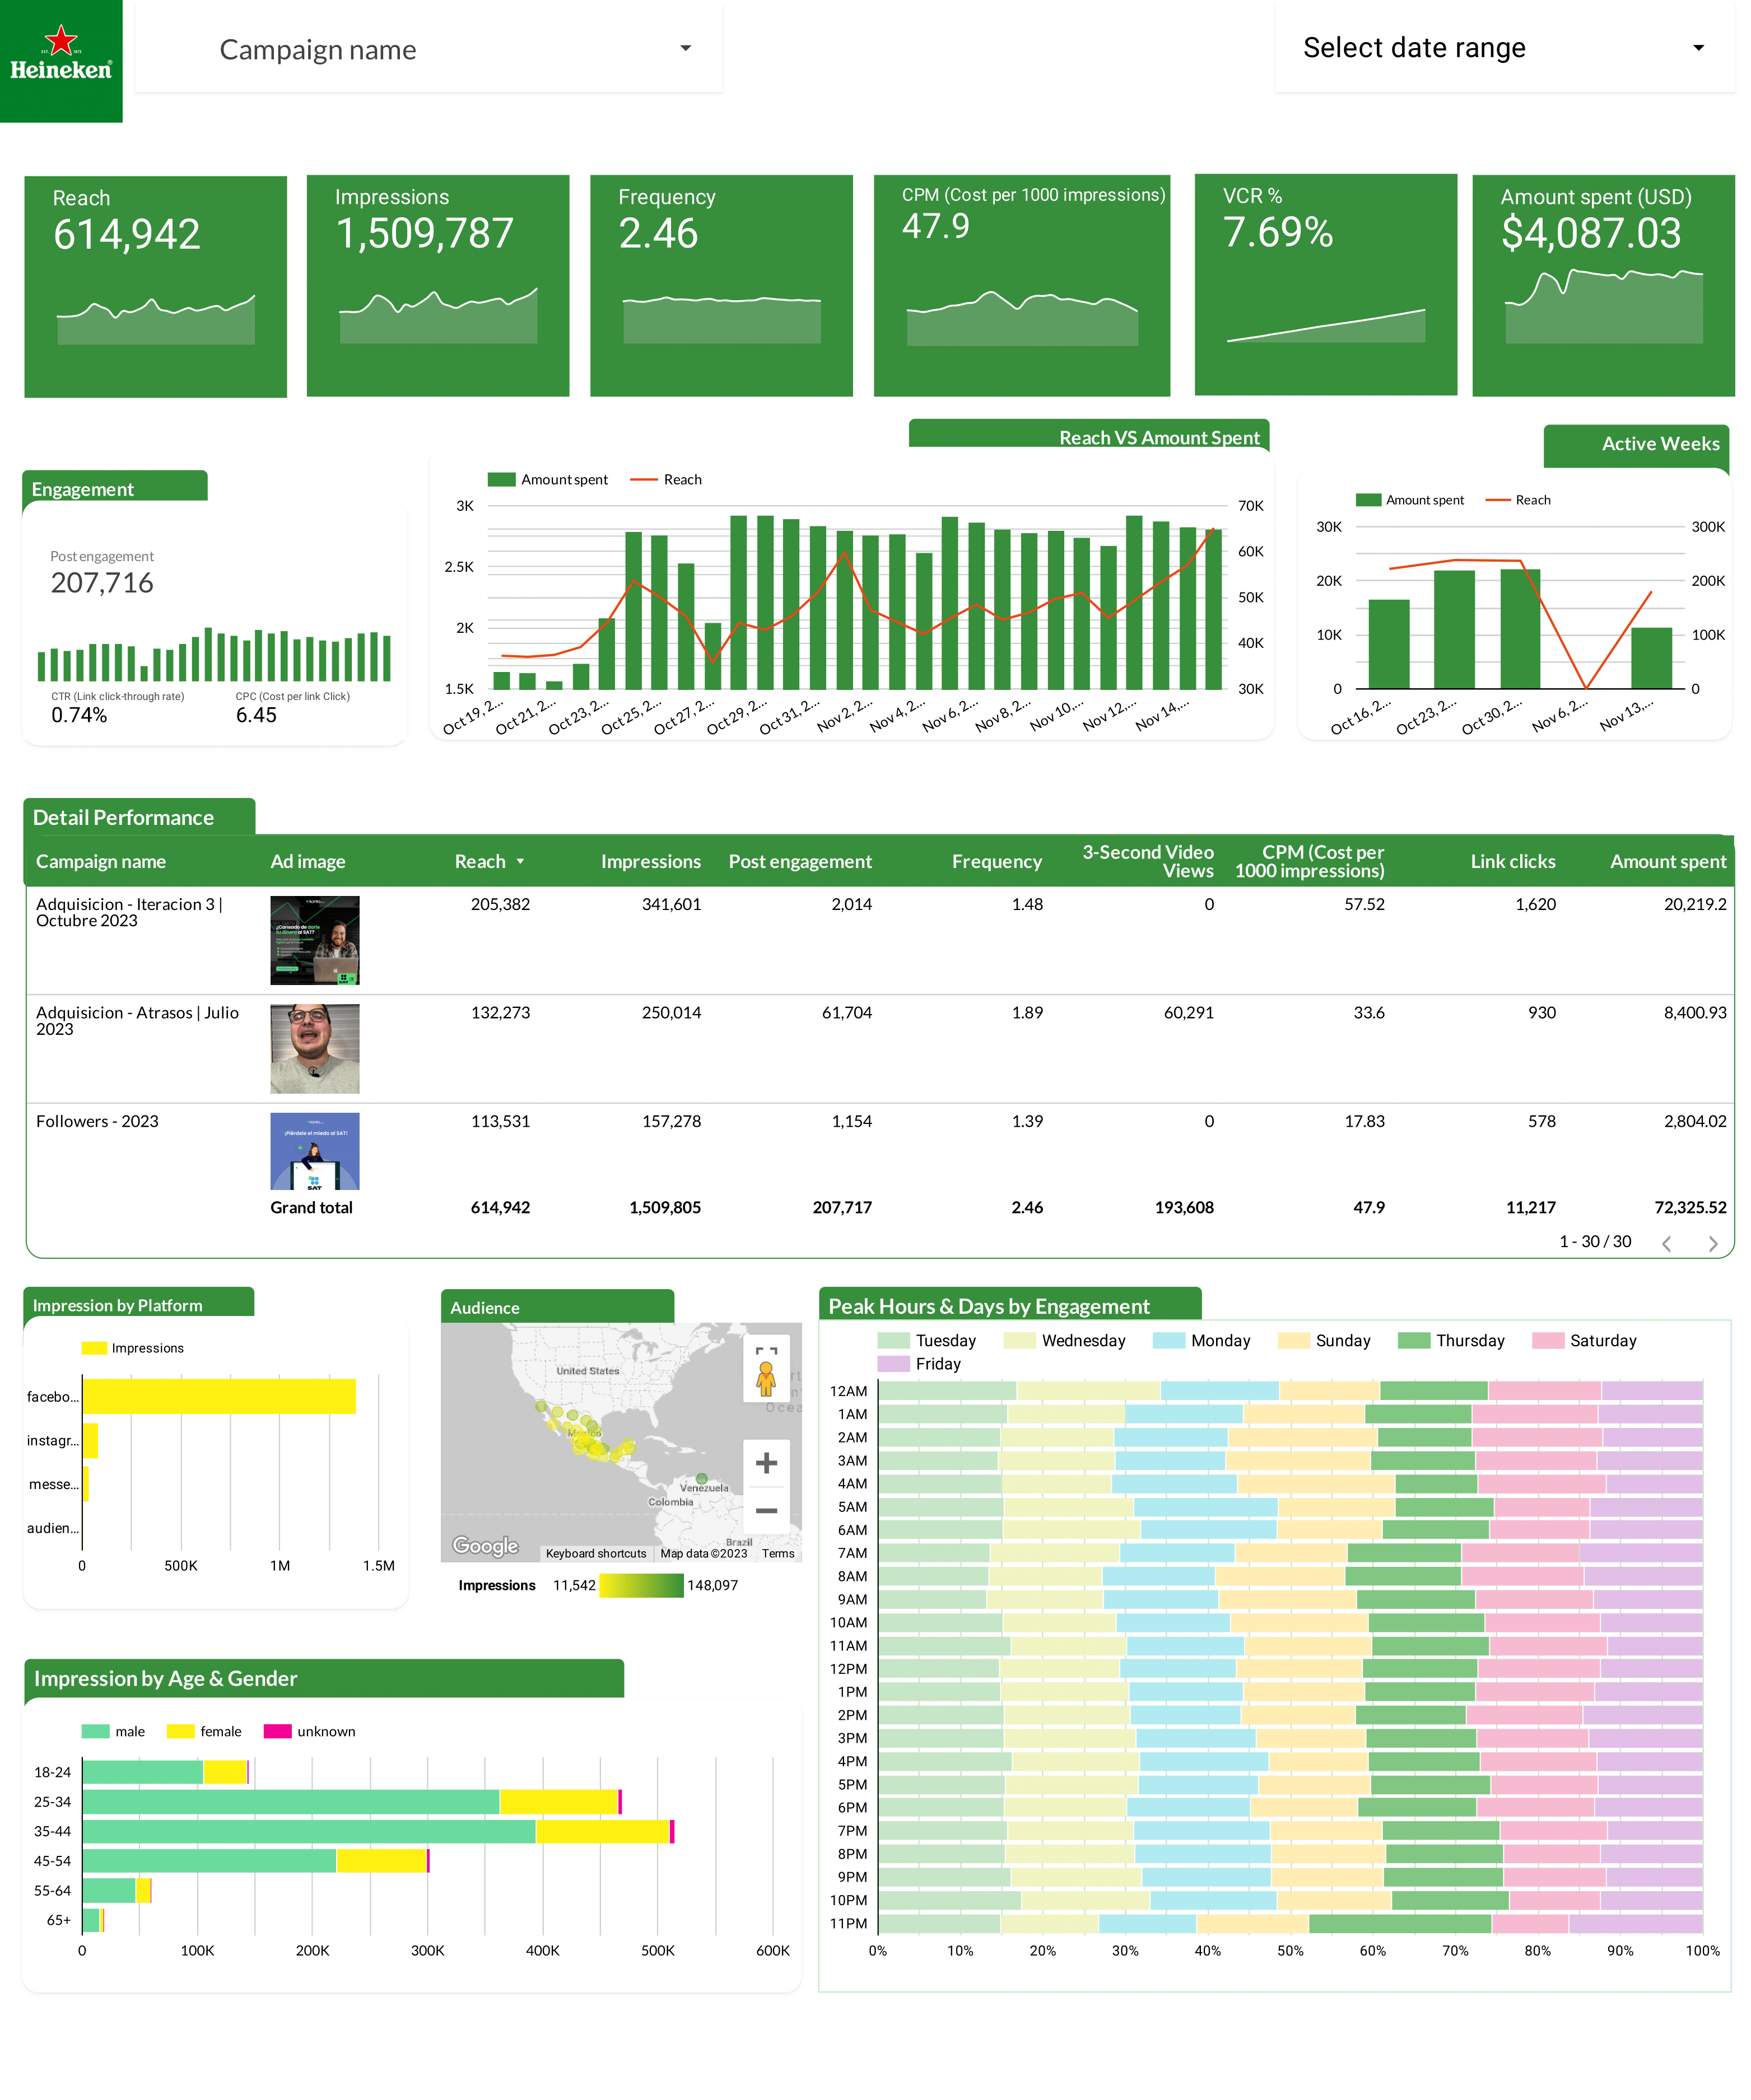
Facebook Ads Report template for Data Studio by Heineken
Track ad impressions by creative → CTR, hook rate, hold rate → ROAS per creative, CPA. Segment by creative format, copy.

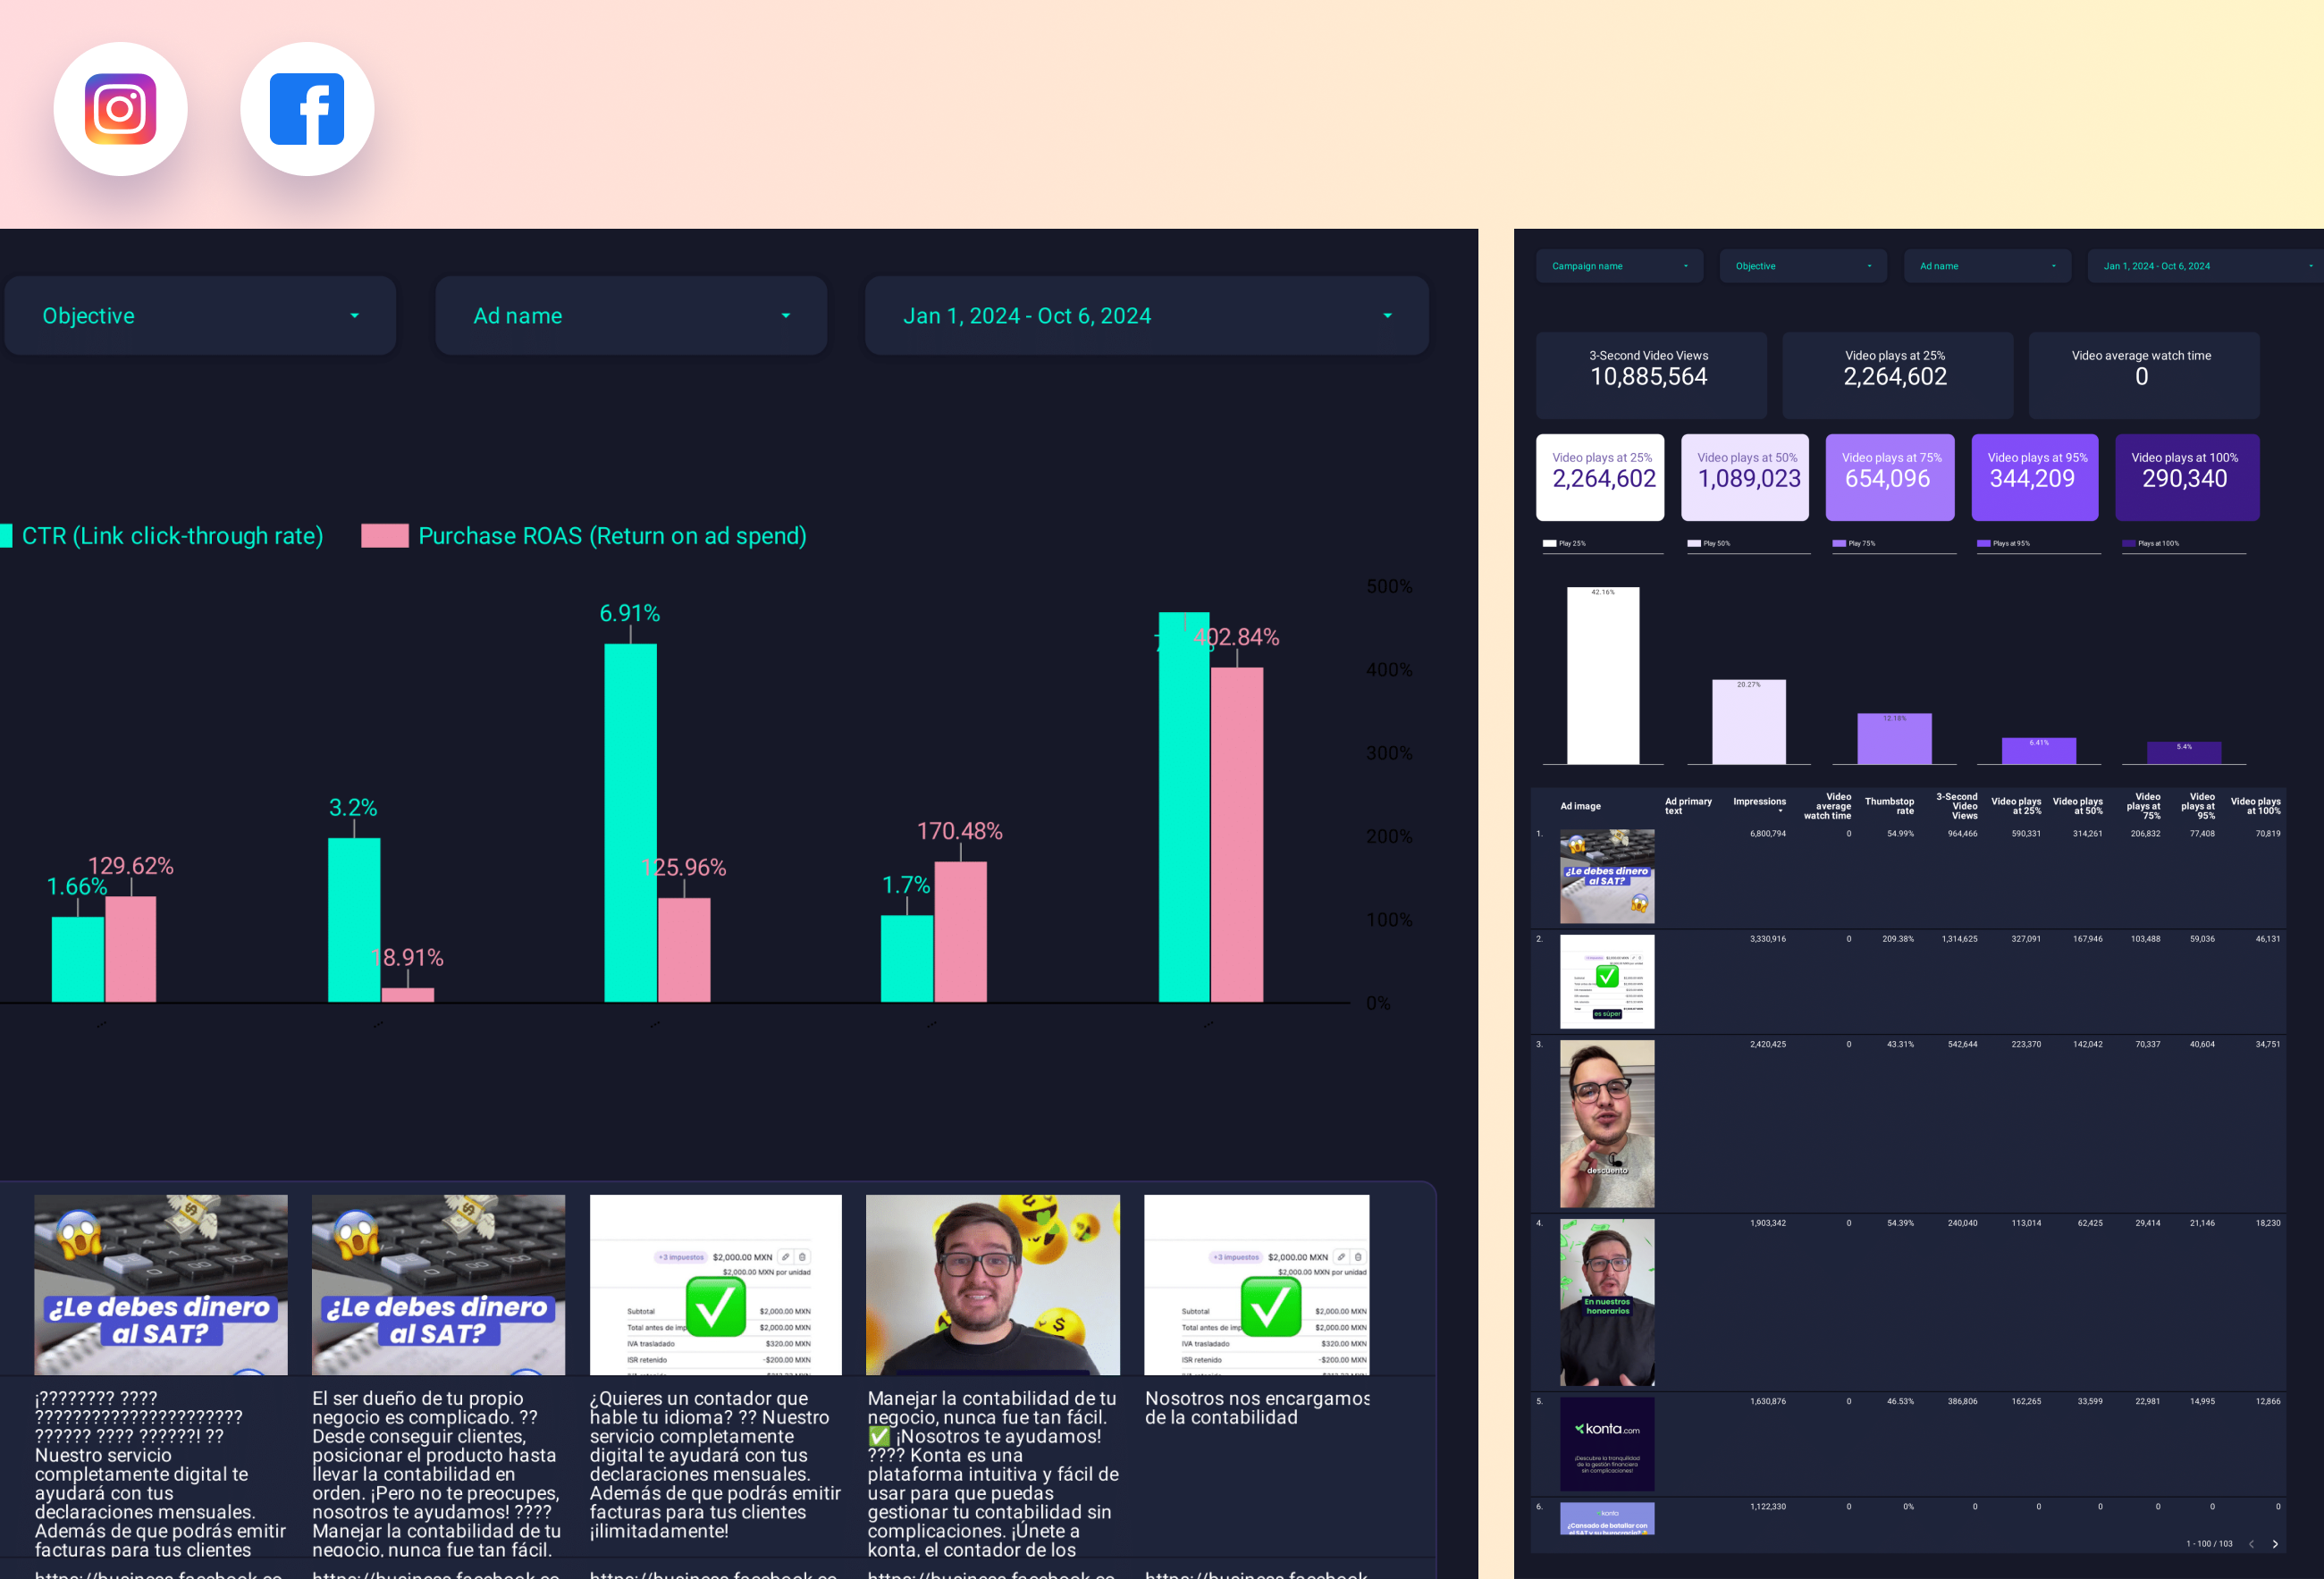
Facebook Ads Creative performance Report template for Data Studio by Porter
Track ad impressions by creative → CTR, hook rate, hold rate → ROAS per creative, CPA. Segment by creative format, copy.
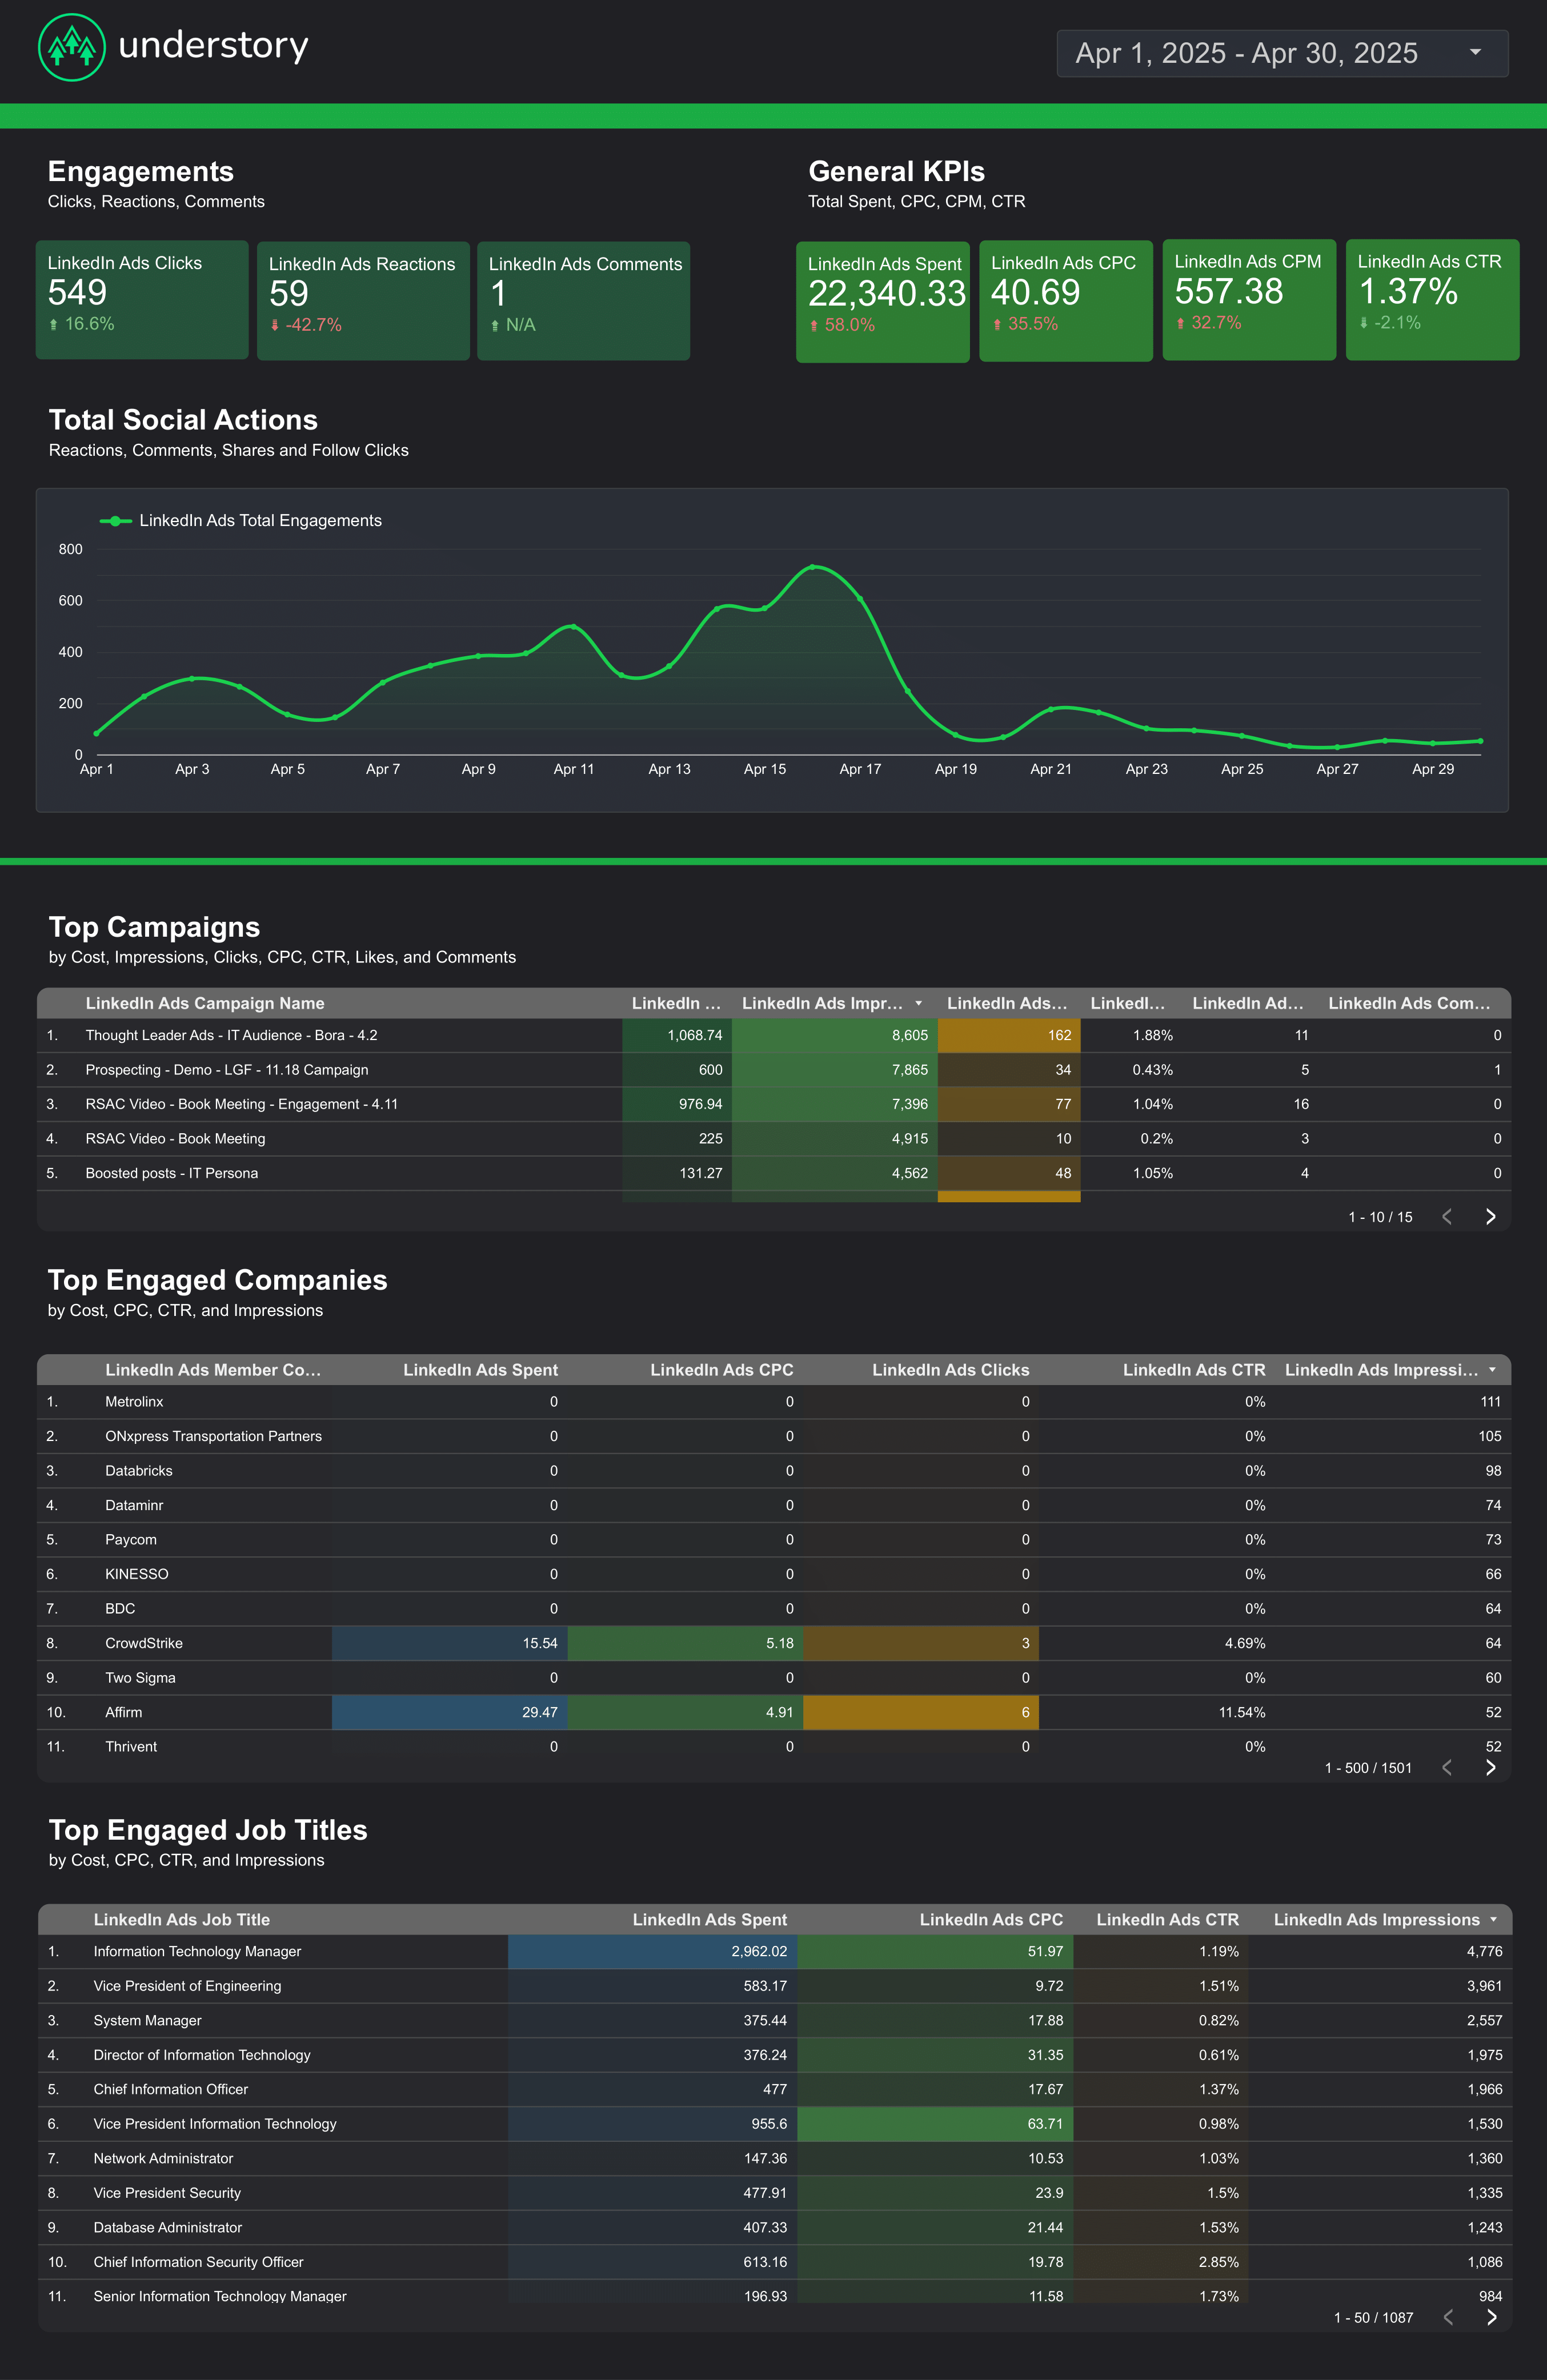
LinkedIn Ads Report template for Data Studio by Understory
Track impressions, unique reach → CTR, CPC, engagement rate → leads, CPL, conversion rate. Segment by campaign, job title, company.
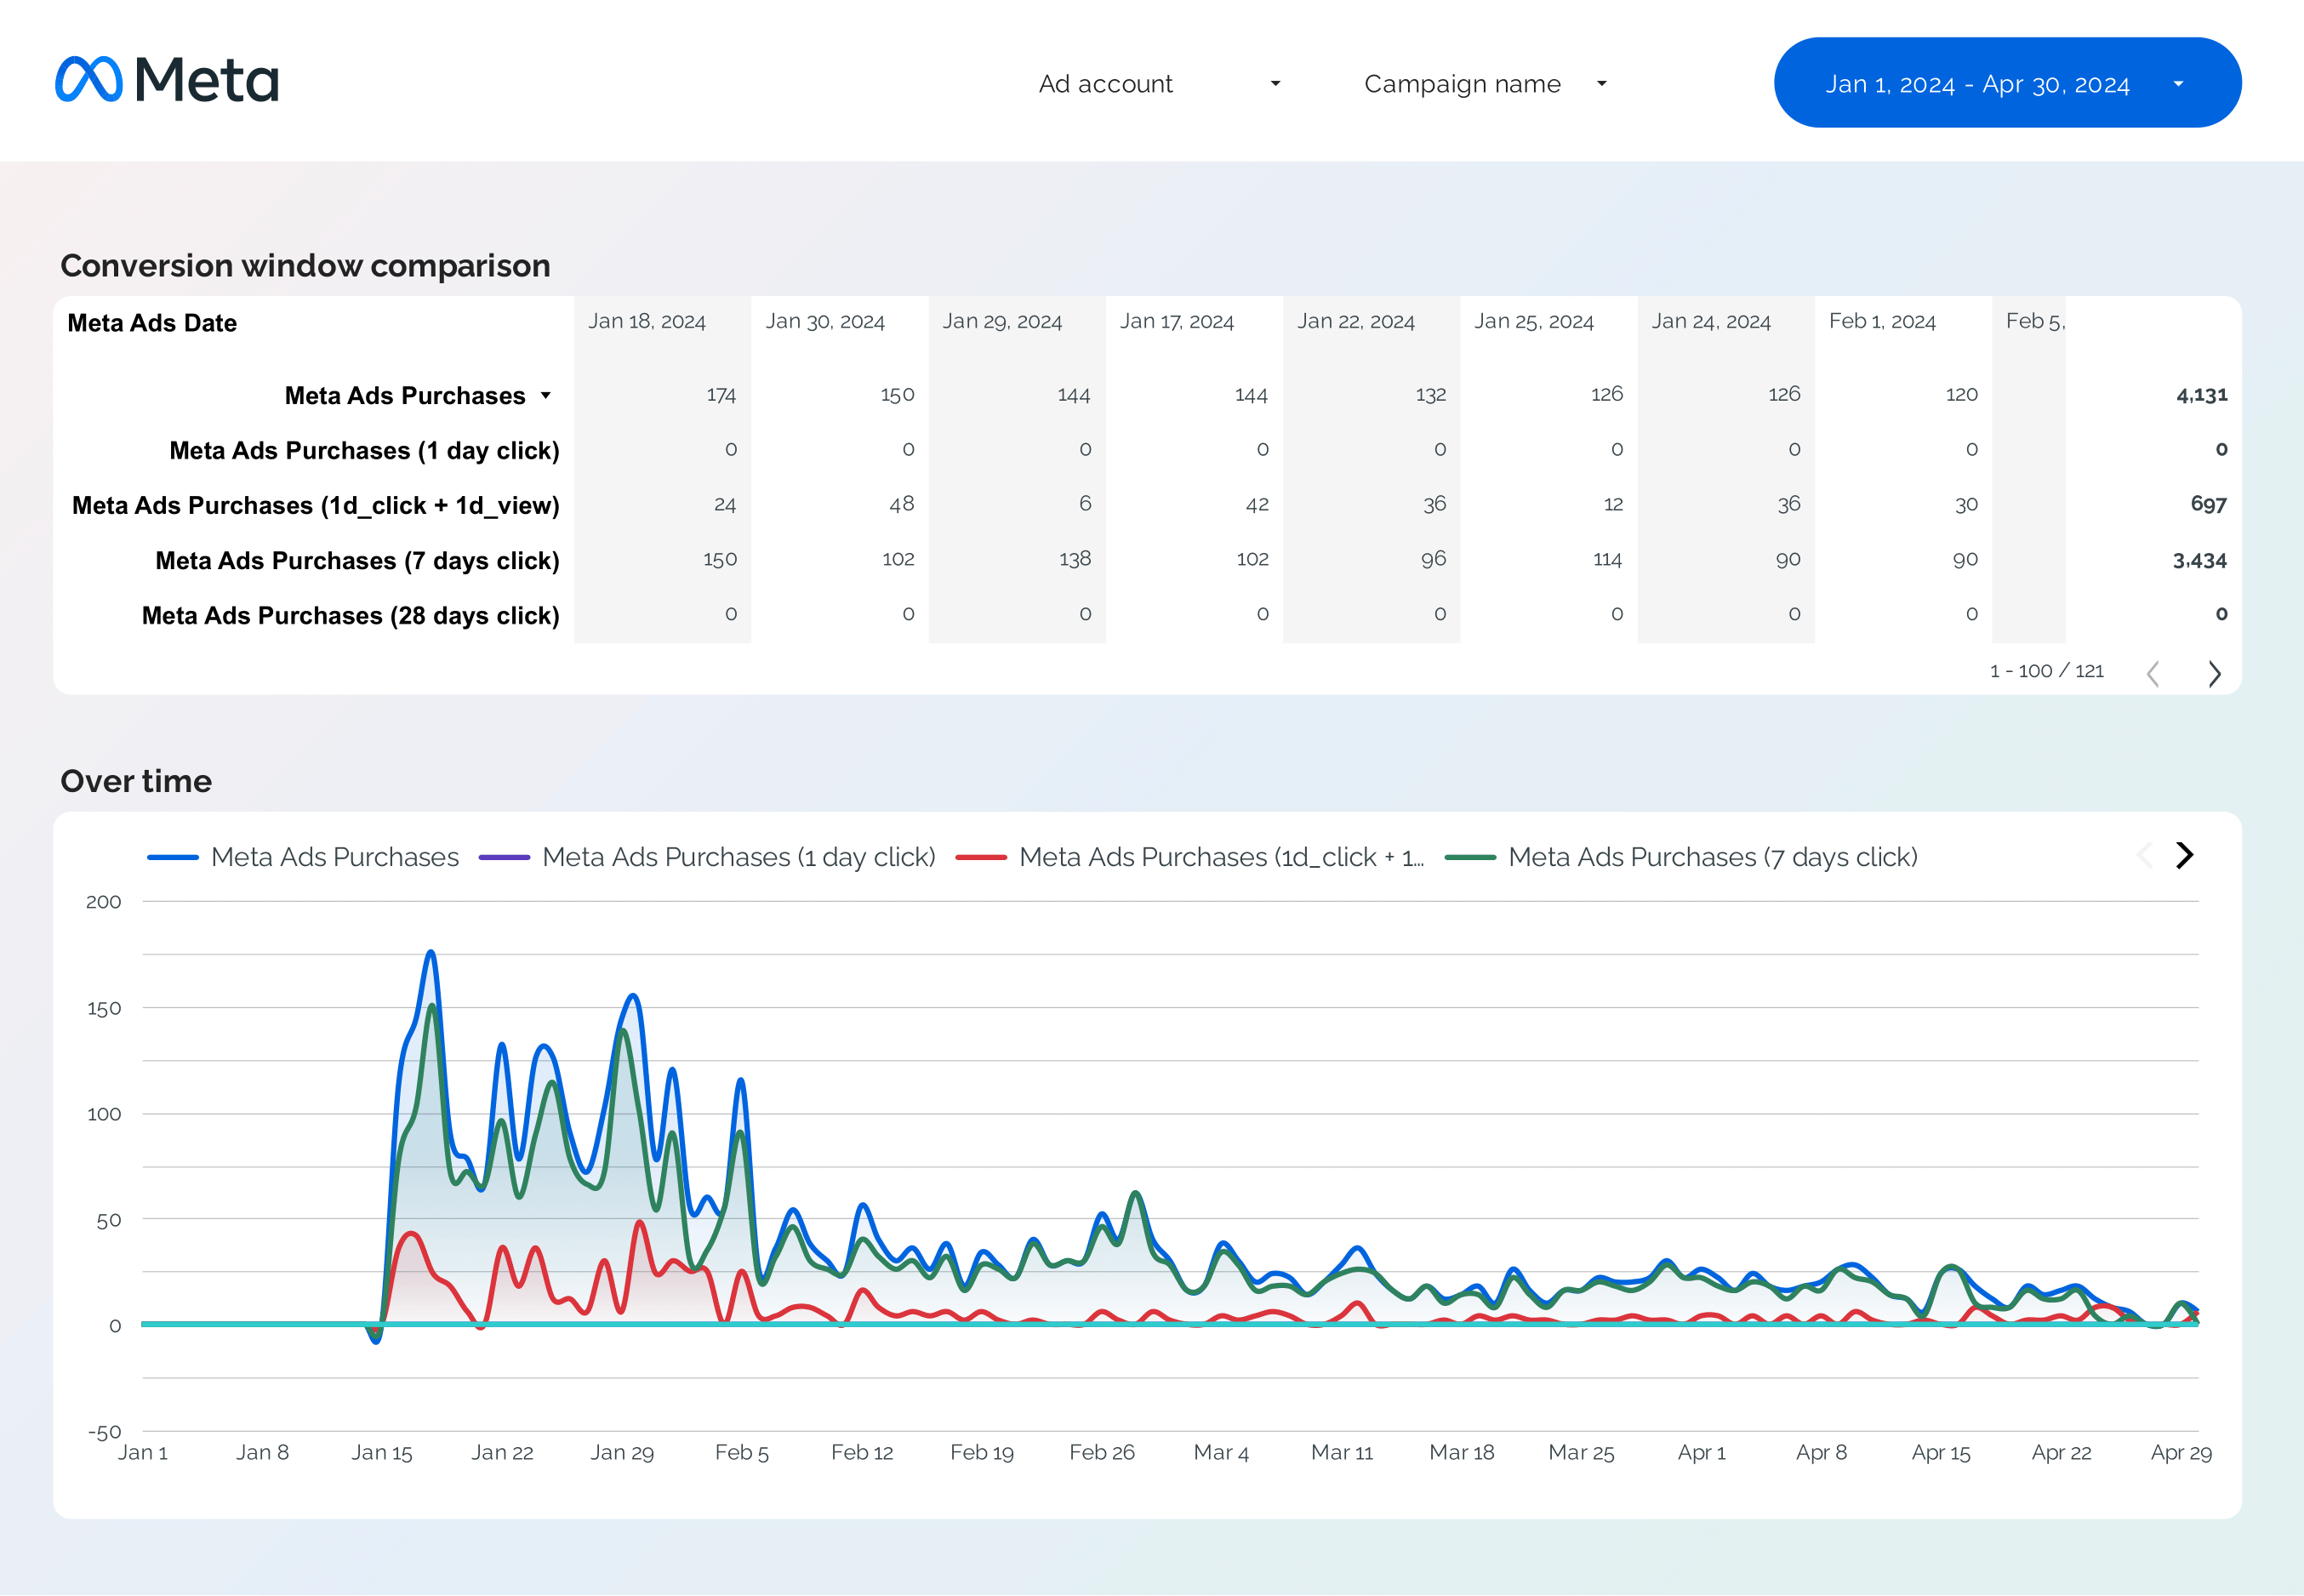
Facebook Ads Attribution Report template for Data Studio by Porter
Track attributed touchpoints → view-through vs click-through → attributed conversions by window. Segment by attribution window, campaign.

