

Browse 23 Content Marketing Report Templates for Data Studio
Choose from our library of free, white-label content marketing templates. Each template tracks the full marketing funnel: visibility (impressions, reach), engagement (CTR, interactions), and conversion (leads, revenue). Organized following the SUMAS framework with breakdowns by channel, campaign, audience, and time period.
Social Media Engagement Report template for Data Studio by Porter
Track total reach, impressions → likes, comments, shares, saves → engagement-to-click rate. Segment by post type, platform, day.

SEO Keyword research Report template for Data Studio by Porter
Track keyword search volume, SERP visibility → CTR per keyword, position changes → organic traffic, keyword conversions. Segment by keyword cluster, intent, difficulty.
SEO Keyword ranking tracker Report template for Data Studio by Porter
Track ranking positions, SERP features → CTR by position, impression trends → traffic from ranked keywords. Segment by keyword, URL, position change.
SEO Serp tracking Report template for Data Studio by Porter
Track SERP positions, featured snippets → CTR trends, position volatility → organic click share, ranking gains. Segment by keyword, competitor, SERP feature.
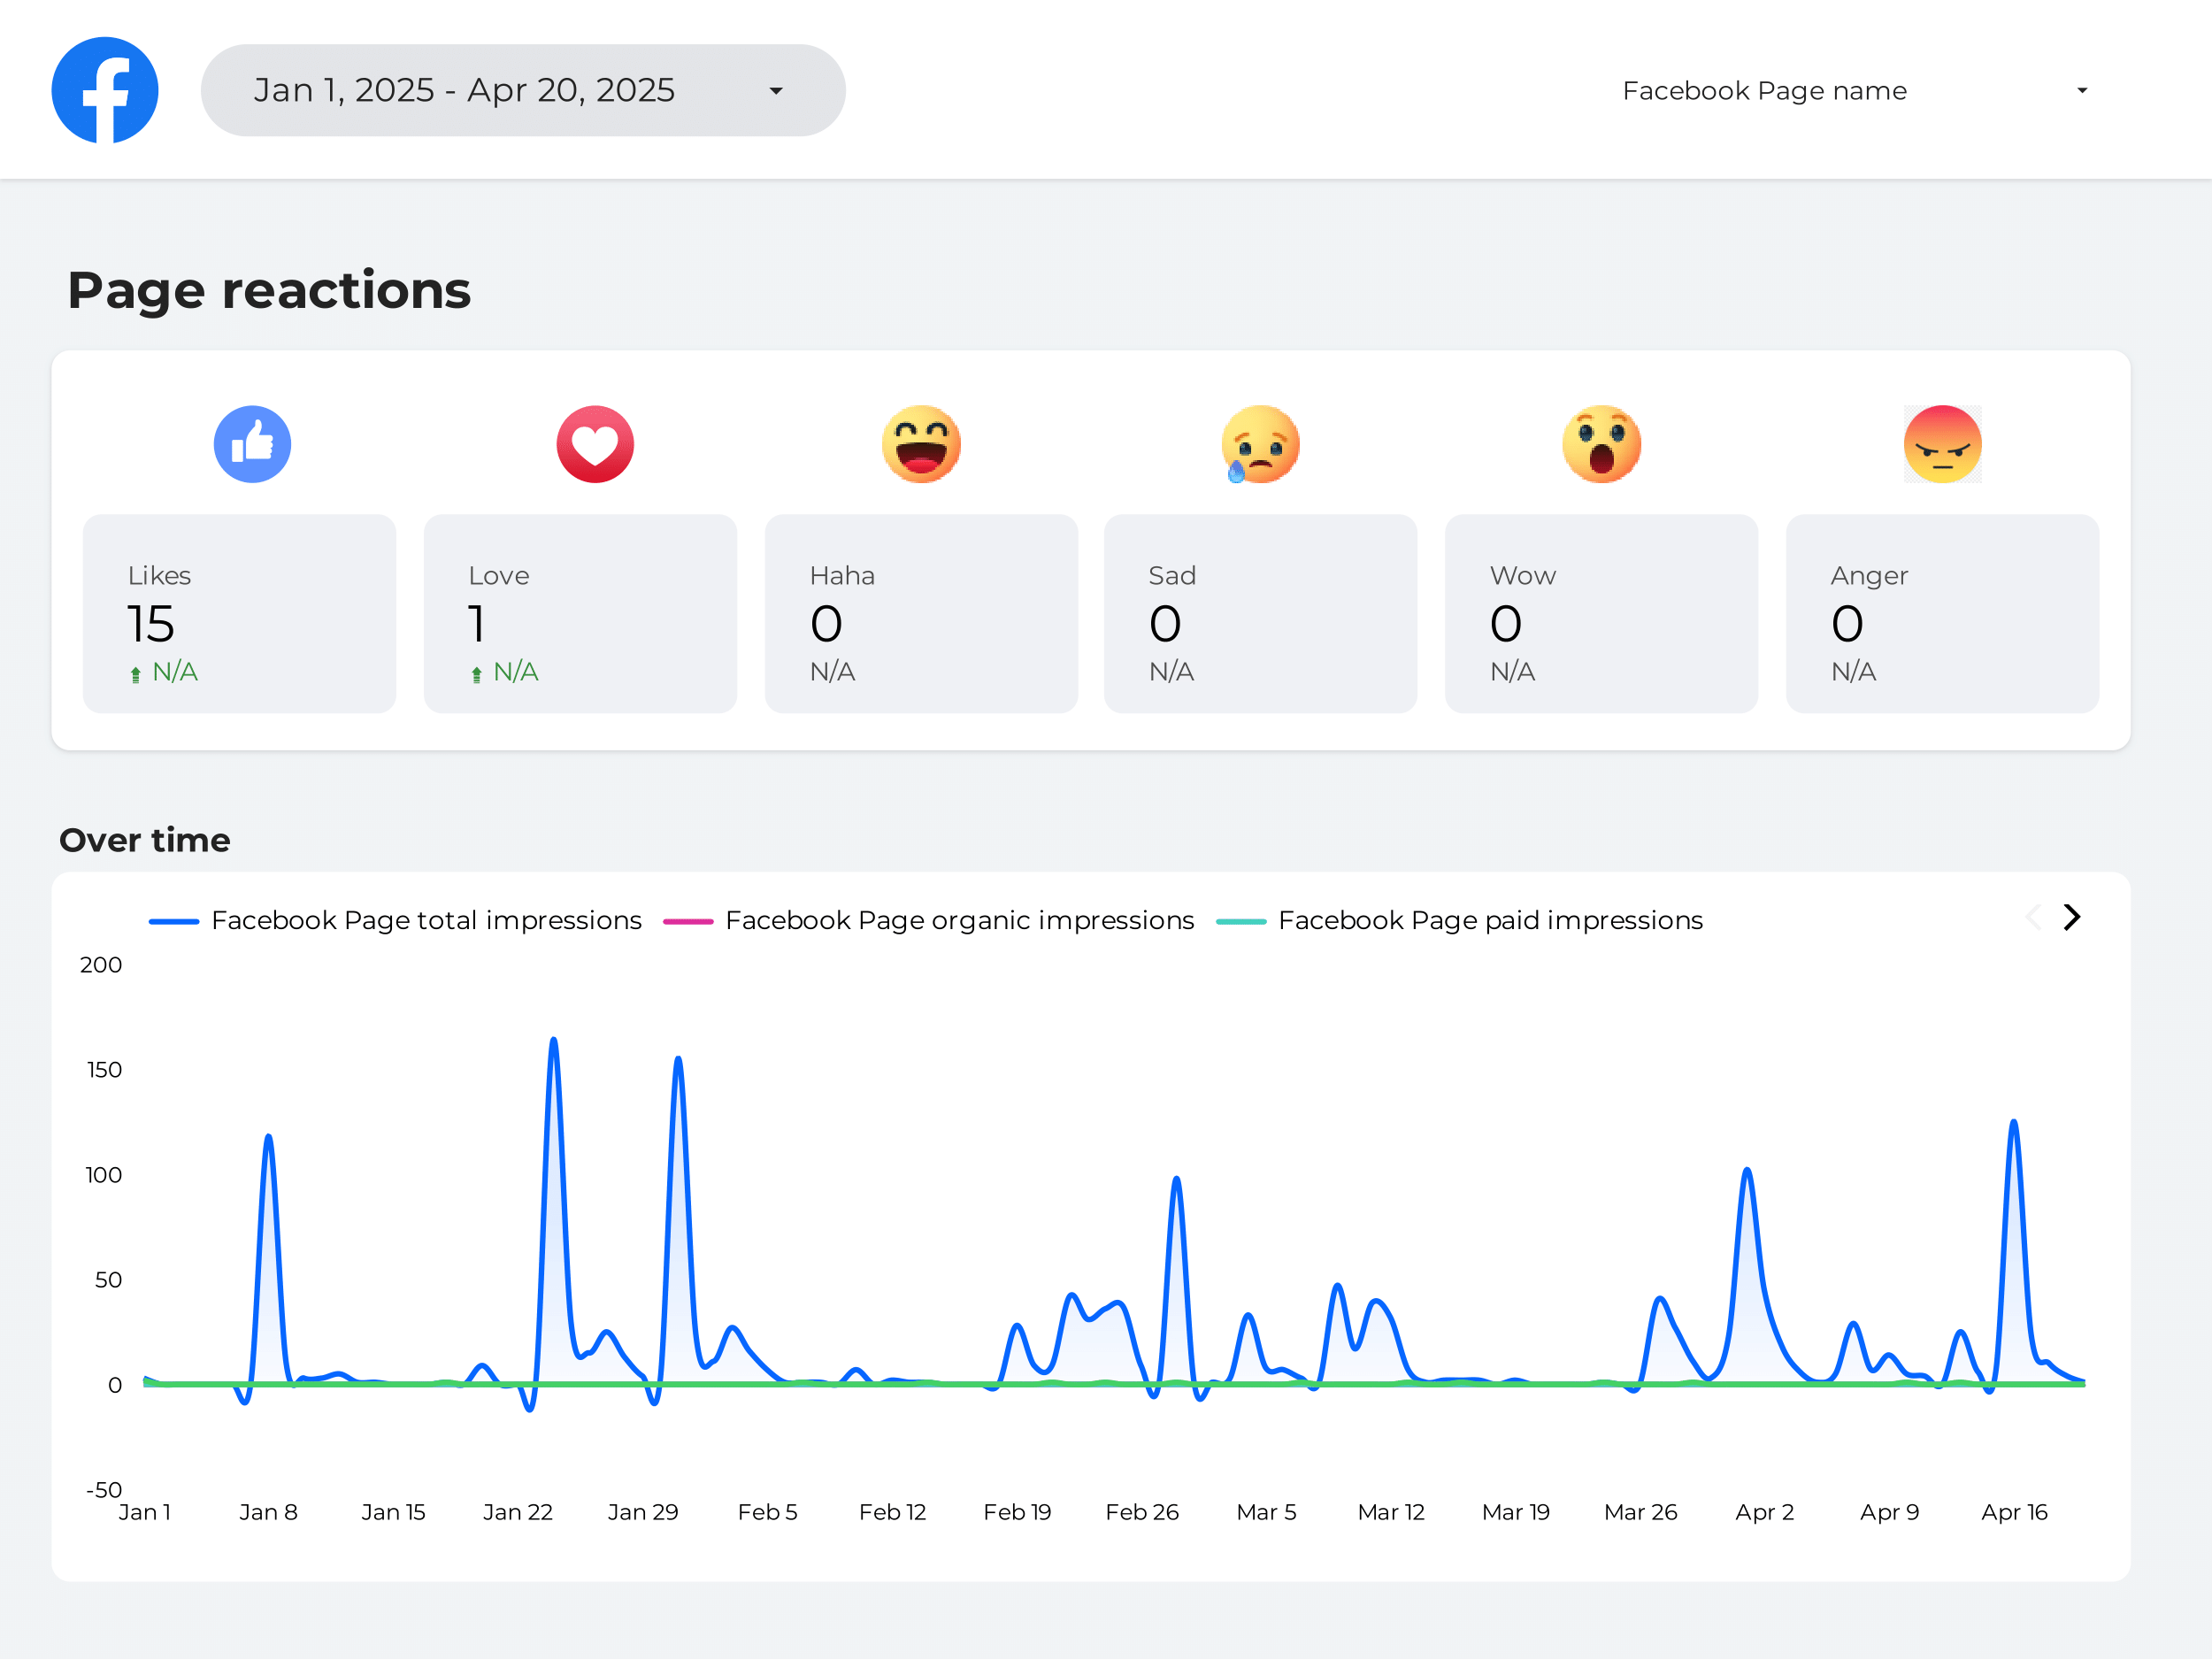
Engagement rate Report template for Data Studio by Porter
Track total reach, impressions → engagement rate by type → engagement-to-click conversion. Segment by platform, format, time.
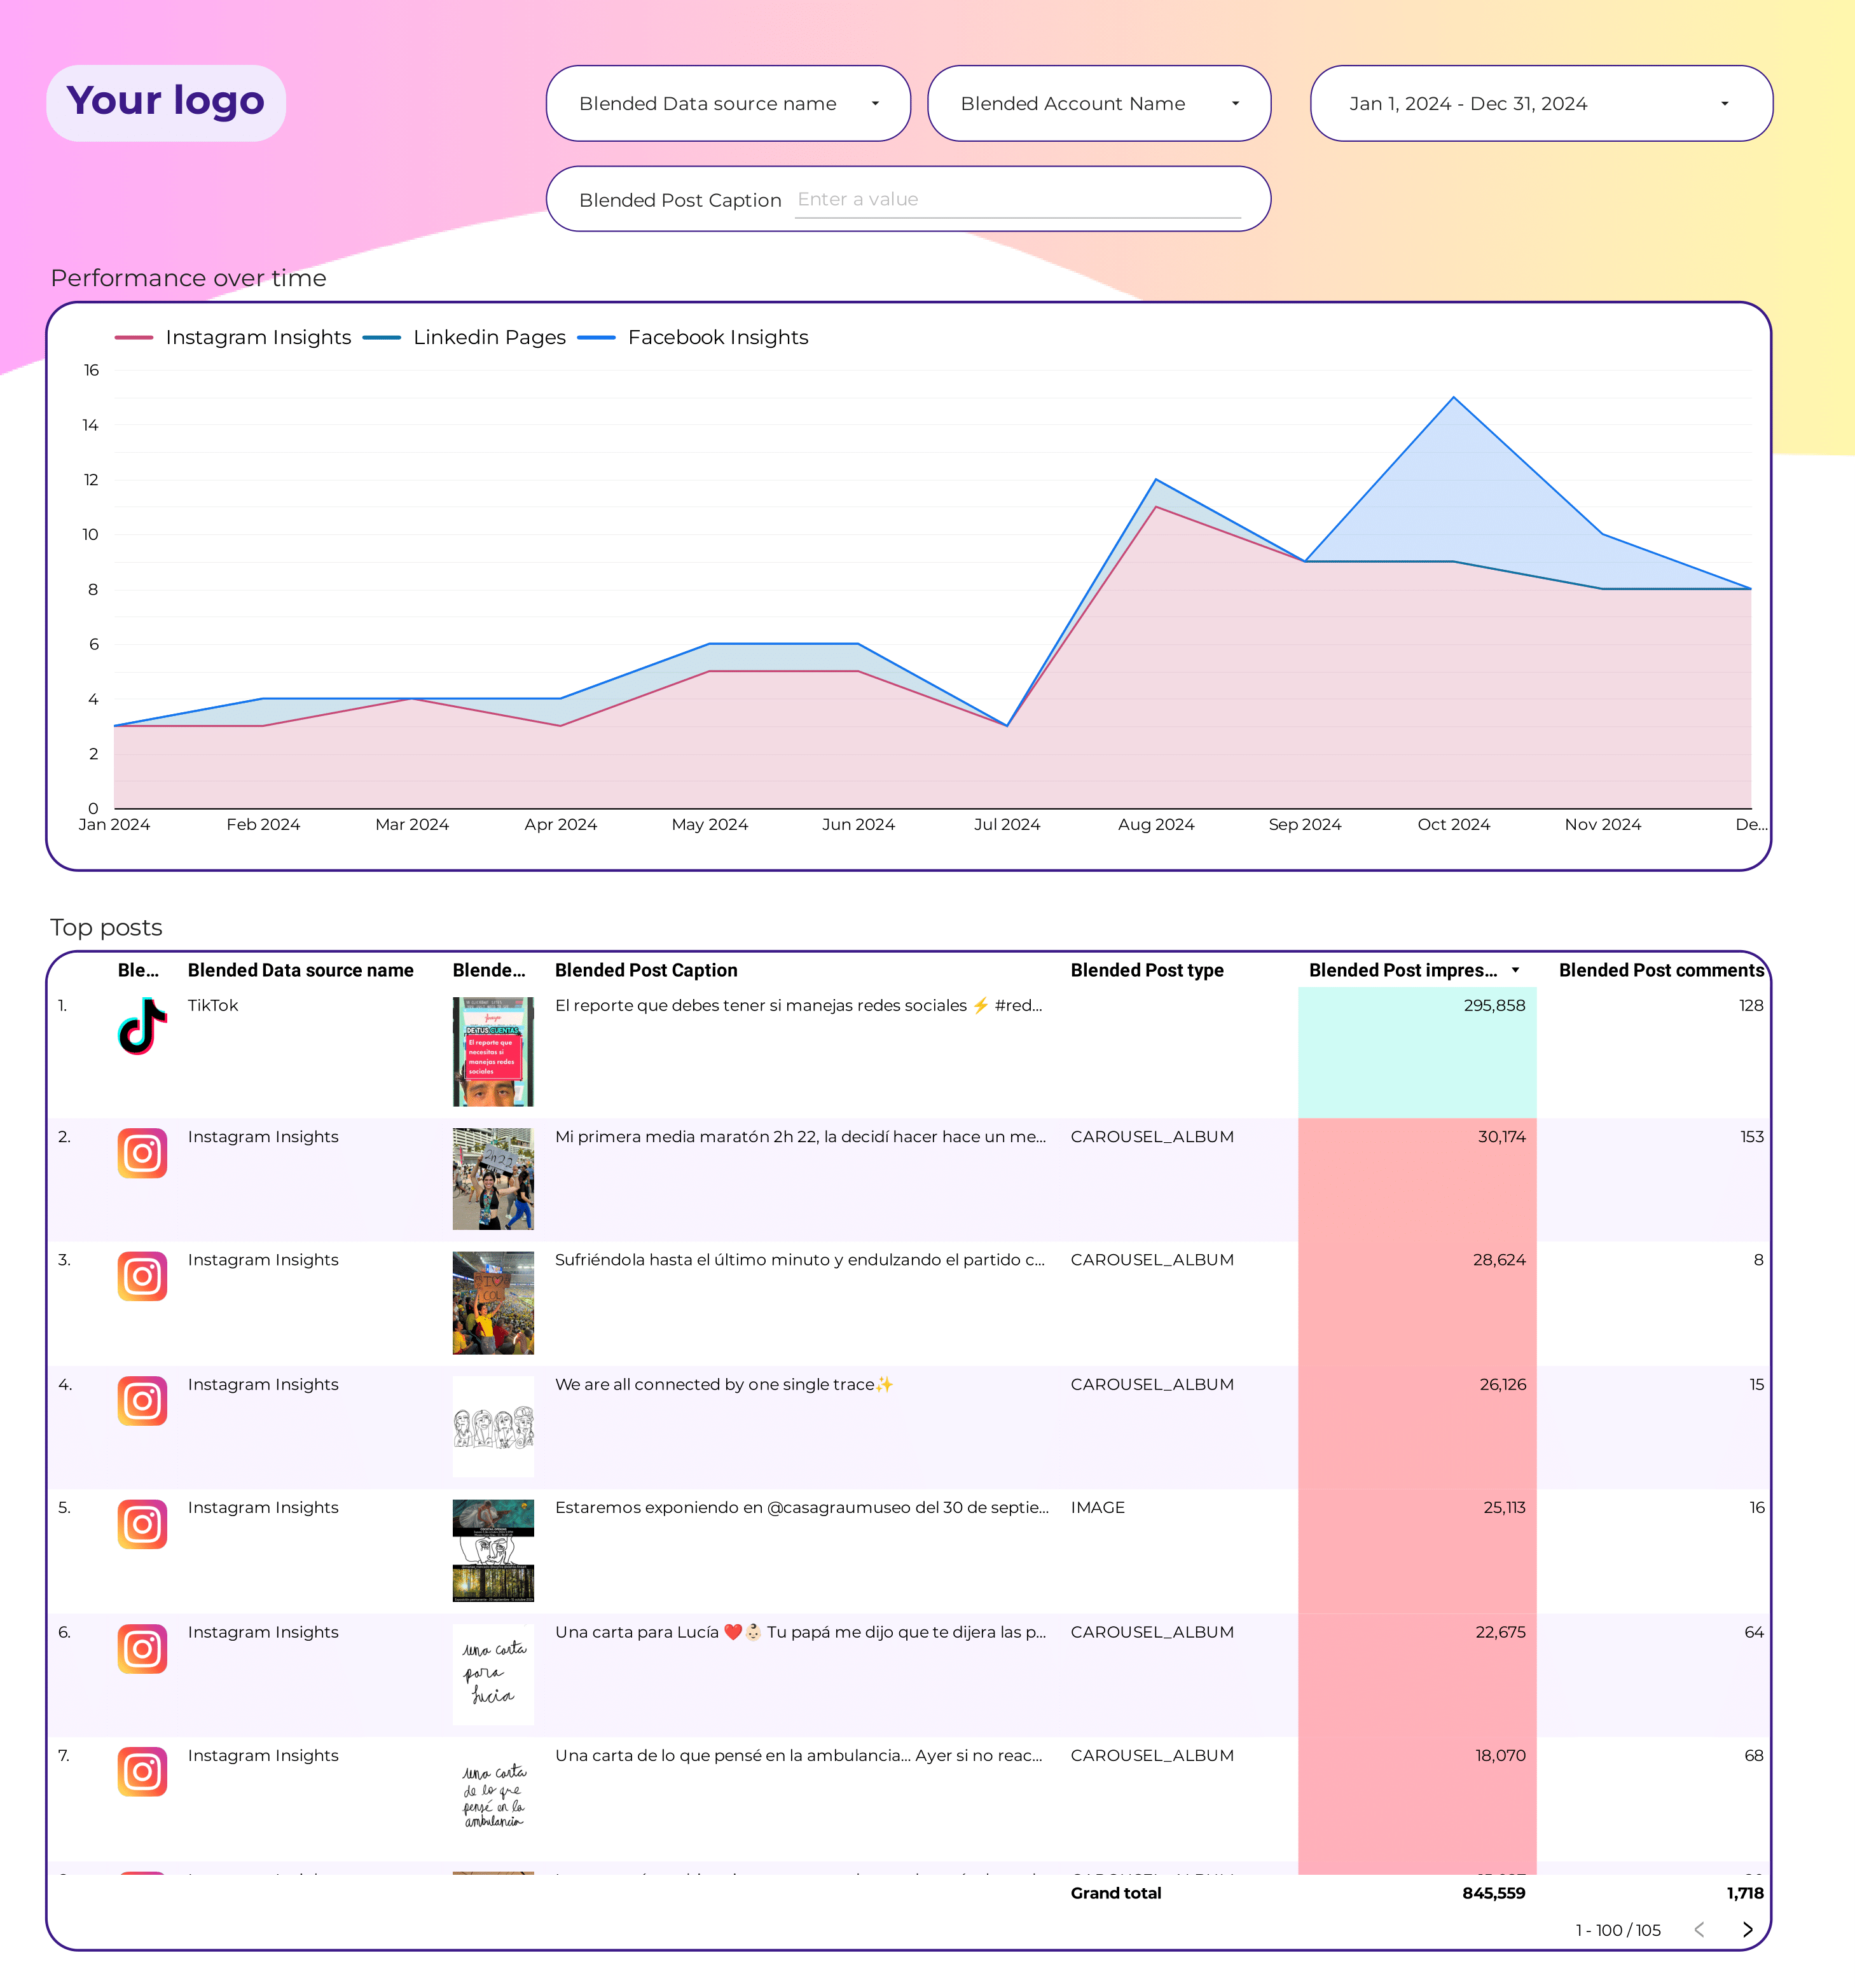
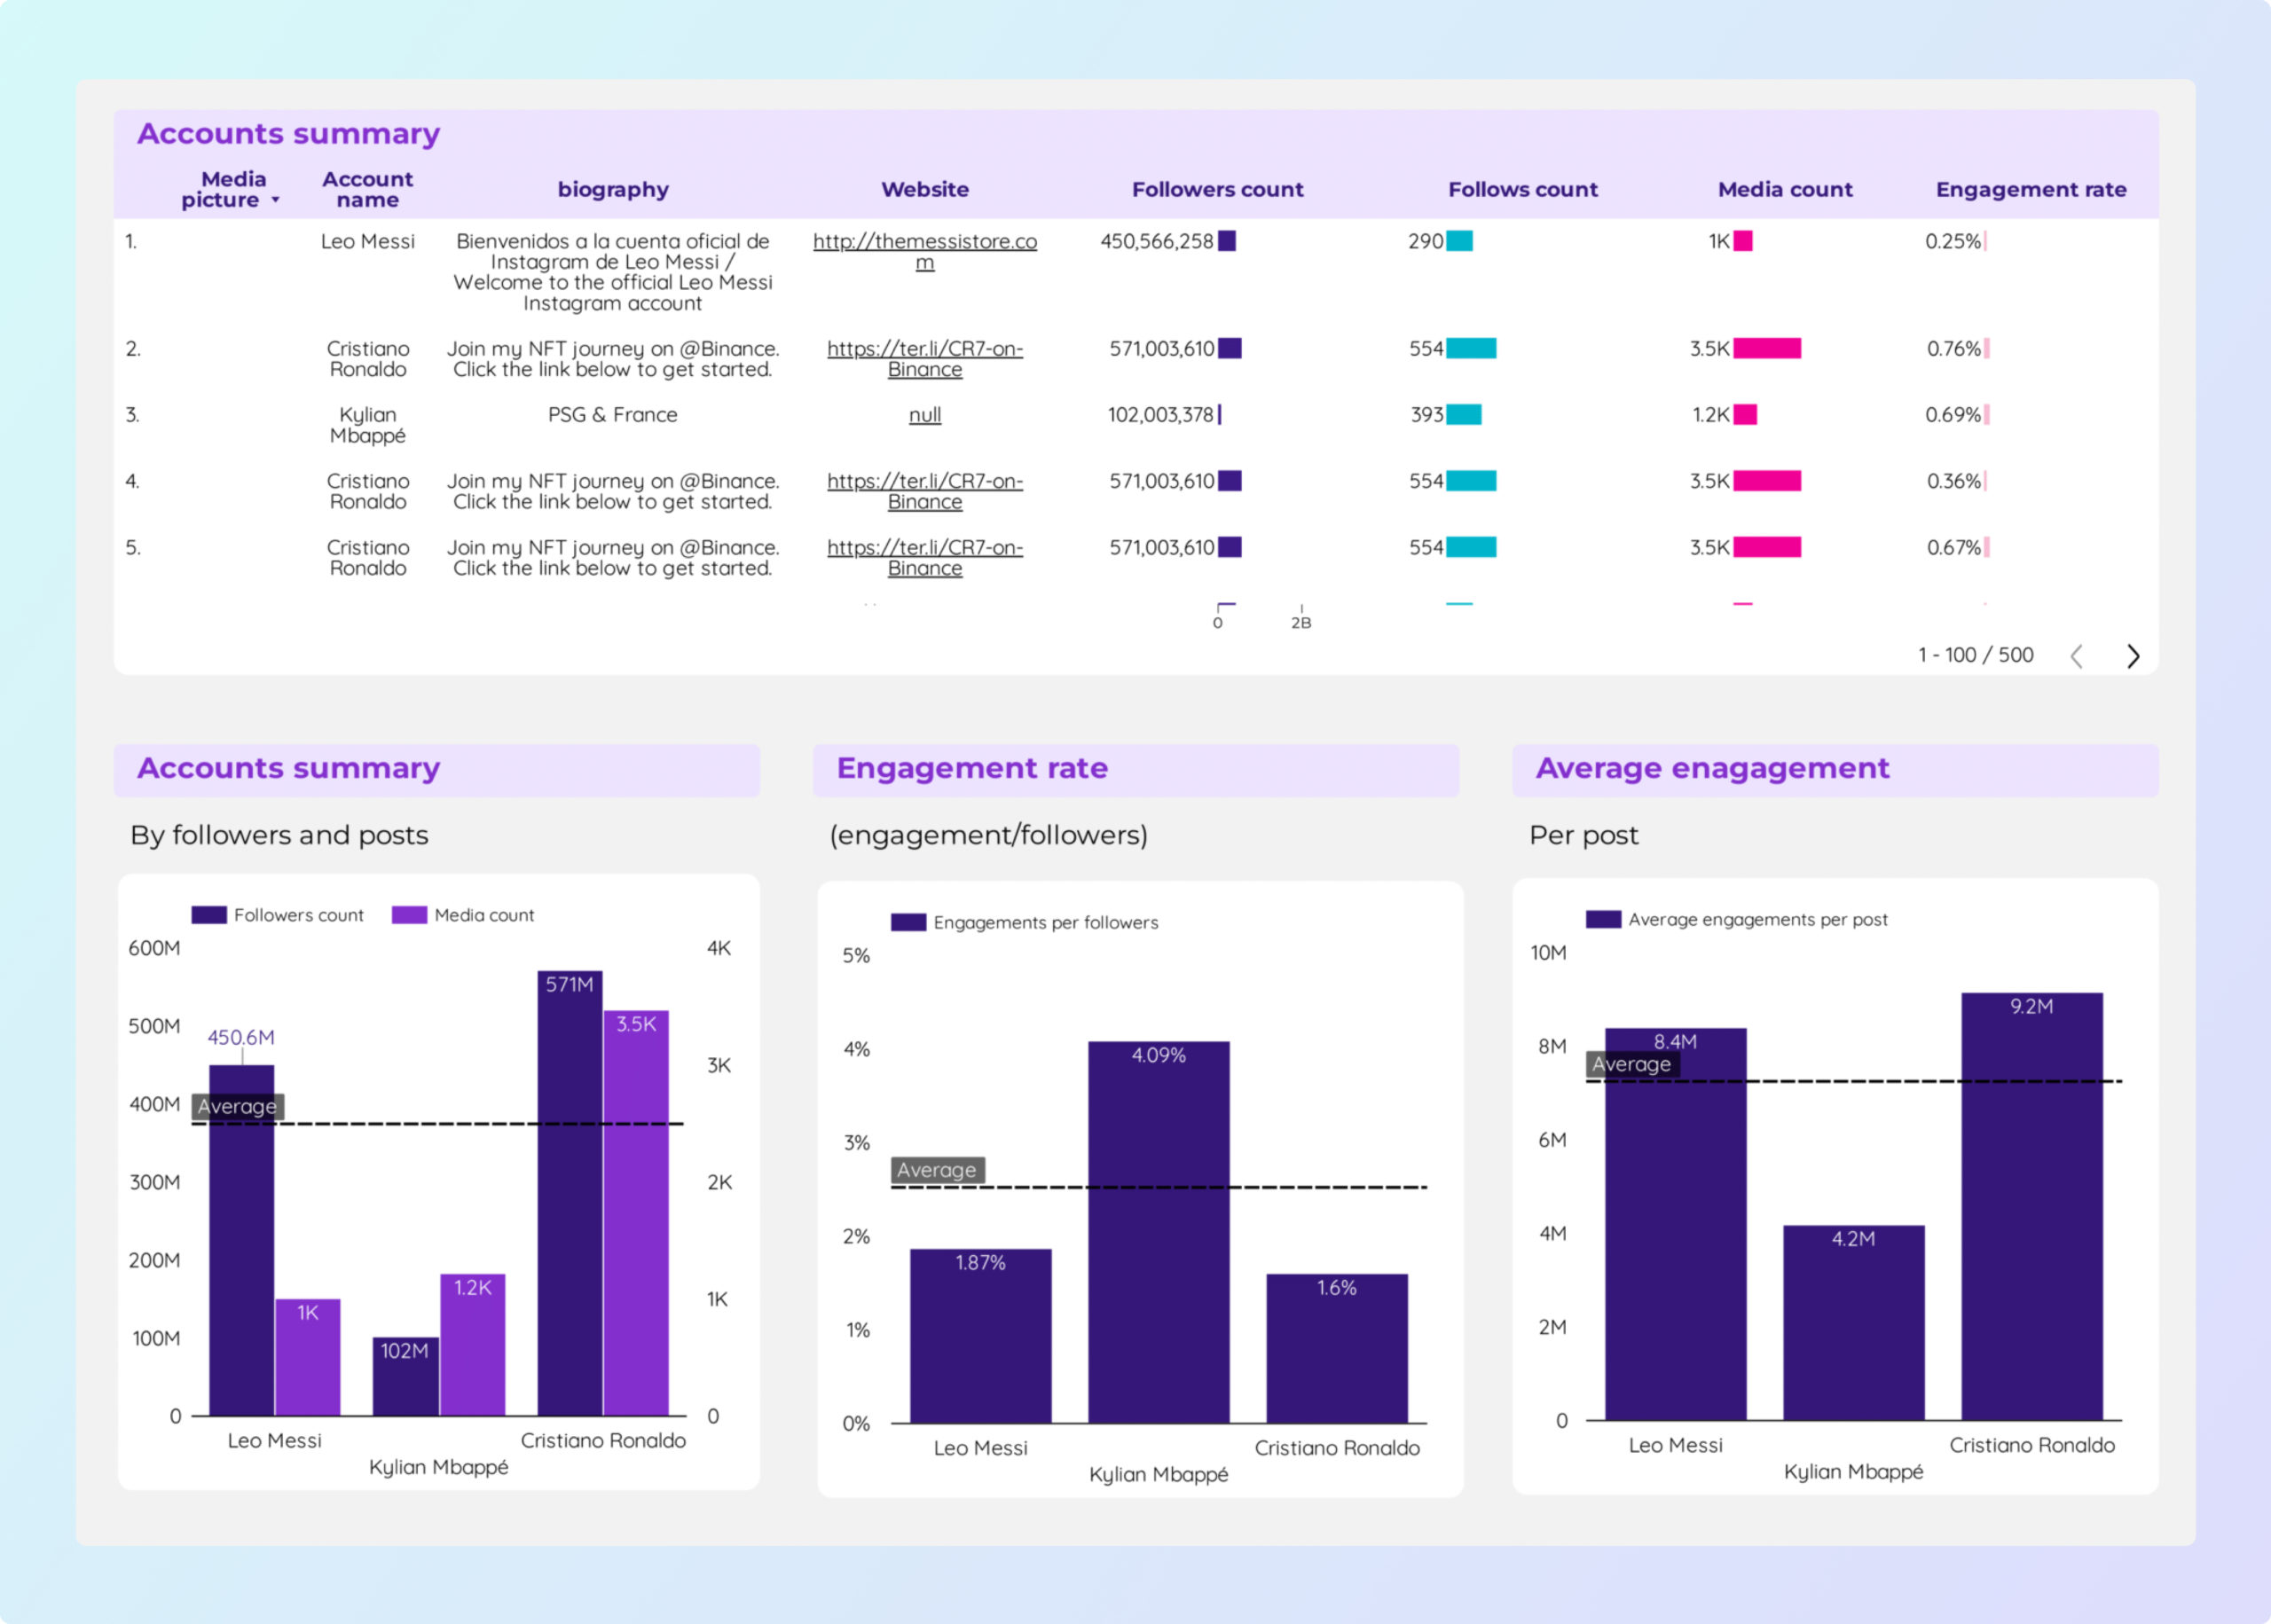
Social Media Report template for Data Studio by Porter
Track follower growth across platforms → engagement rate per follower → follower-to-customer ratio. Segment by platform, date.
SEO Report template for Data Studio by Porter
Track keyword search volume, SERP visibility → CTR per keyword, position changes → organic traffic, keyword conversions. Segment by keyword cluster, intent, difficulty.
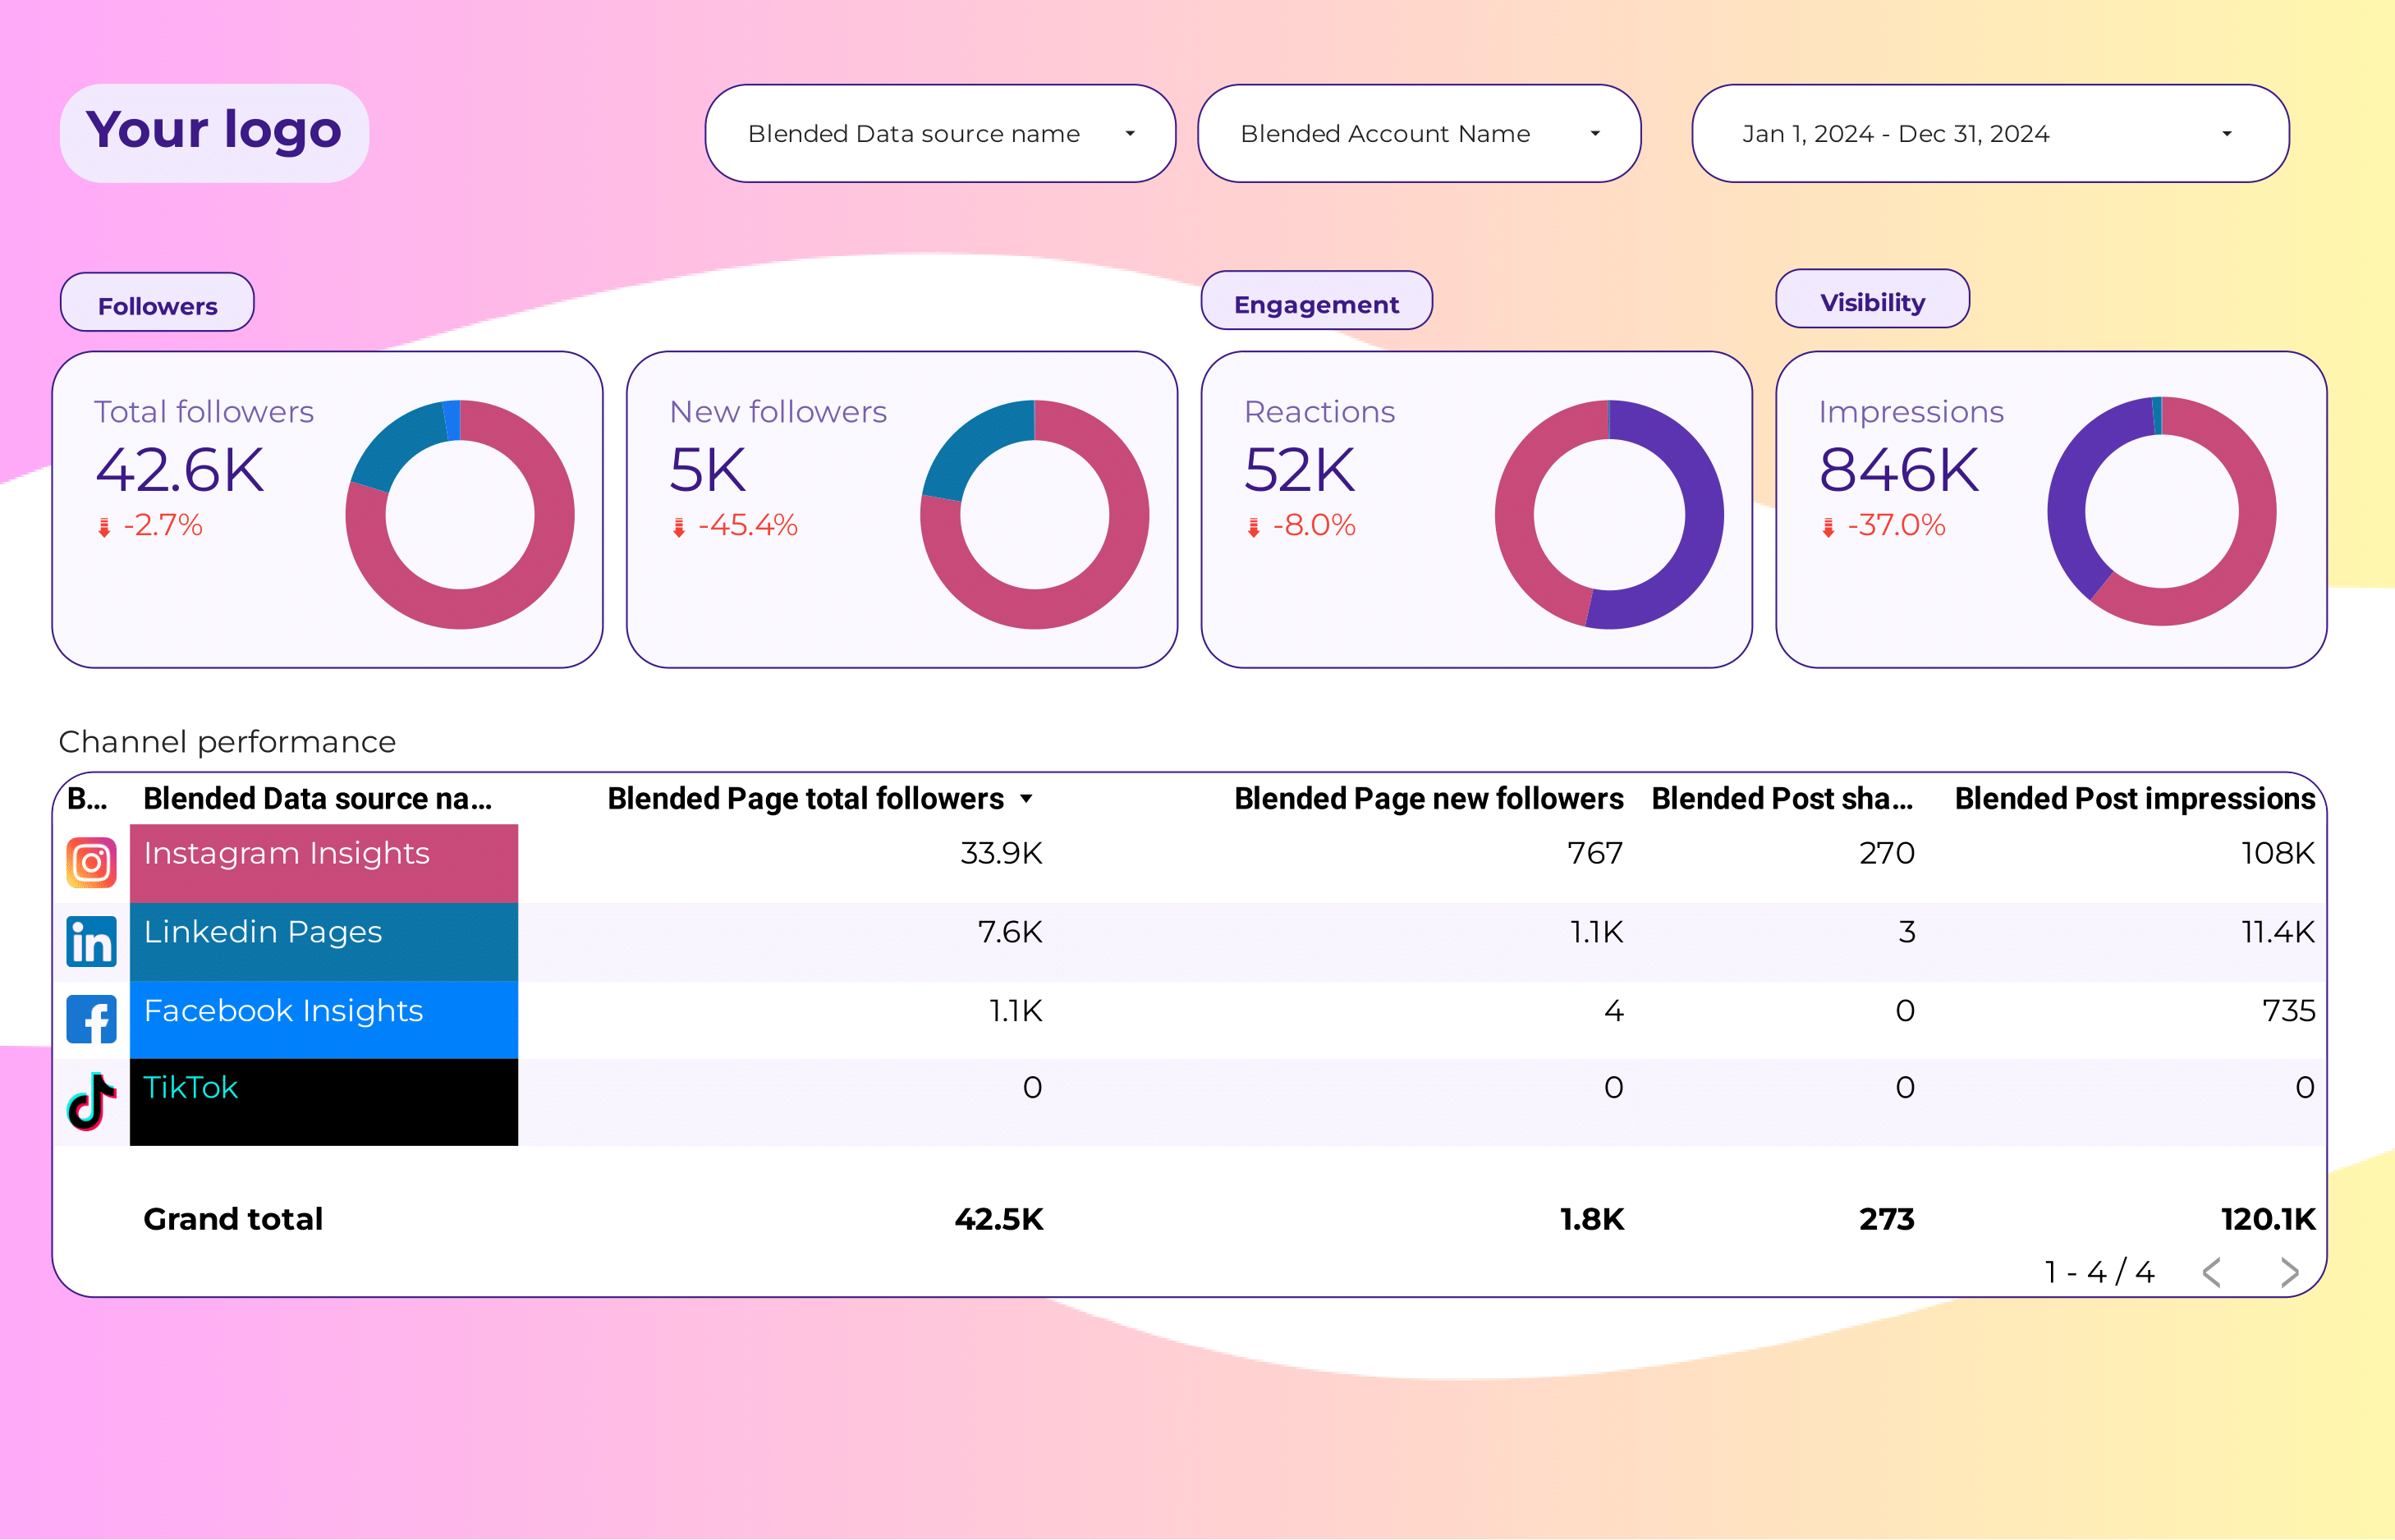
Social Media Followers tracking Report template for Data Studio by Porter
Track follower growth across platforms → engagement rate per follower → follower-to-customer ratio. Segment by platform, date.
Content marketing Report template for Data Studio by Porter
Track page views, organic impressions → time on page, scroll depth, shares → content conversions, lead captures. Segment by content type, topic, channel.
Social Media competitors Report template for Data Studio by Porter
Track competitor followers, reach → engagement rate benchmarks → share of voice, growth gap. Segment by competitor, platform.
Social Media Client presentation Report template for Data Studio by Porter
Track client social reach → client engagement benchmarks → social-driven leads. Segment by client, platform, content.
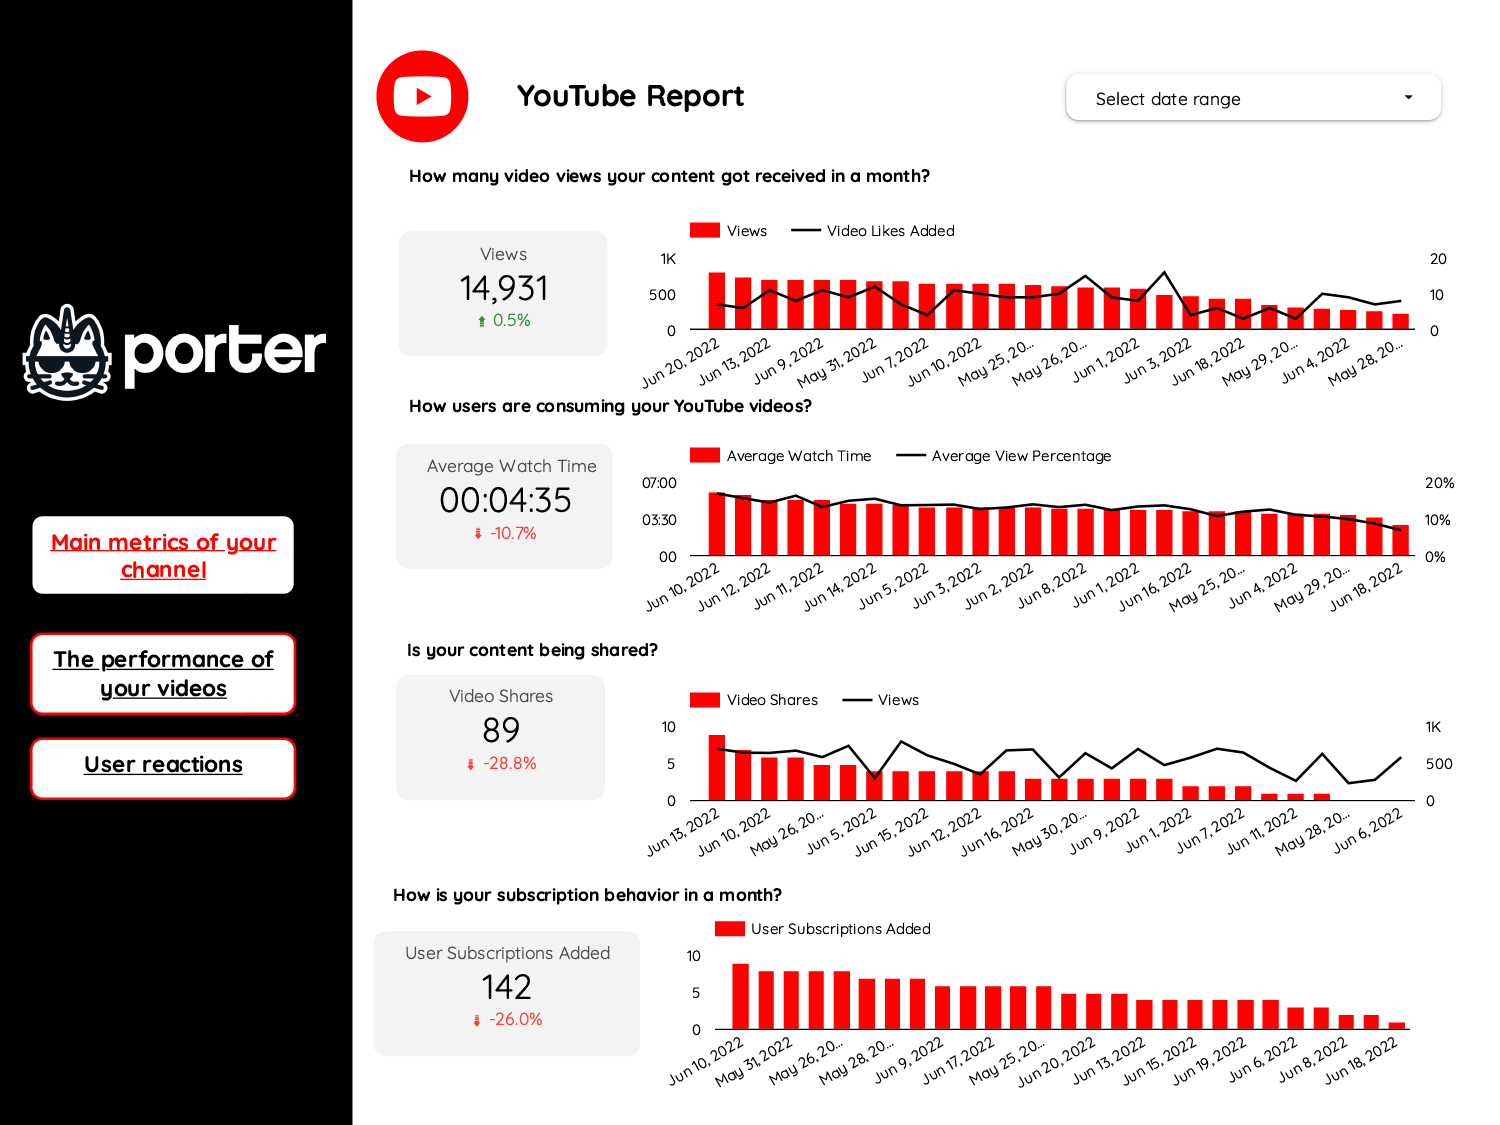
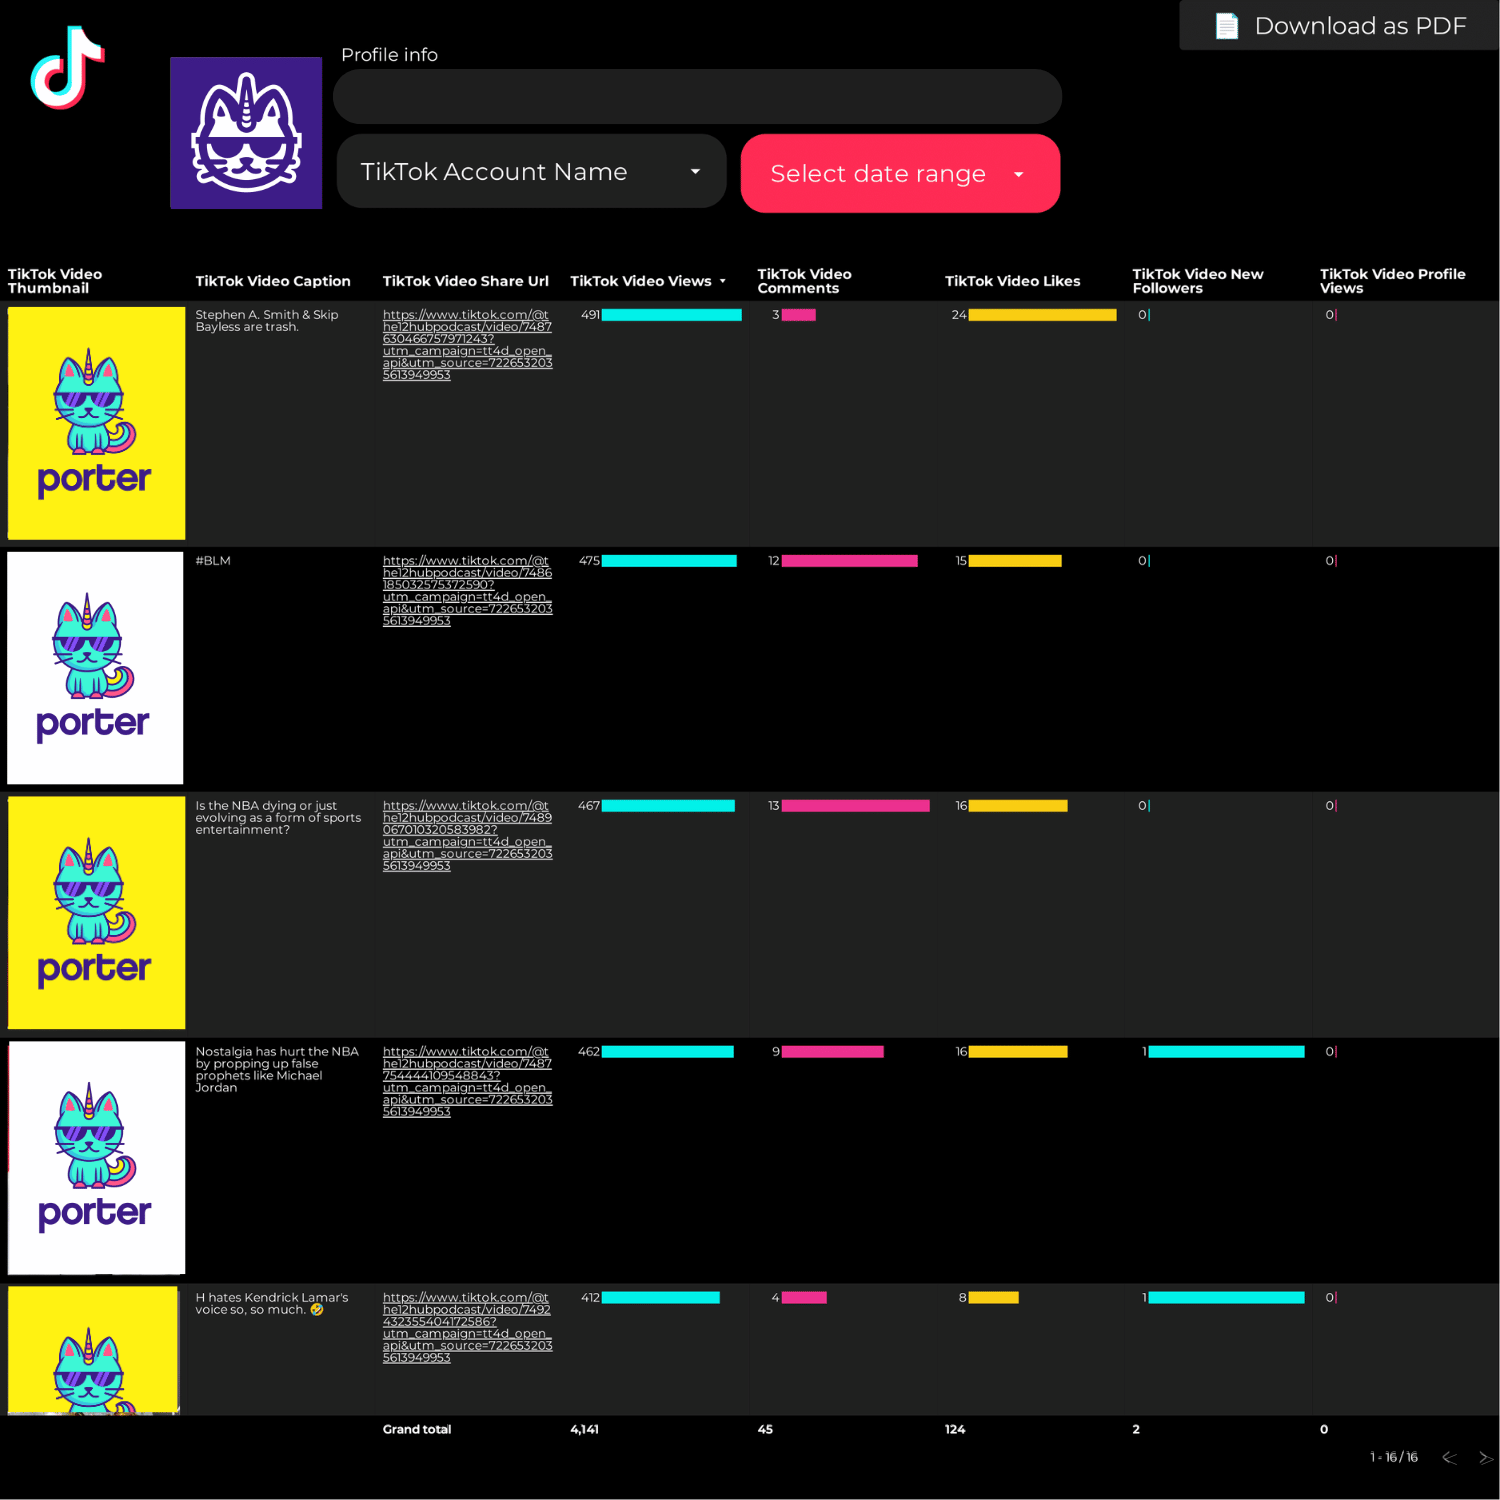
Youtube Report template for Data Studio by Porter
Track views, impressions, subscribers → watch time, CTR, likes → subscriber growth, end screens. Segment by video, traffic source.
Content performance Report template for Data Studio by Porter
Track post reach, impressions → engagement rate, shares, saves → click-through rate, content ROI. Segment by format, topic, platform.

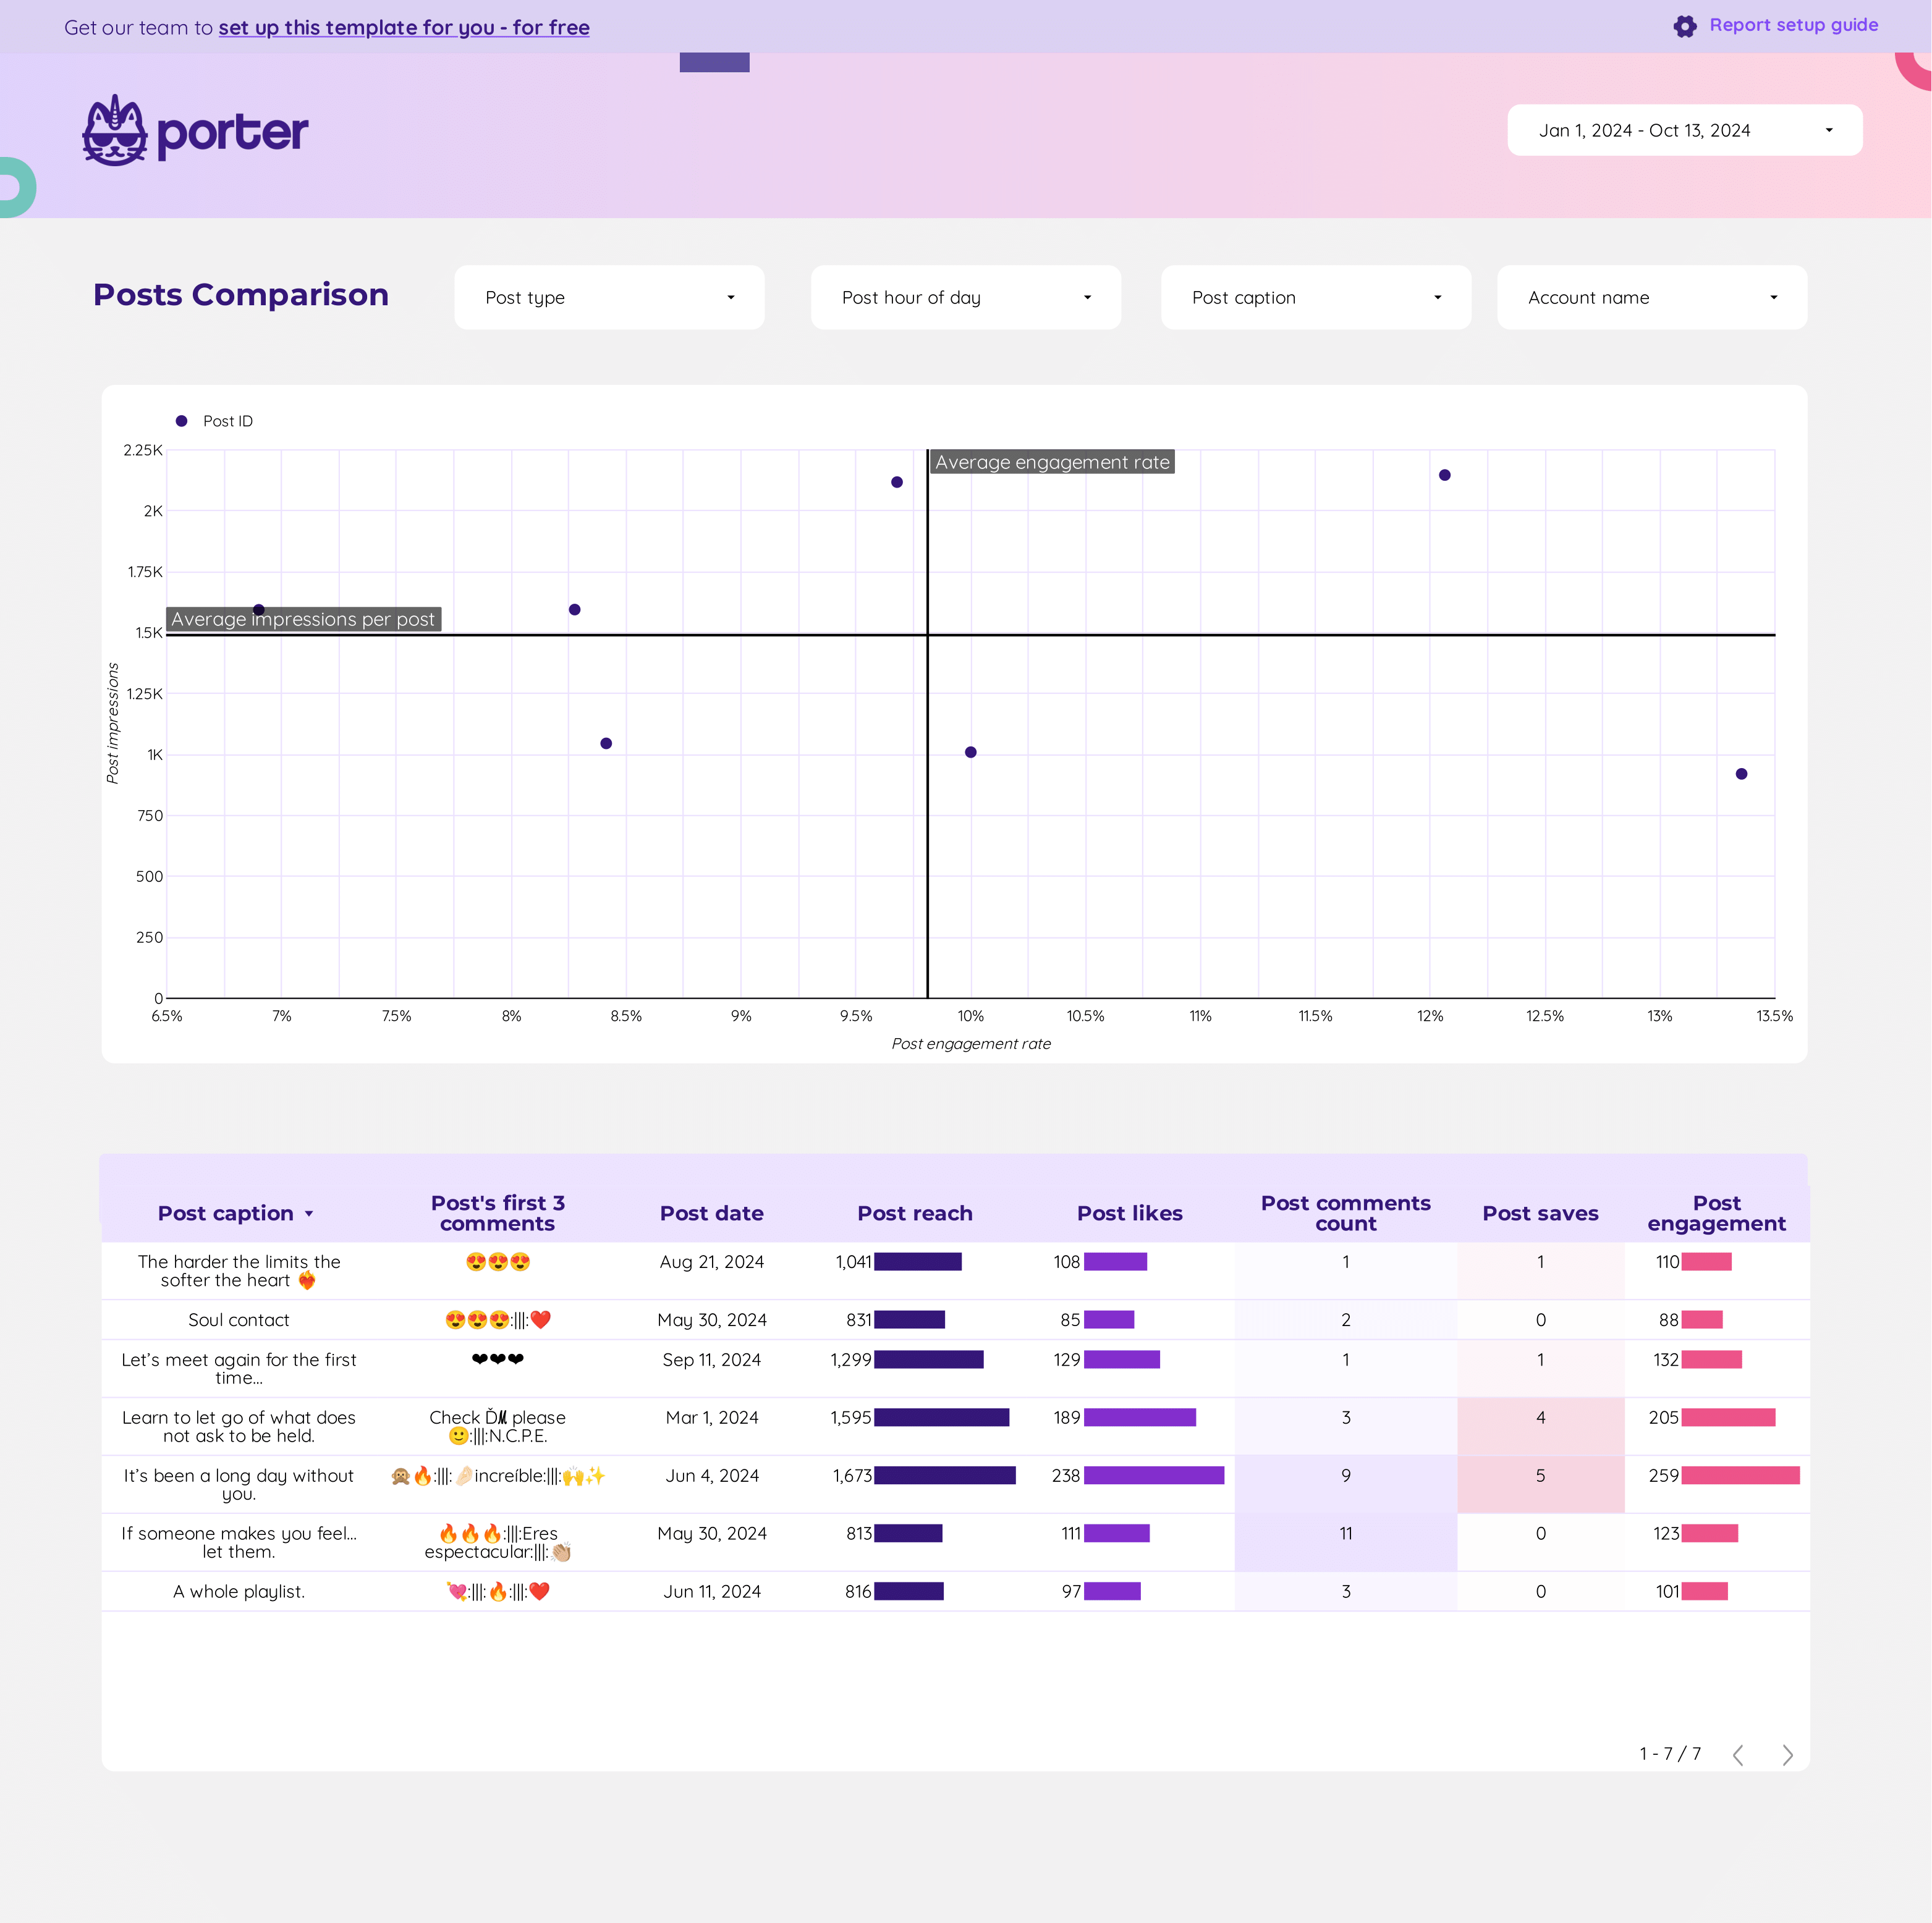
Social Media Post performance Report template for Data Studio by Porter
Track post reach, impressions → engagement per post → clicks per post, conversions. Segment by format, topic, time.
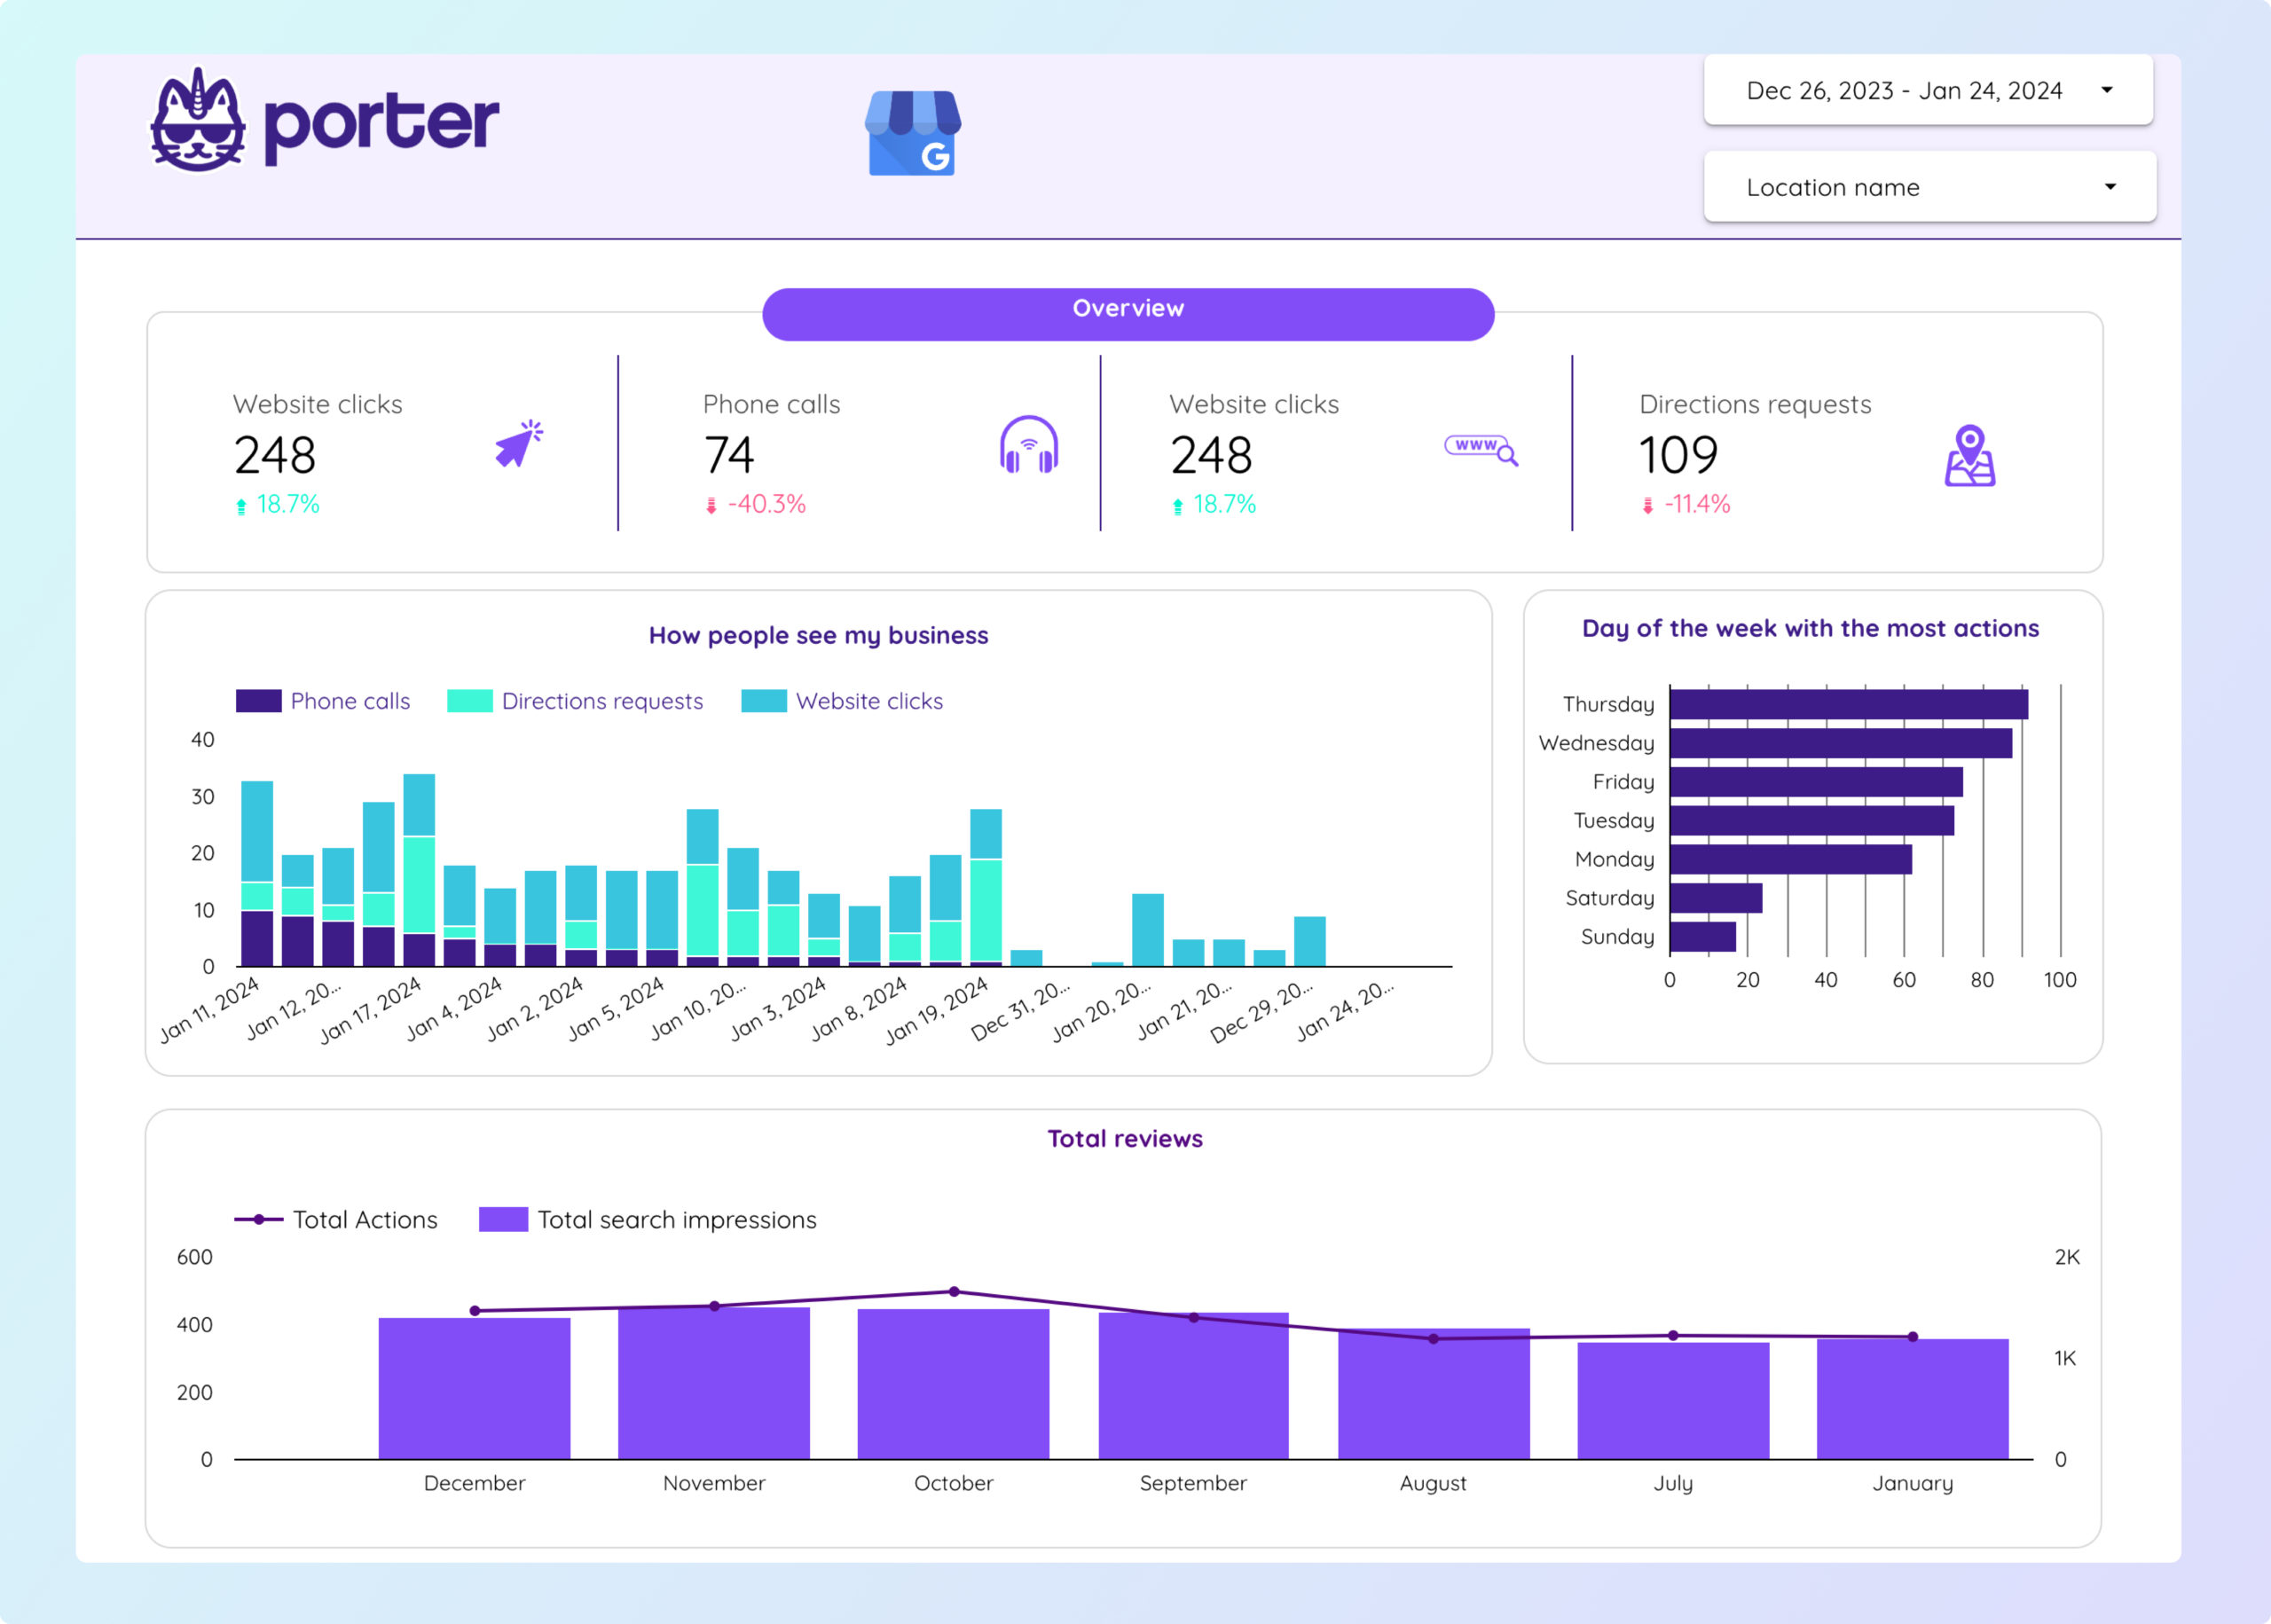
Local SEO Report template for Data Studio by Porter
Track organic impressions, visibility → organic CTR, average position → organic conversions, goals. Segment by page, keyword, channel, device.
Video marketing Report template for Data Studio by Porter
Track video views, reach → watch time, completion rate → CTA clicks, subscriber growth. Segment by platform, video type.
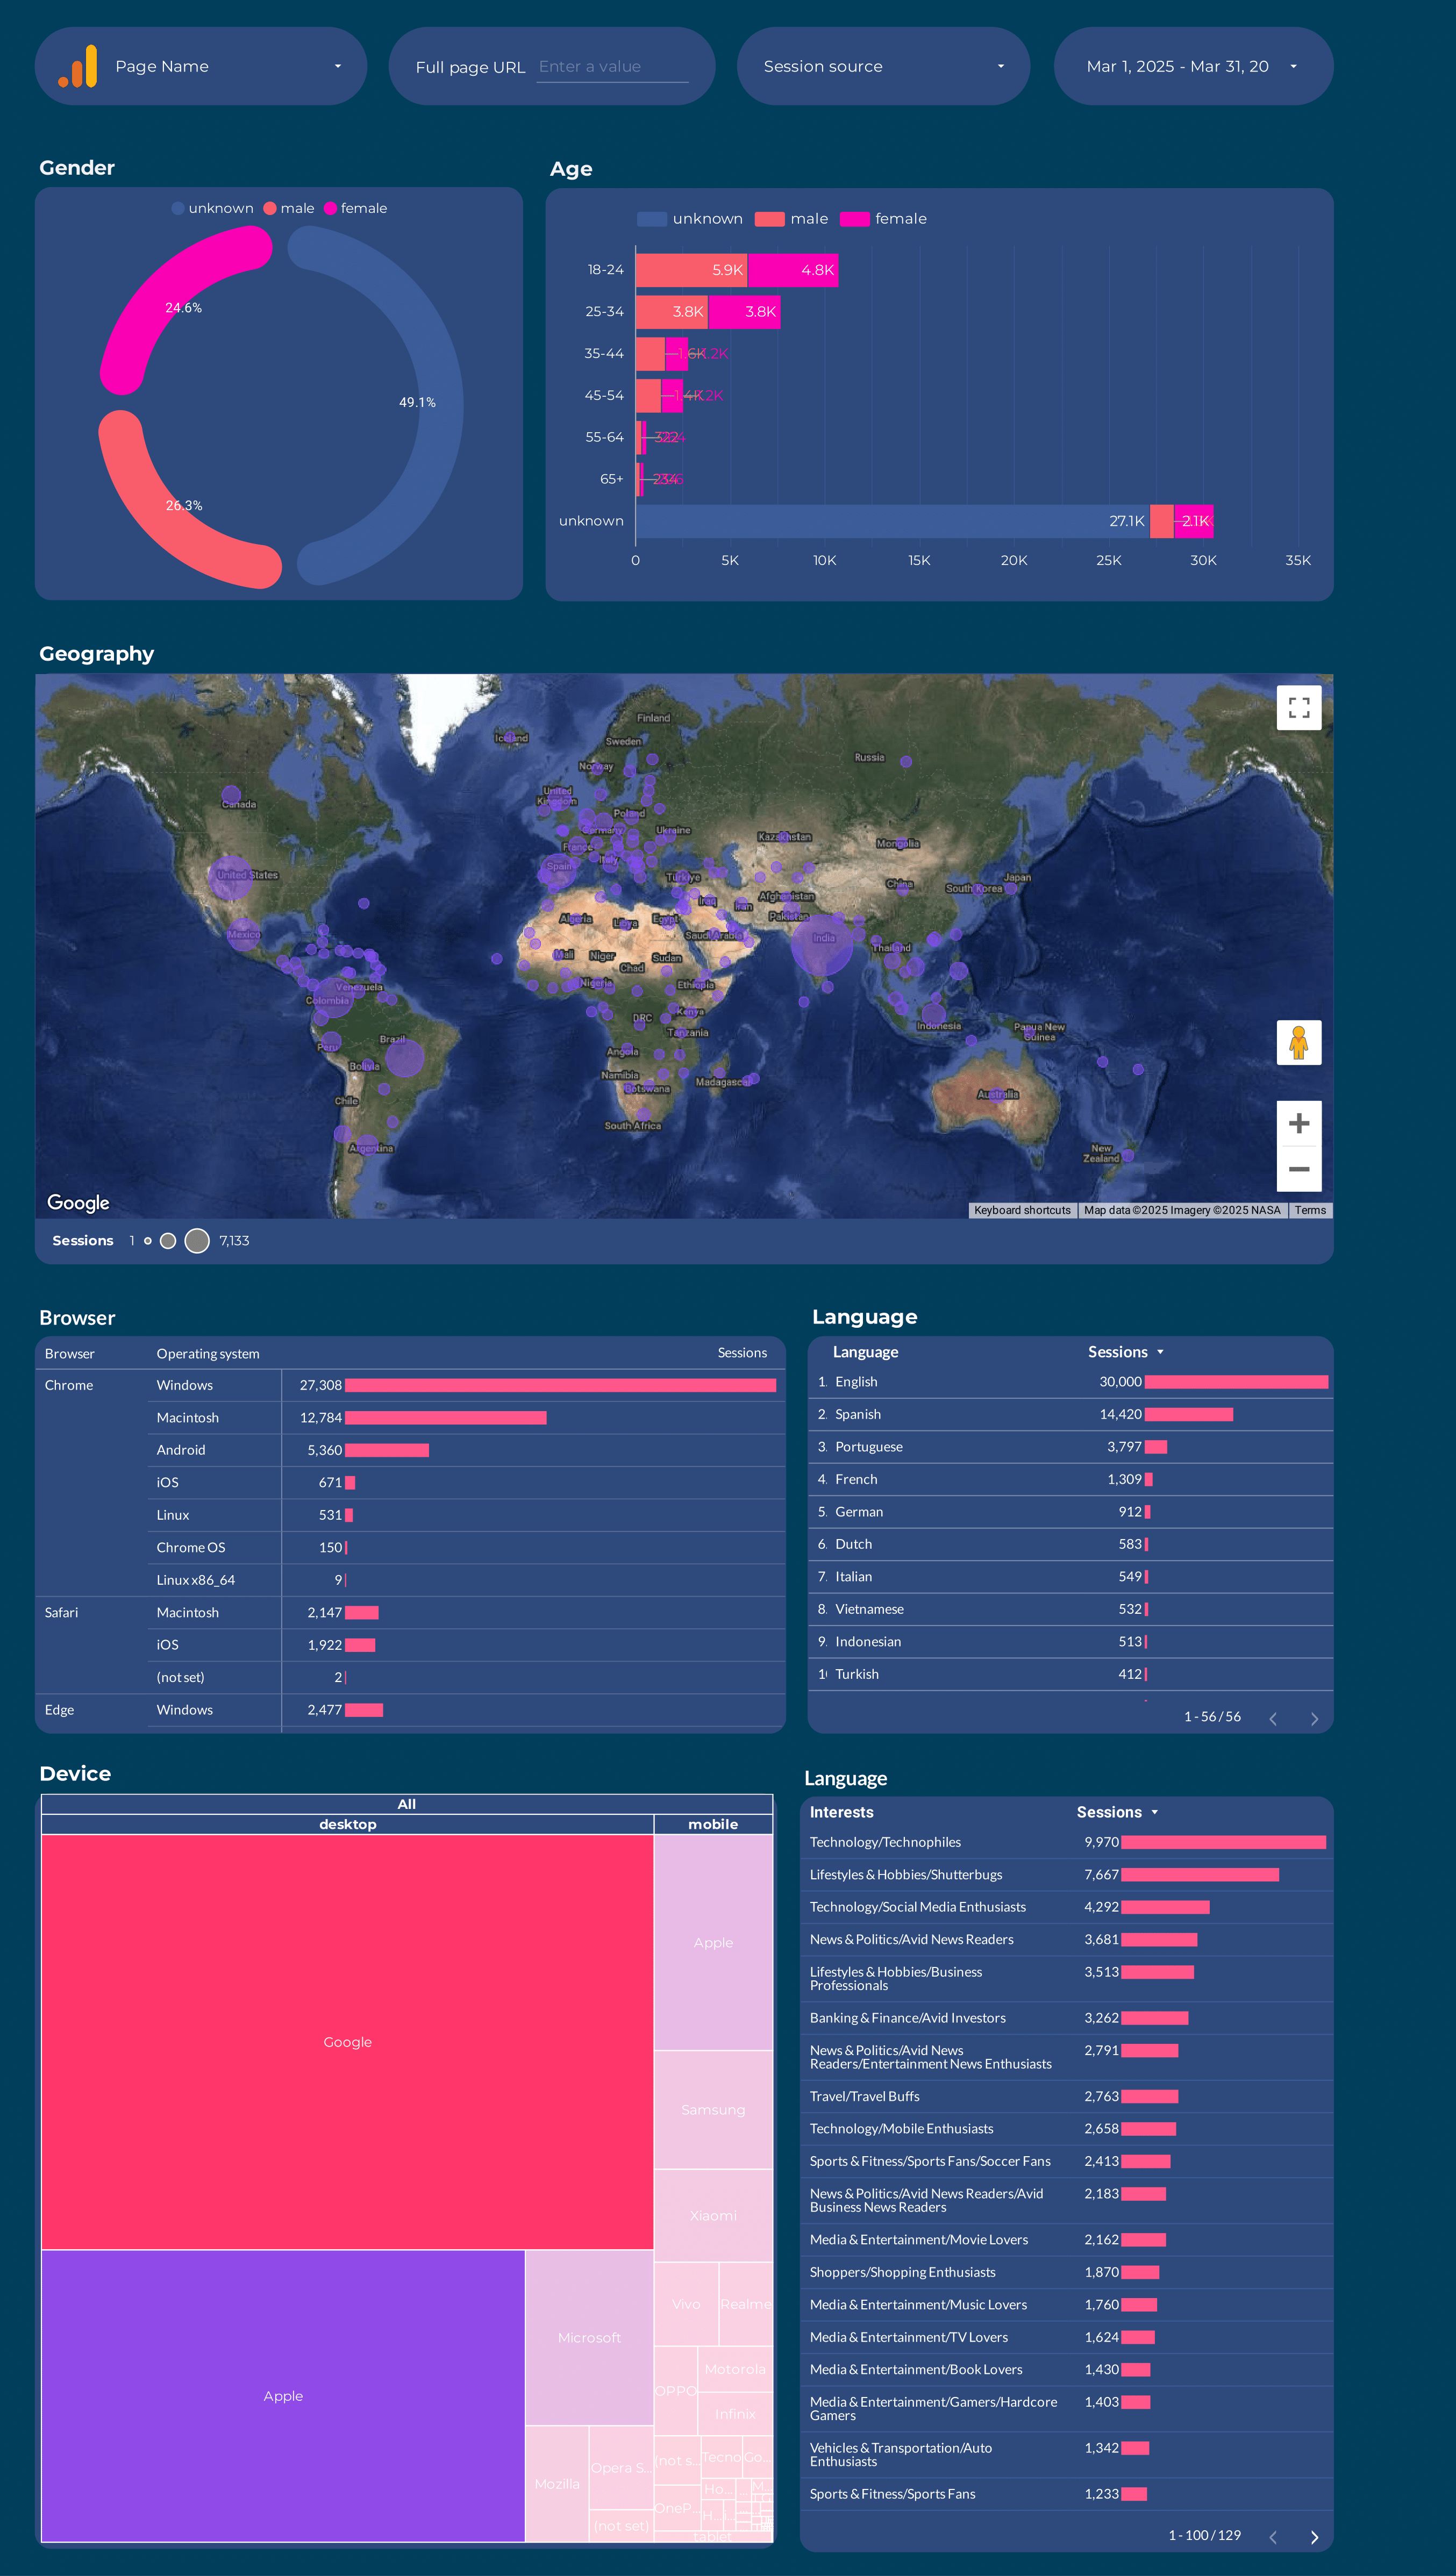
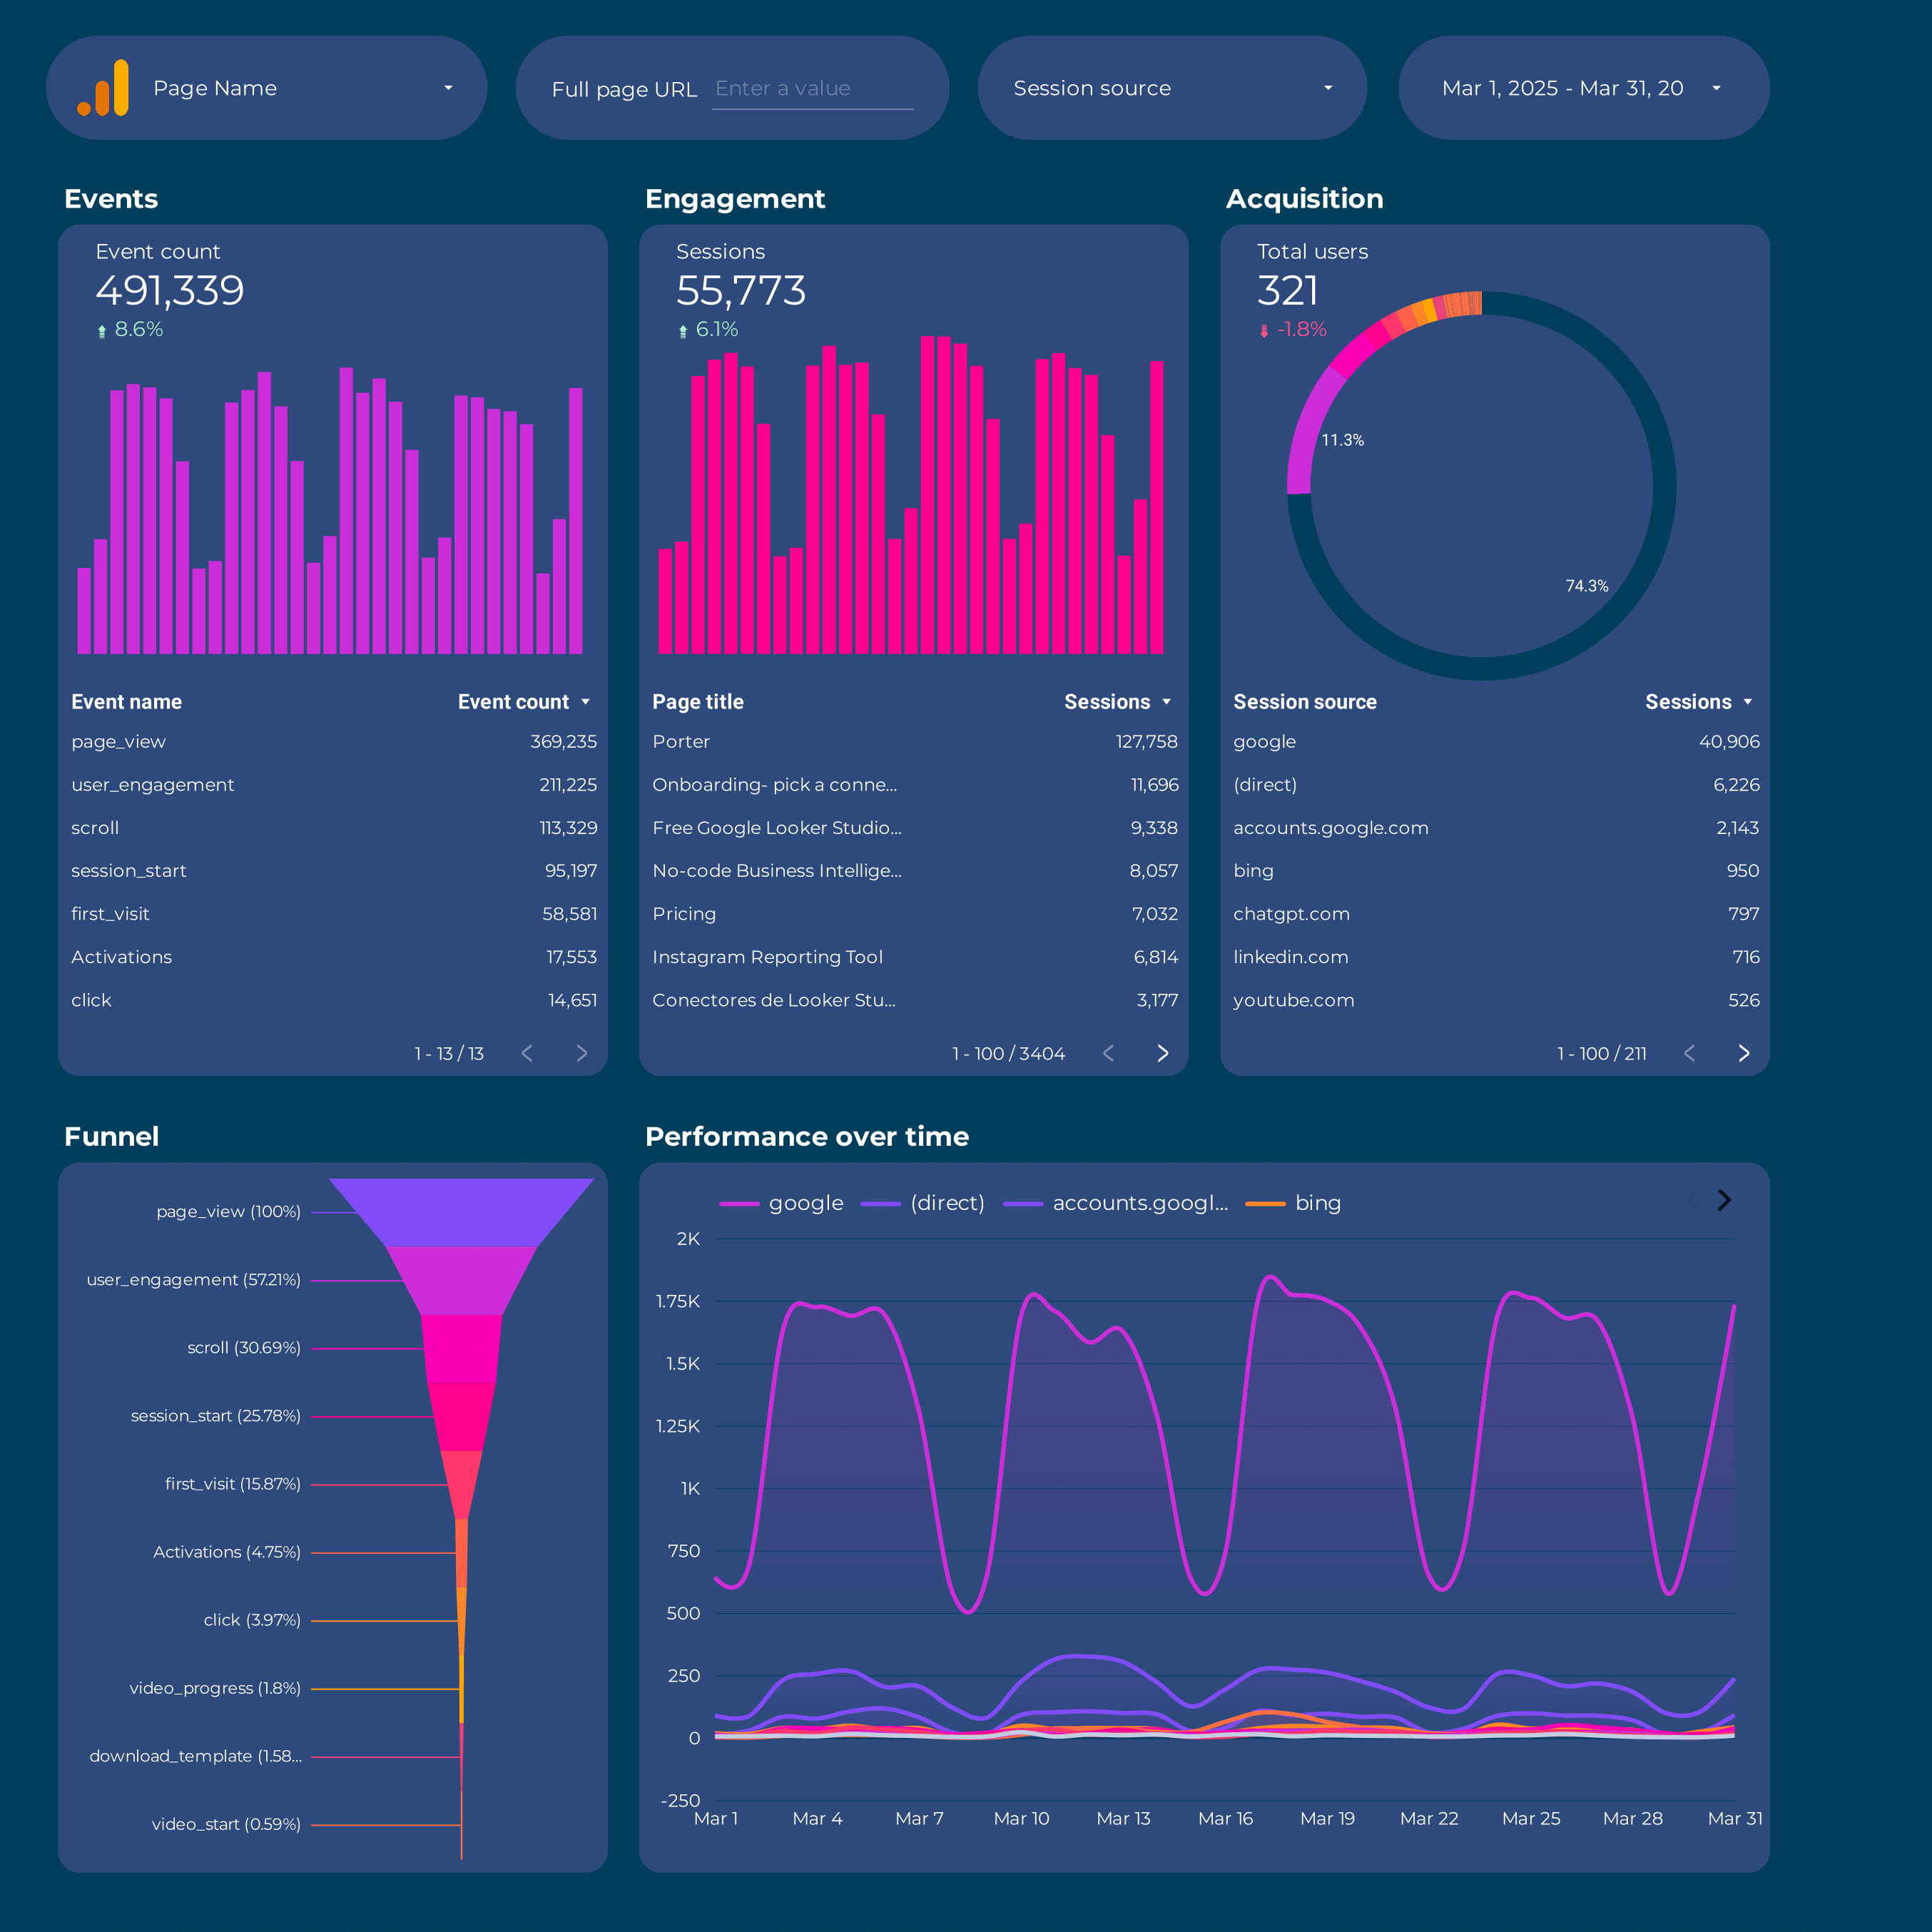
Google Analytics 4 Audience Report template for Data Studio by Porter
Track users, new vs returning → session duration, pages/session → conversion rate by segment. Segment by age, gender, interests, geography.
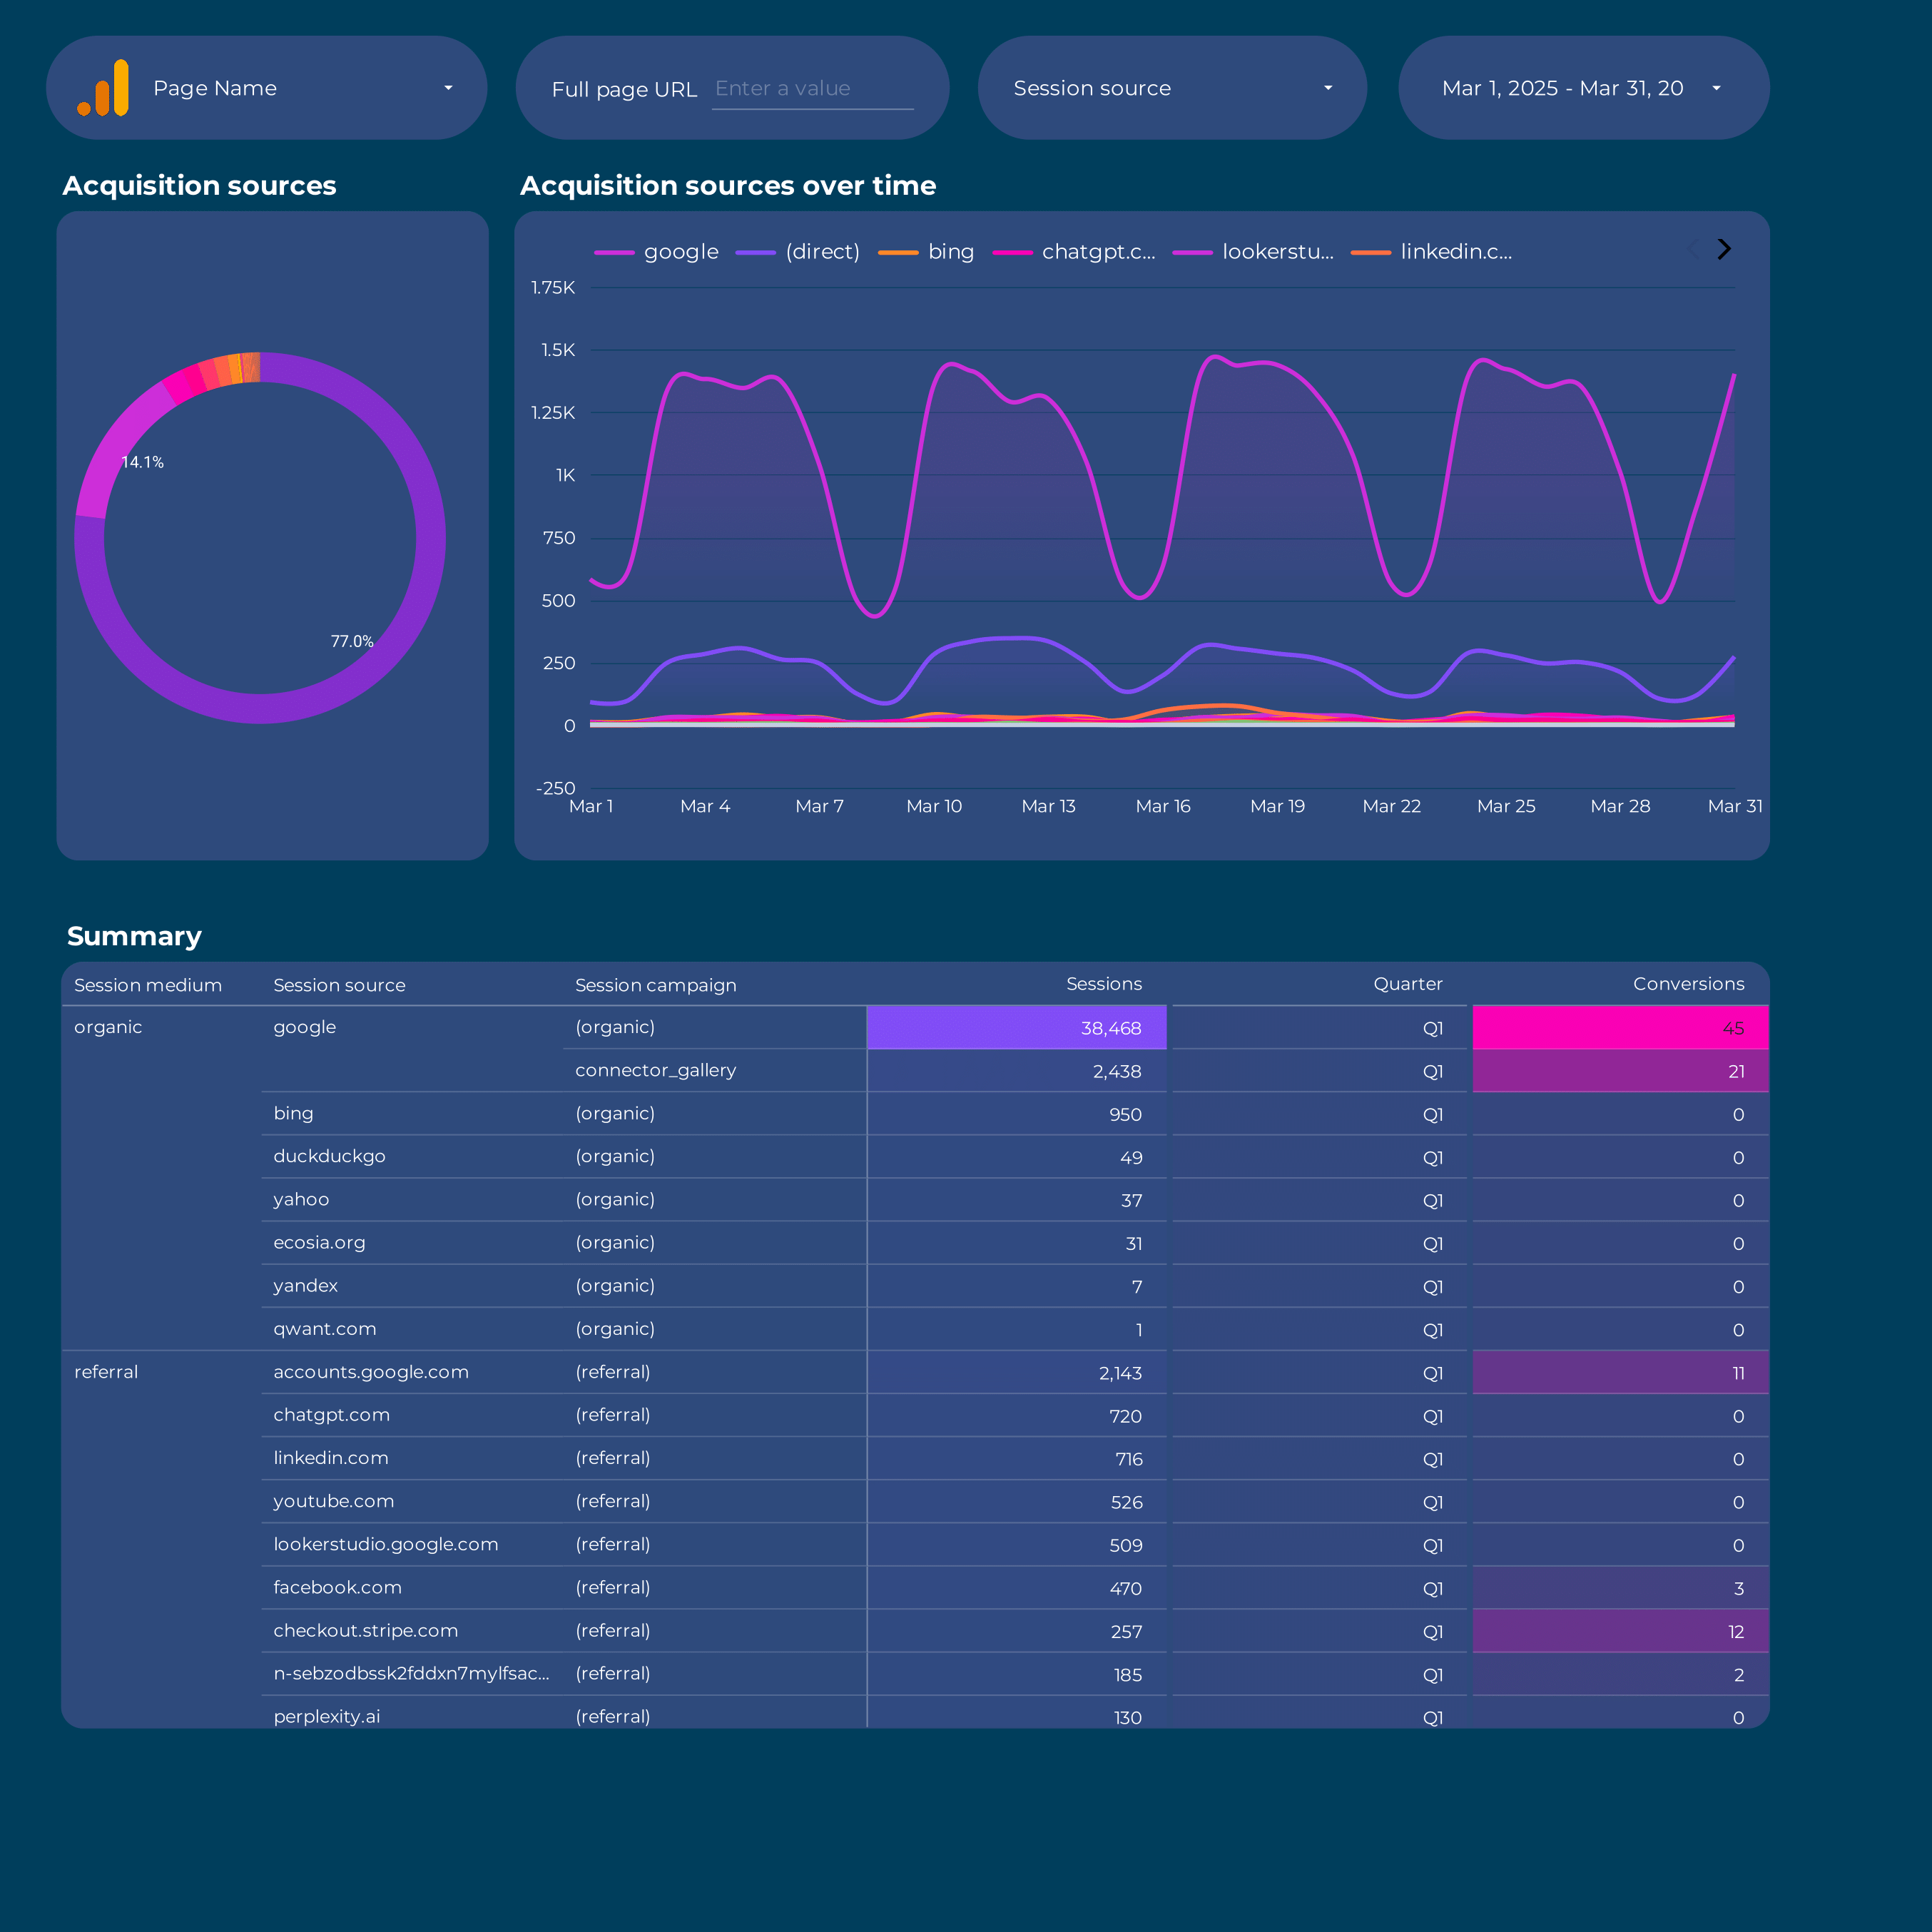
Google Analytics 4 acquisition Report template for Data Studio by Porter
Track sessions, new users by source → engagement rate, events/session → conversions by channel, revenue. Segment by source/medium, campaign, landing page.
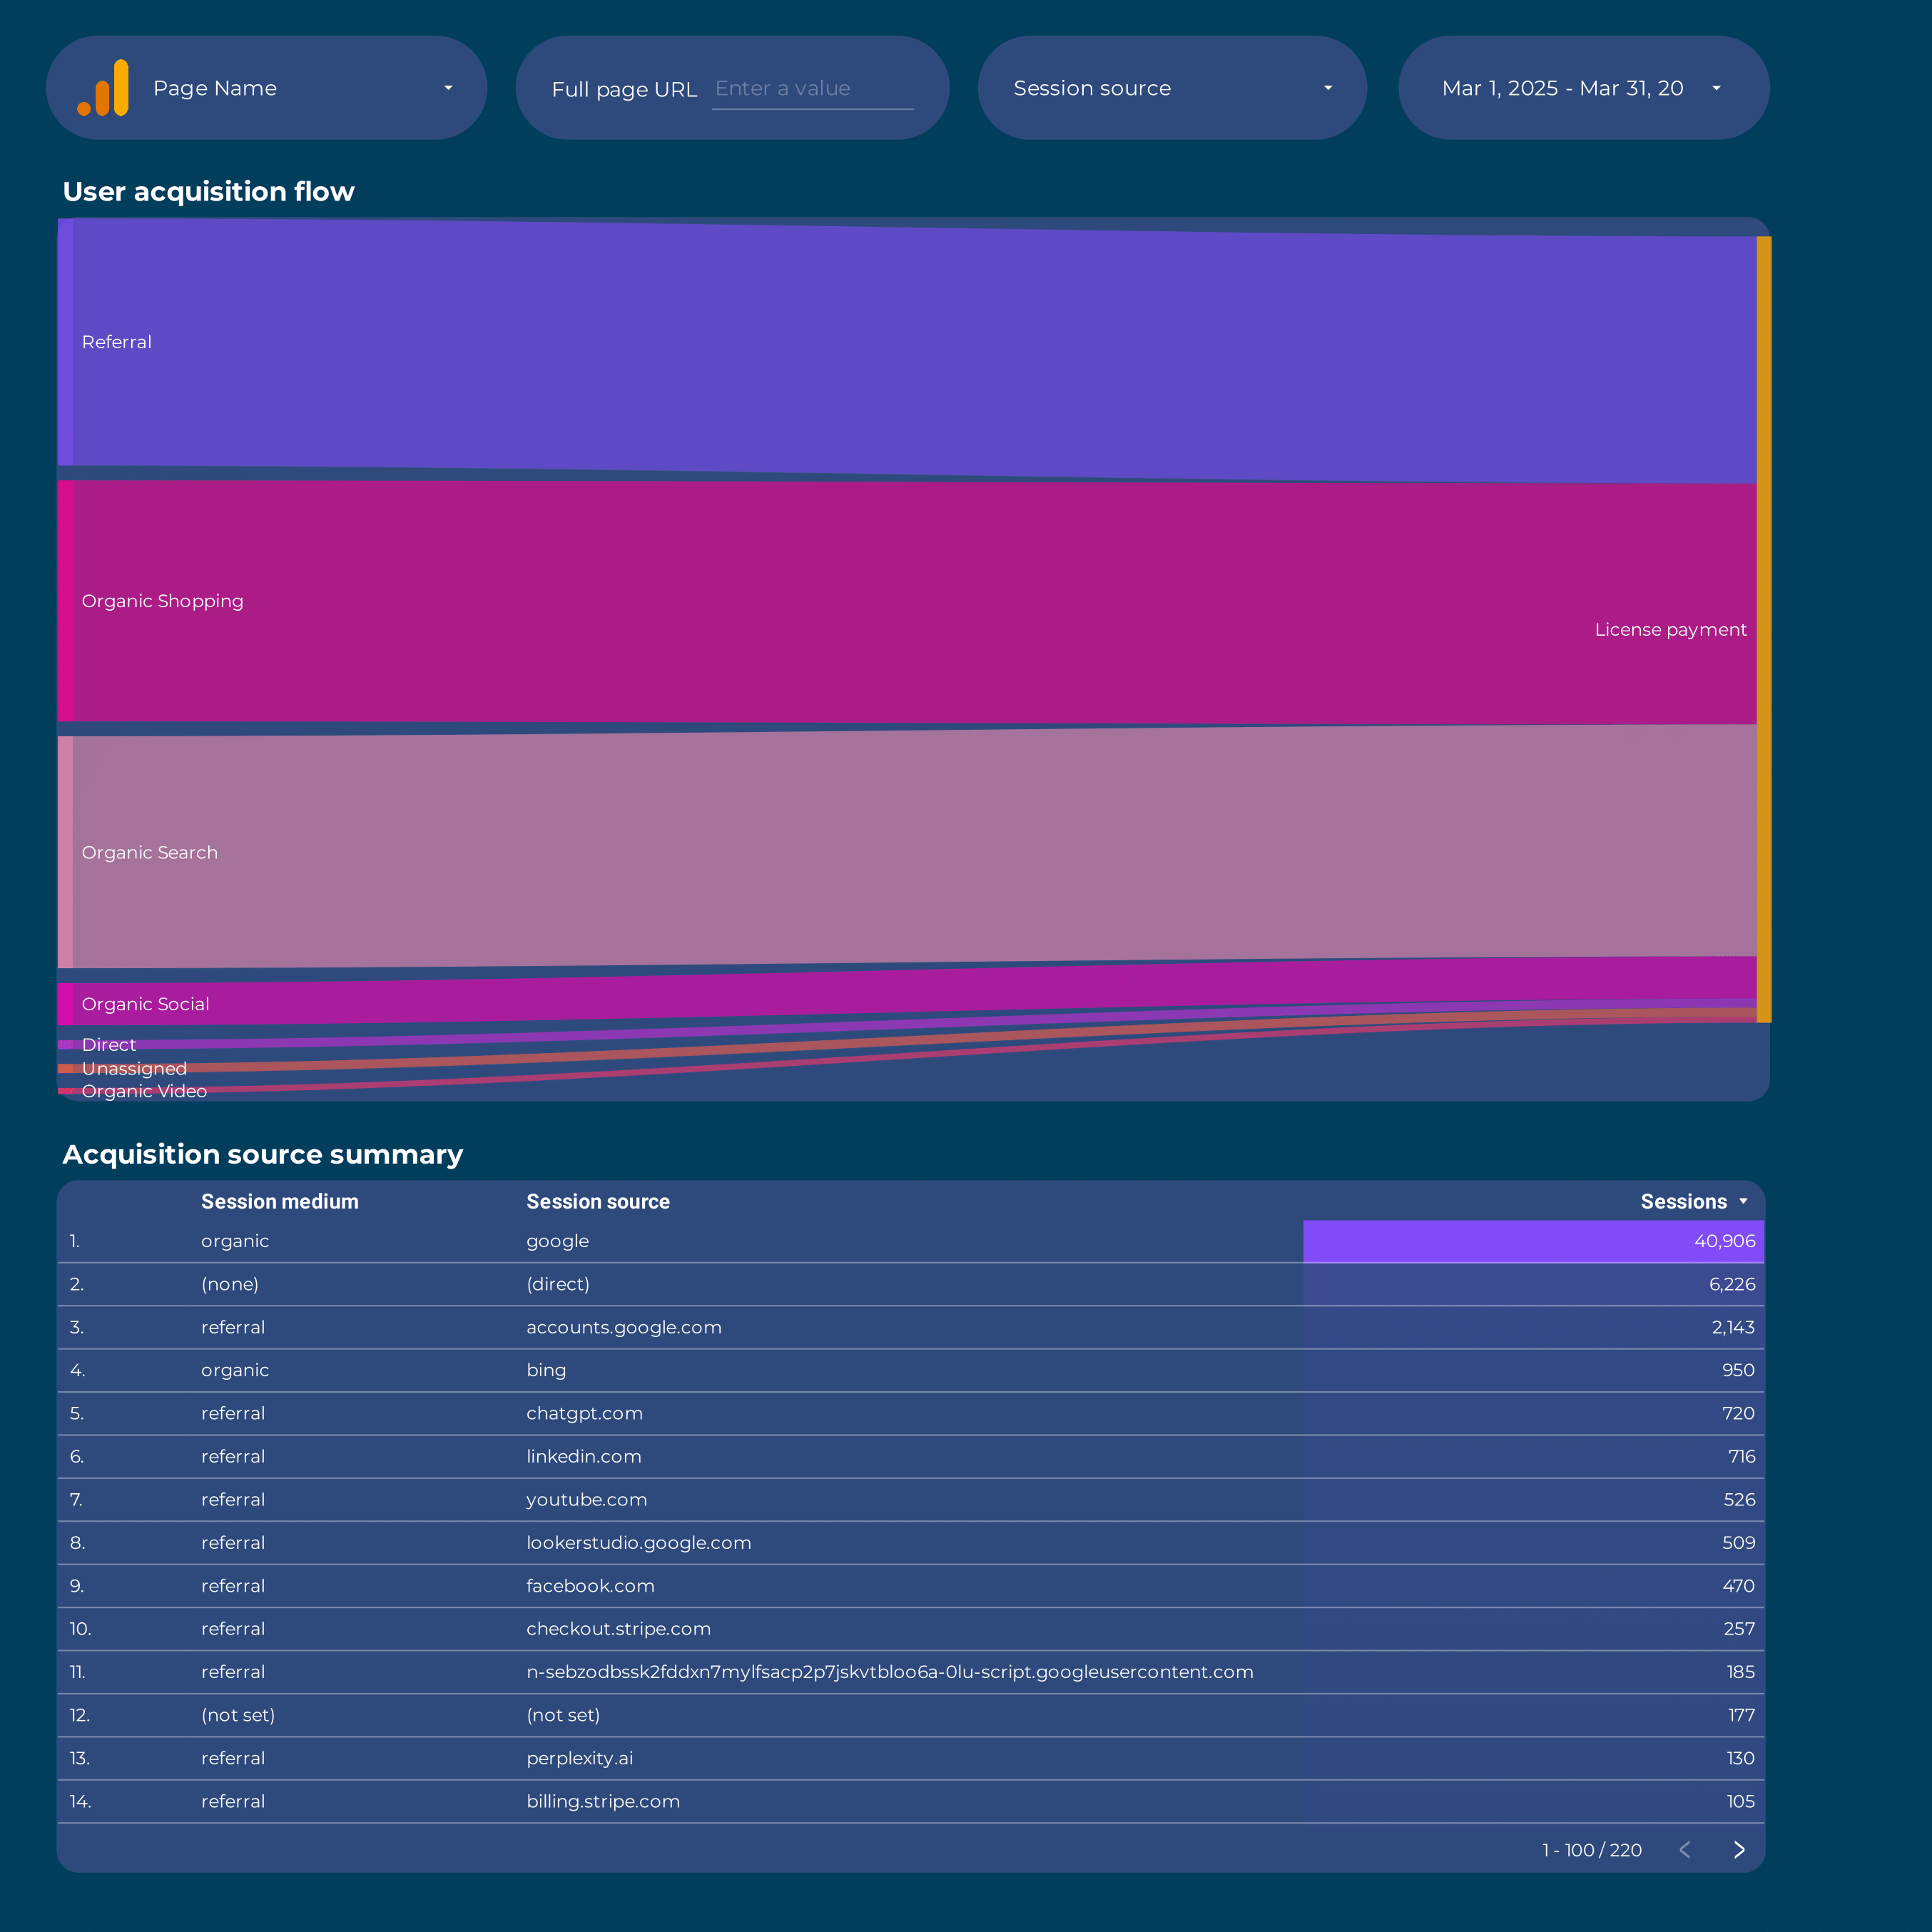
Google Analytics 4 Attribution Report template for Data Studio by Porter
Track touchpoints, assisted interactions → path length, time to conversion → attributed conversions by model. Segment by channel, model type.
Brand awareness Report template for Data Studio by Porter
Track brand impressions, reach, SOV → brand mentions, sentiment → branded search, direct traffic. Segment by channel, competitor.
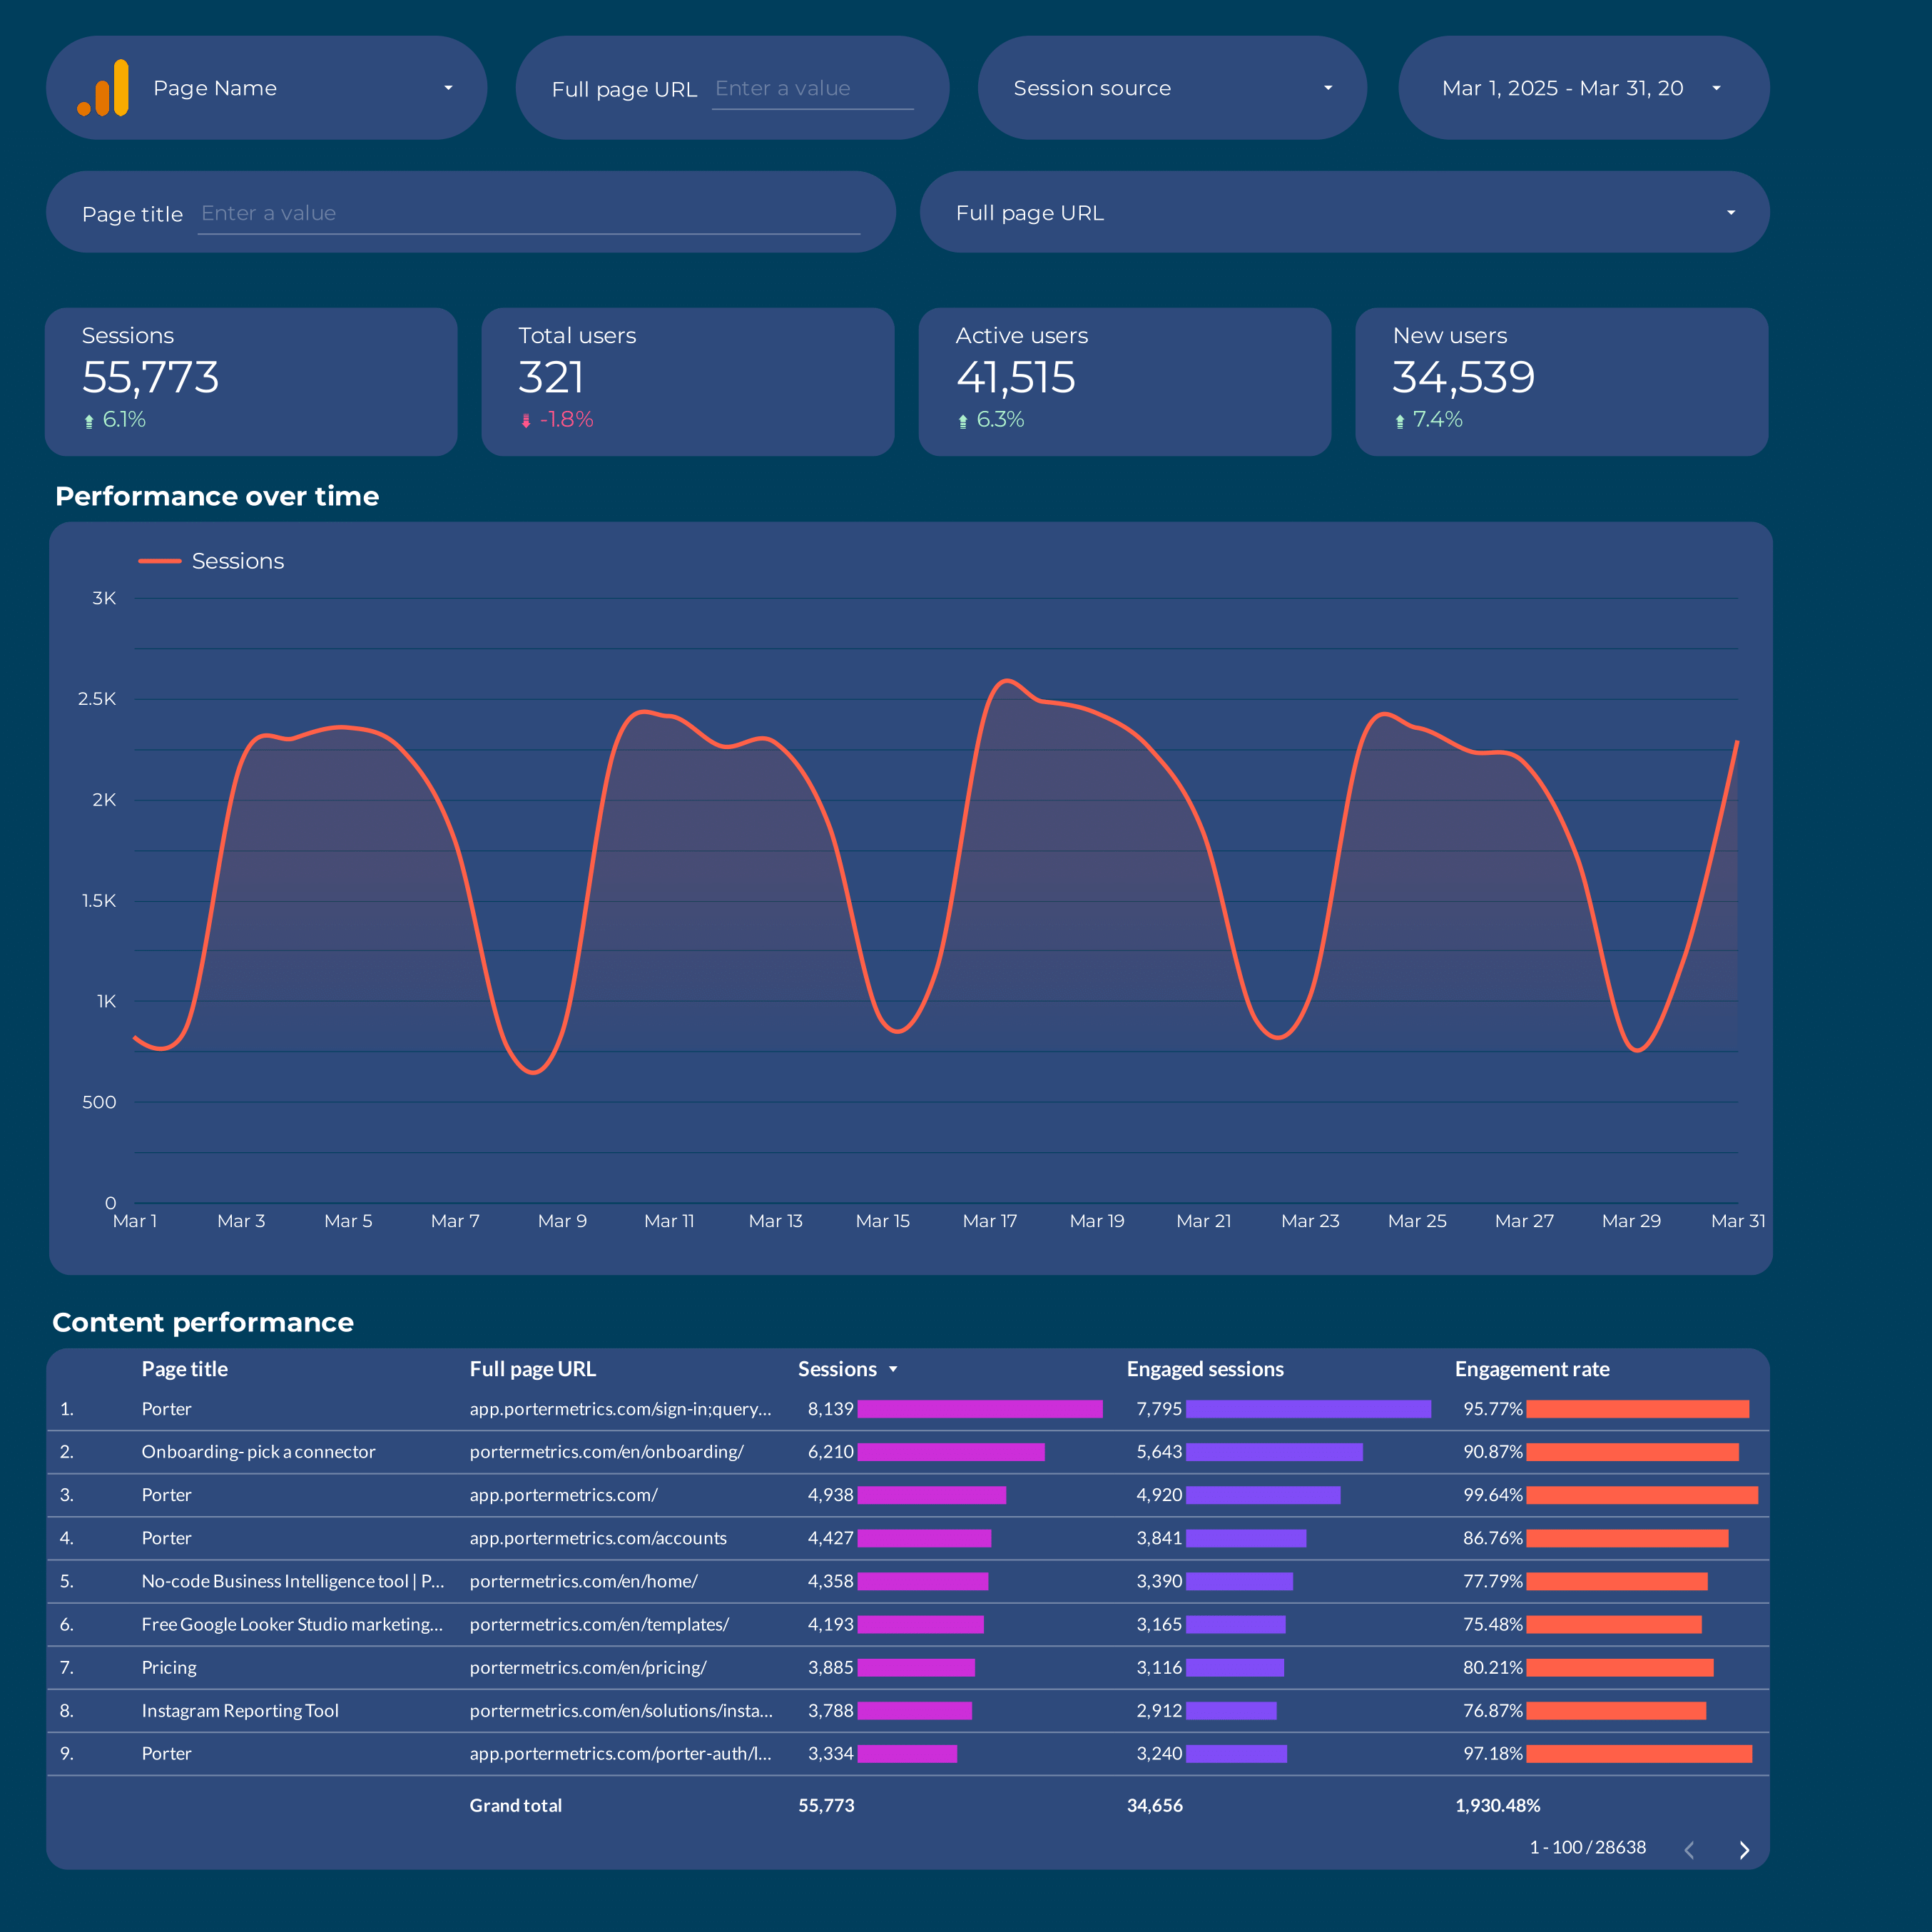
Google Analytics 4 Report template for Data Studio by Porter
Track sessions, new users by source → engagement rate, events/session → conversions by channel, revenue. Segment by source/medium, campaign, landing page.
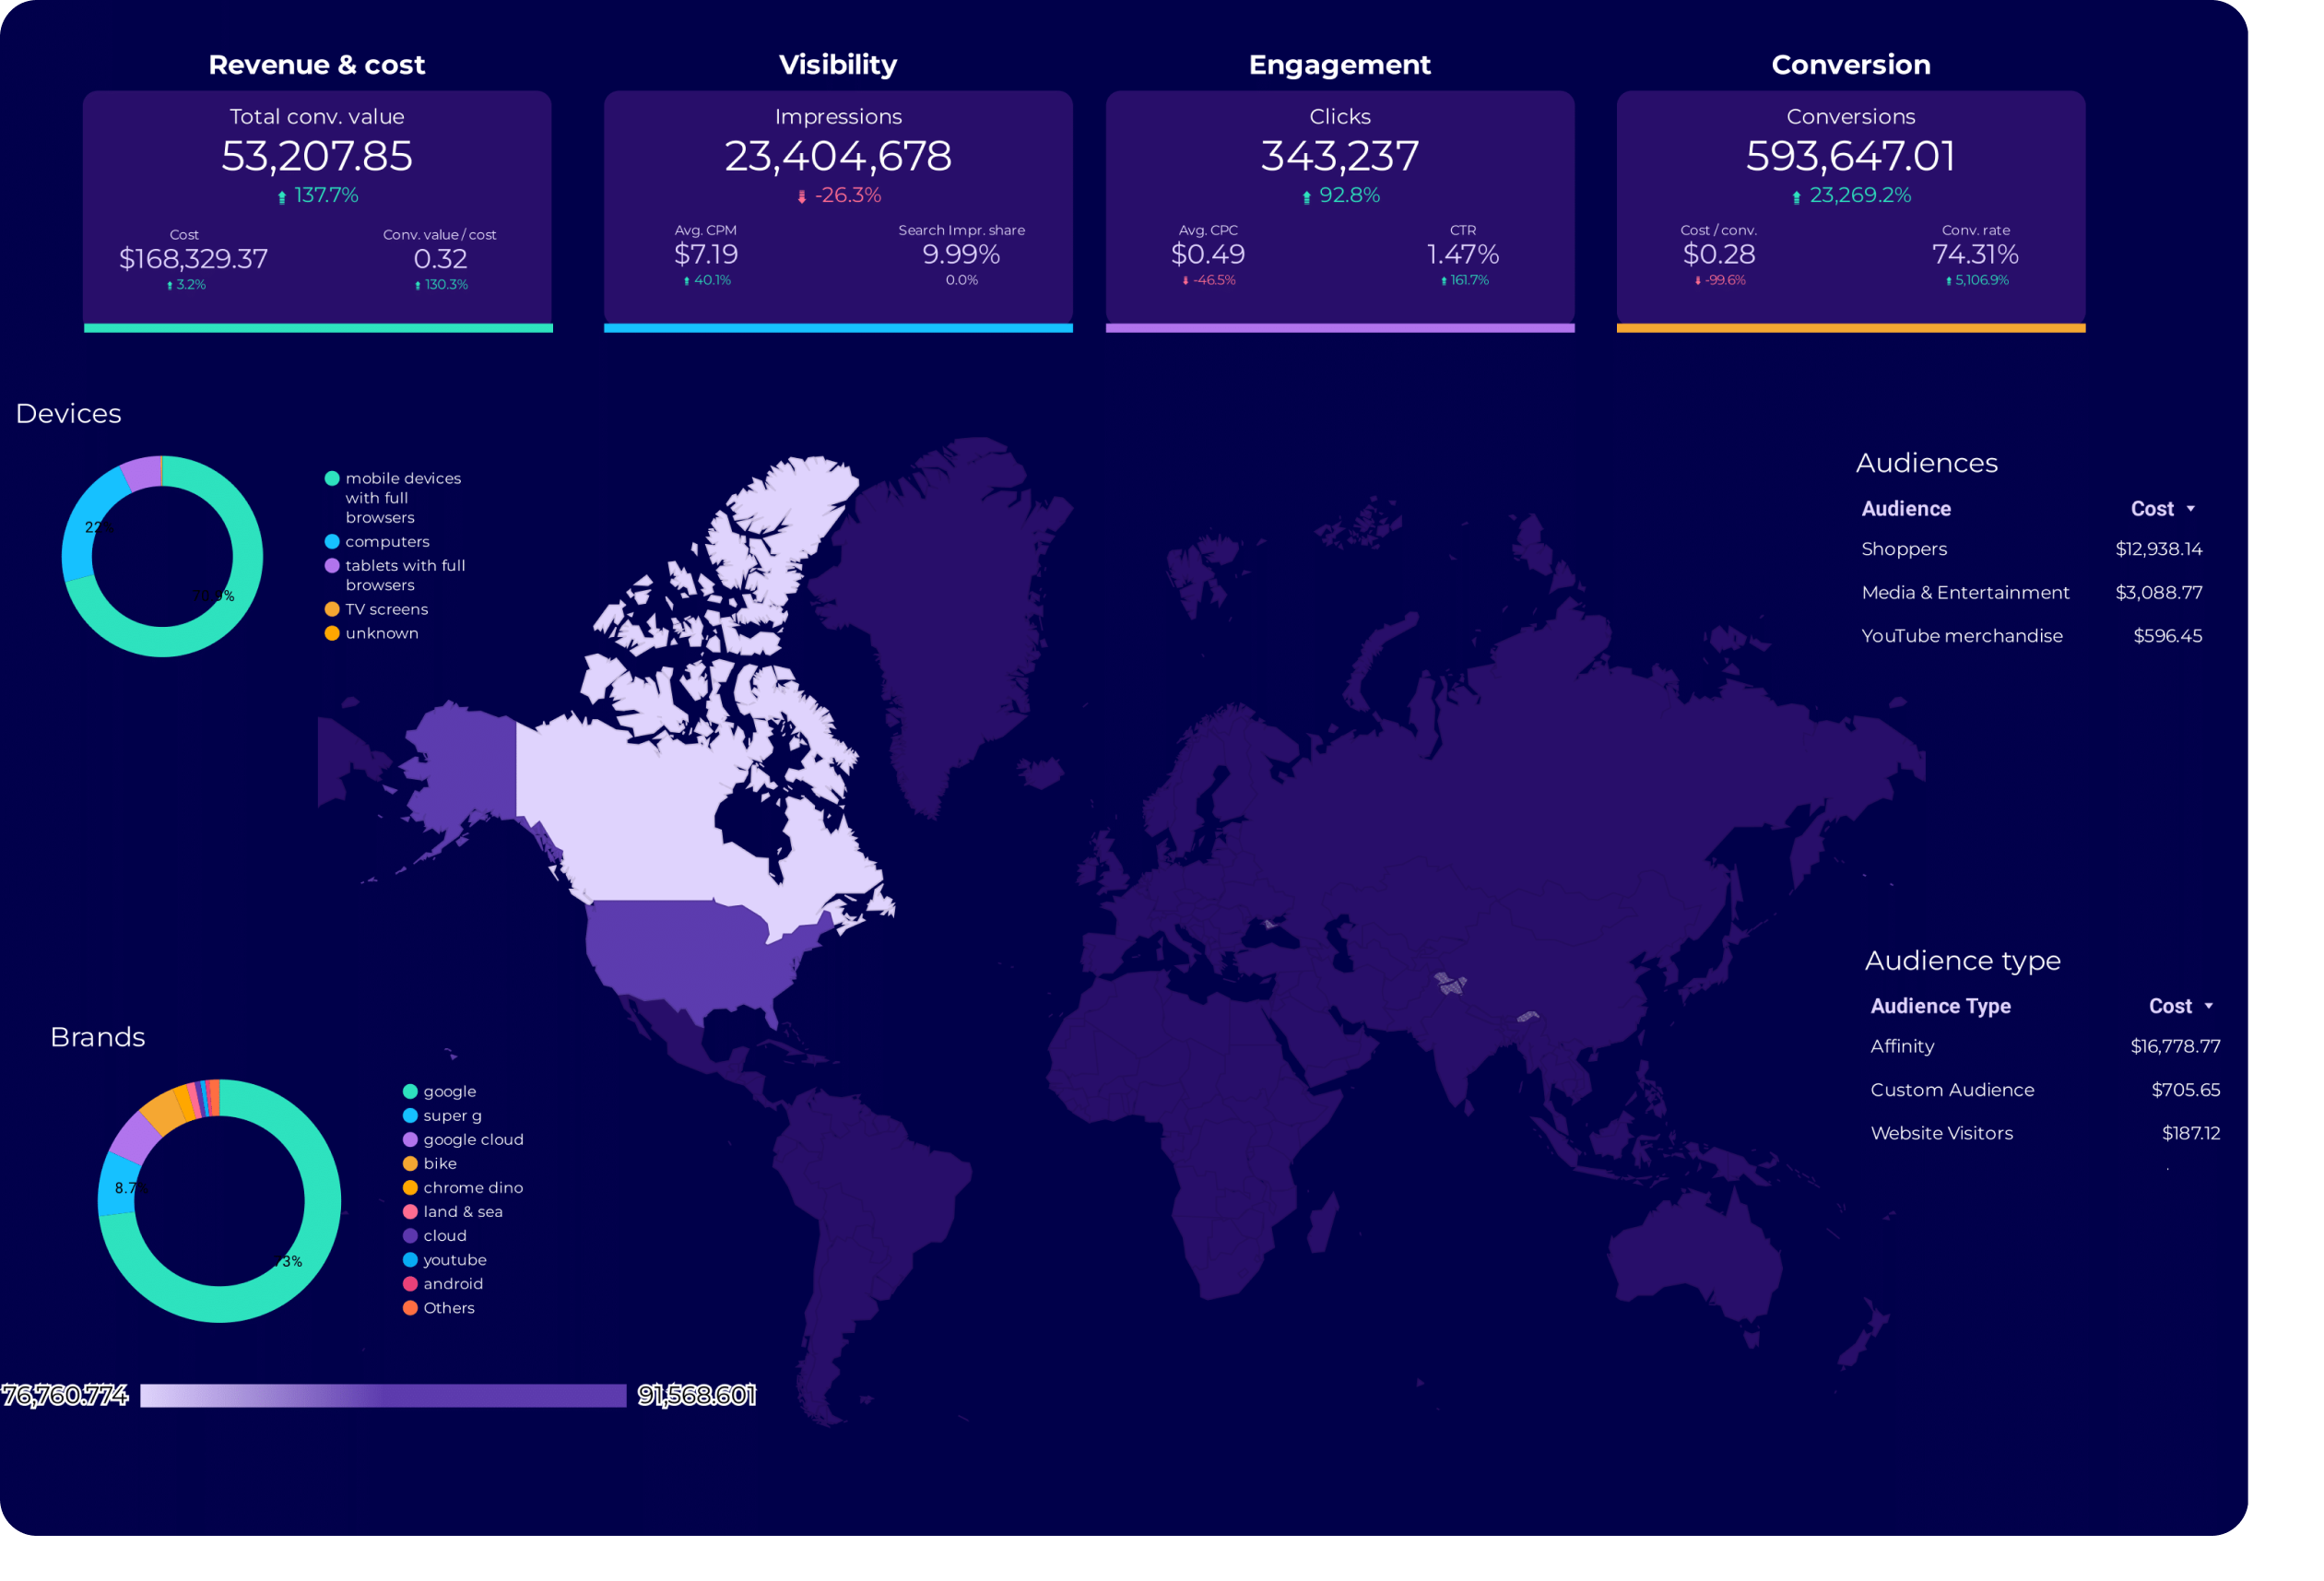
Google Ads Audience Report template for Data Studio by Porter
Track audience reach, impression share → CTR by audience segment → conversion rate by audience. Segment by audience type, remarketing.
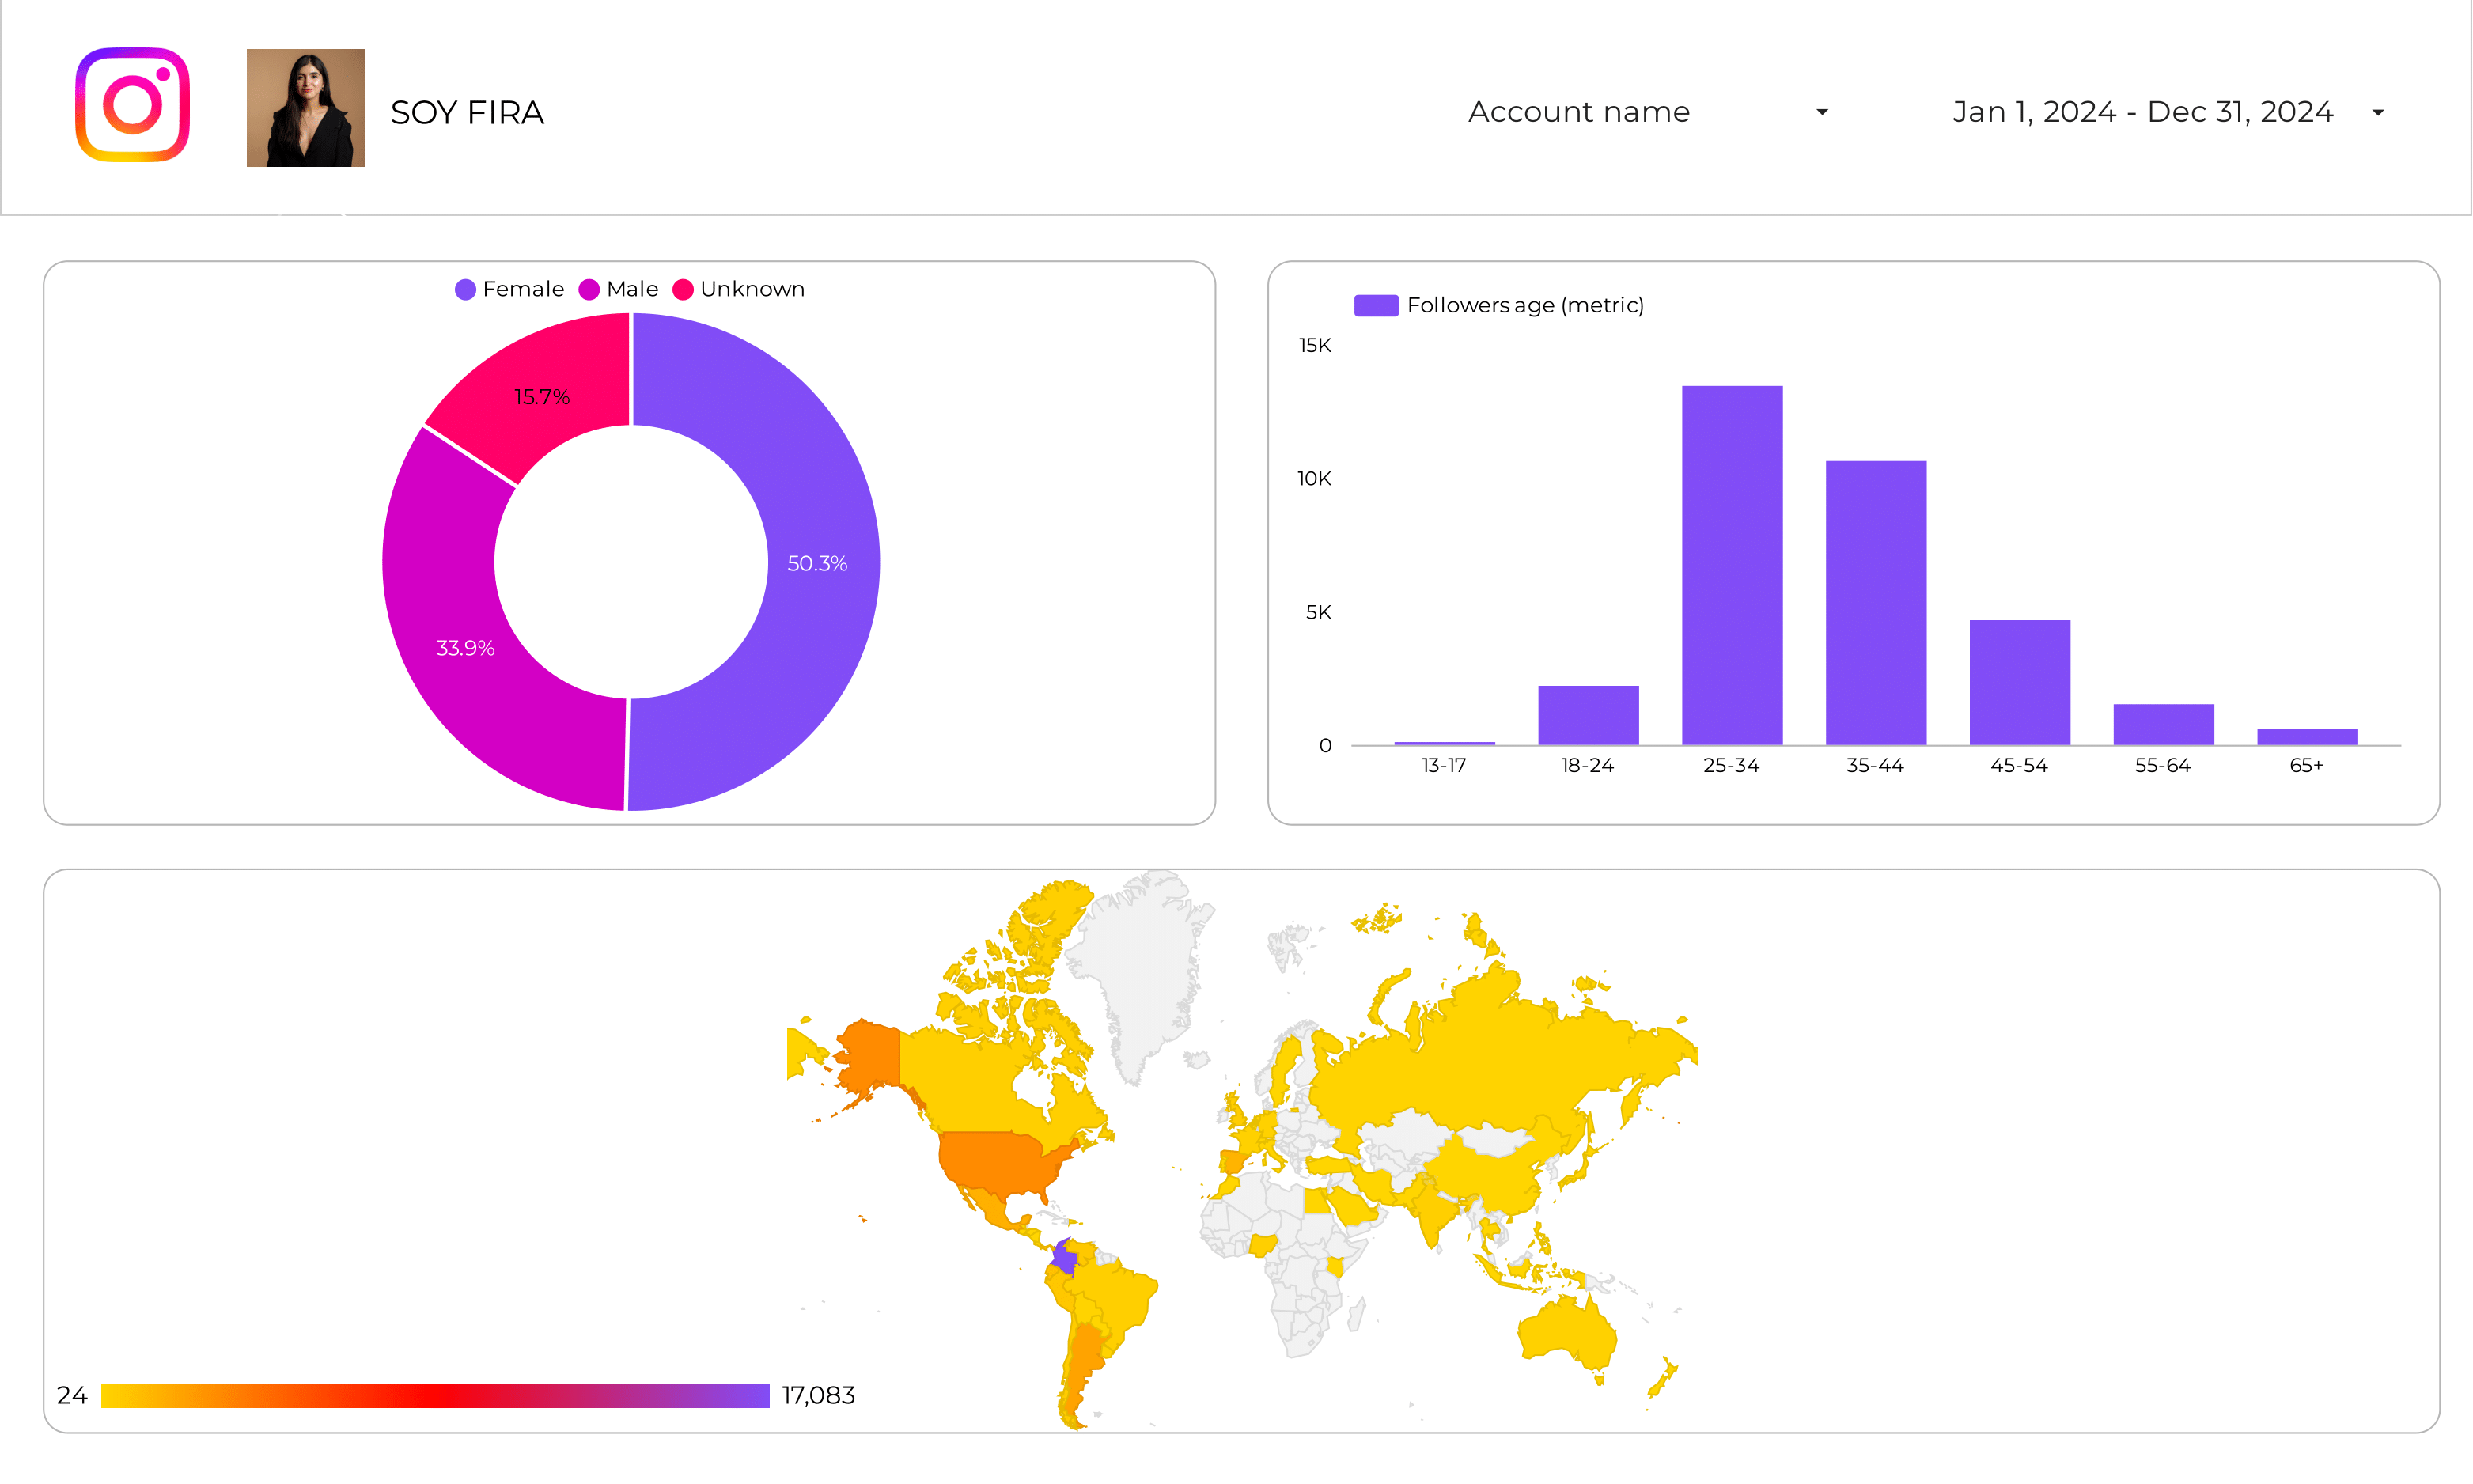
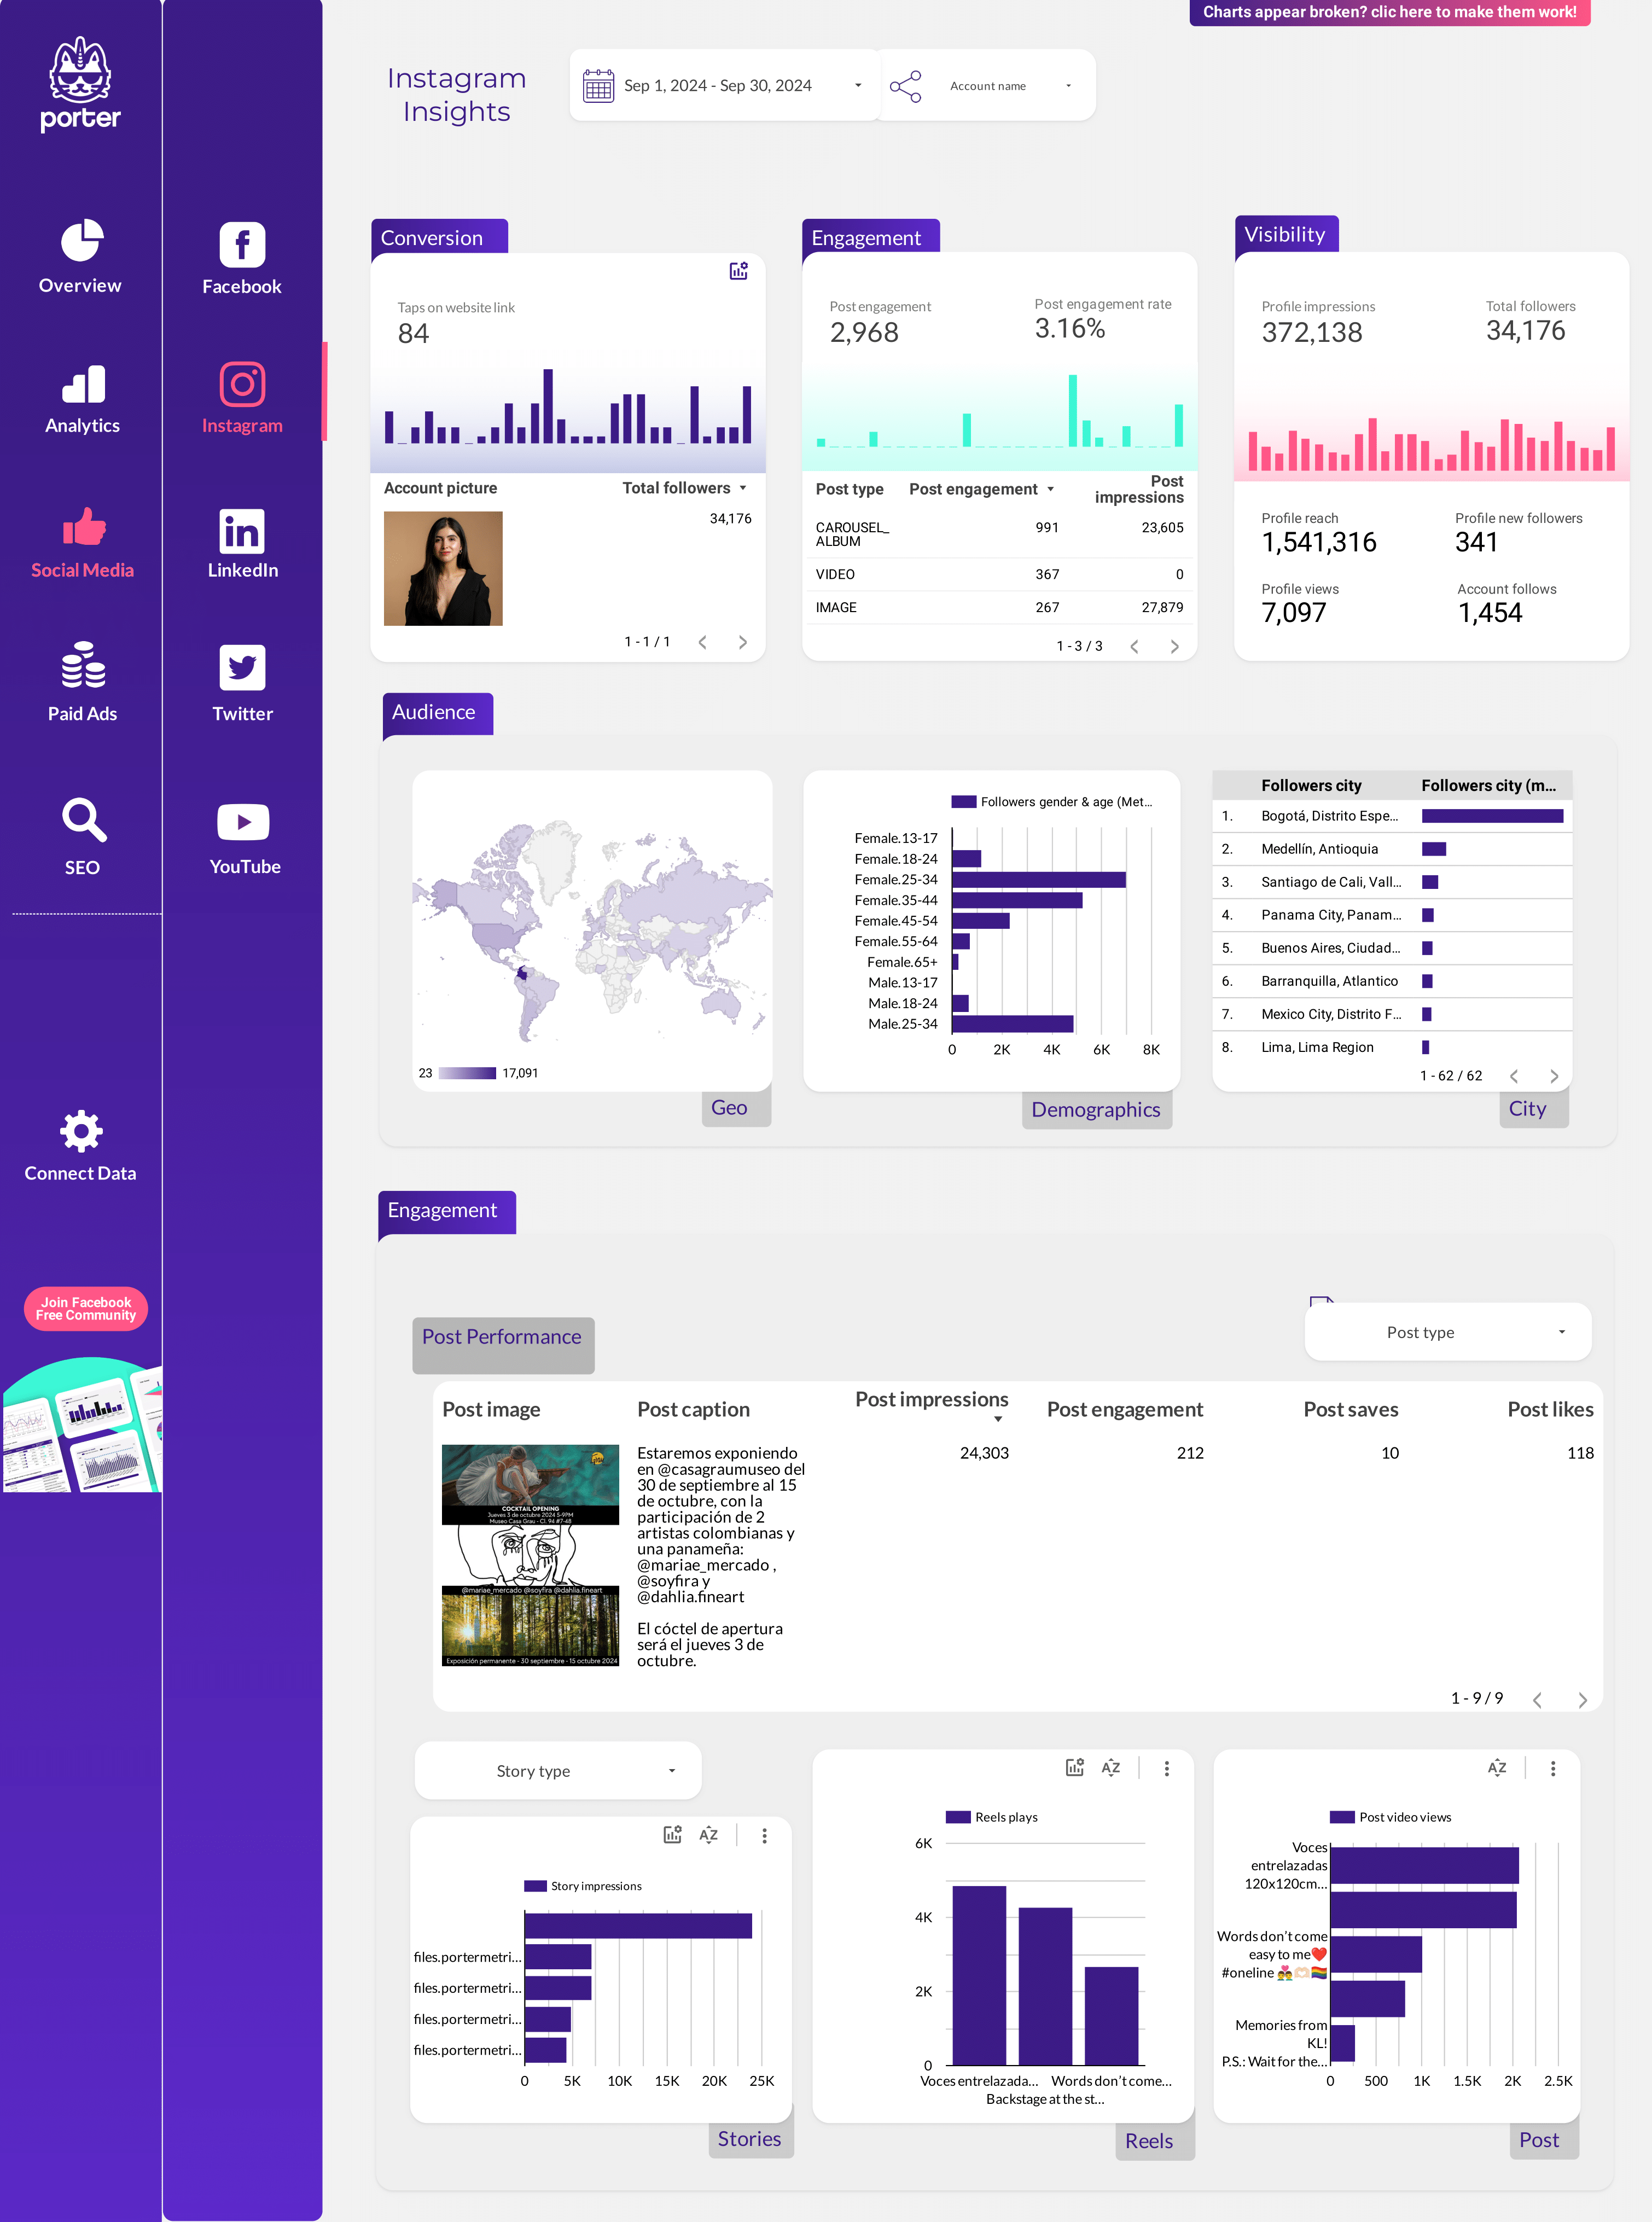
Instagram Insights Audience Report template for Data Studio by Porter
Track audience size, demographics → engagement by segment → conversion rate by demographic. Segment by age, gender, city.

