

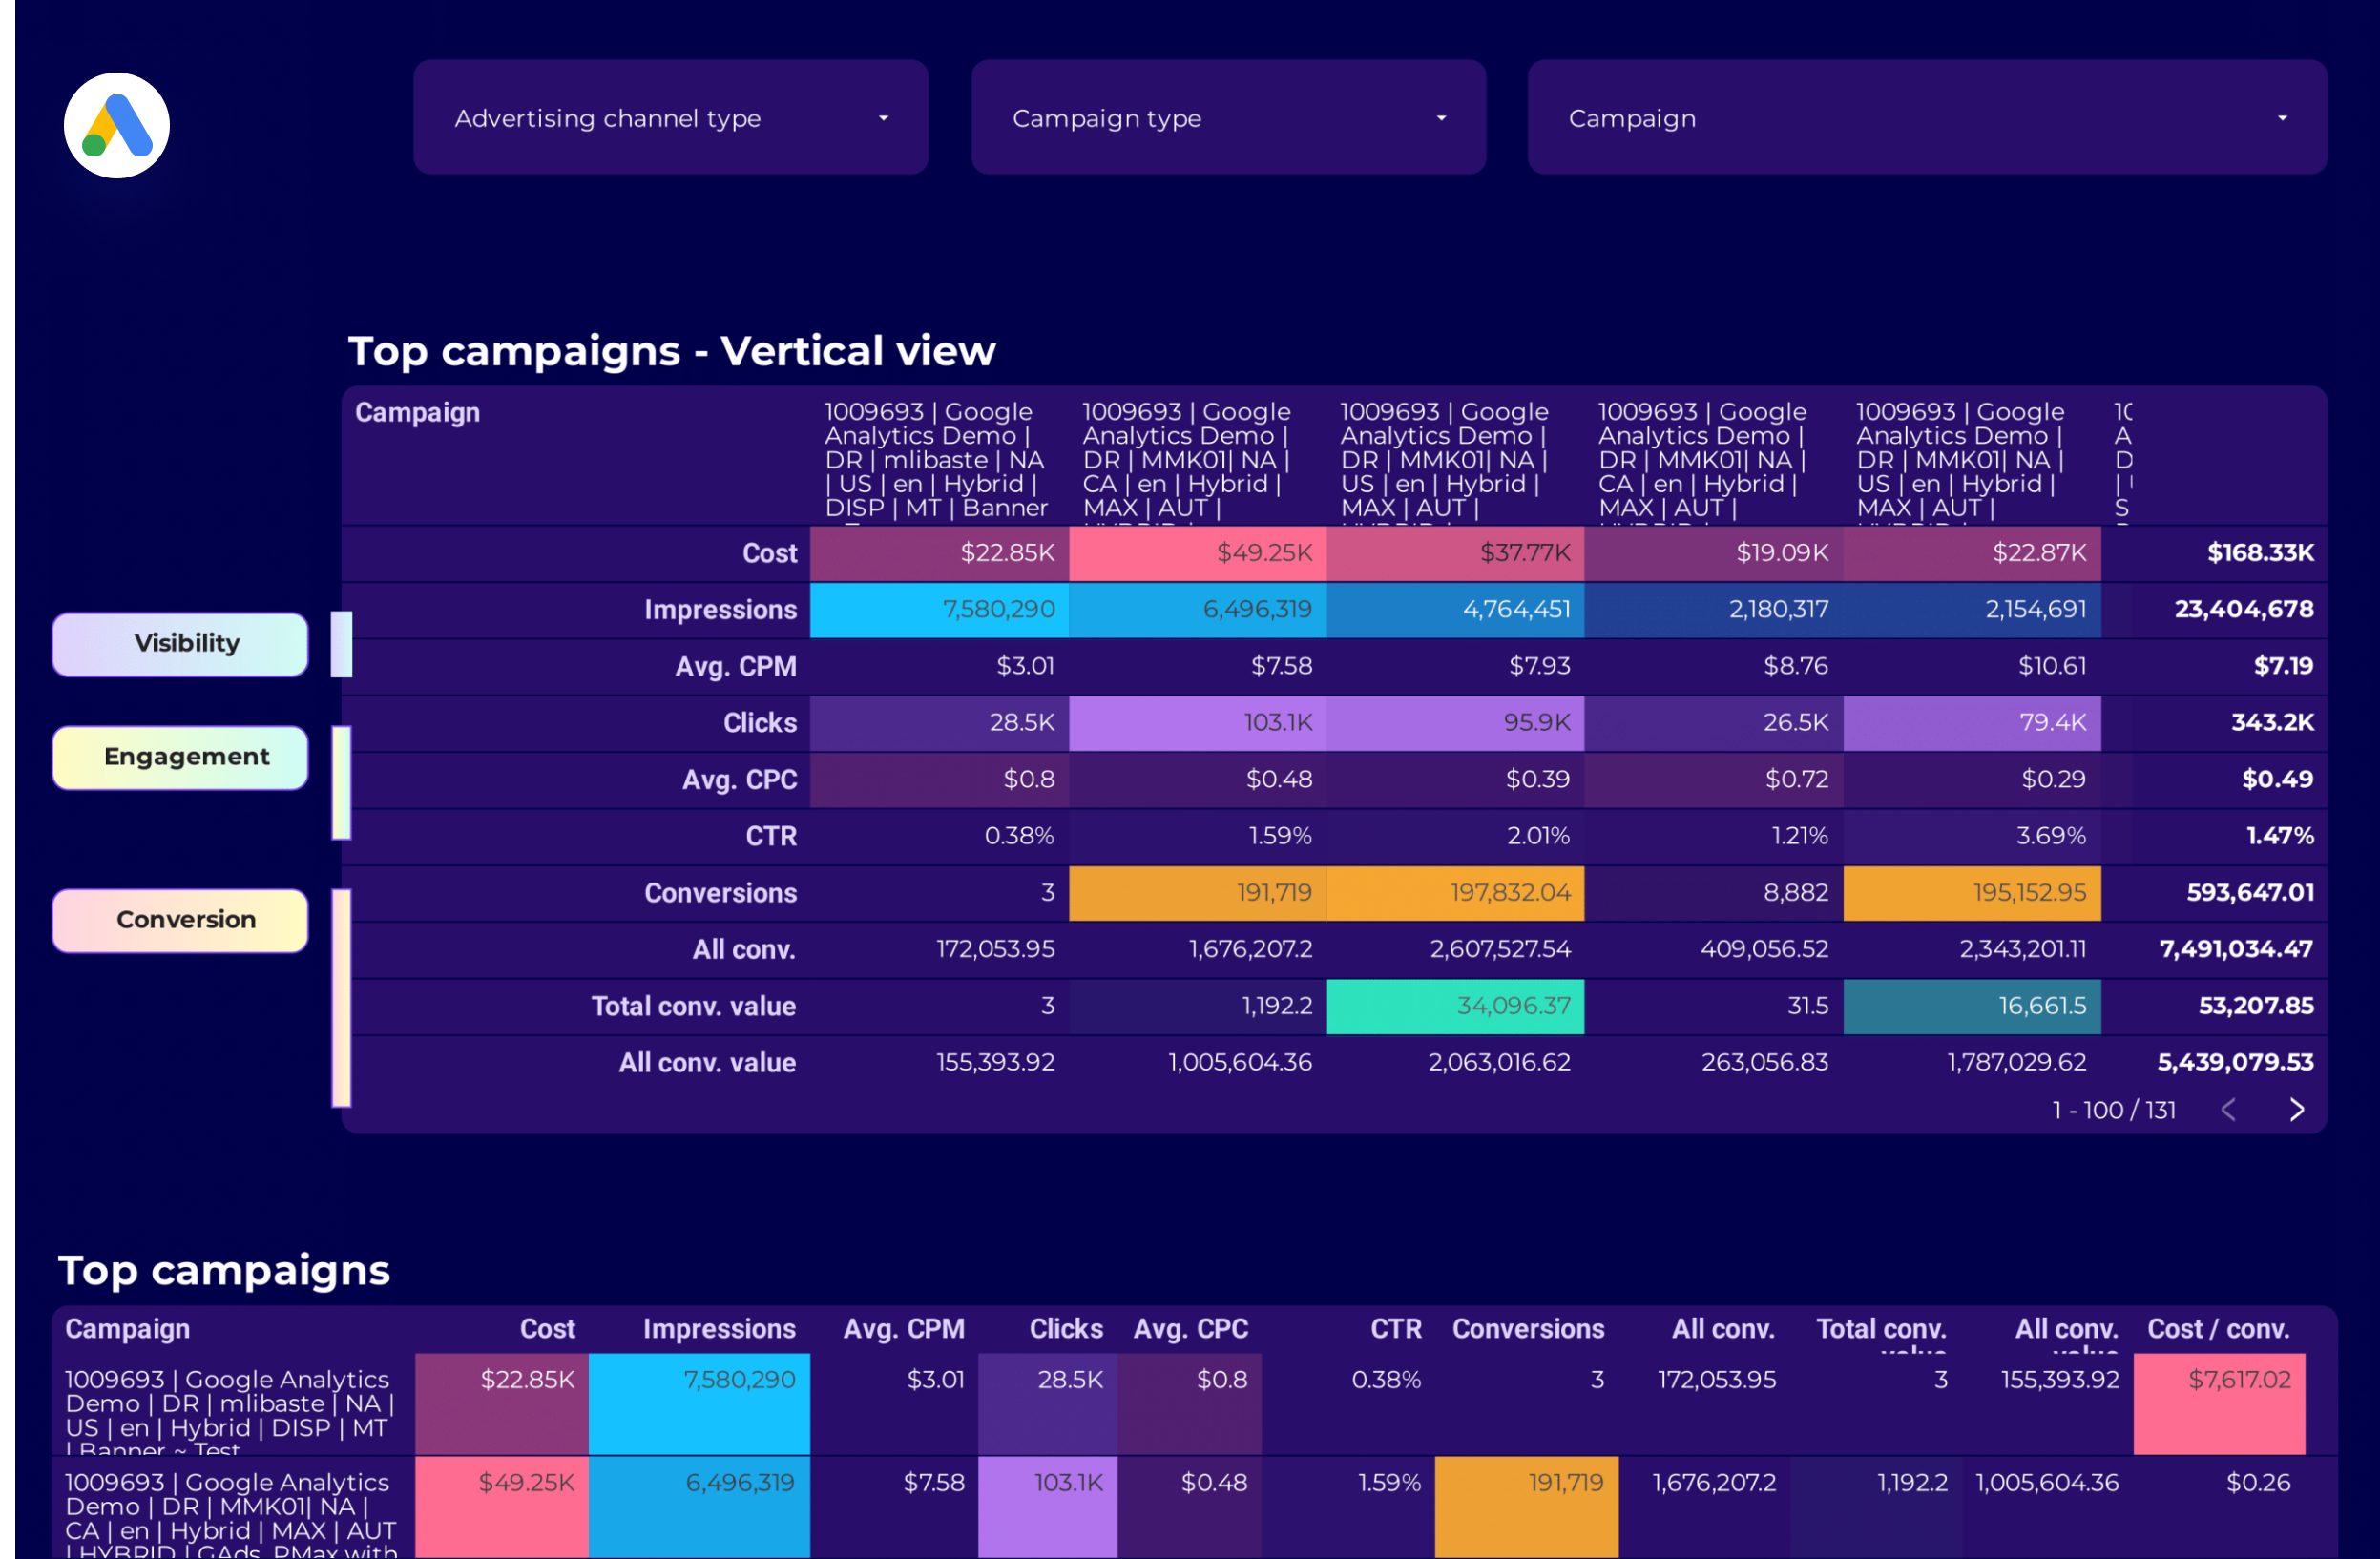
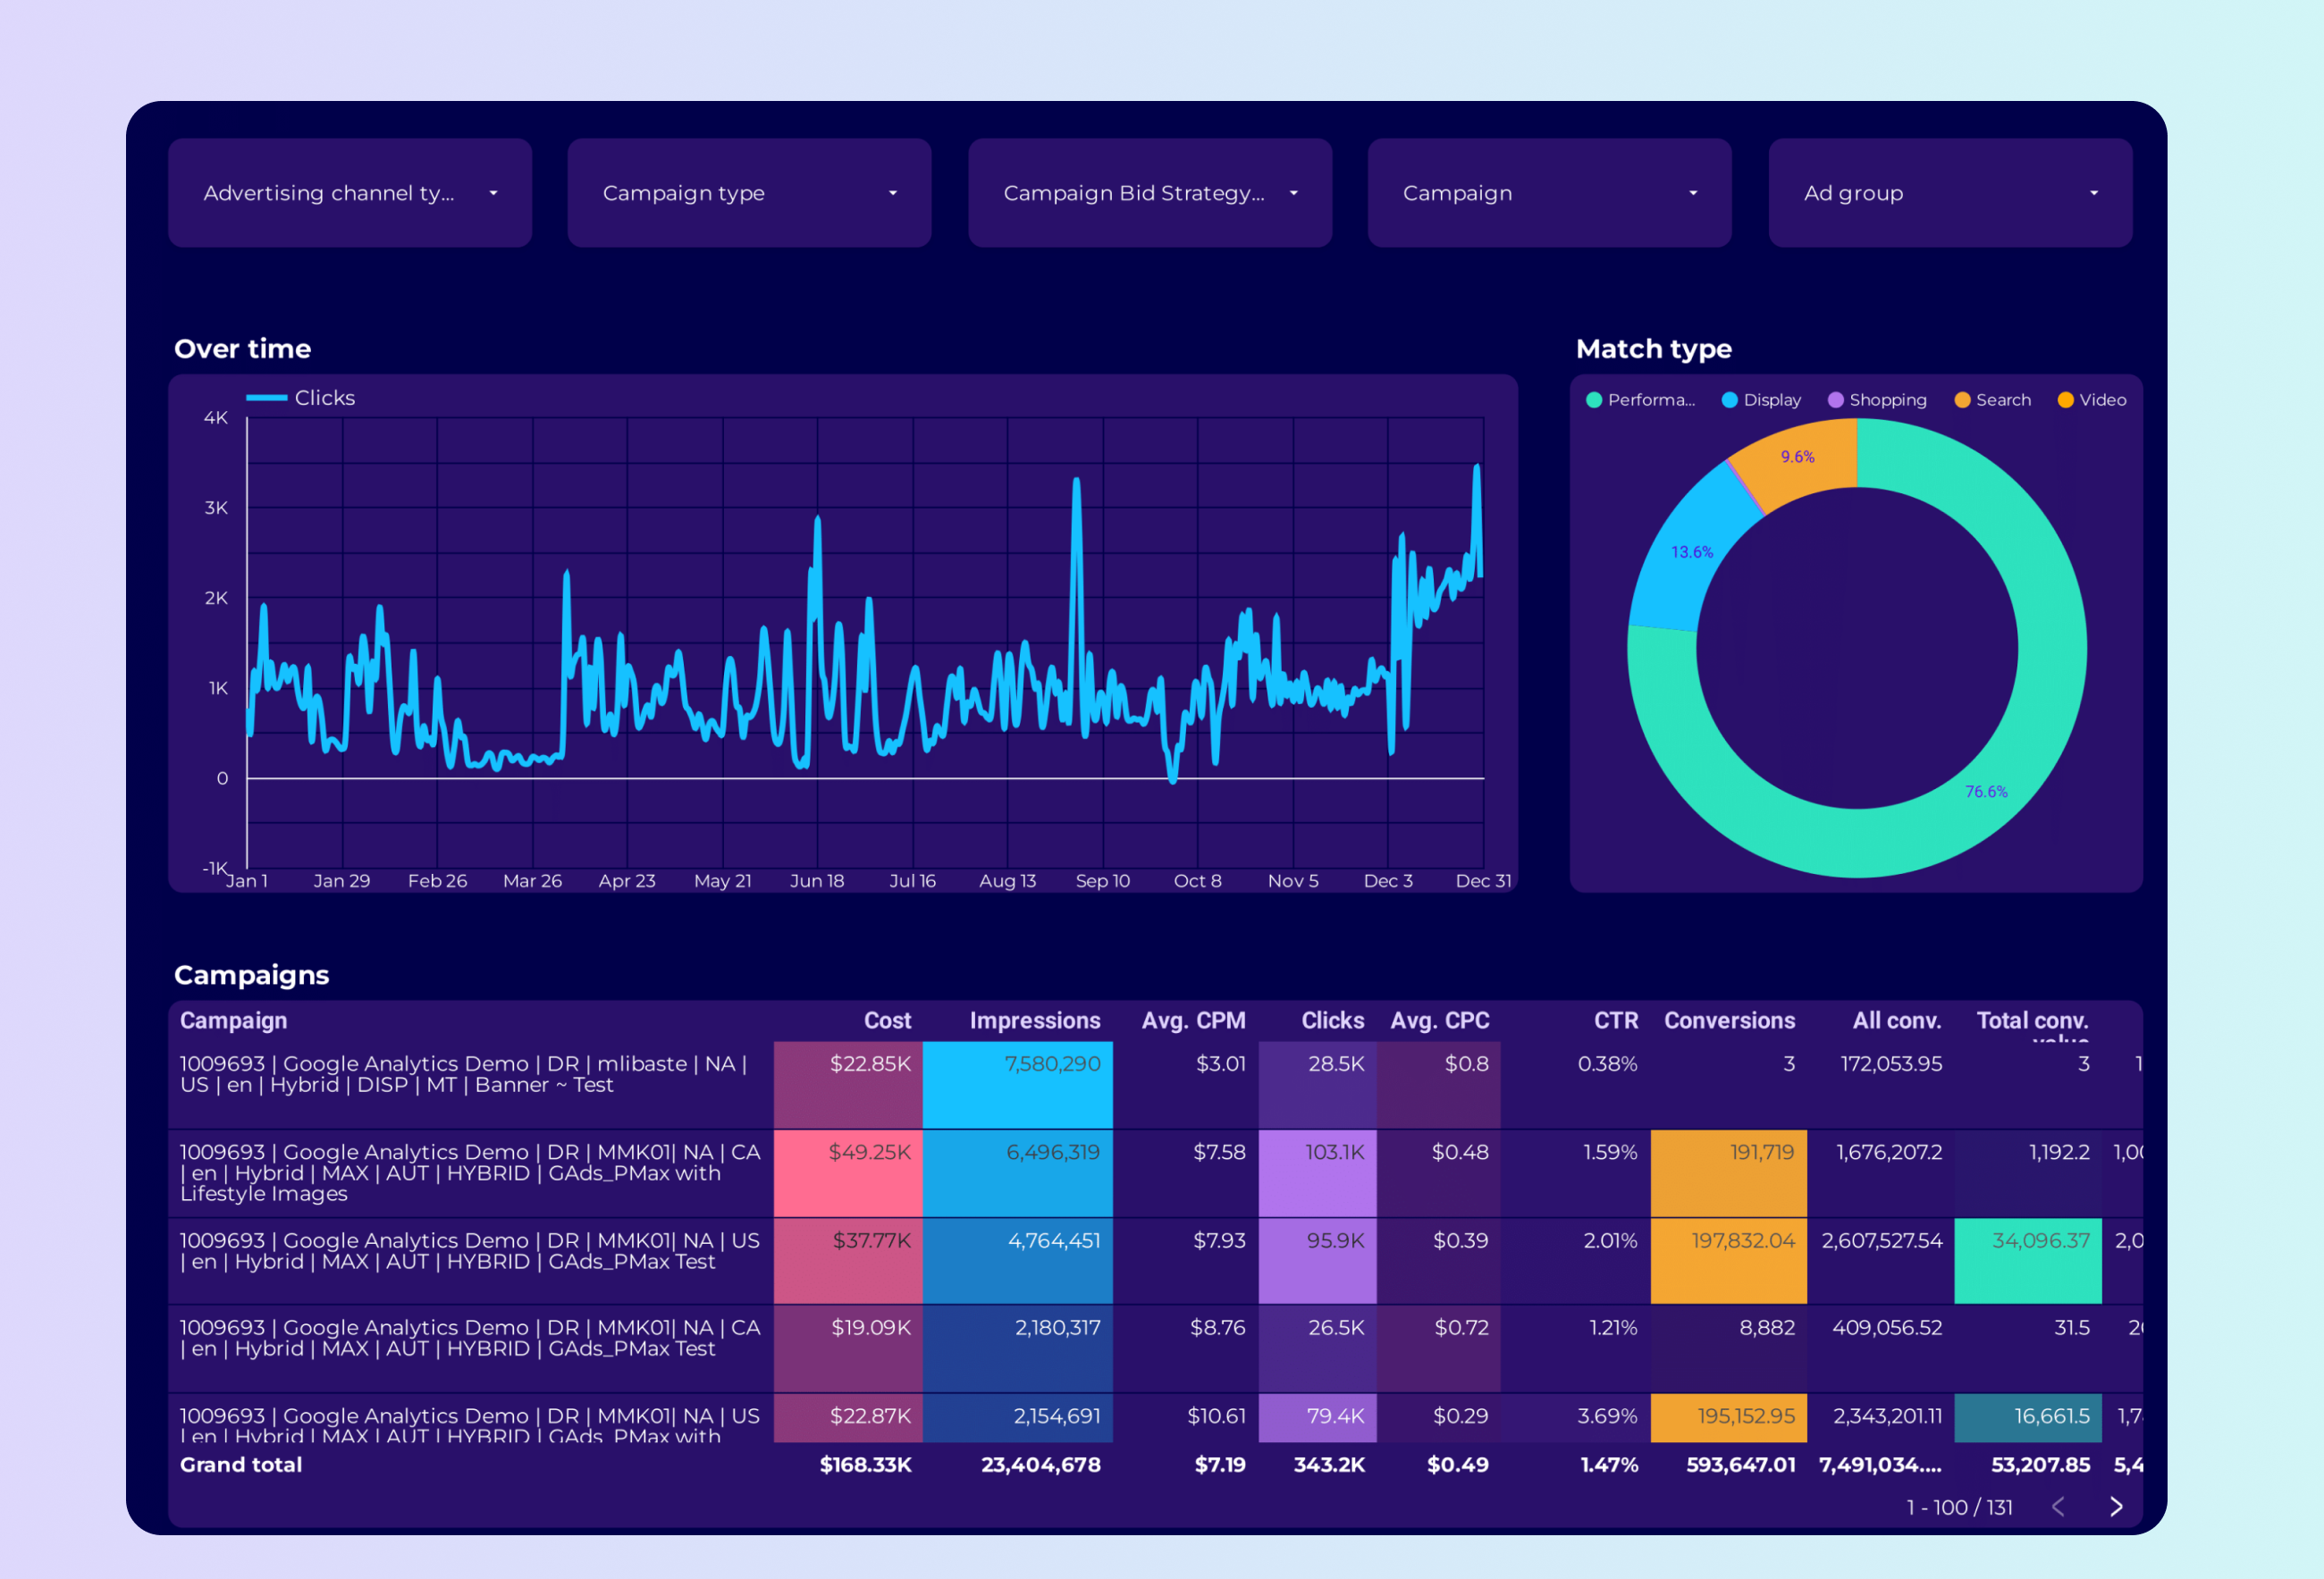
Google Ads Campaign performance Dashboard template
The Google Ads Campaign Performance Dashboard template provides a structured view of your PPC campaigns. This dashboard is designed to offer insights into various metrics that are crucial for analyzing the performance of your Google Ads campaigns.
With this dashboard, you can monitor:
- Impressions: Track how often your ads are shown.
- Clicks: Measure the number of times users click on your ads.
- Click-Through Rate (CTR): Calculate the ratio of clicks to impressions.
- Cost-Per-Click (CPC): Determine the average cost incurred for each click.
- Conversions: Analyze the number of completed actions defined as valuable.
- Conversion Rate: Assess the percentage of clicks that result in conversions.
- Cost-Per-Conversion: Evaluate the cost associated with each conversion.
This template is essential for PPC managers who need to track and report on the performance of their Google Ads campaigns. It provides a clear and concise view of the data, allowing for informed decision-making and strategic planning.

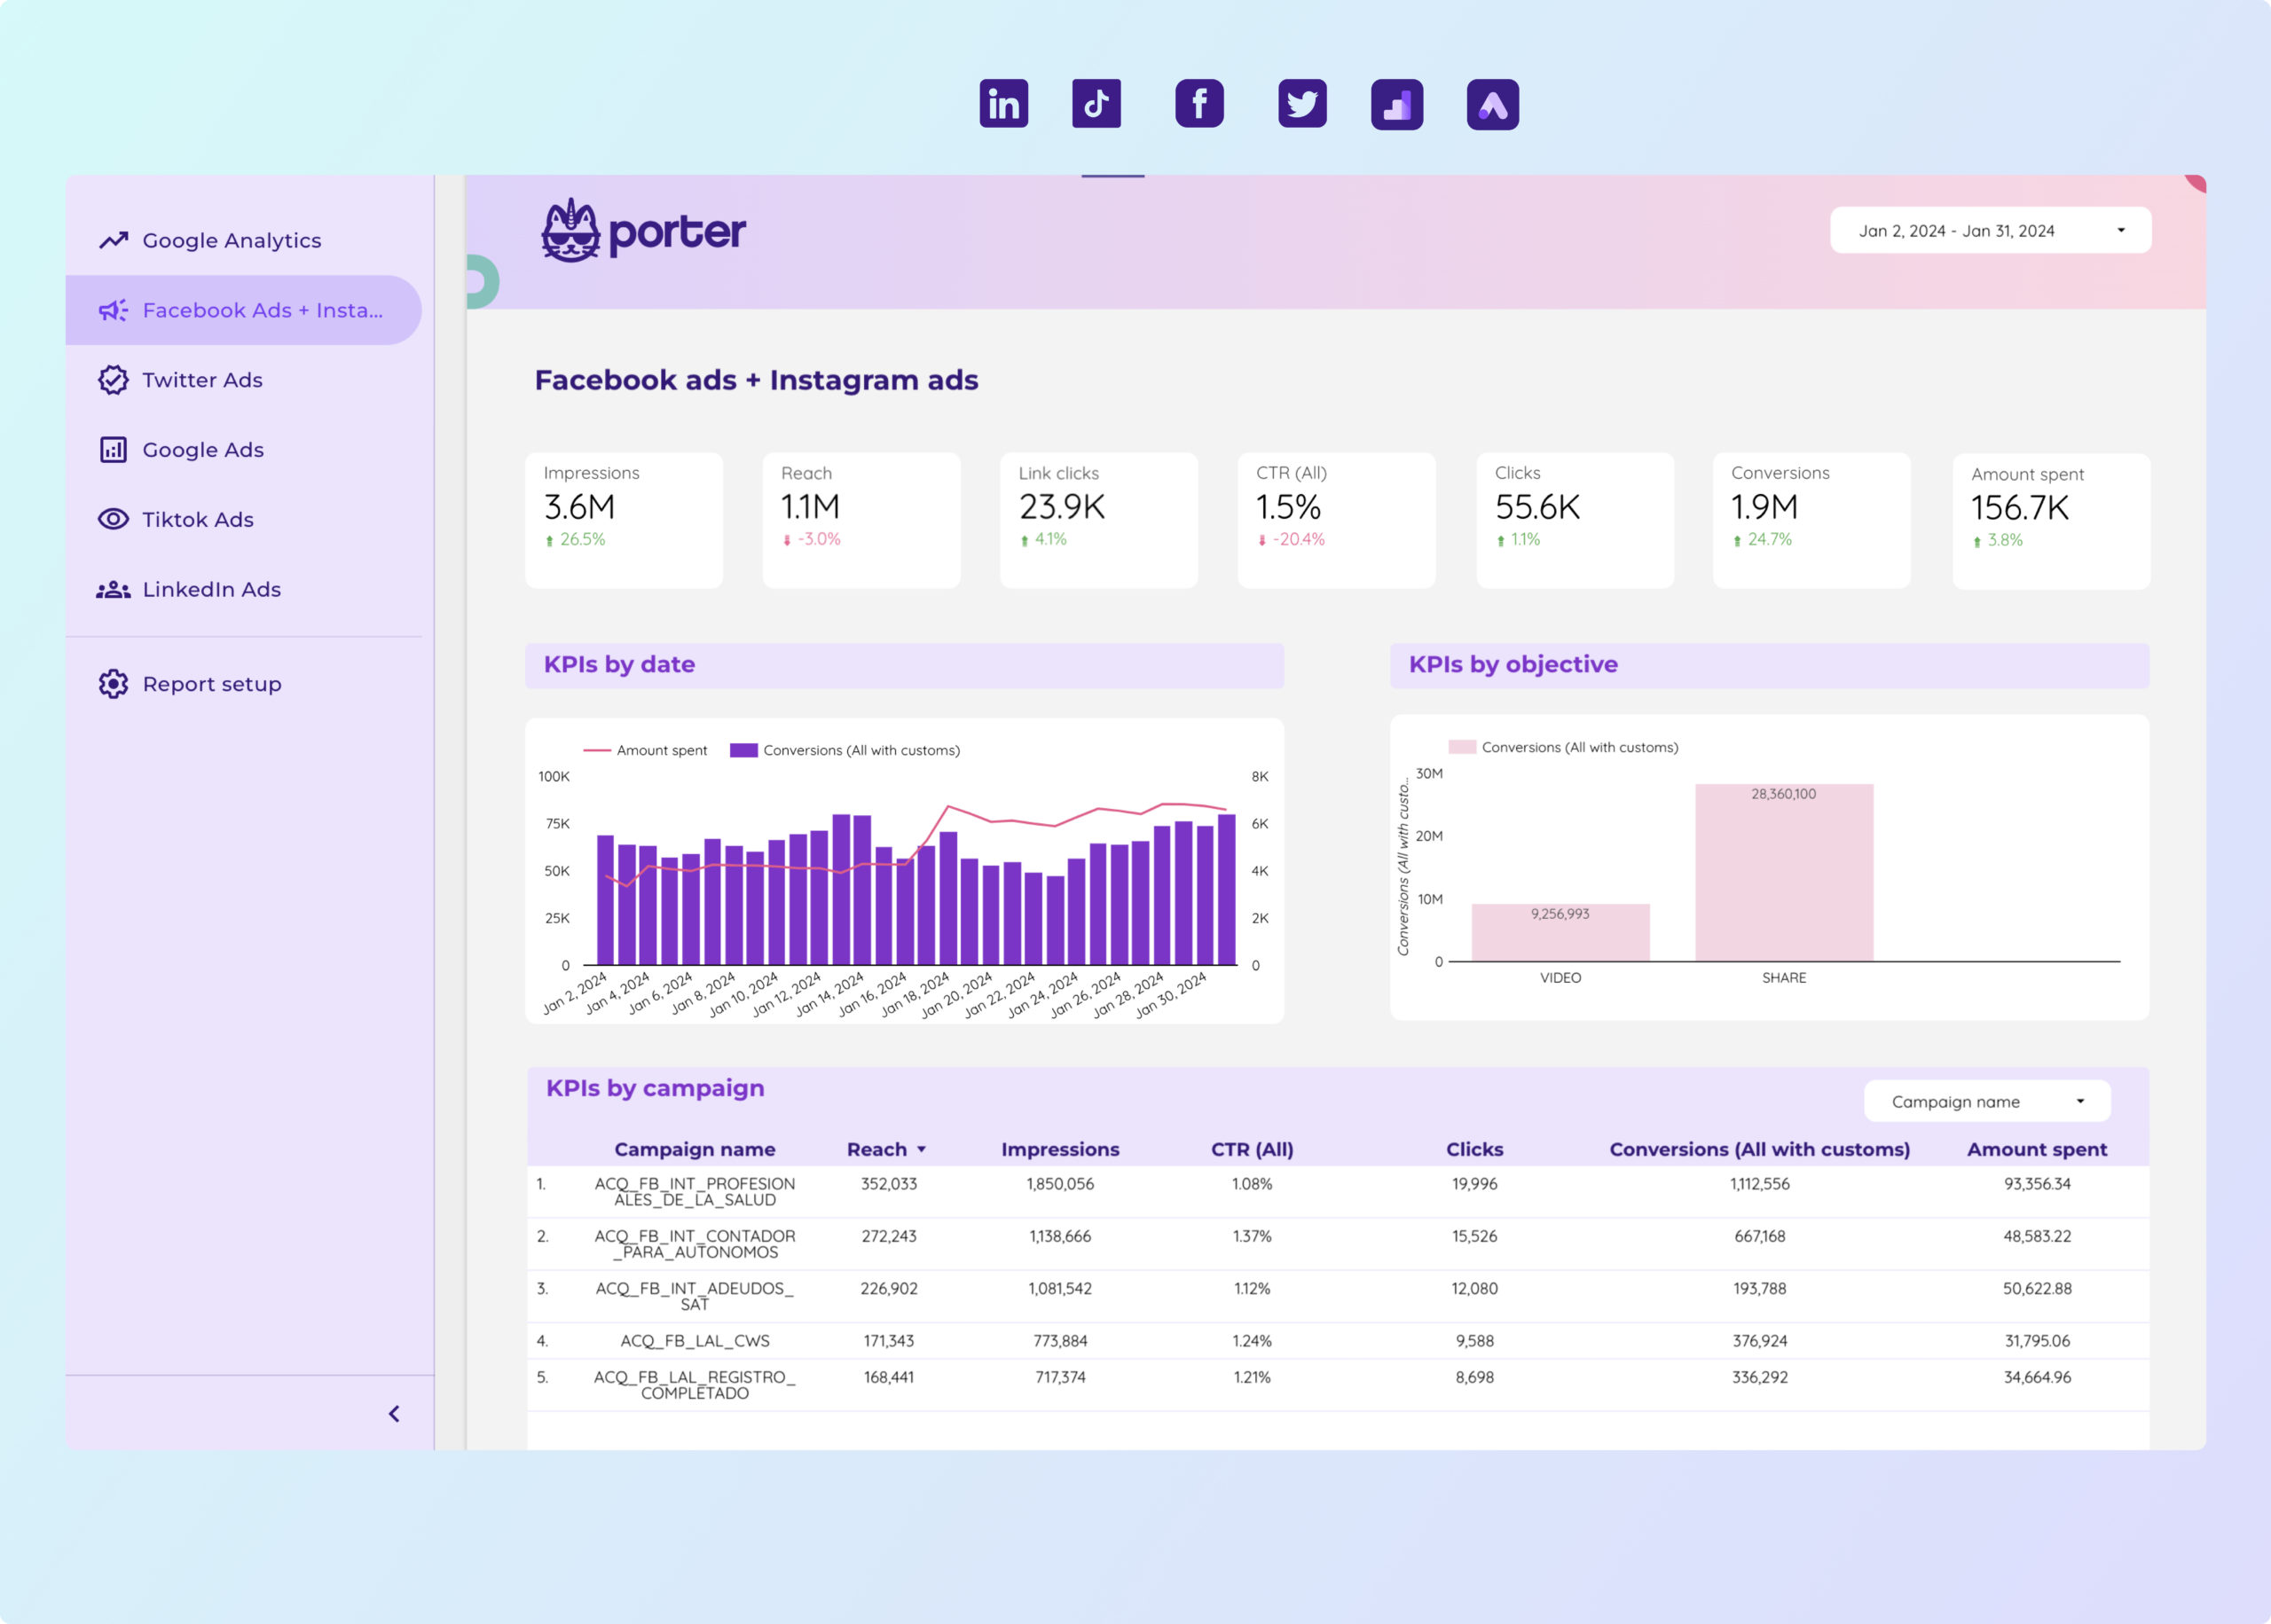
PPC multi-channel Dashboard template
The PPC Multi-Channel Dashboard Template is designed for marketers managing campaigns across various platforms. This template integrates data from TikTok Ads, Facebook Ads, Google Ads, Twitter Ads, and LinkedIn Ads.
With this dashboard, users can:
- Track performance metrics across all channels in one place.
- Analyze campaign data to identify trends and patterns.
- Compare ad spend and ROI across different platforms.
- Monitor audience engagement and conversion rates.
This template supports data-driven decision-making by providing a unified view of multi-channel PPC efforts.
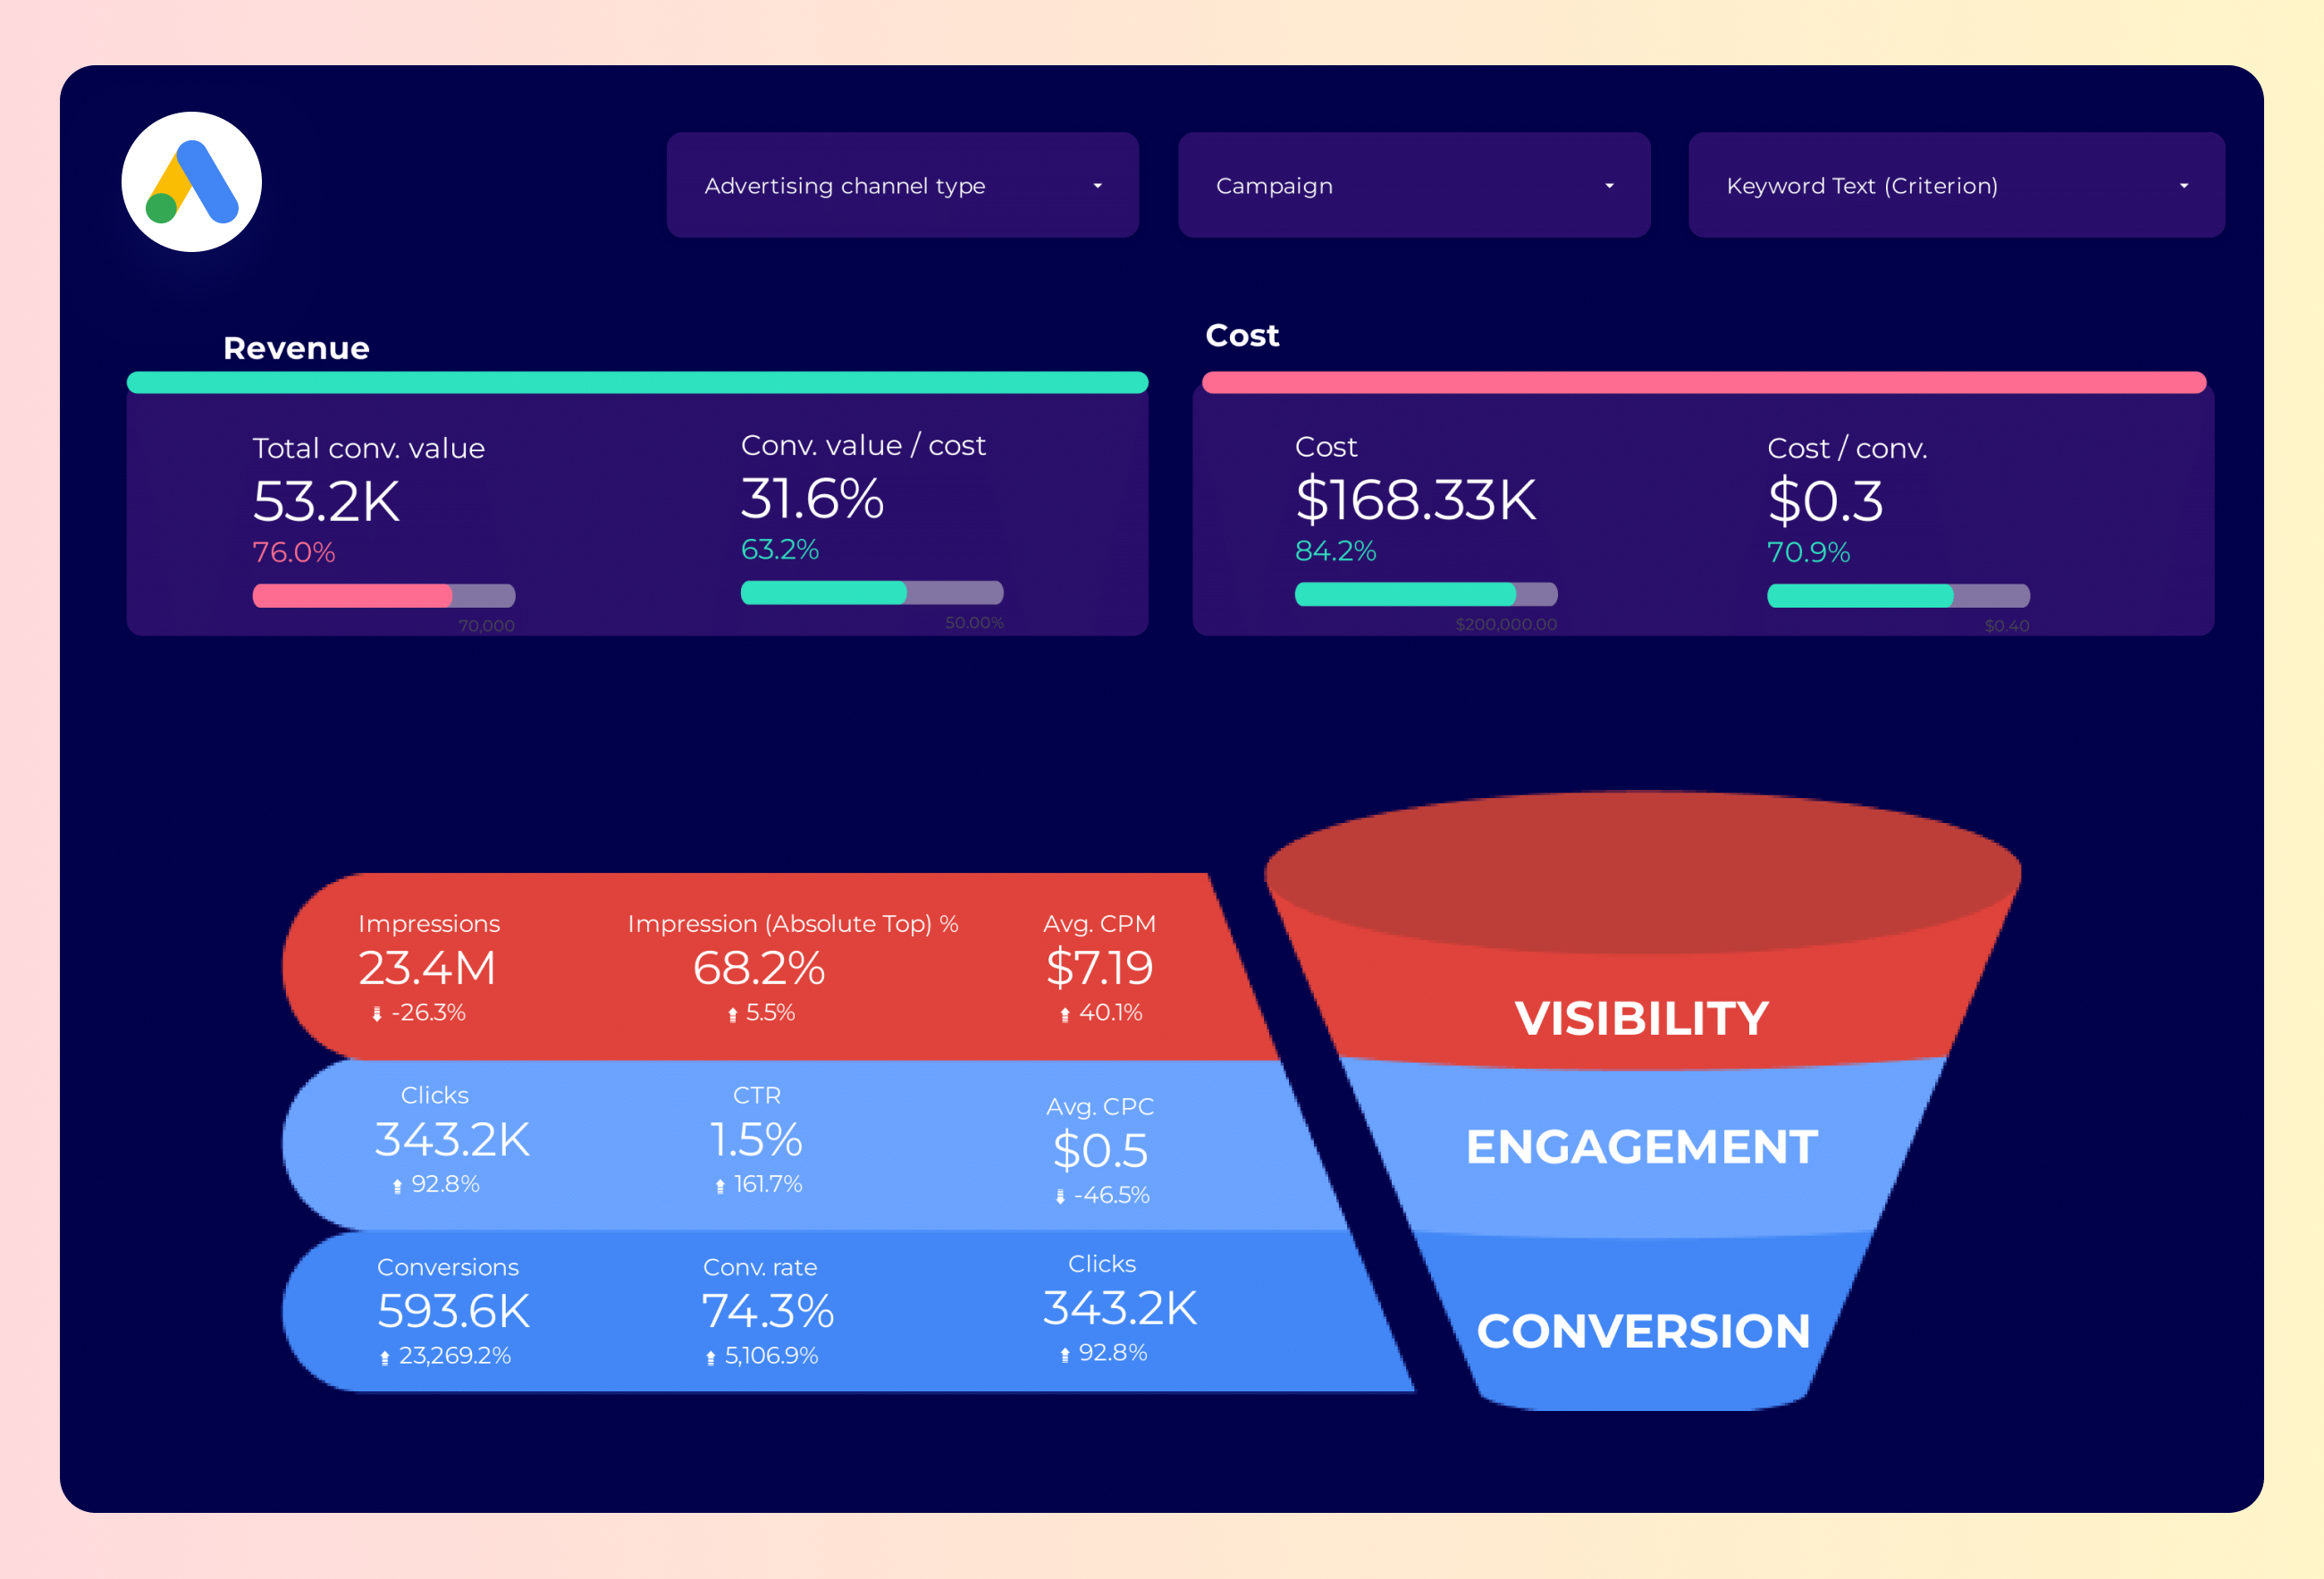
Google Ads Funnel Dashboard template
The Google Ads Funnel Dashboard template is designed for PPC professionals seeking to optimize their advertising strategies. This dashboard provides a structured view of your Google Ads performance, focusing on the entire funnel process.
With this template, you can:
- Track the conversion path from initial ad interaction to final purchase.
- Analyze click-through rates (CTR) and conversion rates at each stage of the funnel.
- Monitor cost-per-click (CPC) and return on ad spend (ROAS) metrics.
Utilize this dashboard to gain insights into your PPC campaigns, allowing for data-driven decisions to improve your Google Ads performance.
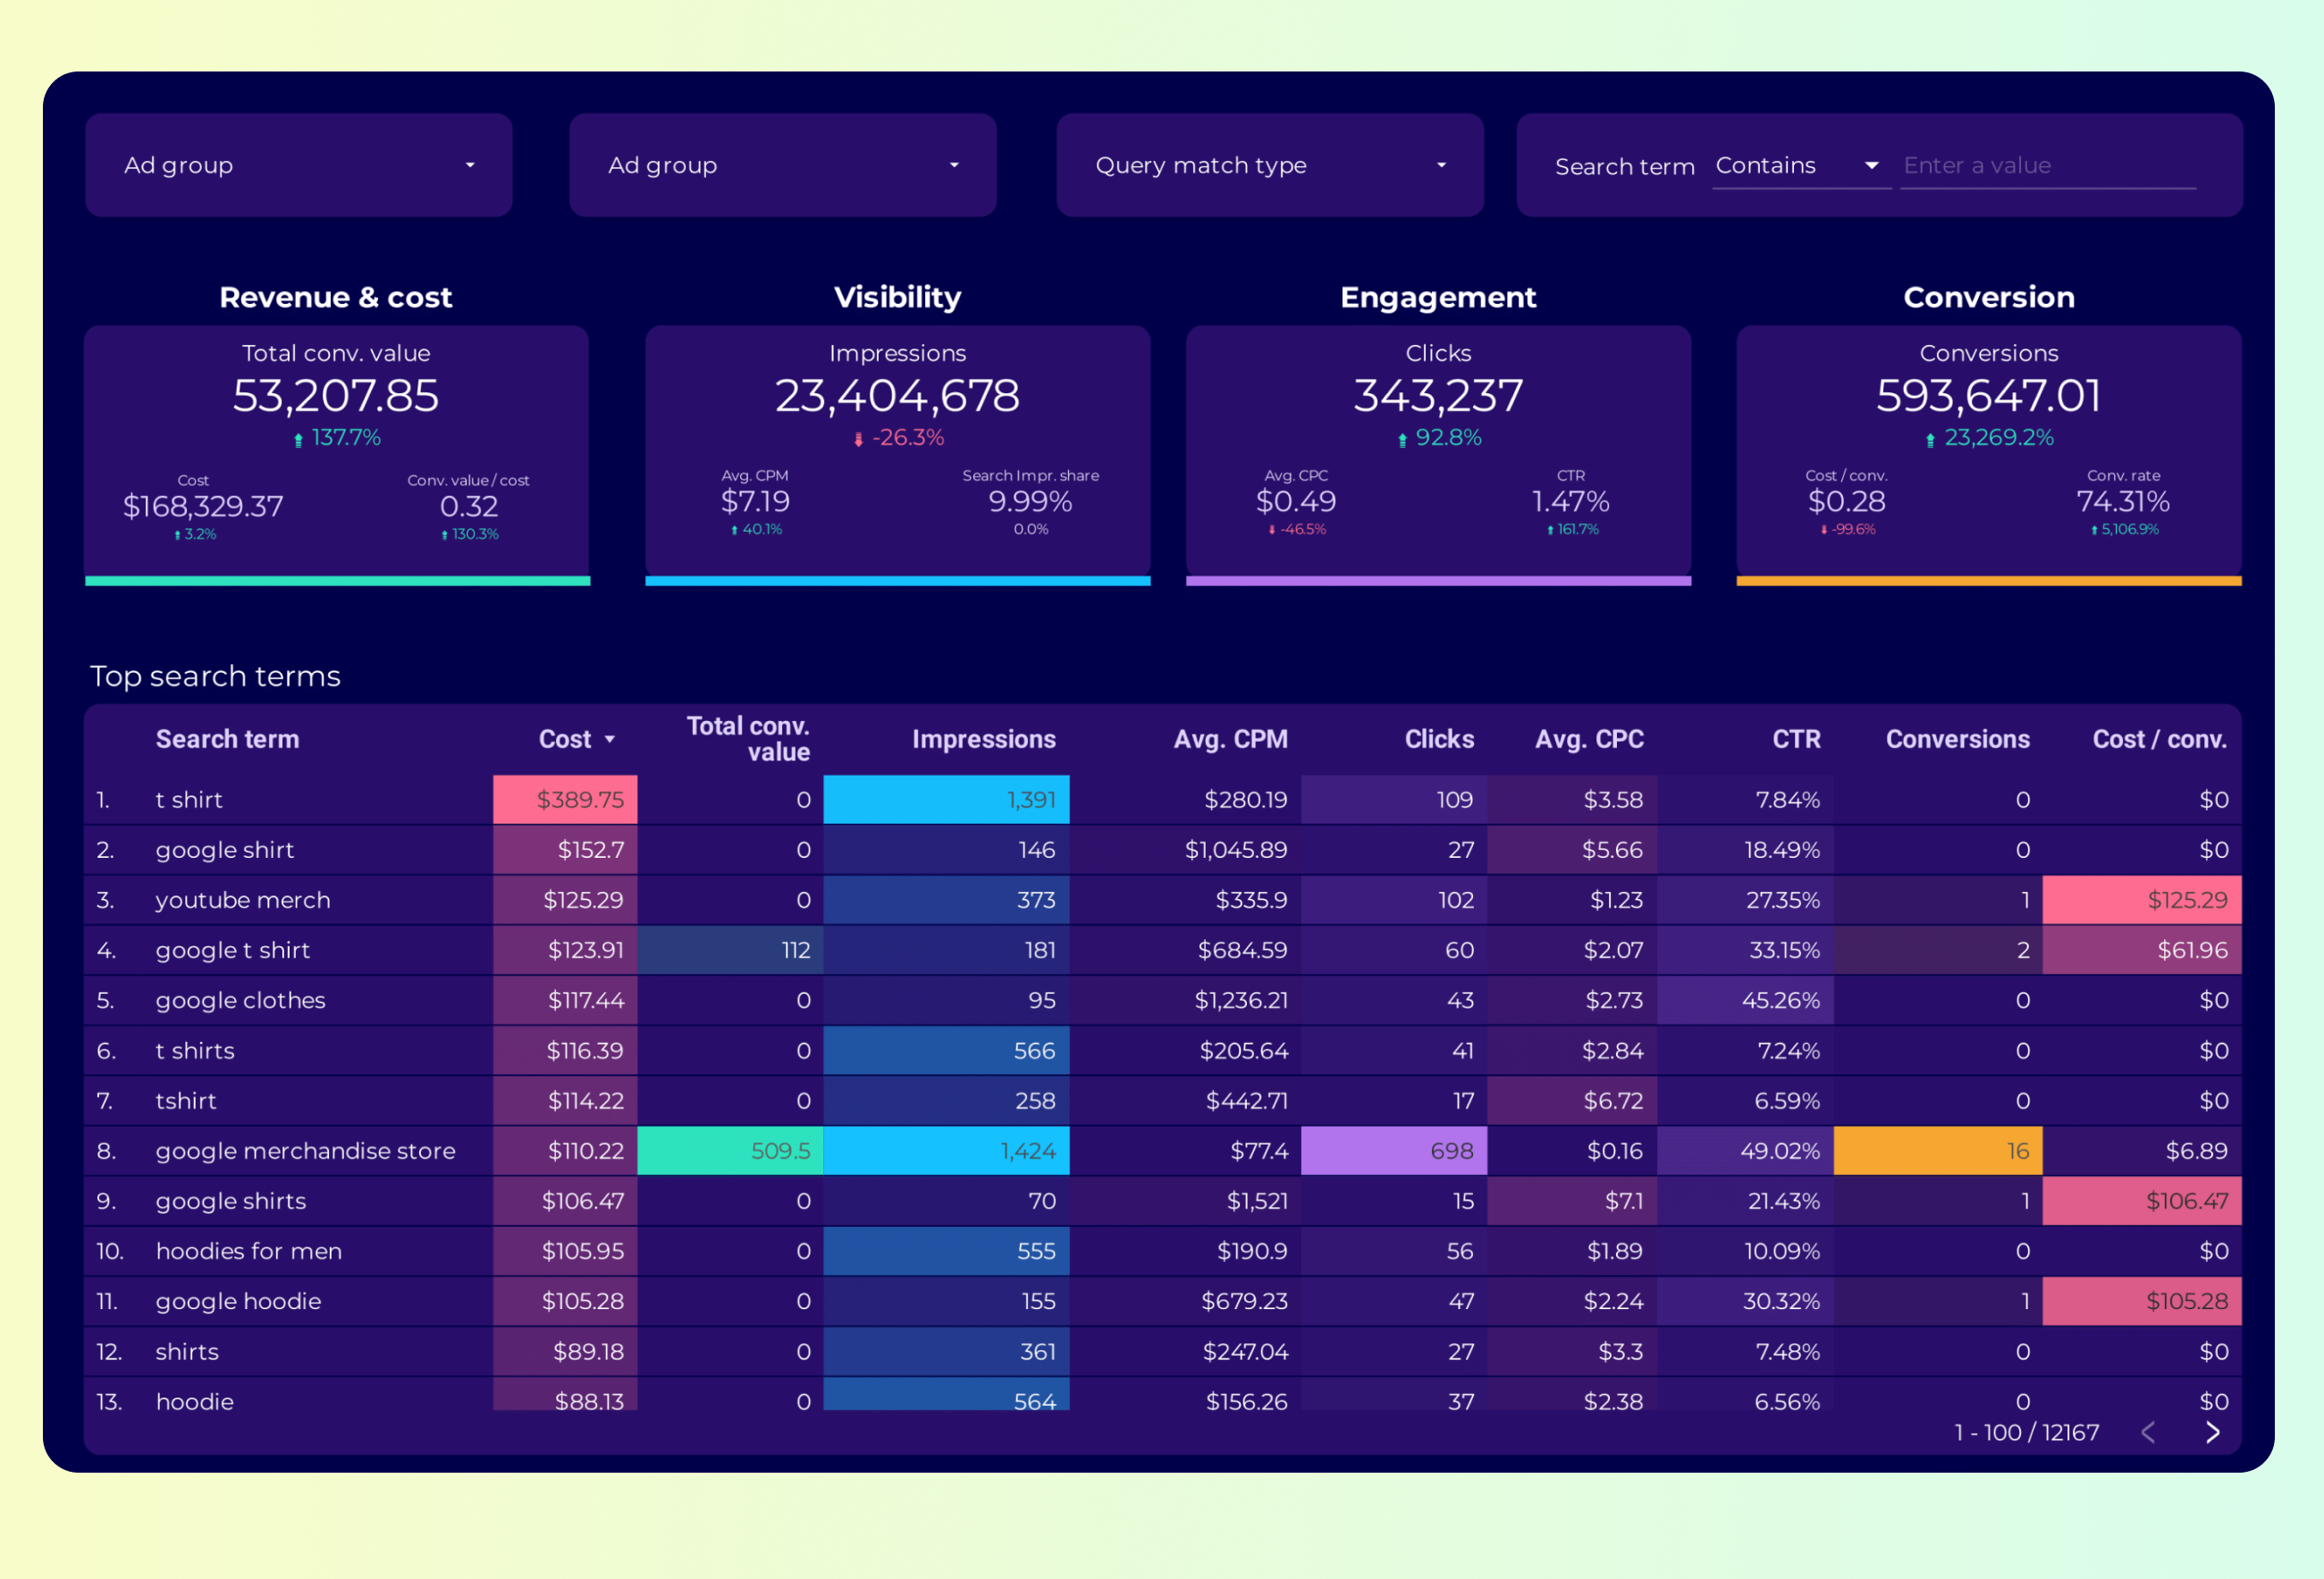
SEM Dashboard template
The SEM Dashboard Template is designed for professionals managing PPC and Paid Media campaigns, specifically focusing on Google Ads. This template provides a structured approach to monitor and analyze campaign performance.
Key features include:
- Performance Metrics: Track essential metrics such as Click-Through Rate (CTR), Cost Per Click (CPC), and Conversion Rate.
- Budget Tracking: Monitor daily and monthly spend to ensure alignment with financial goals.
- Ad Group Analysis: Evaluate the performance of different ad groups to identify top performers.
- Keyword Insights: Analyze keyword performance to optimize bidding strategies.
This template serves as a foundational tool for managing and optimizing Google Ads campaigns, providing actionable insights for data-driven decision-making.
Google Ads Keyword analysis Dashboard template
The Google Ads Keyword Analysis Dashboard template is designed for PPC professionals seeking to optimize their campaigns. This tool provides a structured approach to analyzing keyword performance within Google Ads.
Features include:
- Keyword Performance Metrics: Track metrics such as impressions, clicks, CTR, and conversion rates.
- Cost Analysis: Monitor cost per click (CPC) and cost per acquisition (CPA) to manage budget effectively.
- Search Term Insights: Identify high-performing search terms and negative keywords to refine targeting.
- Quality Score Tracking: Evaluate quality scores to improve ad relevance and landing page experience.
This dashboard template integrates seamlessly with Google Sheets, allowing for real-time data updates and collaboration. It is an essential tool for PPC managers aiming to drive campaign success through data-driven decisions.
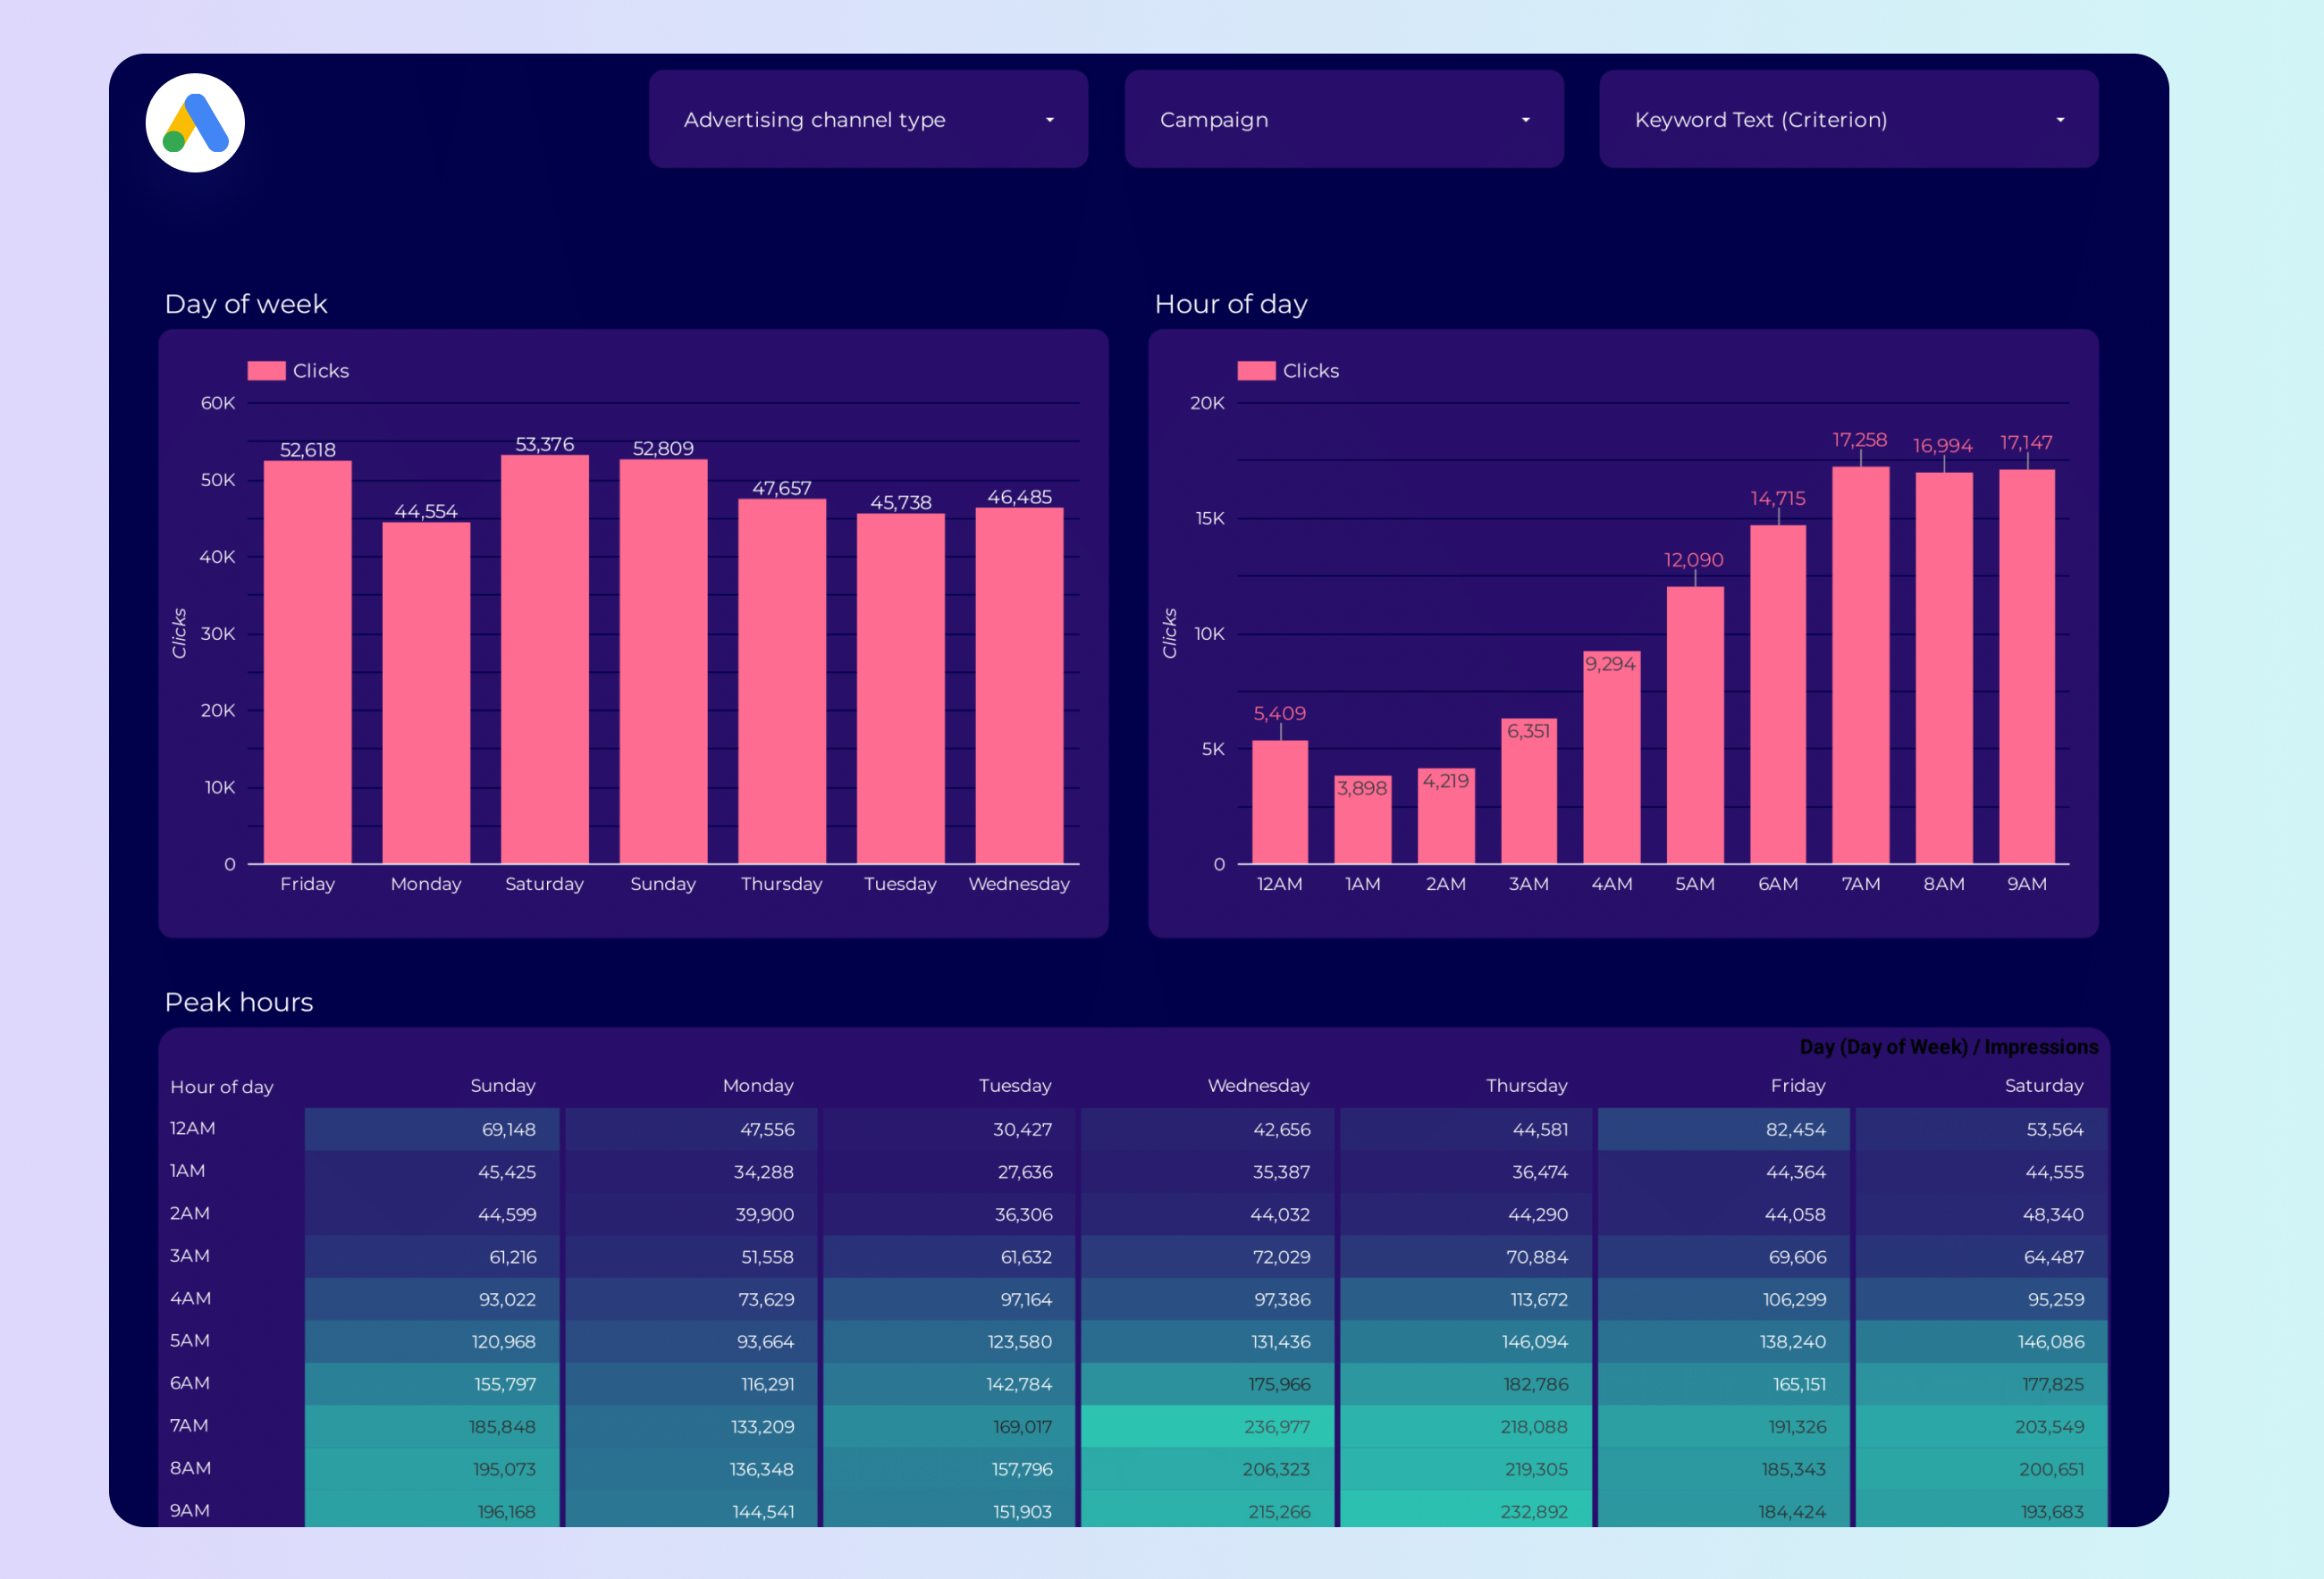
Google Ads Peak hours Dashboard template
The Google Ads Peak Hours Dashboard template is designed for PPC professionals seeking to optimize their advertising strategies. This dashboard provides a detailed analysis of your Google Ads performance during peak hours, allowing for data-driven decision-making.
With this template, you can:
- Identify peak performance times by analyzing hourly data trends.
- Monitor ad spend and adjust budgets based on high-traffic periods.
- Track conversion rates to understand customer behavior during different times of the day.
Utilize this dashboard to align your PPC campaigns with the most effective time slots, ensuring maximum ROI from your Google Ads investments.
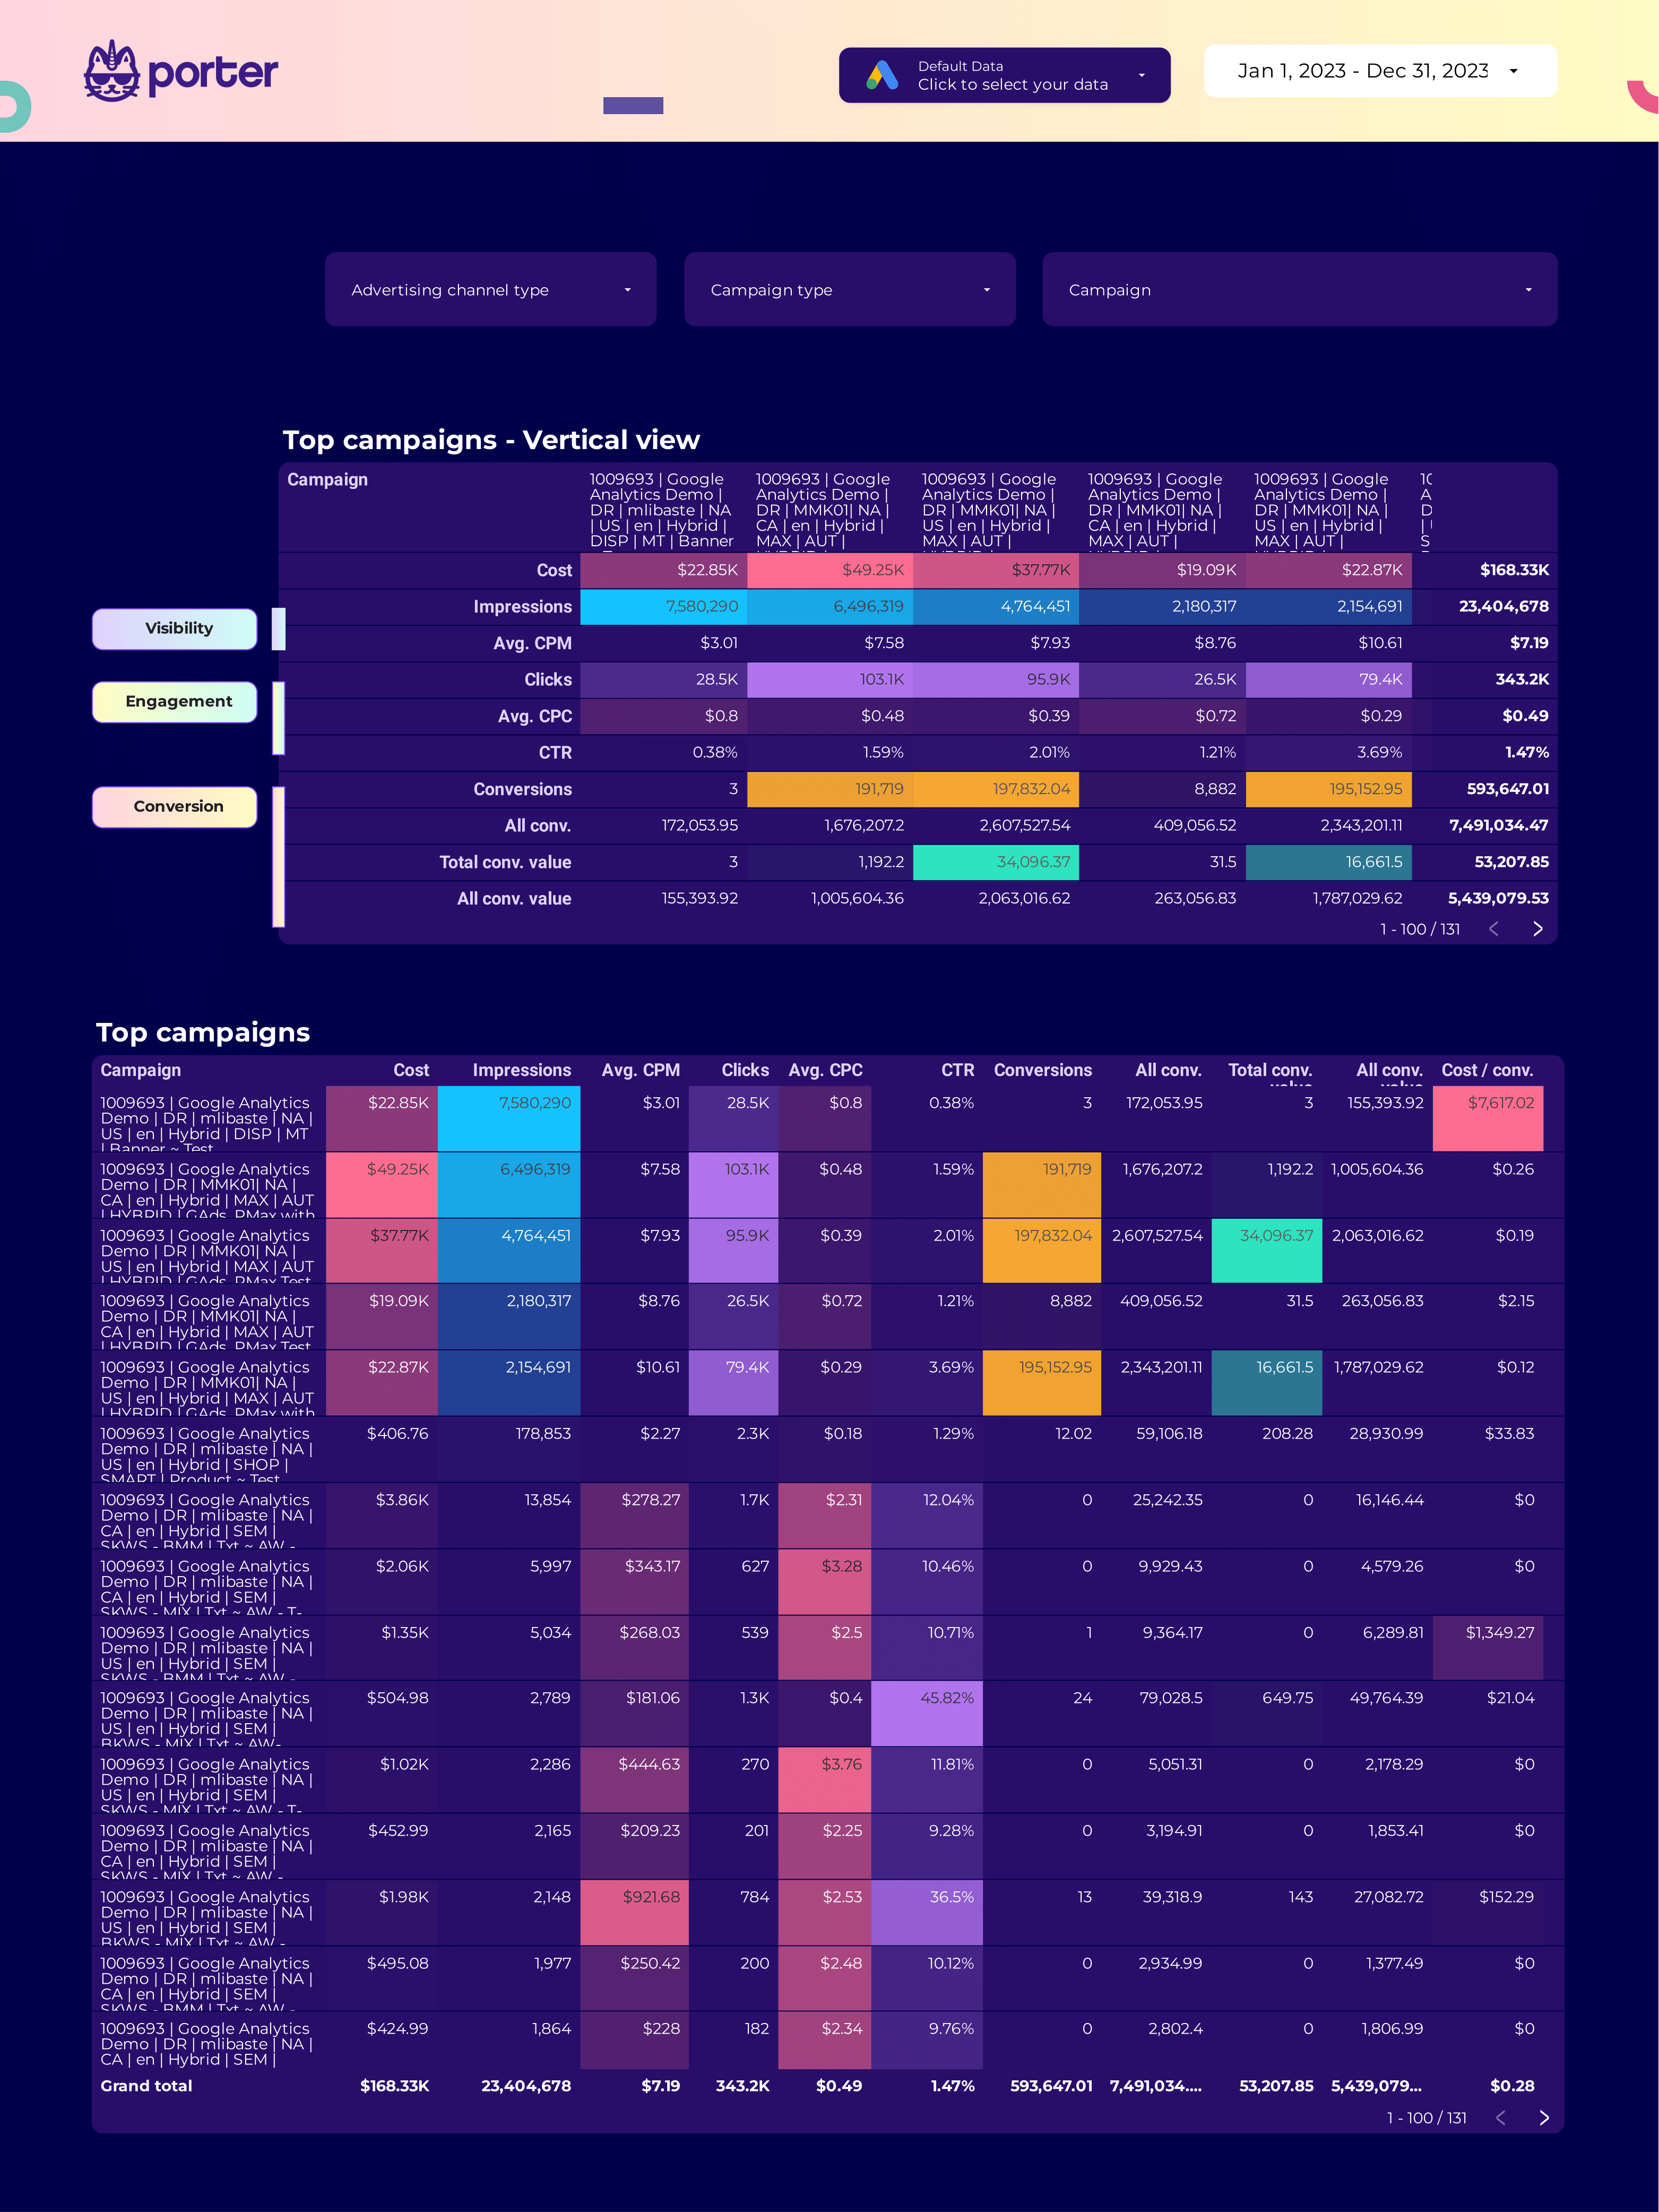
Google Ads PMax Dashboard template
The Google Ads PMax Dashboard template is designed for PPC professionals managing Google Ads campaigns. This template provides a structured view of your Performance Max campaigns, allowing for detailed analysis and reporting.
Features include:
- Campaign Performance Metrics: View metrics such as impressions, clicks, and conversions.
- Budget Tracking: Monitor daily and monthly spend to ensure alignment with campaign goals.
- Audience Insights: Analyze audience segments and their impact on campaign performance.
- Asset Performance: Evaluate the effectiveness of different creative assets within your campaigns.
This dashboard is essential for PPC managers looking to optimize their Google Ads strategies and achieve better results with Performance Max campaigns.
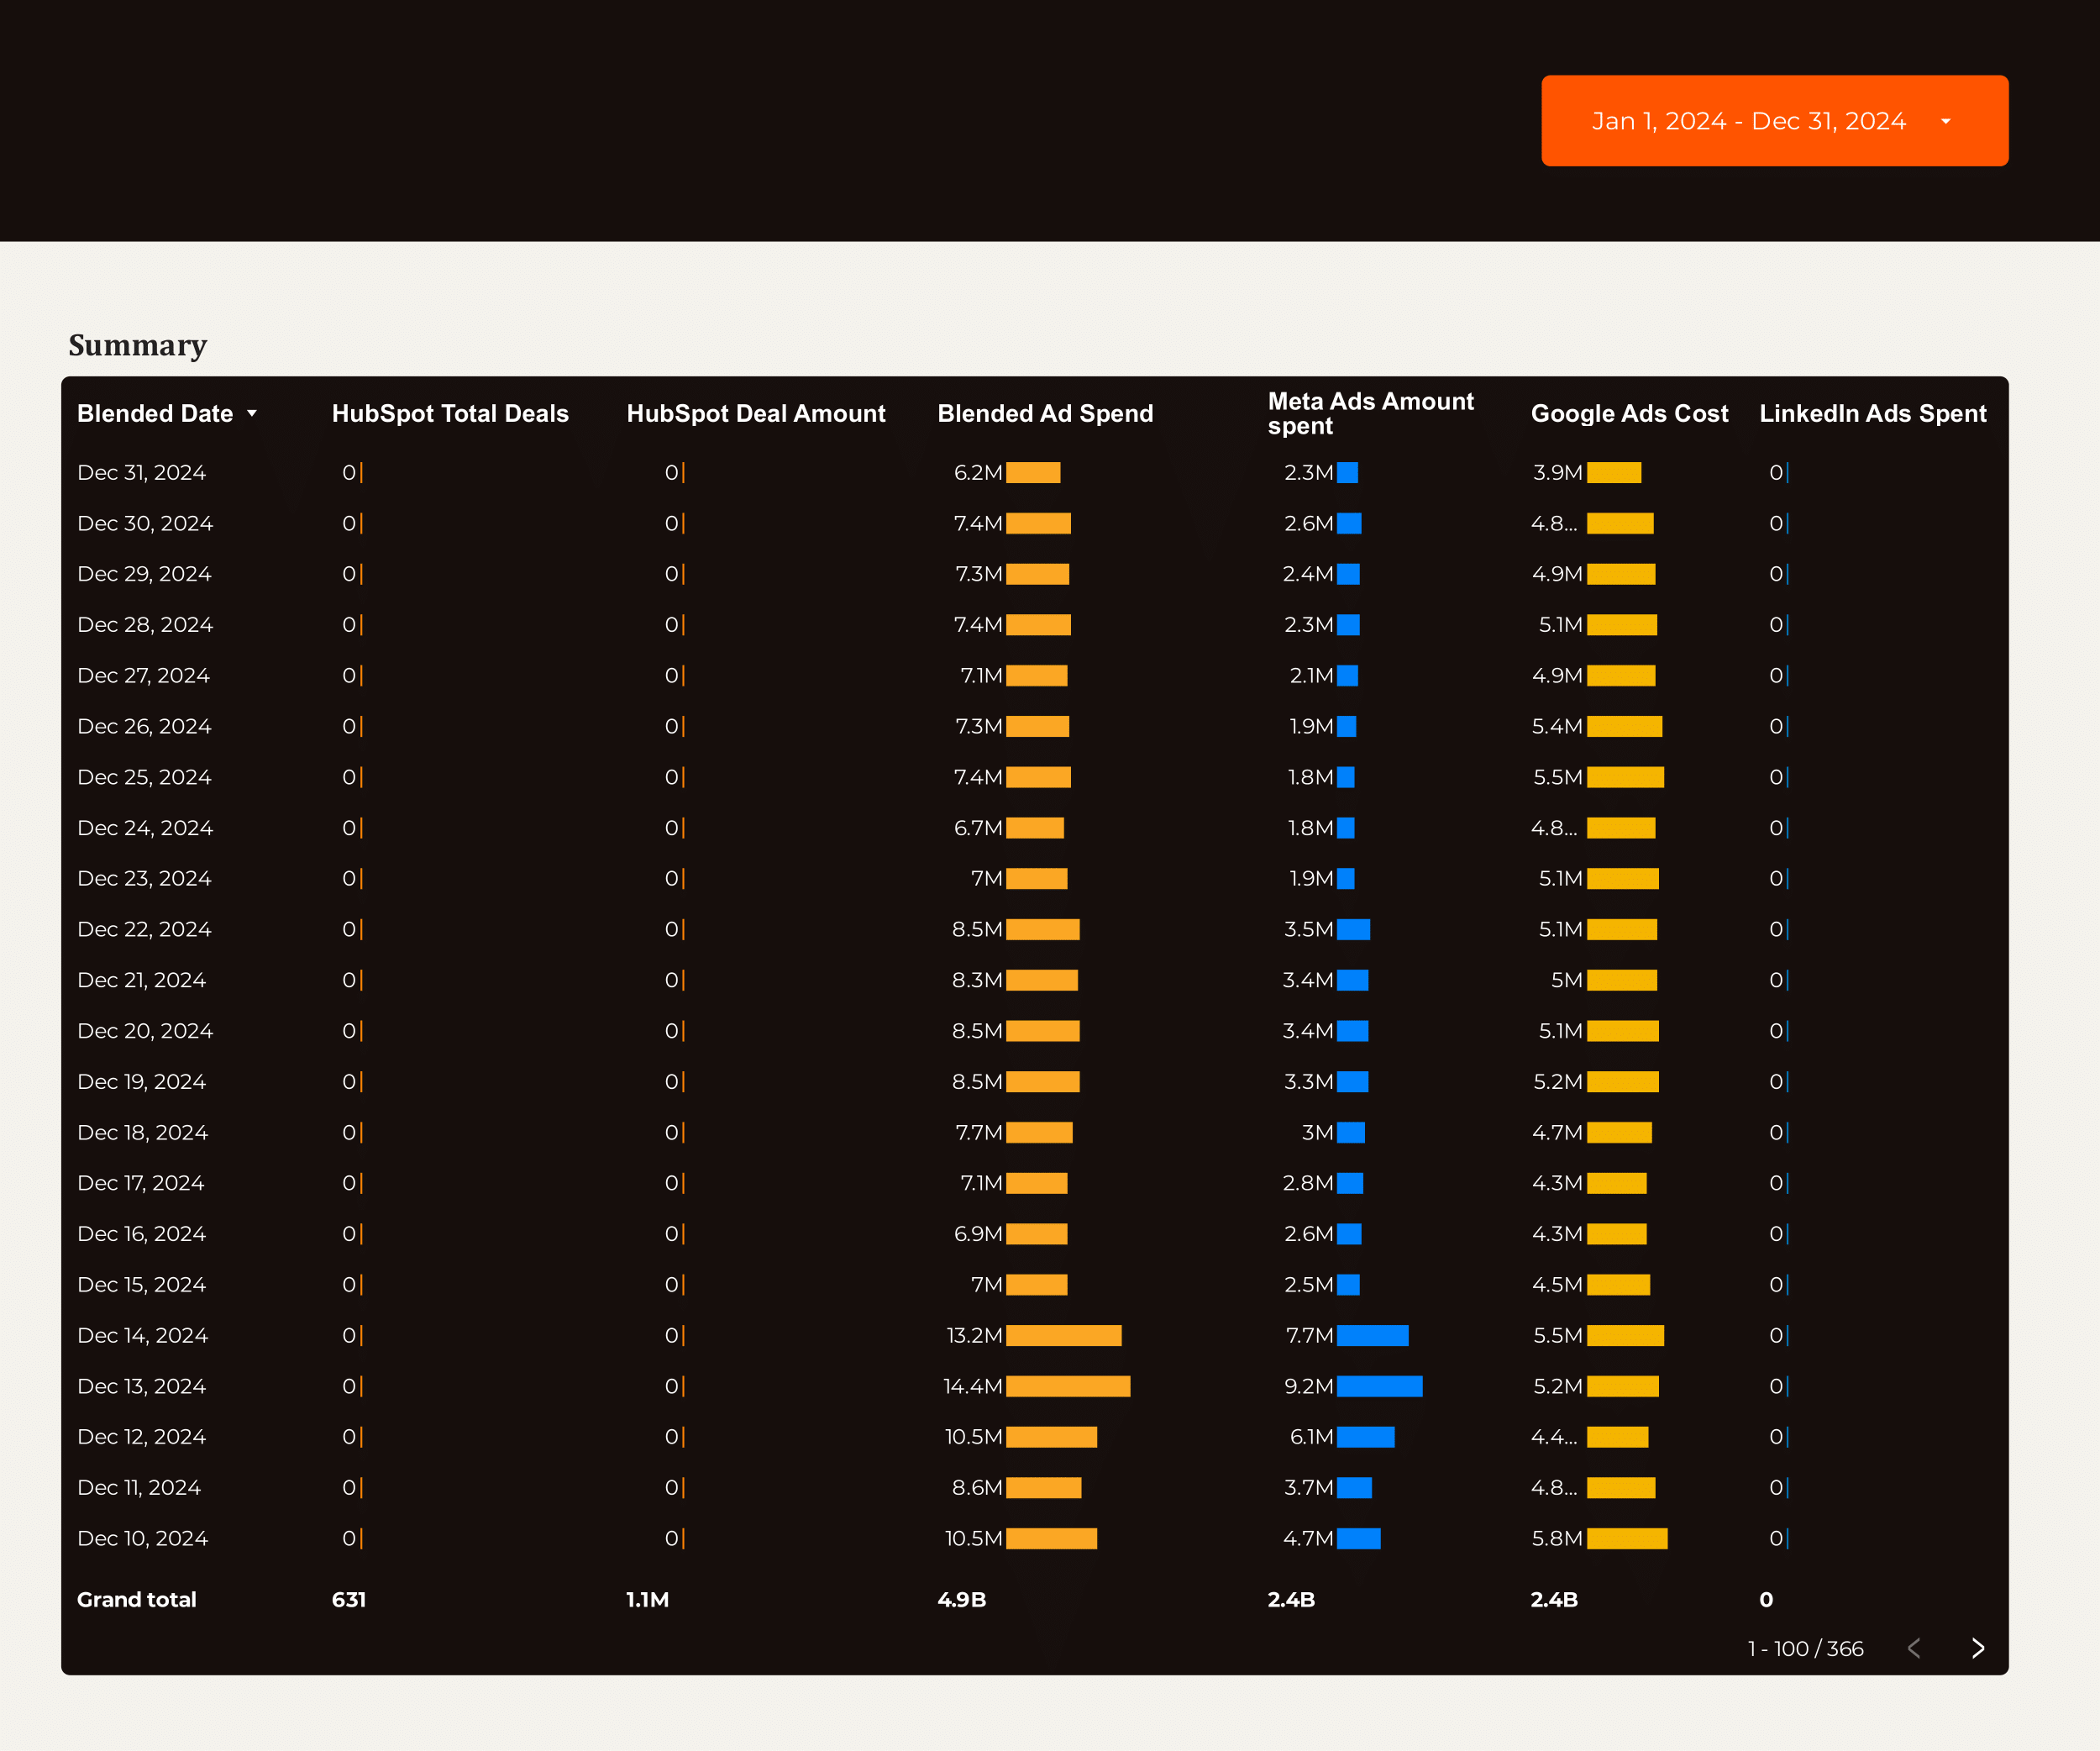
Lead generation Dashboard template
The Lead Generation Dashboard Template is designed for B2B marketers and sales teams to streamline their lead management process. This template integrates with popular platforms such as Google Ads, LinkedIn Ads, Facebook Ads, and HubSpot, providing a centralized view of your lead generation efforts.
Utilize data from Google Analytics 4 to track and analyze the performance of your campaigns. The dashboard offers insights into:
- Lead Sources: Identify which channels are driving the most leads.
- Conversion Rates: Monitor the effectiveness of your PPC campaigns.
- CRM Integration: Seamlessly connect with HubSpot to manage and nurture leads.
This template is essential for businesses looking to optimize their B2B lead generation strategy by leveraging data from multiple advertising and analytics platforms.
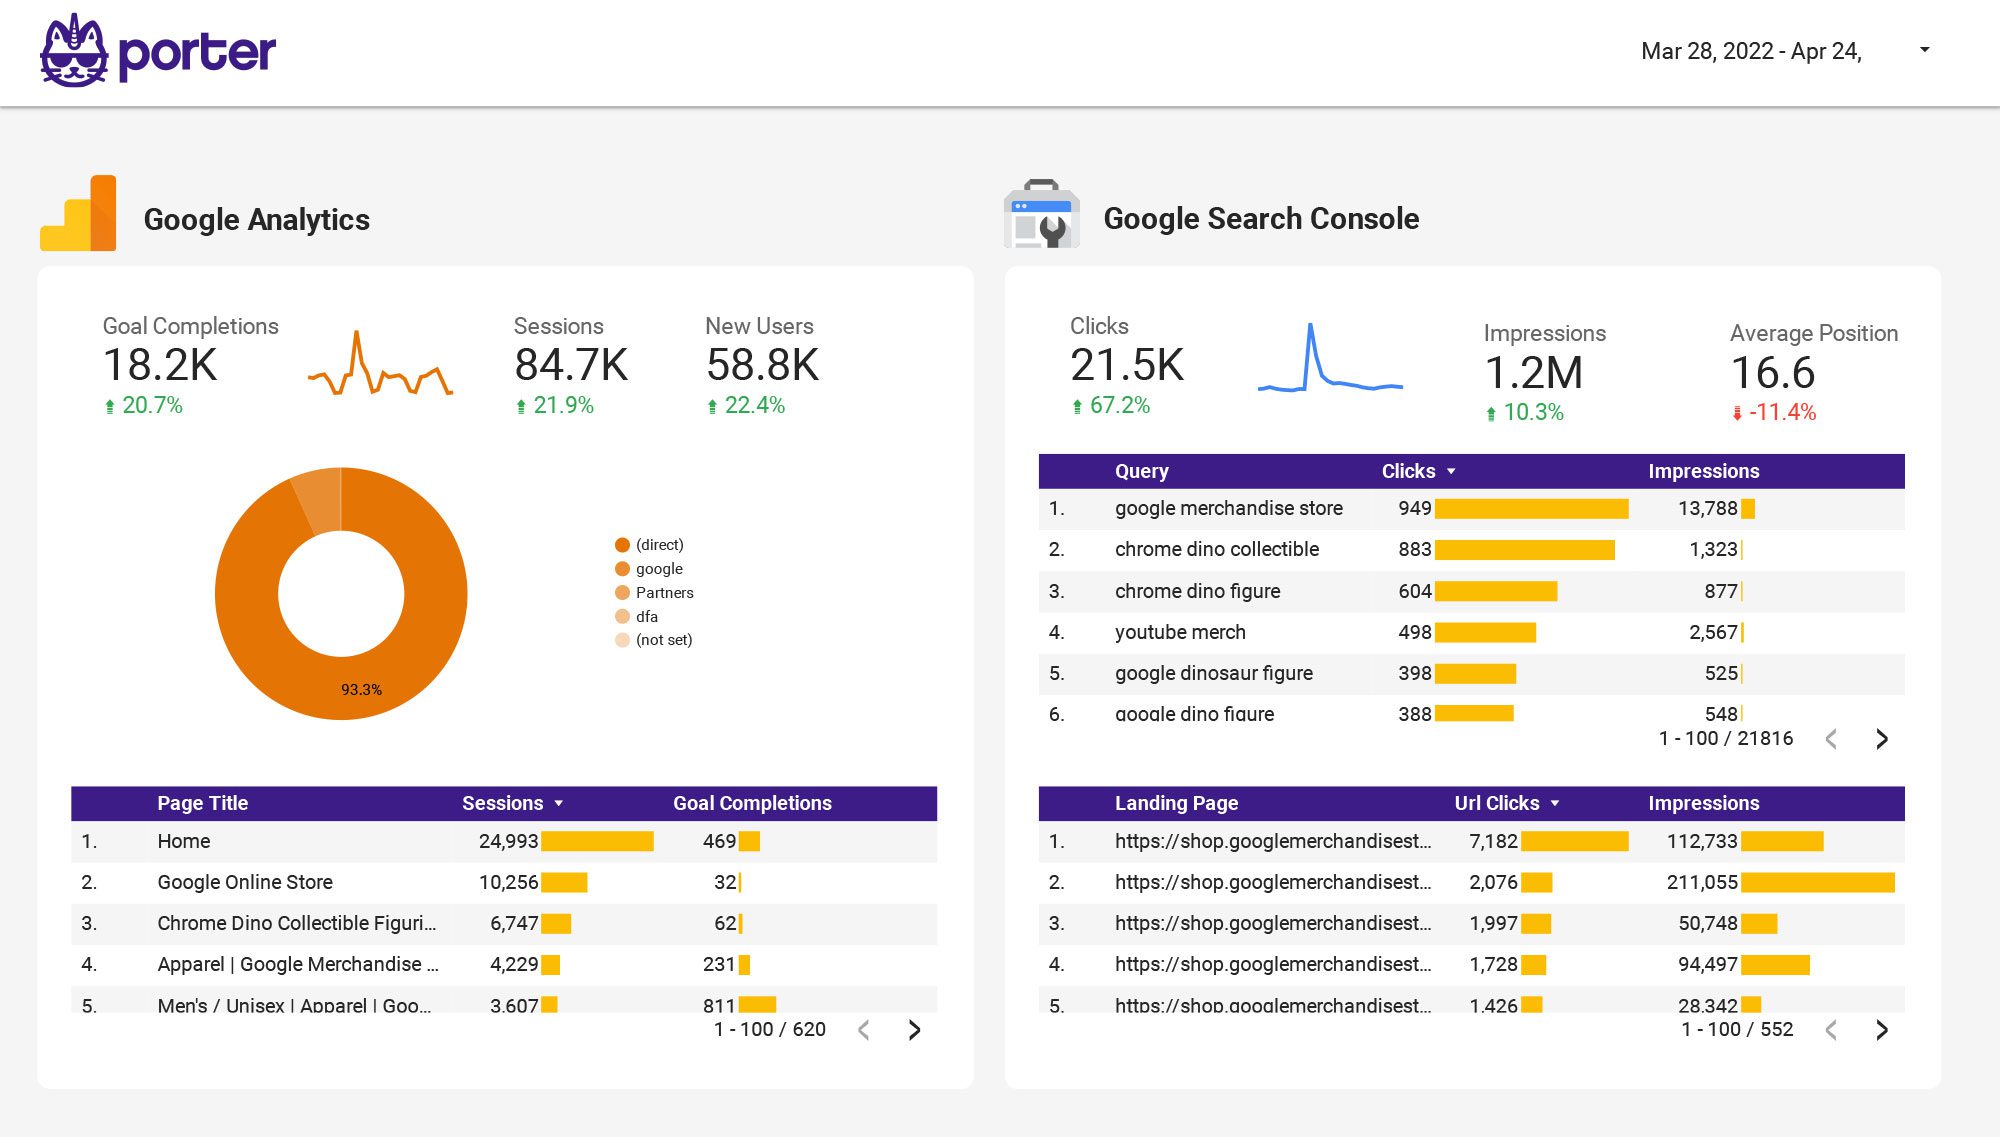
Multi-channel Marketing performance Dashboard template
The Multi-channel Marketing Performance Dashboard template provides a centralized view of your marketing efforts across various platforms. This dashboard integrates data from Google Analytics 4, Instagram Insights, Google Ads, YouTube, Facebook Insights, Facebook Ads, LinkedIn Ads, TikTok Ads, and Twitter Ads.
With this template, you can:
- Track SEO performance and analyze website traffic using Google Analytics 4.
- Monitor social media engagement and audience growth through Instagram and Facebook Insights.
- Evaluate advertising campaigns across Google Ads, Facebook Ads, LinkedIn Ads, TikTok Ads, and Twitter Ads.
- Analyze video content performance on YouTube.
This dashboard template is designed to provide actionable insights by consolidating data from multiple channels, allowing for a streamlined analysis of marketing strategies and outcomes.
Paid media Dashboard template
This Paid Media Dashboard Template is designed for marketers managing campaigns across multiple platforms. It integrates data from PPC channels such as Google Ads, Facebook Ads, LinkedIn Ads, TikTok Ads, and Twitter Ads.
Utilize this dashboard to track and analyze performance metrics from Google Analytics 4 and Base. The template provides a centralized view of your advertising efforts, allowing for data-driven decision-making.
- Google Ads: Monitor impressions, clicks, and conversion rates.
- Facebook Ads: Analyze audience engagement and ad spend.
- LinkedIn Ads: Evaluate lead generation and campaign reach.
- TikTok Ads: Track video views and user interactions.
- Twitter Ads: Assess tweet engagement and follower growth.
This template is ideal for marketers seeking to consolidate their advertising data into a single, actionable view.
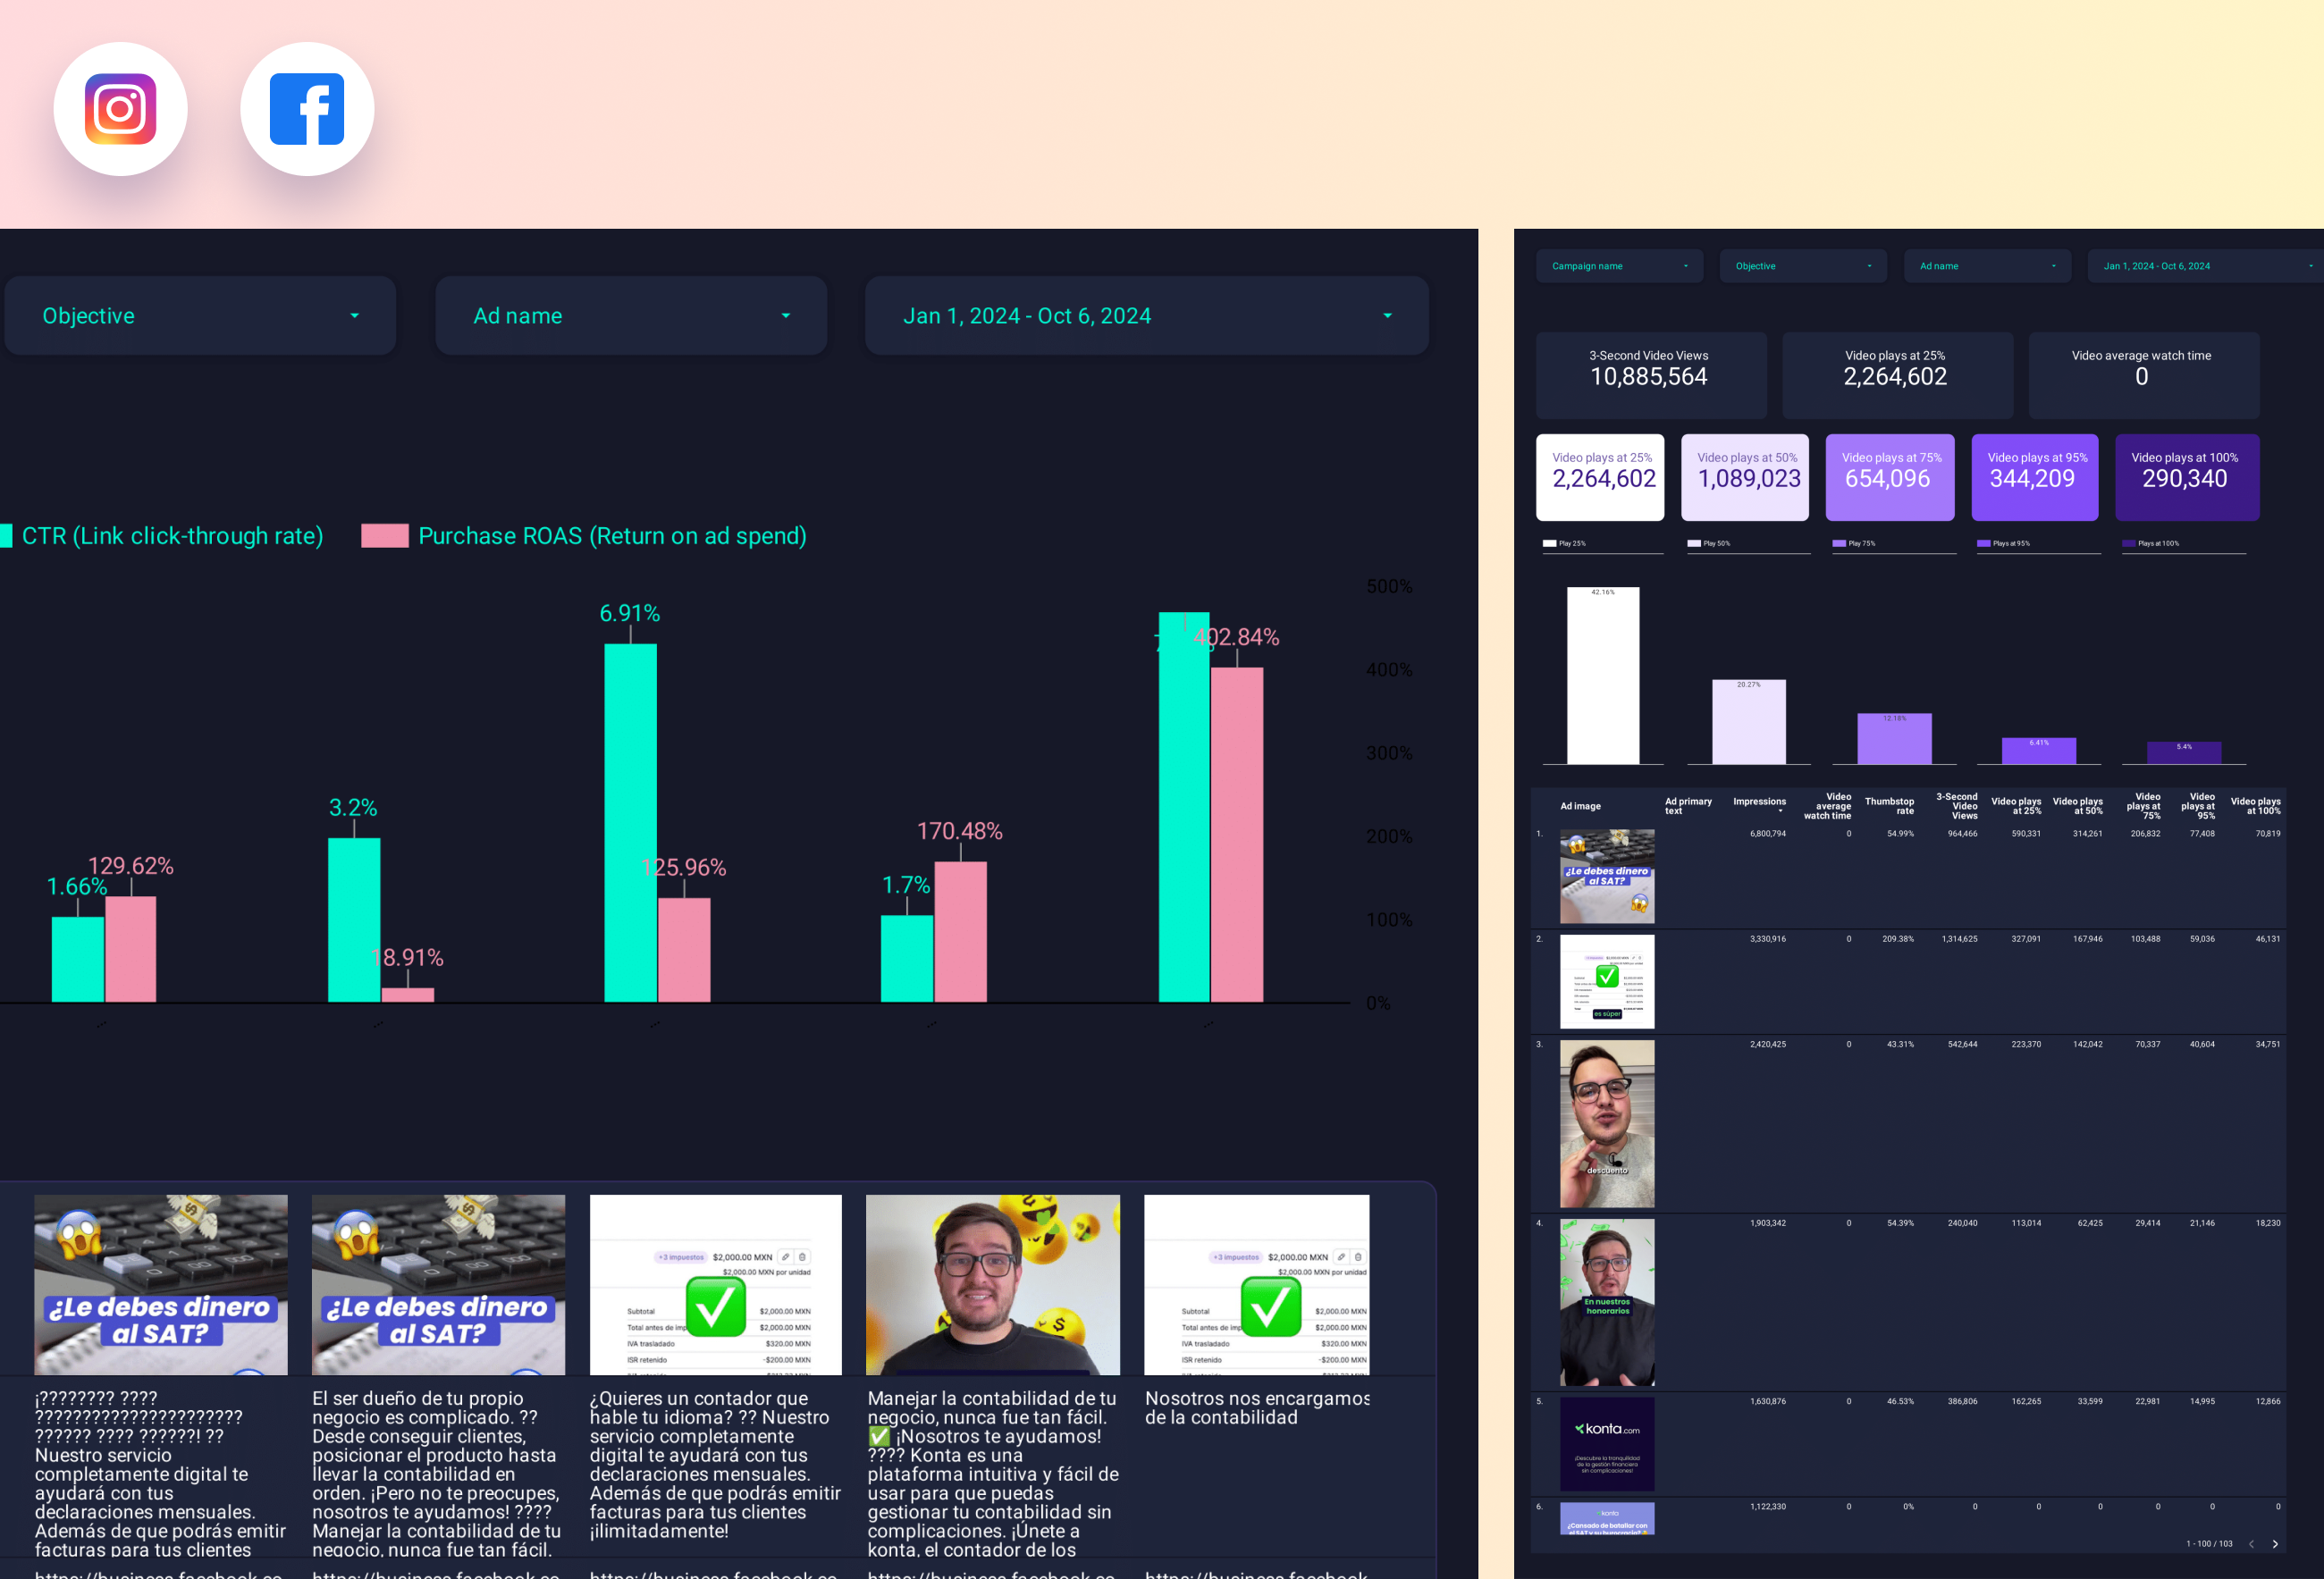
Paid media Creative performance Dashboard template
The Paid Media Creative Performance Dashboard template is designed for marketers managing campaigns across multiple platforms such as PPC, TikTok Ads, Google Ads, Facebook Ads, LinkedIn Ads, and Twitter Ads.
This dashboard provides a centralized view of your advertising efforts, allowing you to track and analyze performance metrics in real-time. It supports:
- Impressions and Clicks tracking for visibility and engagement analysis.
- Cost-per-click (CPC) and Cost-per-acquisition (CPA) metrics for budget management.
- Conversion rates to measure the effectiveness of your ad creatives.
- Platform-specific insights for TikTok, Google, Facebook, LinkedIn, and Twitter.
Utilize this dashboard to streamline your reporting process and make data-driven decisions for optimizing your ad campaigns.

PPC Dashboard template
The PPC Dashboard Template is designed for managing and analyzing advertising campaigns across multiple platforms. This template supports:
- Google Ads
- Facebook Ads
- LinkedIn Ads
- TikTok Ads
- Twitter Ads
Utilize this dashboard to track performance metrics such as click-through rates (CTR), cost per click (CPC), and conversion rates. The template provides a centralized view of your advertising data, allowing for streamlined reporting and analysis.
Features include:
- Real-time data integration from all supported platforms
- Customizable widgets for specific campaign insights
- Automated reporting for daily, weekly, and monthly performance
This template is ideal for marketers looking to optimize their PPC strategies across various social media and search engine platforms.