

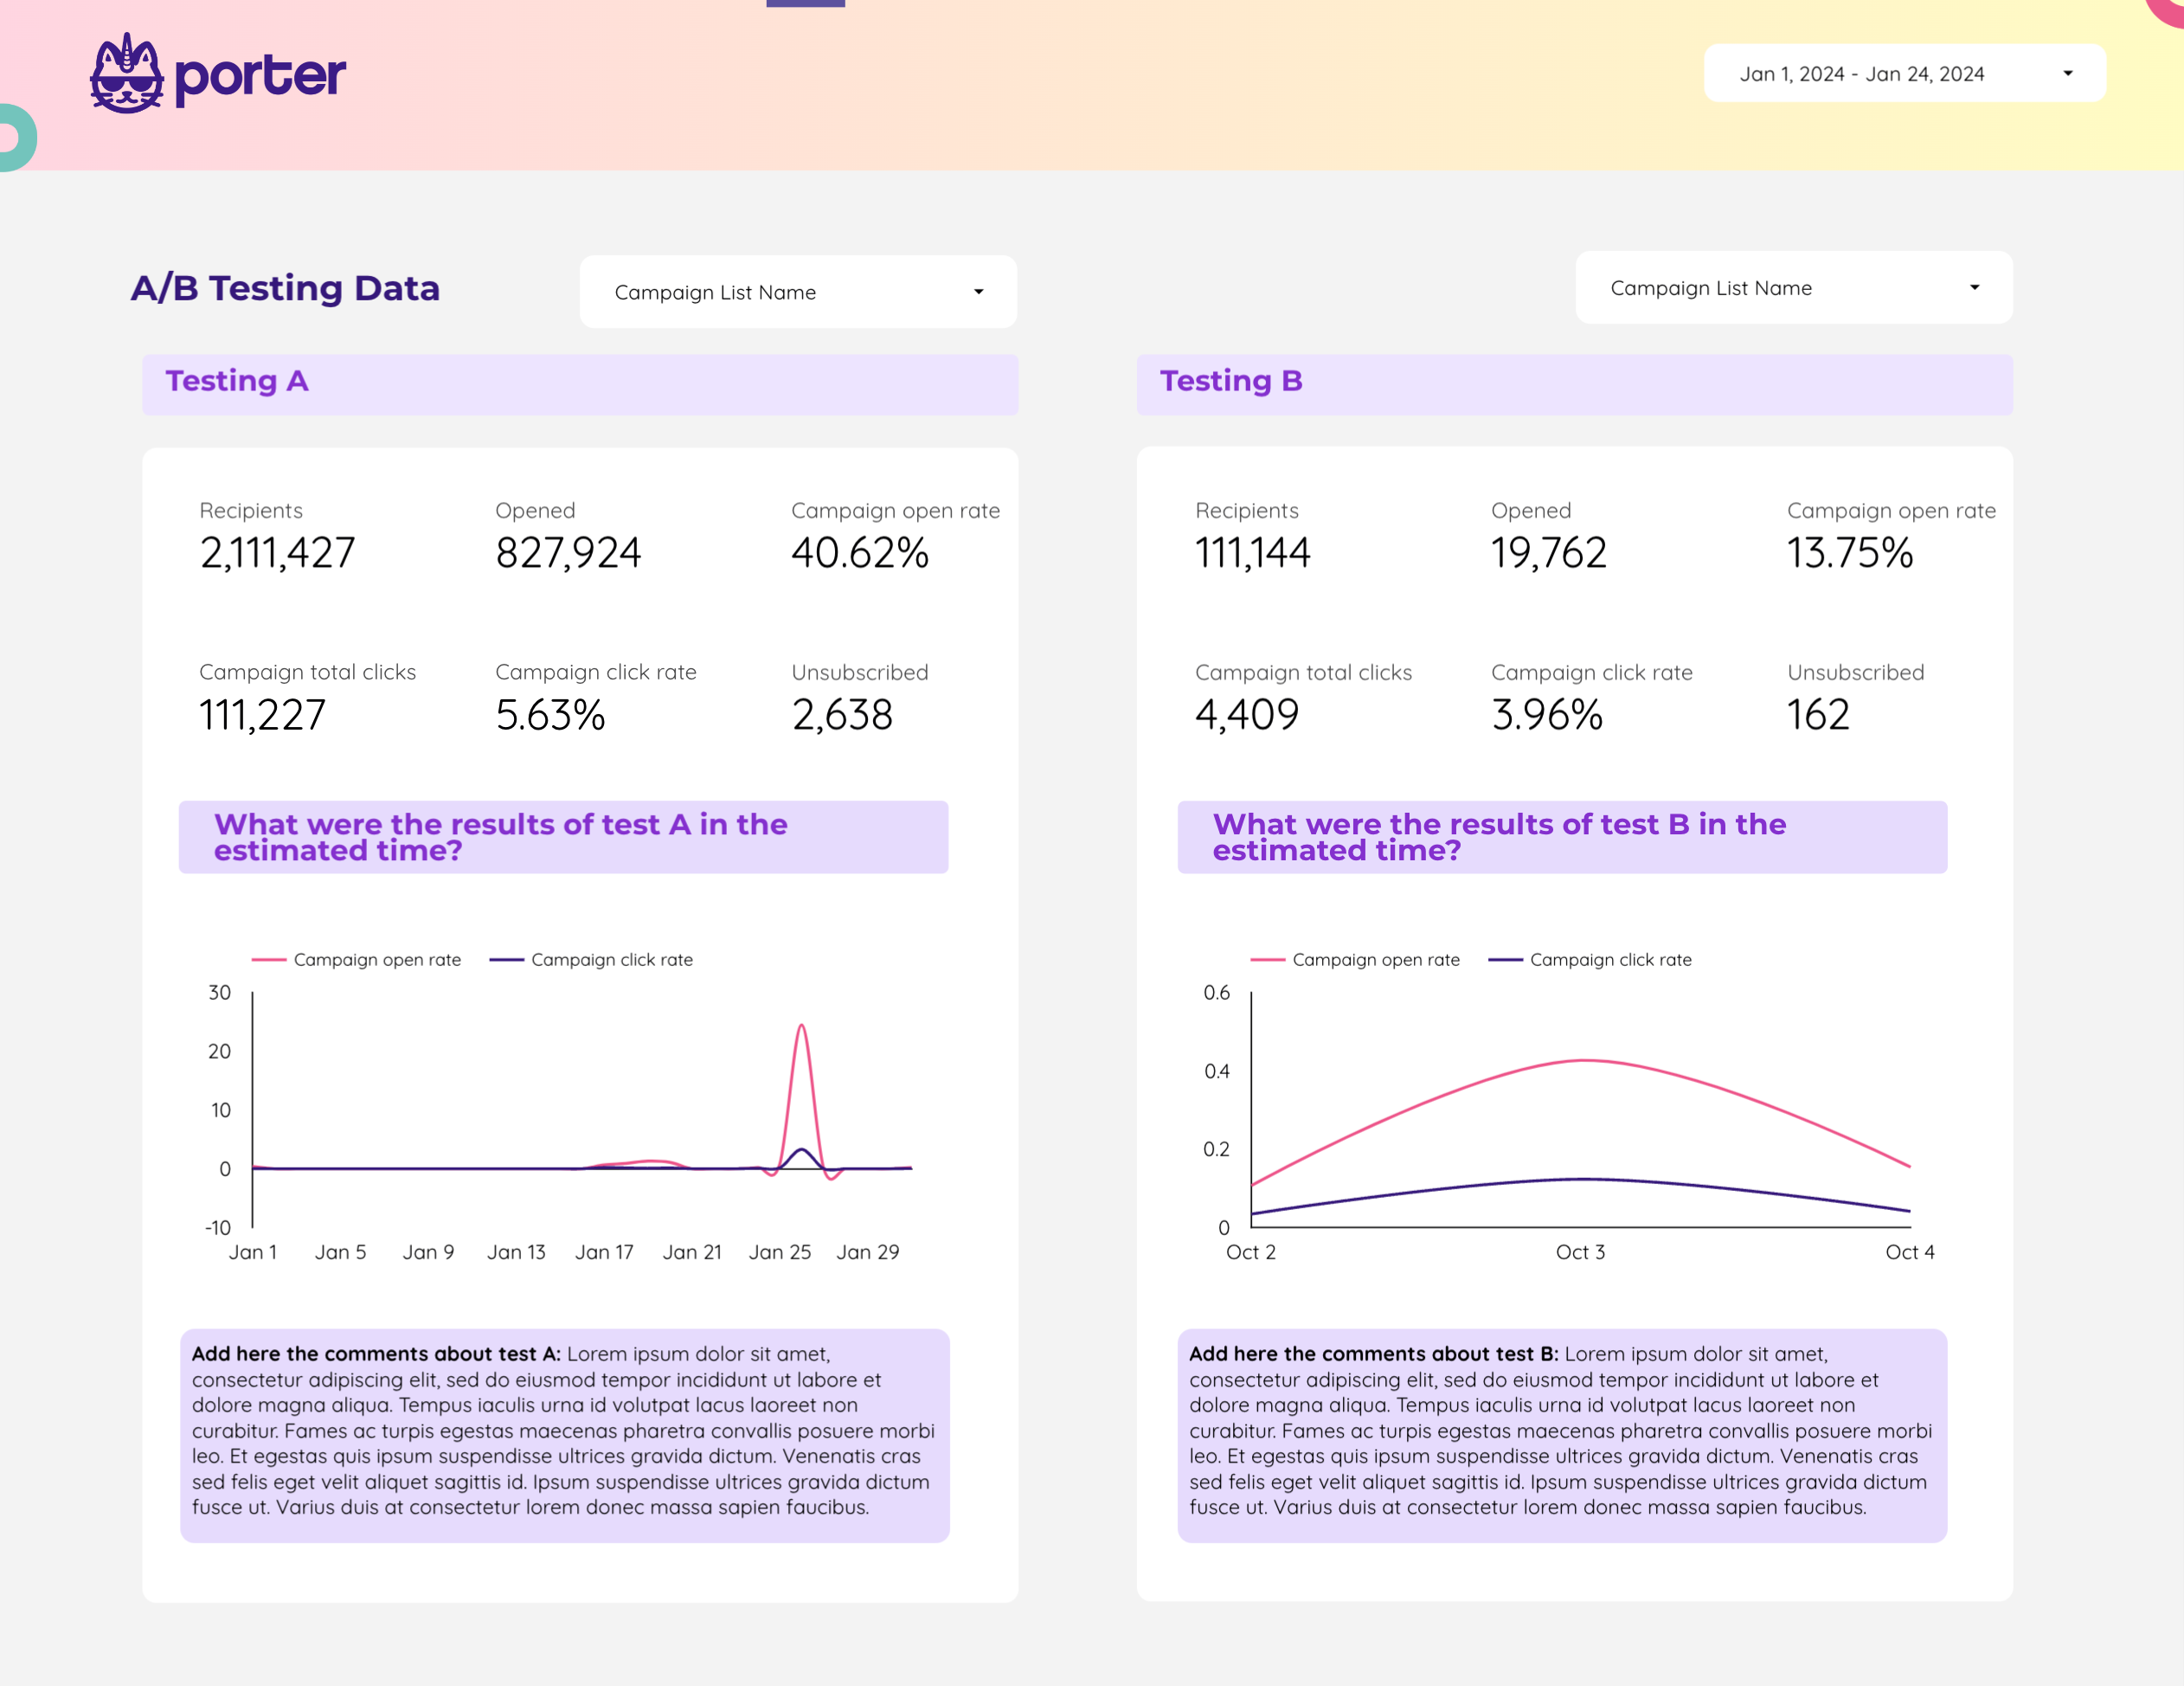
A/B testing Dashboard template
The A/B Testing Dashboard template is designed for Email Marketing professionals using Mailchimp. This tool provides a structured approach to compare different email campaign strategies.
Features include:
- Performance Metrics: Track open rates, click-through rates, and conversion rates for each variant.
- Segmentation Analysis: Evaluate how different audience segments respond to each email version.
- Visual Data Representation: Utilize graphs and charts to visualize campaign performance.
- Real-Time Updates: Monitor ongoing tests with live data feeds.
This dashboard is essential for marketers aiming to optimize their email campaigns by systematically testing and analyzing different approaches.
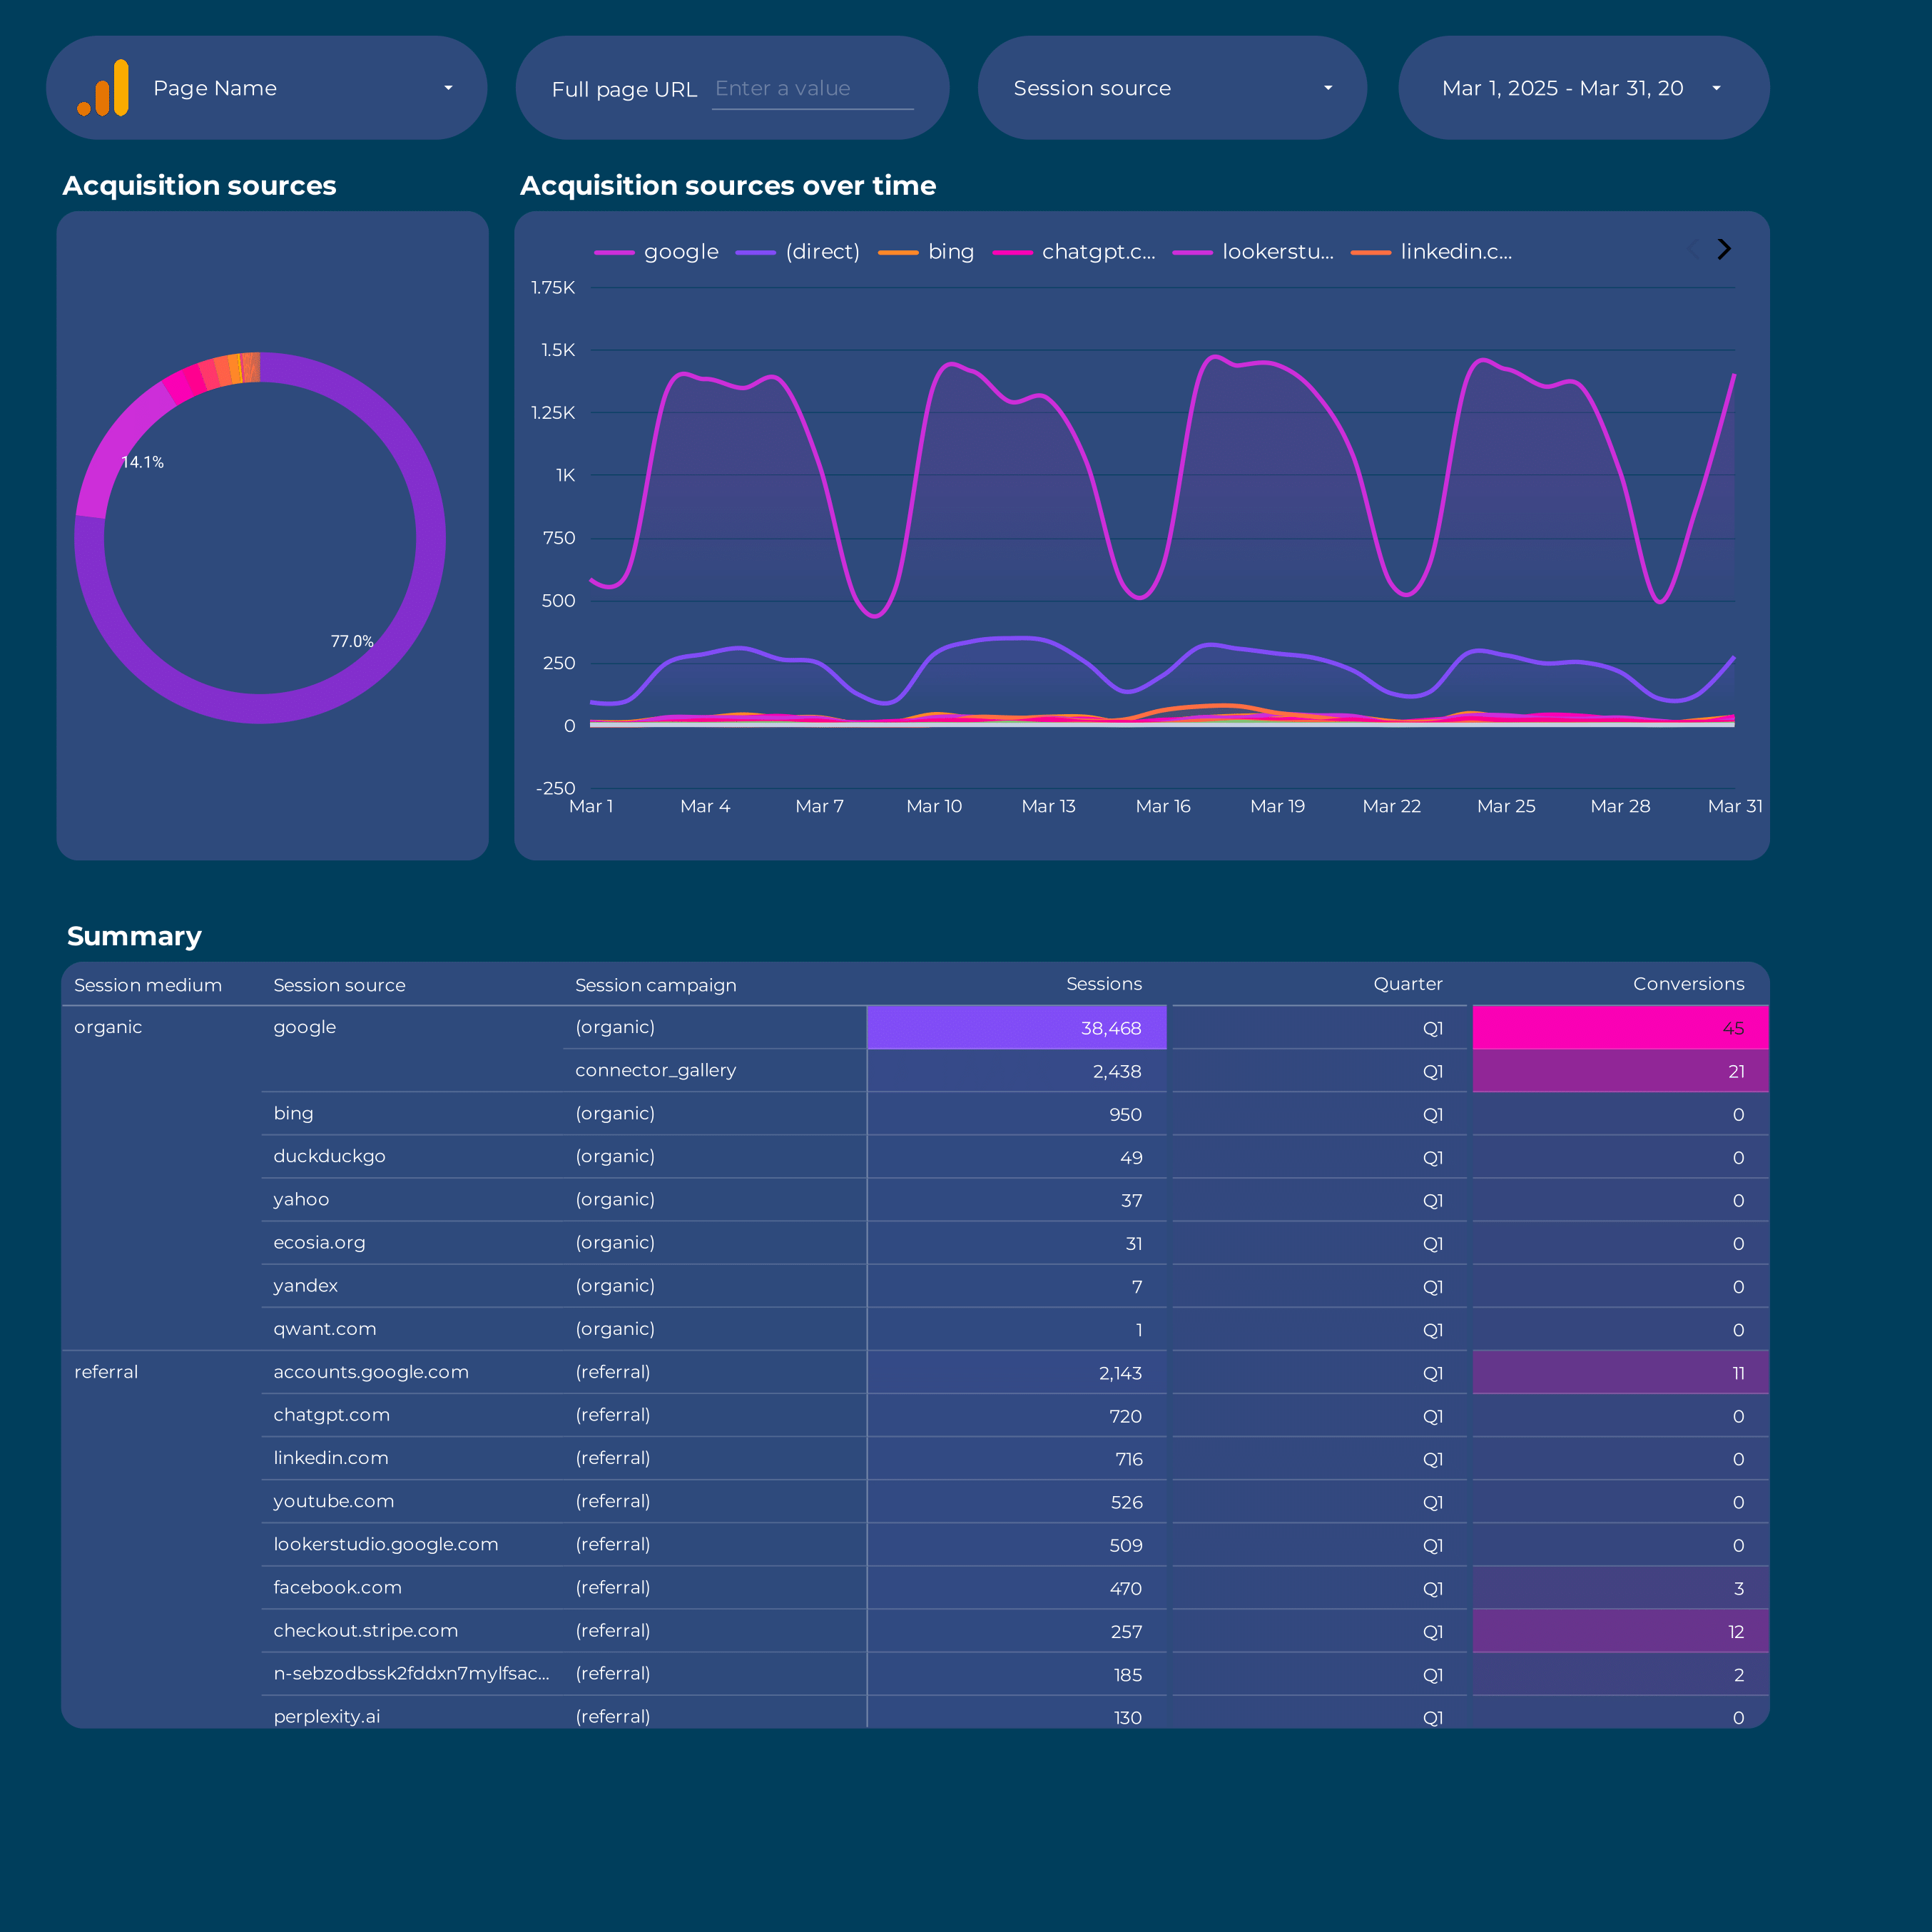
Acquisition Dashboard template
The Acquisition Dashboard template is designed for marketers utilizing Google Analytics 4 to track and analyze their marketing efforts. This dashboard provides insights into various marketing channels, including Content Marketing and PPC campaigns.
With this dashboard, users can:
- Monitor traffic sources and understand which channels drive the most visitors.
- Analyze user behavior and engagement metrics to optimize marketing strategies.
- Track the performance of PPC campaigns and assess ROI.
- Evaluate the effectiveness of content marketing efforts through detailed analytics.
Utilize this dashboard to make data-driven decisions and improve marketing outcomes by leveraging the capabilities of Google Analytics 4.
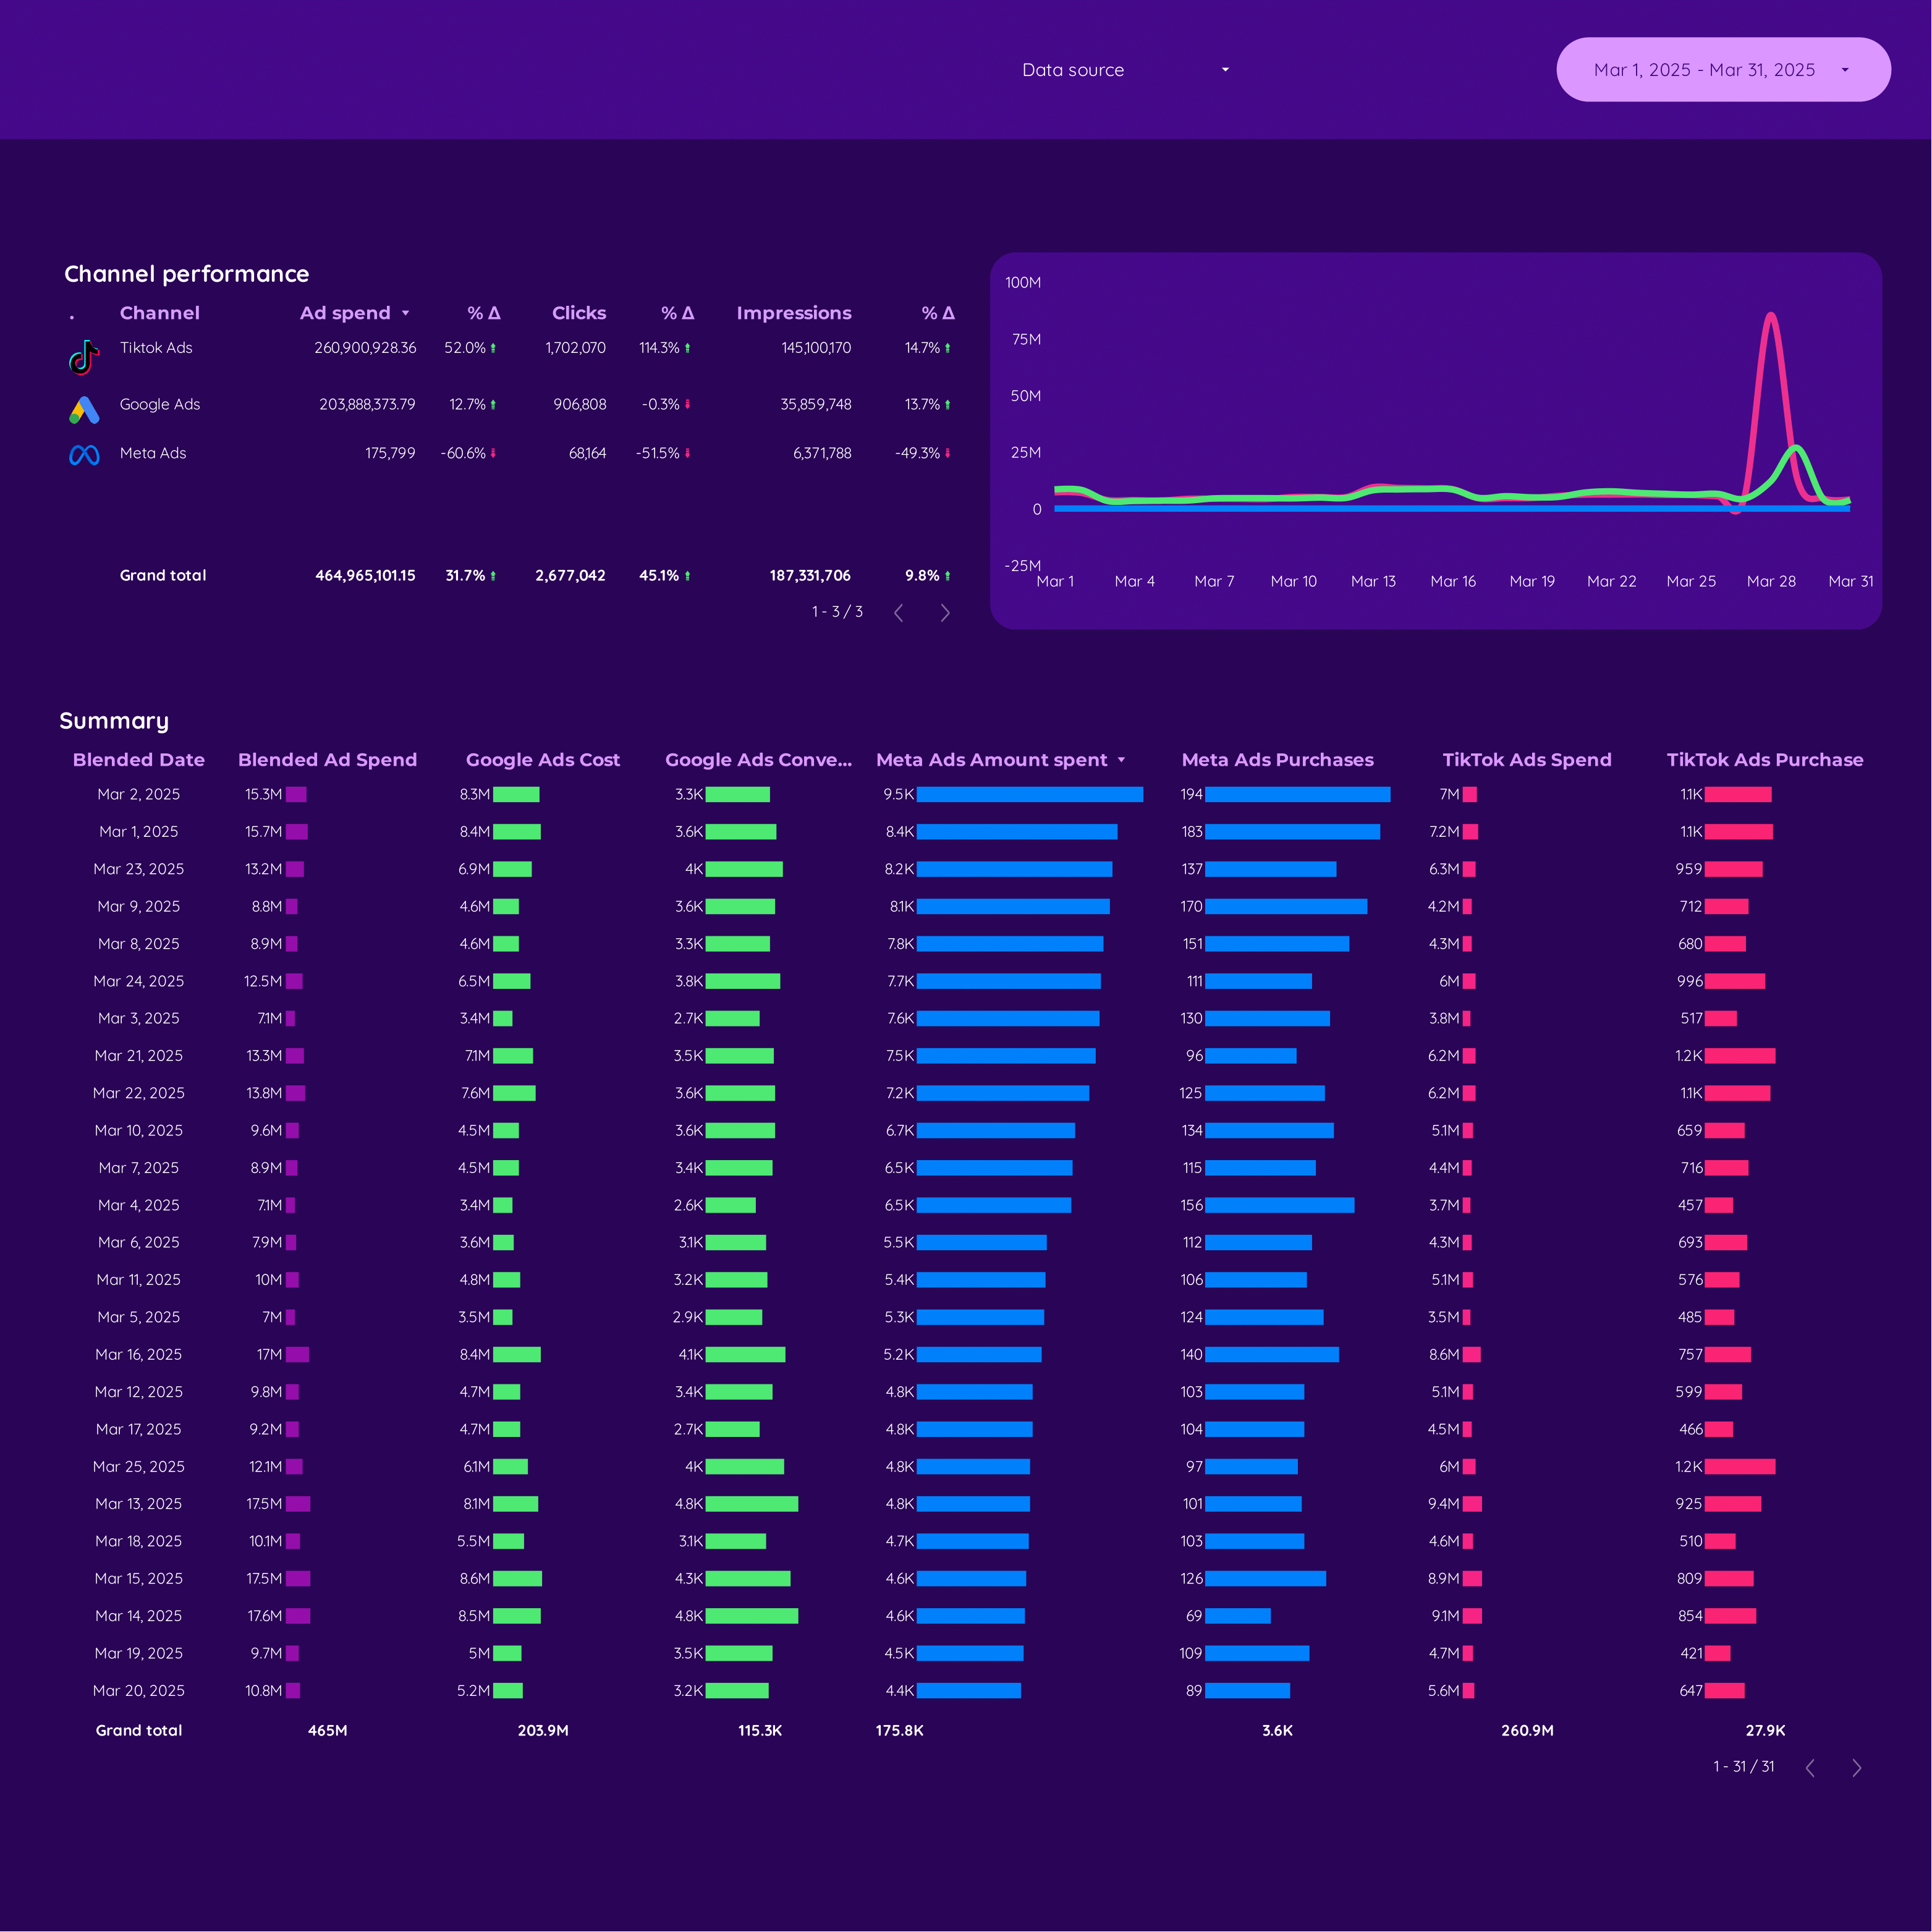
Cross-channel Dashboard template
The Cross-channel Dashboard template is designed for PPC and Marketing professionals in the E-commerce and B2B sectors. This template provides a centralized view of your advertising efforts across multiple platforms.
Track and analyze performance from:
- Facebook Ads
- Google Ads
- LinkedIn Ads
- TikTok Ads
Utilize this dashboard to monitor campaign metrics, compare platform performance, and make data-driven decisions. The template supports integration with various ad platforms, allowing for real-time data synchronization and reporting.
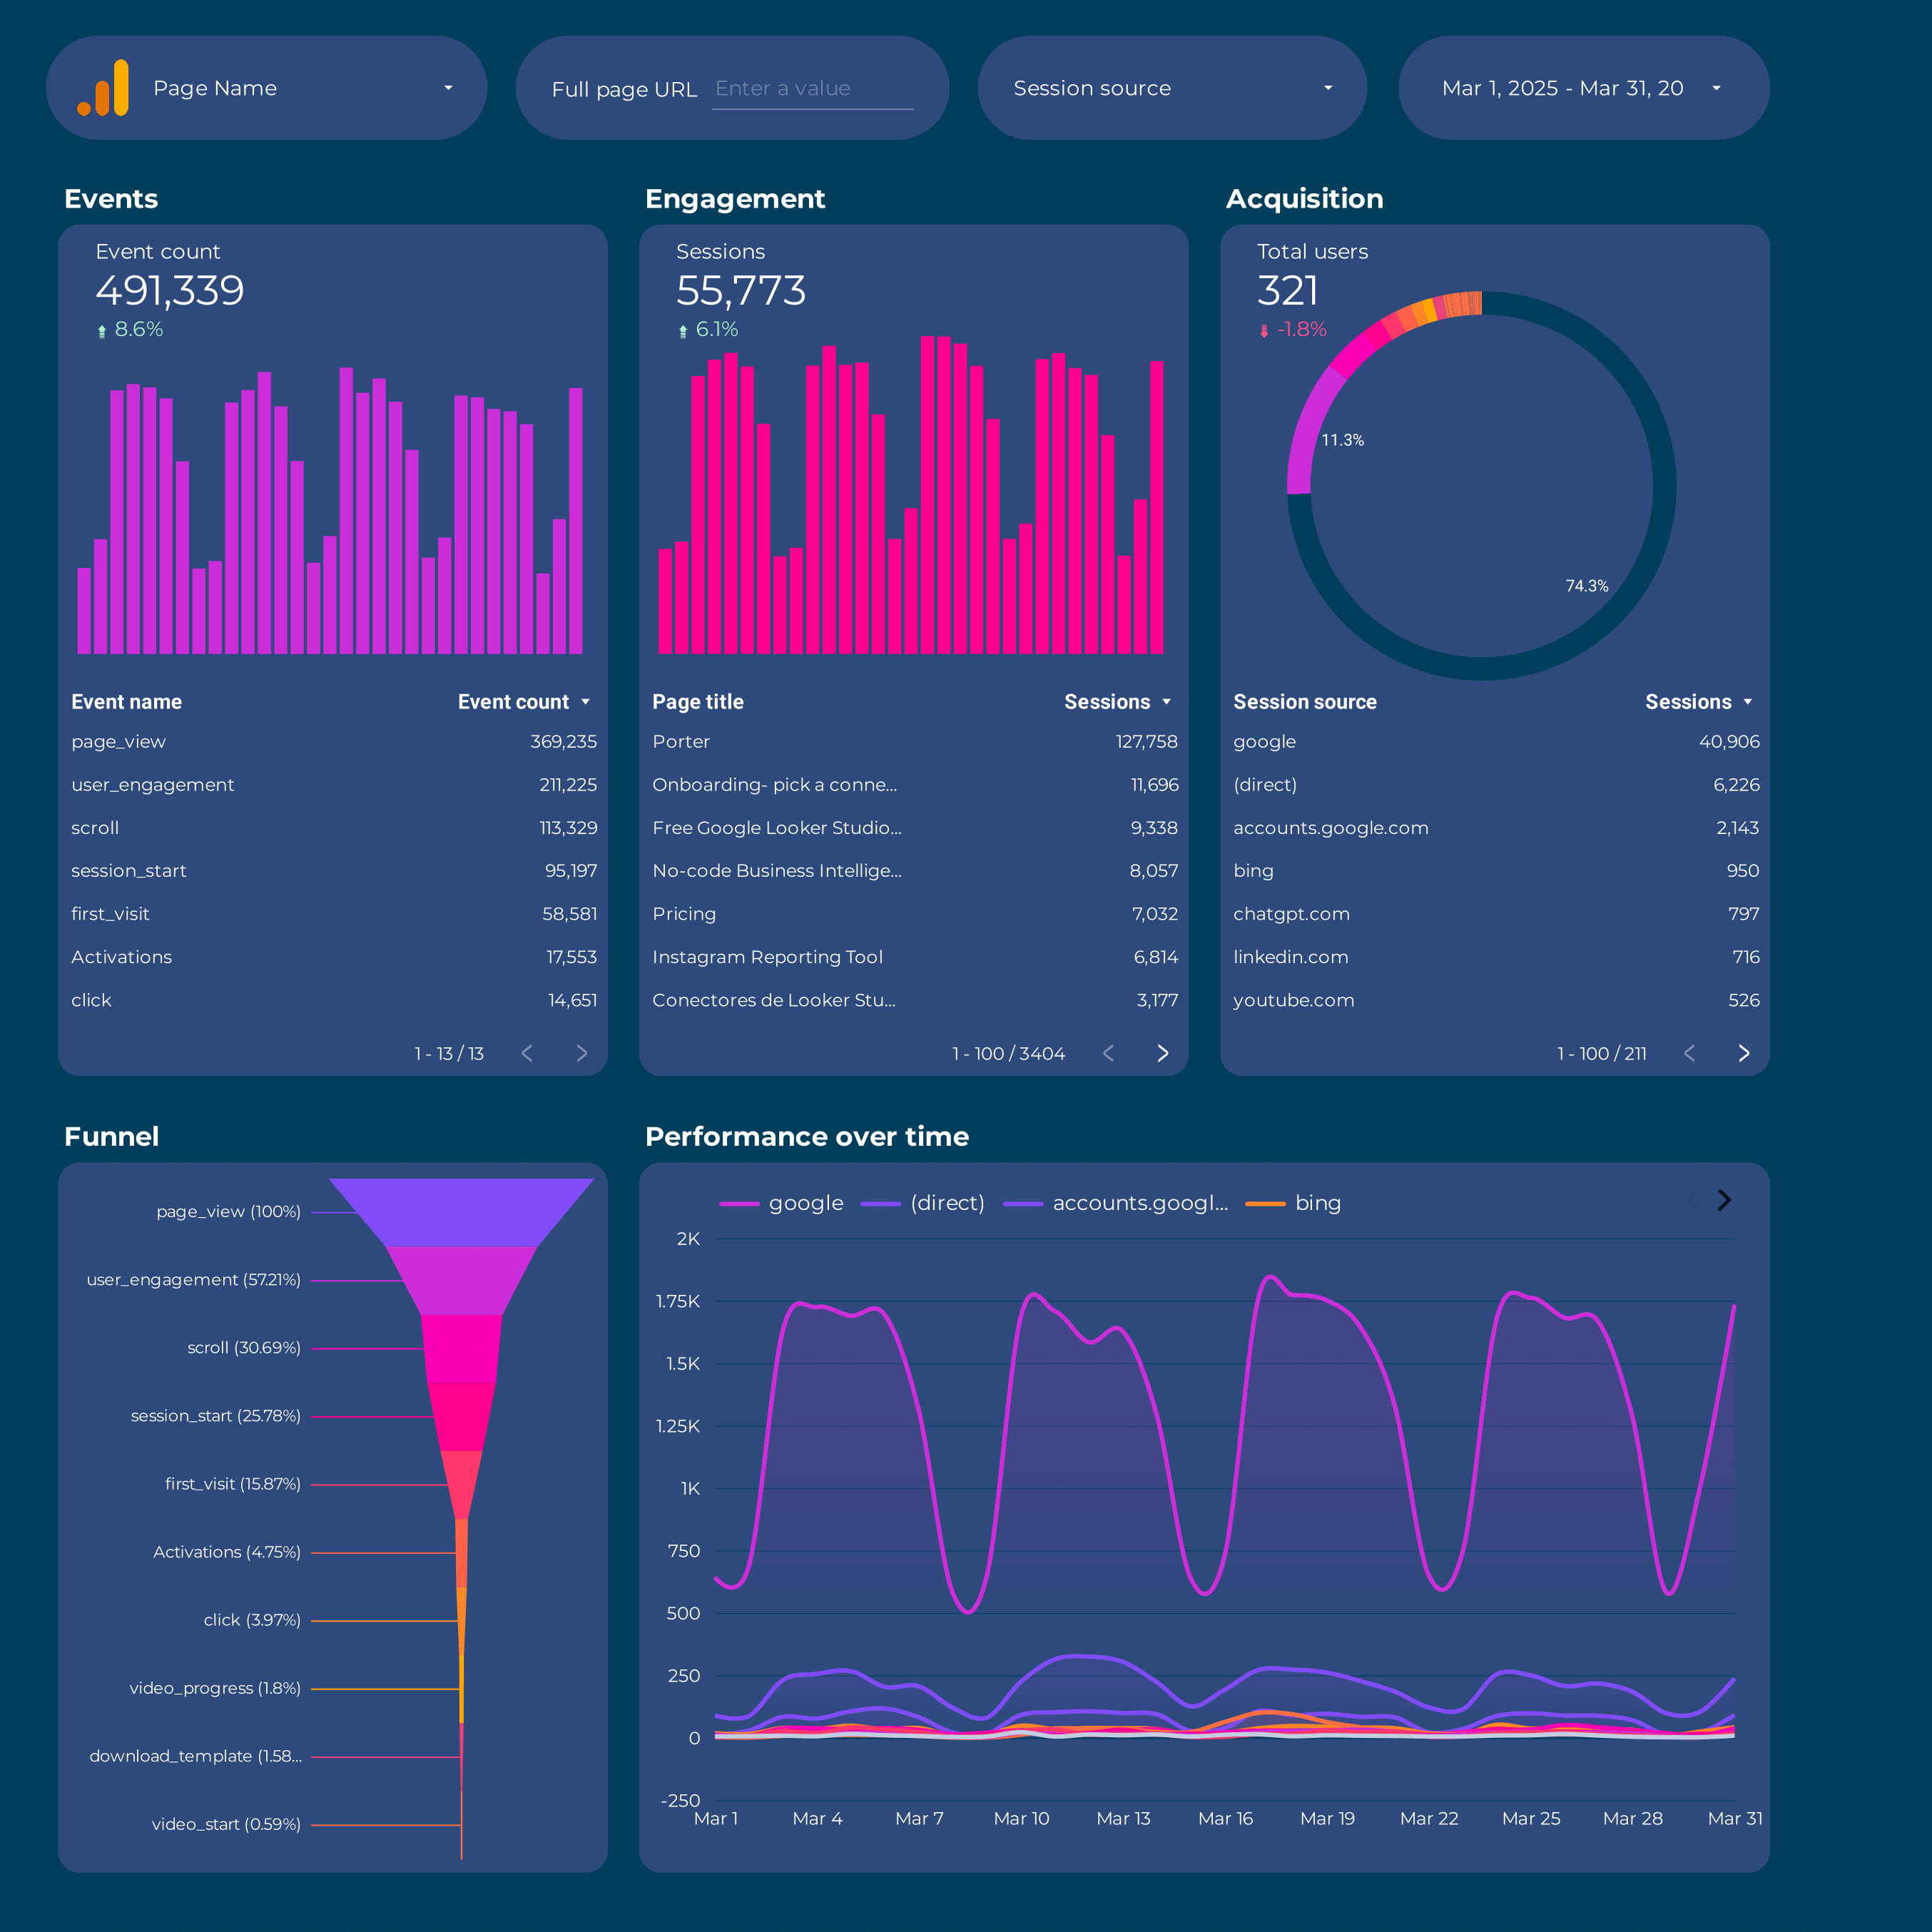
Google Analytics 4 Dashboard template
The Google Analytics 4 Dashboard Template is designed for marketing professionals and e-commerce businesses seeking to leverage website data effectively. This template provides a structured view of your Google Analytics 4 data, focusing on essential metrics and insights.
With this dashboard, you can:
- Track user acquisition and understand which channels drive the most traffic.
- Analyze user behavior to identify popular pages and content.
- Monitor conversion rates to assess the performance of marketing campaigns.
- Evaluate e-commerce metrics such as revenue, average order value, and product performance.
This template is tailored for those who need to make data-driven decisions based on real-time analytics and customizable reports.
Peso model Dashboard template
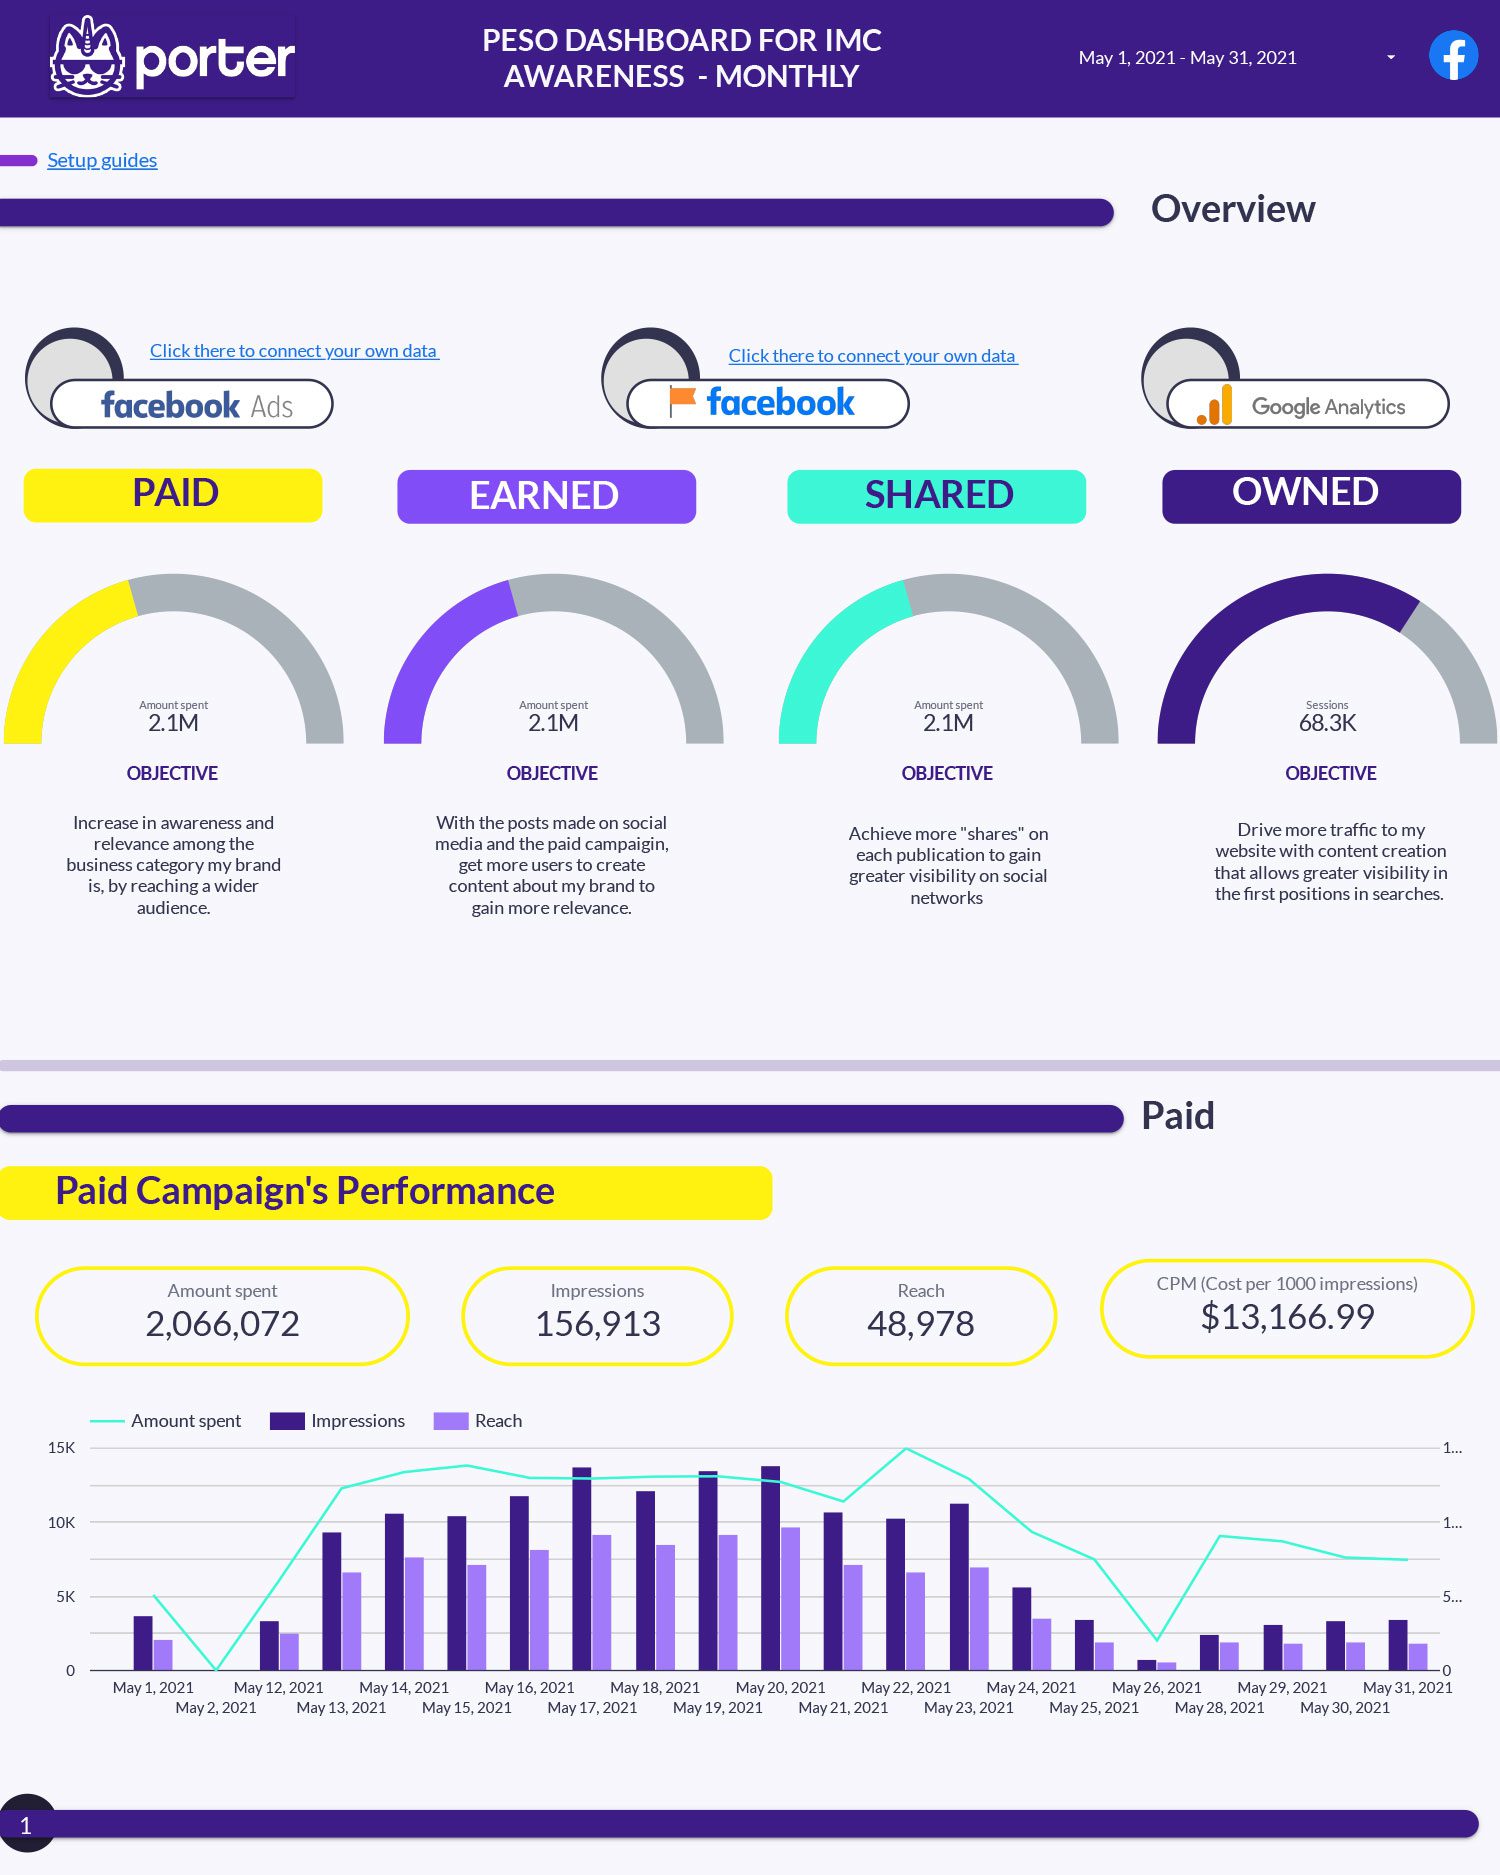
The PESO Model Dashboard template provides a structured approach to analyzing and managing your social media and digital marketing efforts. This template integrates various platforms and metrics to offer a holistic view of your marketing performance.
Social Media Insights are gathered from platforms like Instagram, Facebook, LinkedIn, Pinterest, and TikTok. These insights help in understanding audience engagement and content reach.
- Instagram Insights: Track follower growth, engagement rates, and content interactions.
- Facebook Insights: Analyze page views, post reach, and audience demographics.
- LinkedIn Pages: Monitor page followers, post performance, and professional engagement.
- Pinterest: Evaluate pin impressions, saves, and audience trends.
- TikTok: Assess video views, likes, and follower activity.
E-commerce Metrics are integrated to track sales conversions and customer interactions across social platforms, providing a direct link between social media efforts and revenue generation.
SEO Performance is monitored to ensure that content is optimized for search engines, driving organic traffic to your digital assets.
This dashboard template is designed for marketers looking to streamline their reporting process and gain actionable insights from their digital marketing activities.
Social Media Client presentation Dashboard template
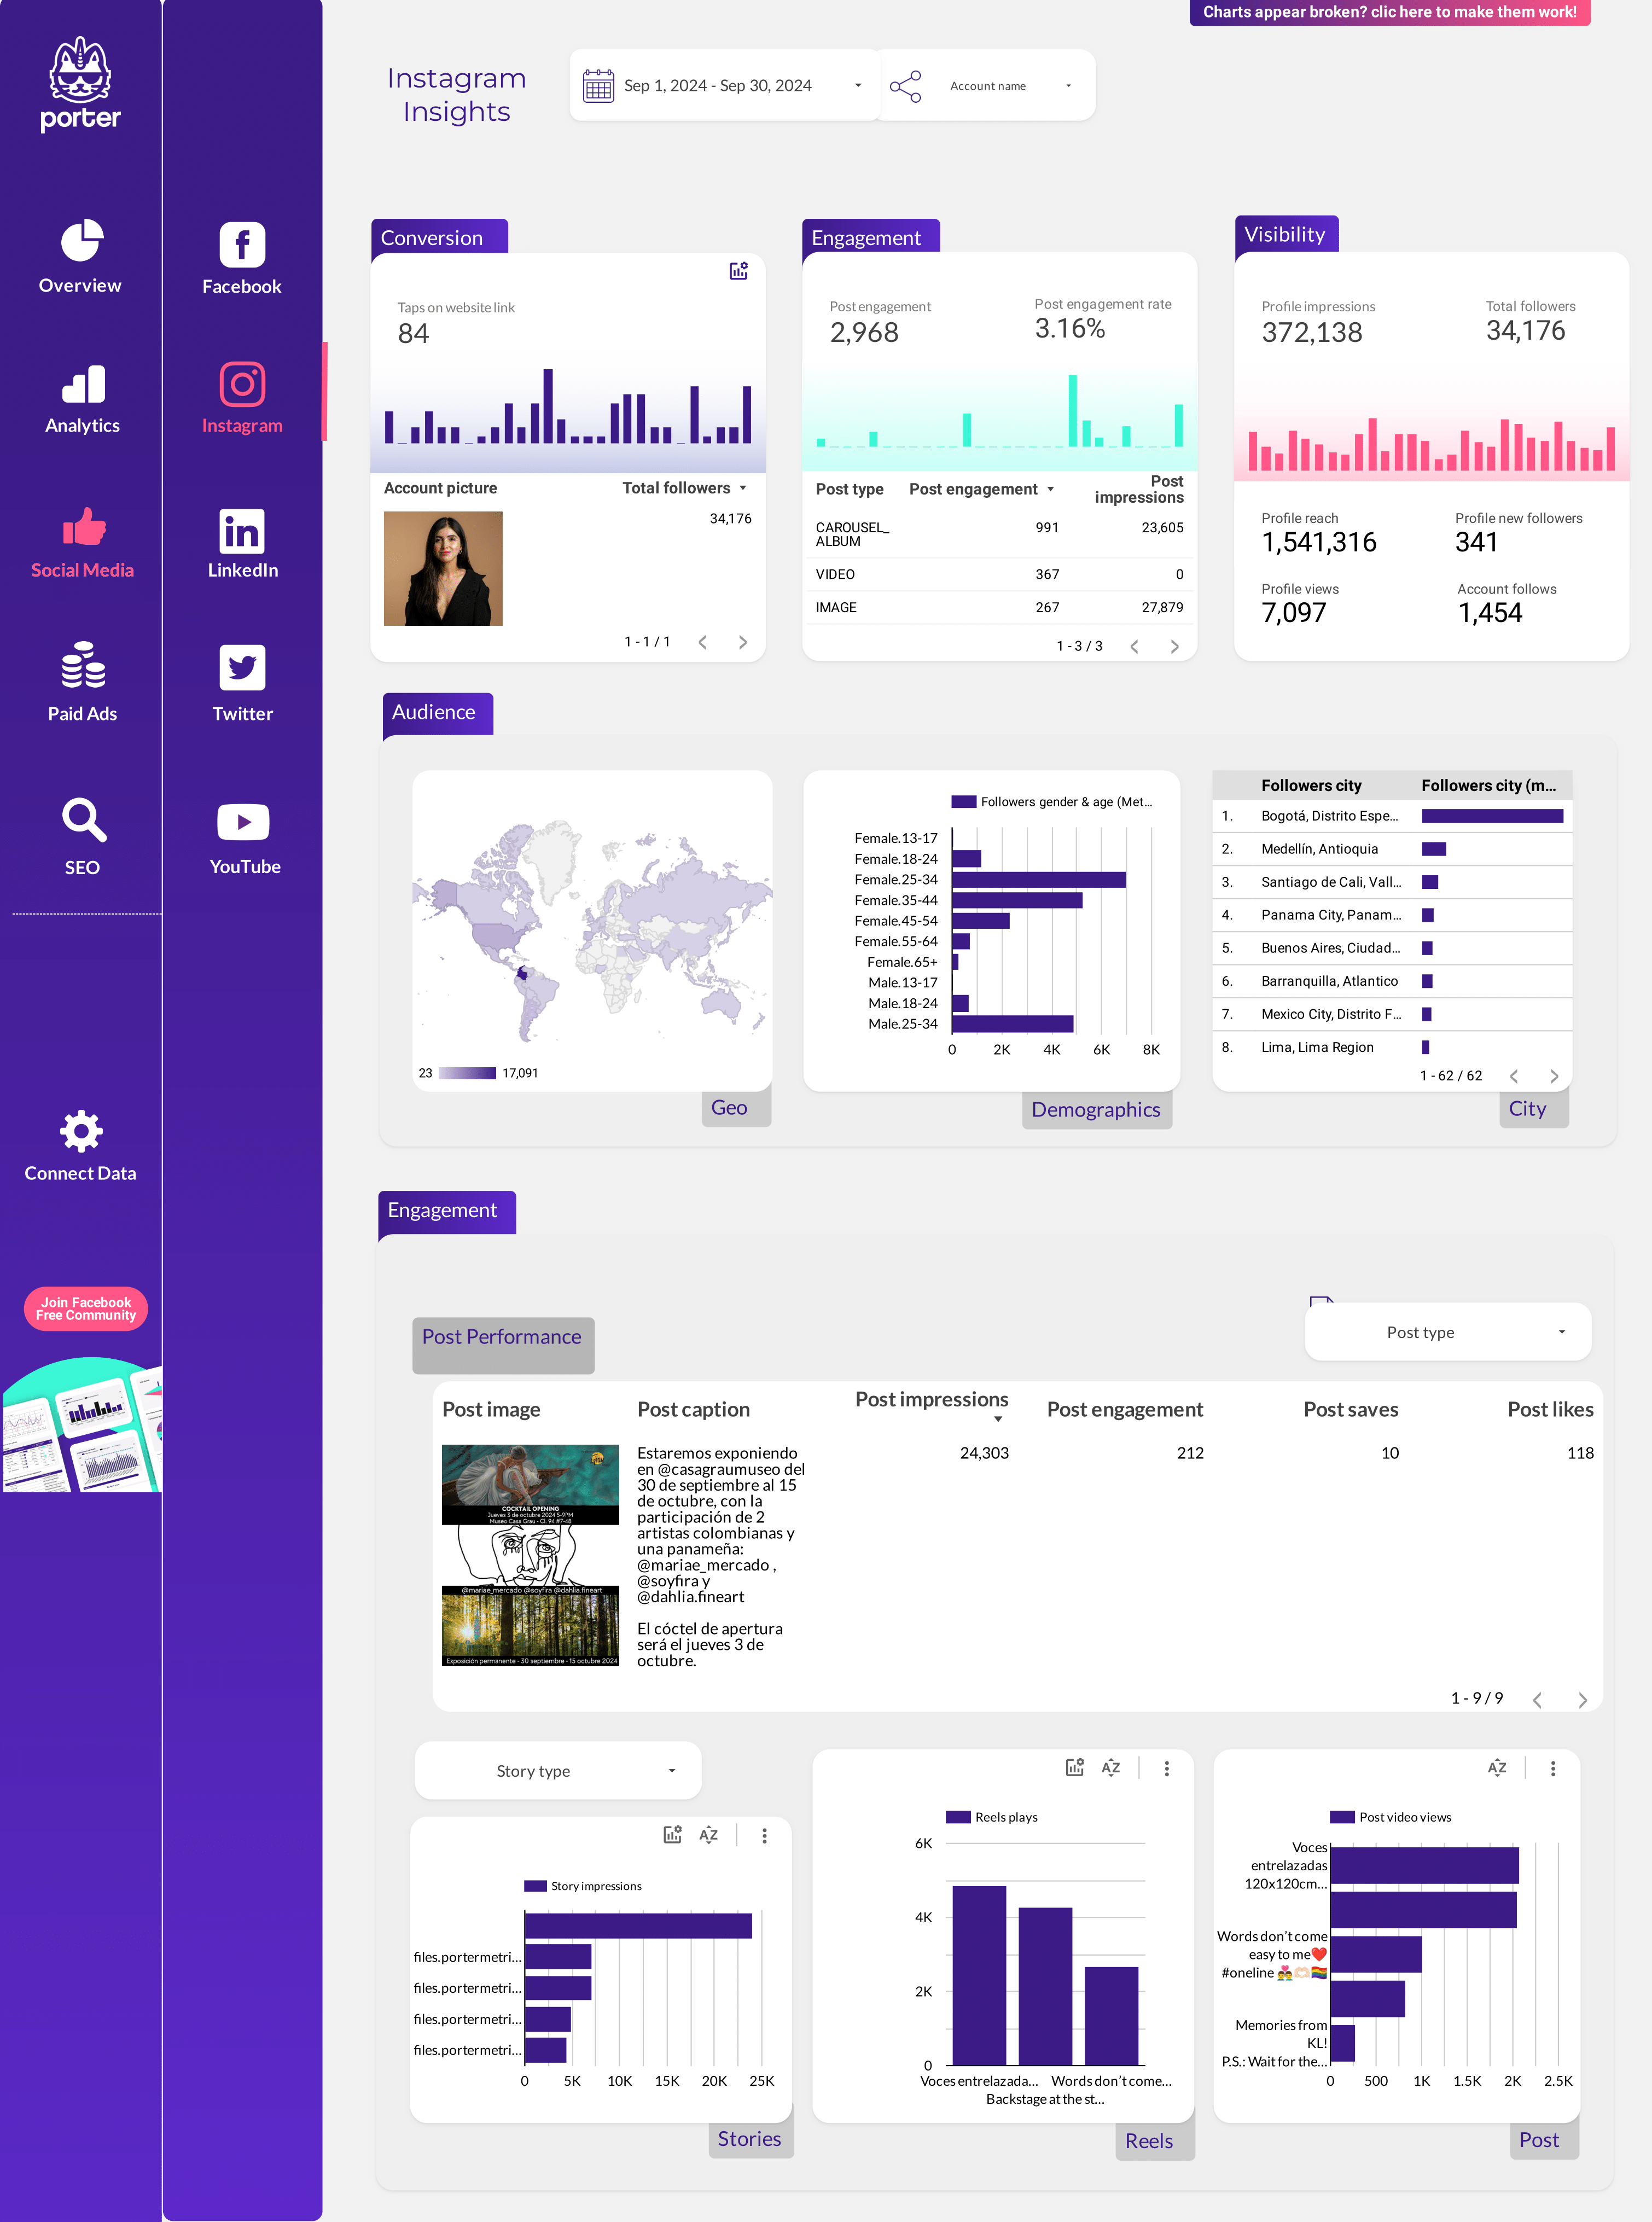
The Social Media Client Presentation Dashboard template is designed for agencies managing multiple social media platforms. It provides a structured overview of public data and insights from various social media channels.
Instagram Public Data and Instagram Insights offer detailed analytics on audience engagement and content performance. This includes metrics such as likes, comments, and follower growth.
Facebook Insights deliver data on page interactions, post reach, and demographic information, allowing for a thorough analysis of audience behavior.
For LinkedIn Pages, the dashboard presents data on post engagement, follower demographics, and page views, facilitating a deeper understanding of professional audience interactions.
Google Business Profile metrics include search visibility, customer actions, and review analytics, providing a comprehensive view of business presence on Google.
The dashboard also integrates data from Pinterest and TikTok, offering insights into pin performance, video views, and audience engagement trends.
- Track and compare performance across multiple platforms.
- Access detailed insights for strategic decision-making.
- Utilize data-driven reports for client presentations.