





Trusted by 1,600+ marketing teams and agencies


What you can do with this marketing dashboard
Six jobs this marketing dashboard does, from ad spend to won deals. Click one to see its view, then paste its prompt into Claude.
See what drives marketing results
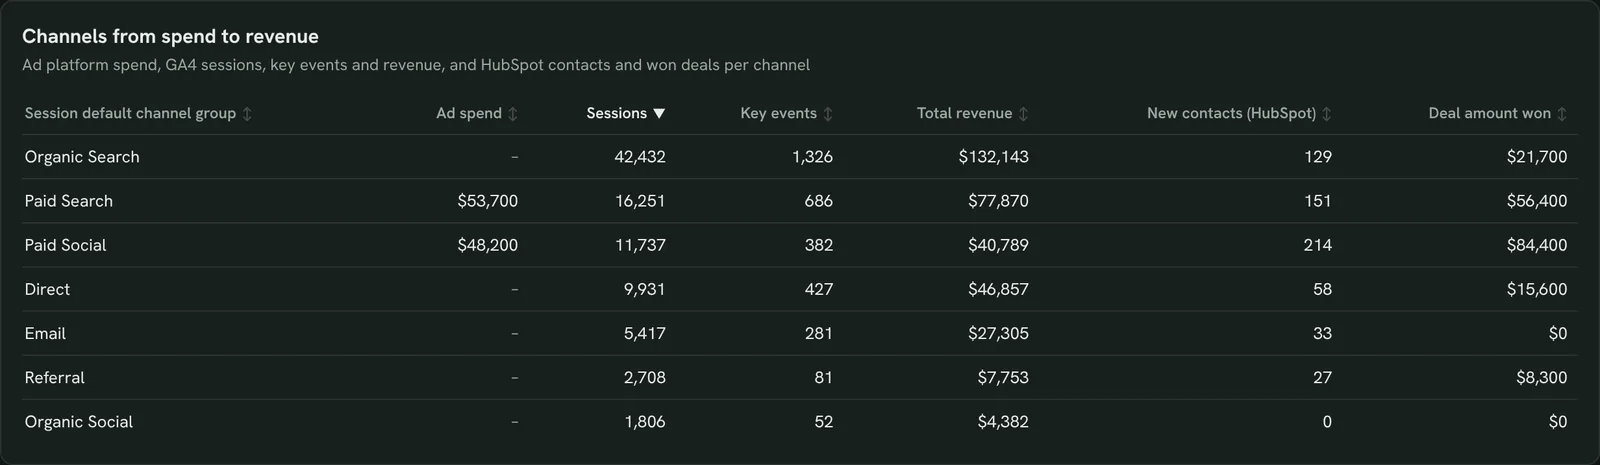
Spend, sessions, key events, revenue, contacts and won deals per channel, so you see which channels pull their weight.
- Which channels bring sessions, leads and revenue?
- Which channel brings won deals, not just traffic?
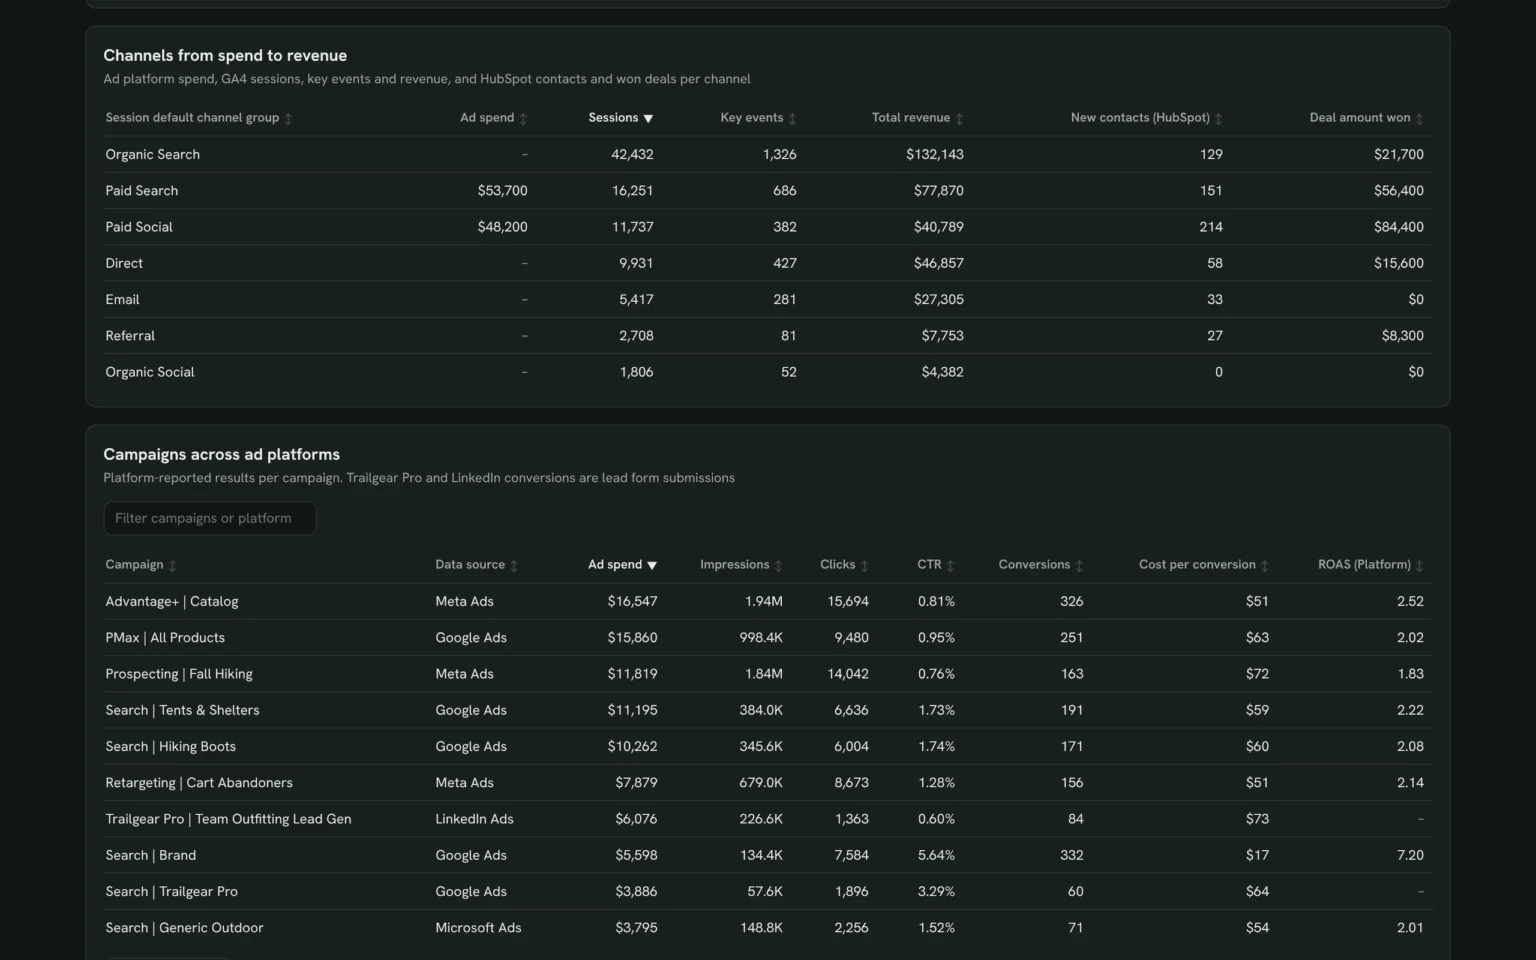
Show ad spend, sessions, key events and total revenue by session default channel group for the last 14 days, with HubSpot new contacts and deal amount won per matching source.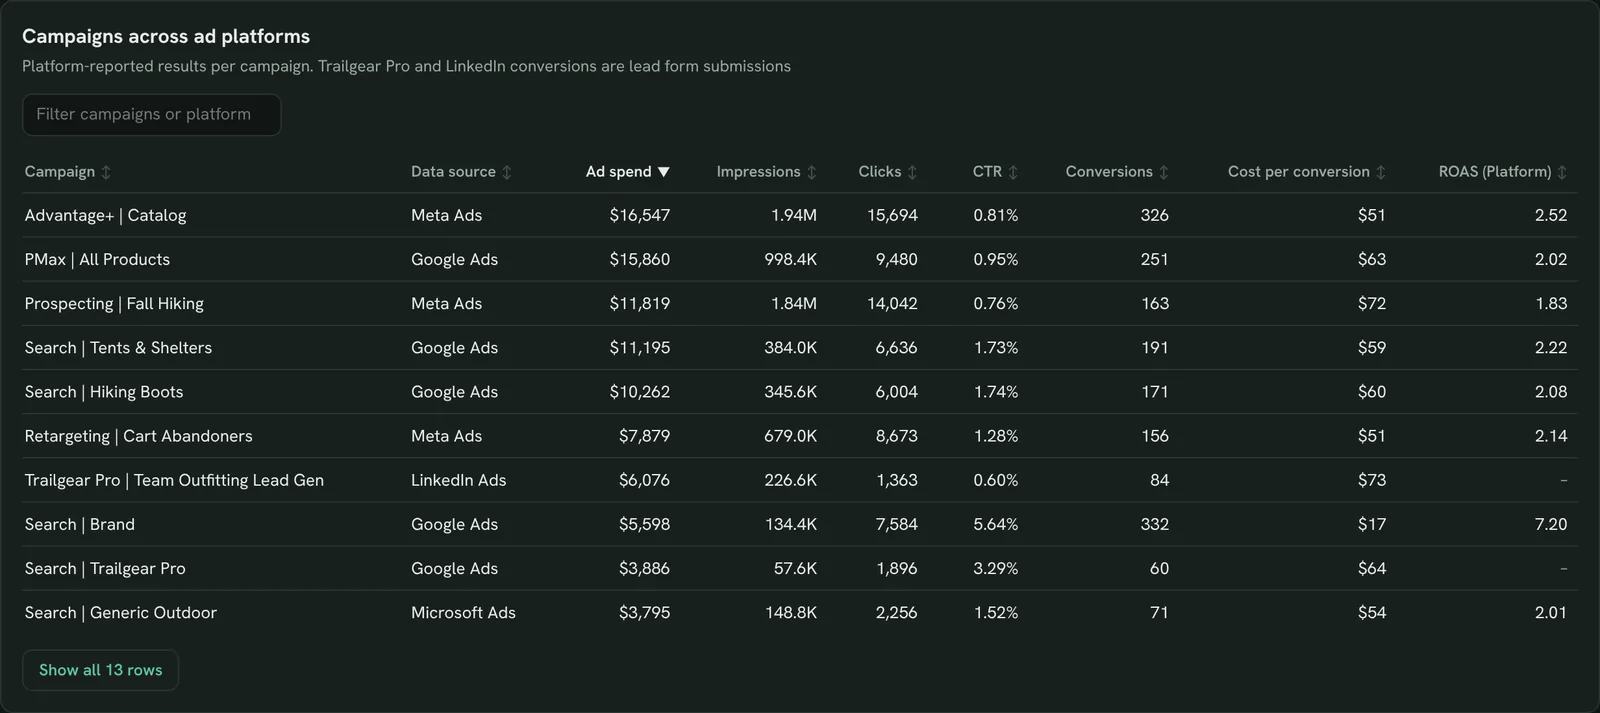
Track campaigns across Google Ads and Meta Ads
Spend, CTR, cost per conversion and ROAS for every campaign on every platform, so you catch the ones off target.
- Which campaigns spend the most?
- Which have the highest cost per conversion?
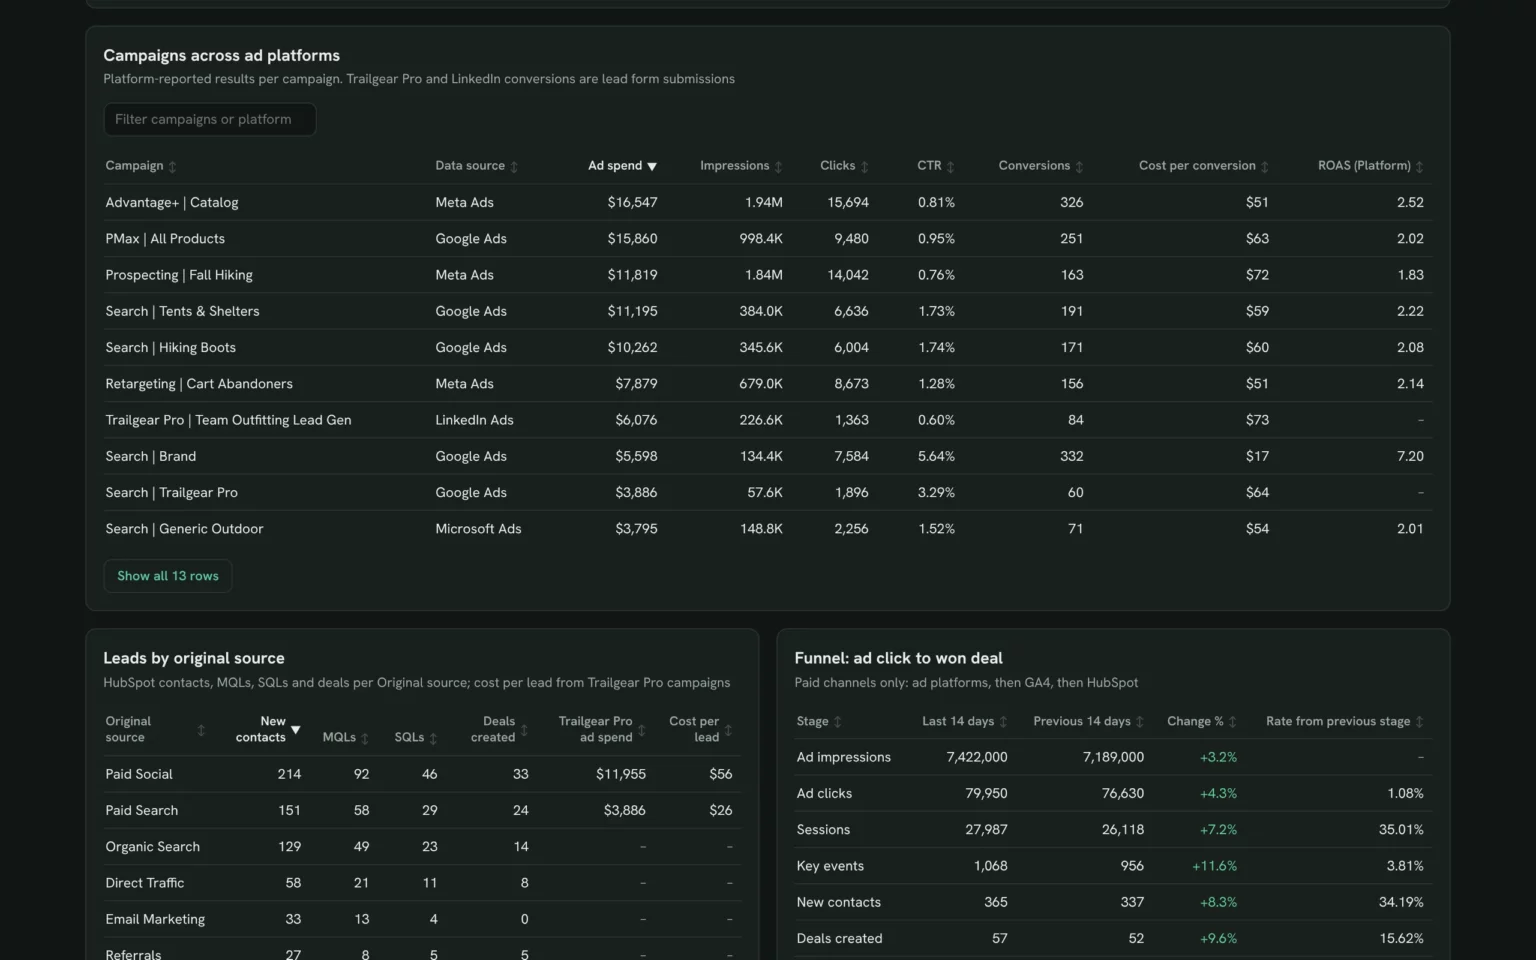
List every campaign from my connected ad platforms with ad spend, impressions, clicks, CTR, conversions, cost per conversion and ROAS for the last 14 days, sorted by spend.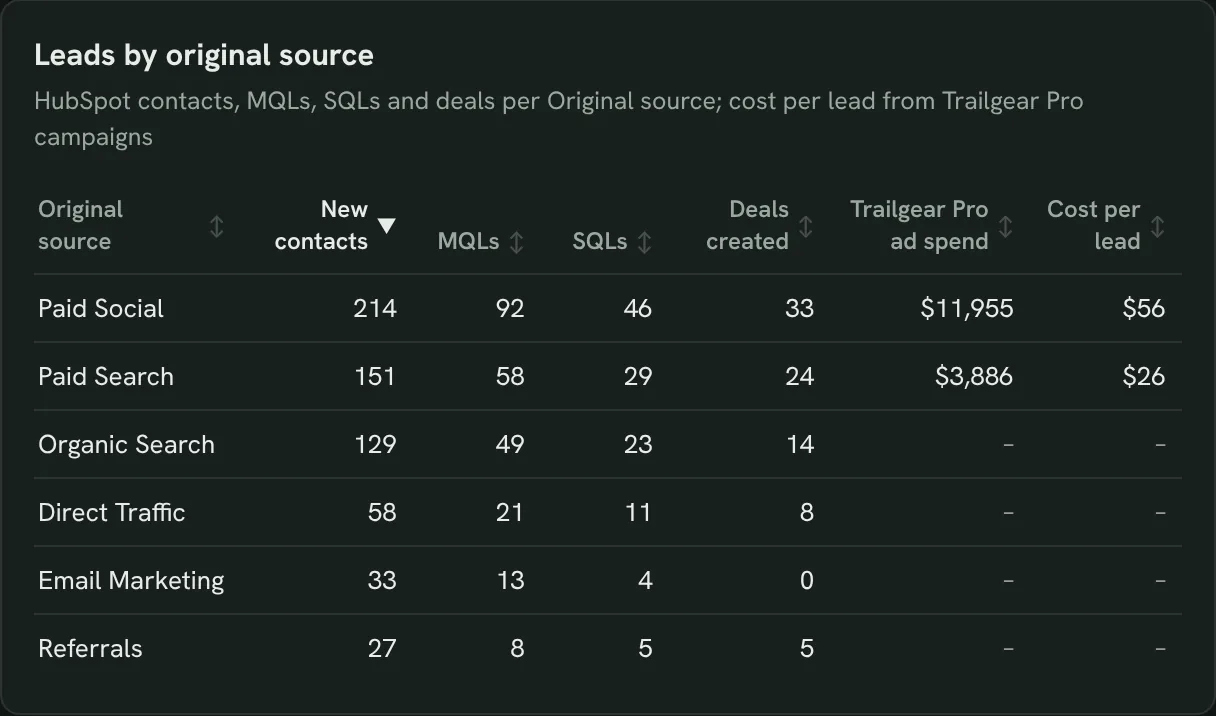
Count qualified leads by channel
HubSpot contacts, MQLs, SQLs and deals by original source, so you know which leads turn into pipeline.
- How many MQLs and SQLs did each source bring?
- What does a lead cost from paid social vs paid search?
From HubSpot, show new contacts, MQLs, SQLs and deals created by original source for the last 14 days, and cost per lead for paid sources using the spend of the lead campaigns.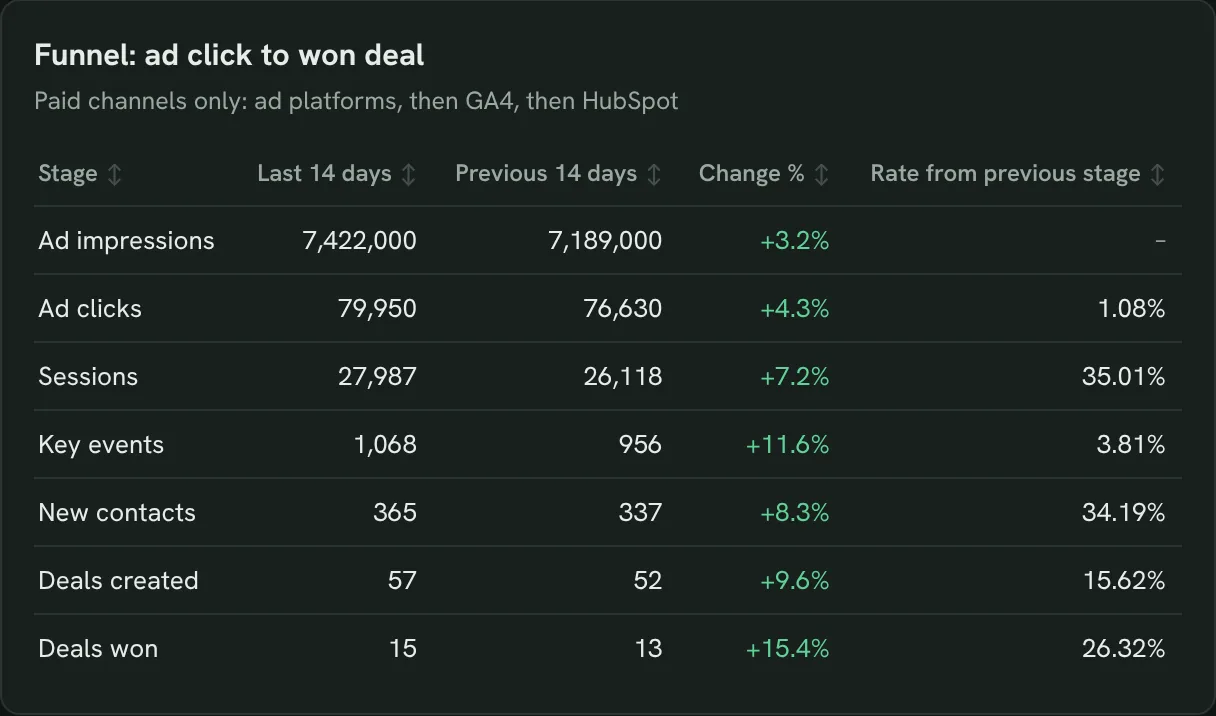
Find where the funnel leaks
From ad impression to won deal, with the rate between stages, so you fix the step that loses most people.
- Where does conversion drop from ad click to deal?
- Which stage got worse than last period?
Build a paid funnel for the last 14 days vs the 14 before: ad impressions, clicks, Paid Search and Paid Social sessions and key events, HubSpot new contacts, deals created and won, with the rate between stages.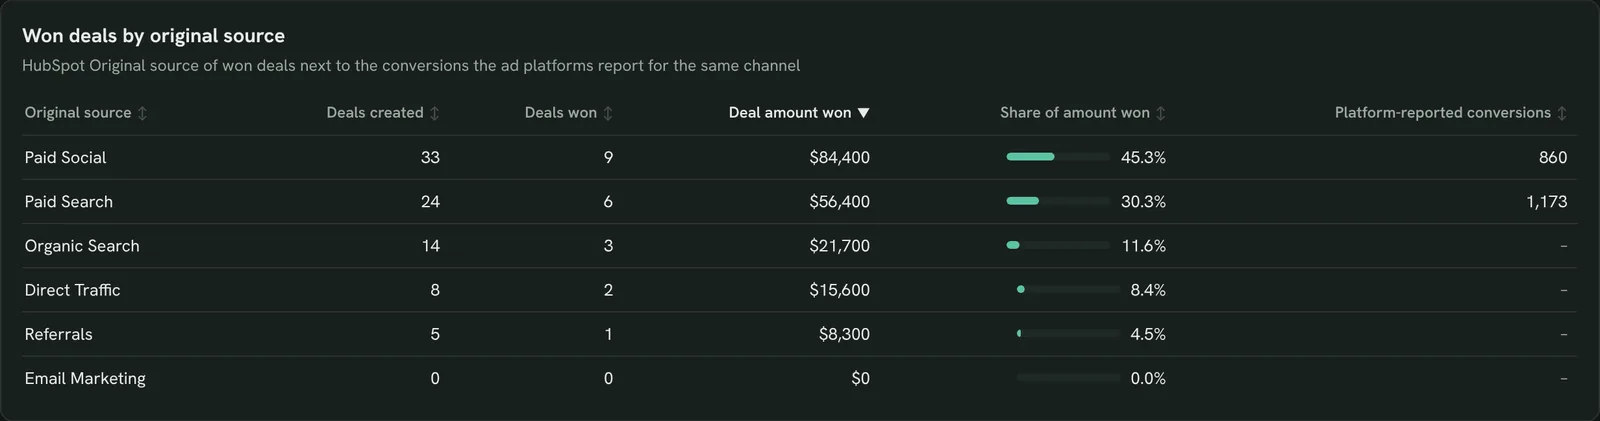
See which sources bring the deals
Won deals by HubSpot original source next to the conversions ad platforms claim, so you see where they disagree.
- Which sources bring the most won revenue?
- Do ad platforms claim more than the CRM shows?
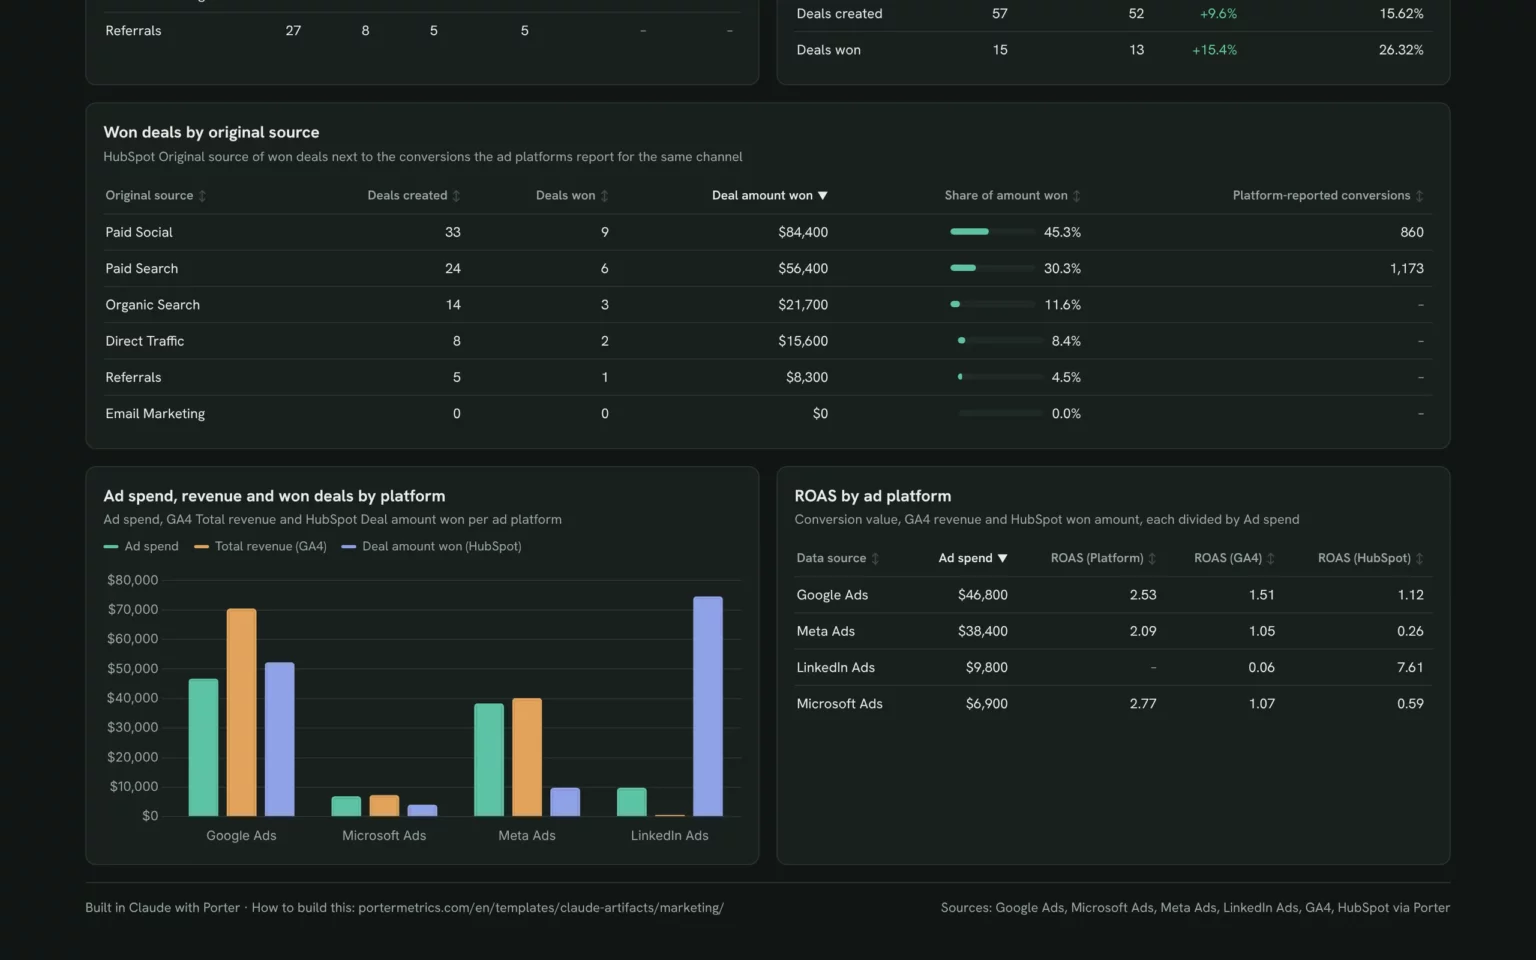
Show deals created, deals won and deal amount won by HubSpot original source for the last 14 days, next to the conversions my ad platforms report for the same channels.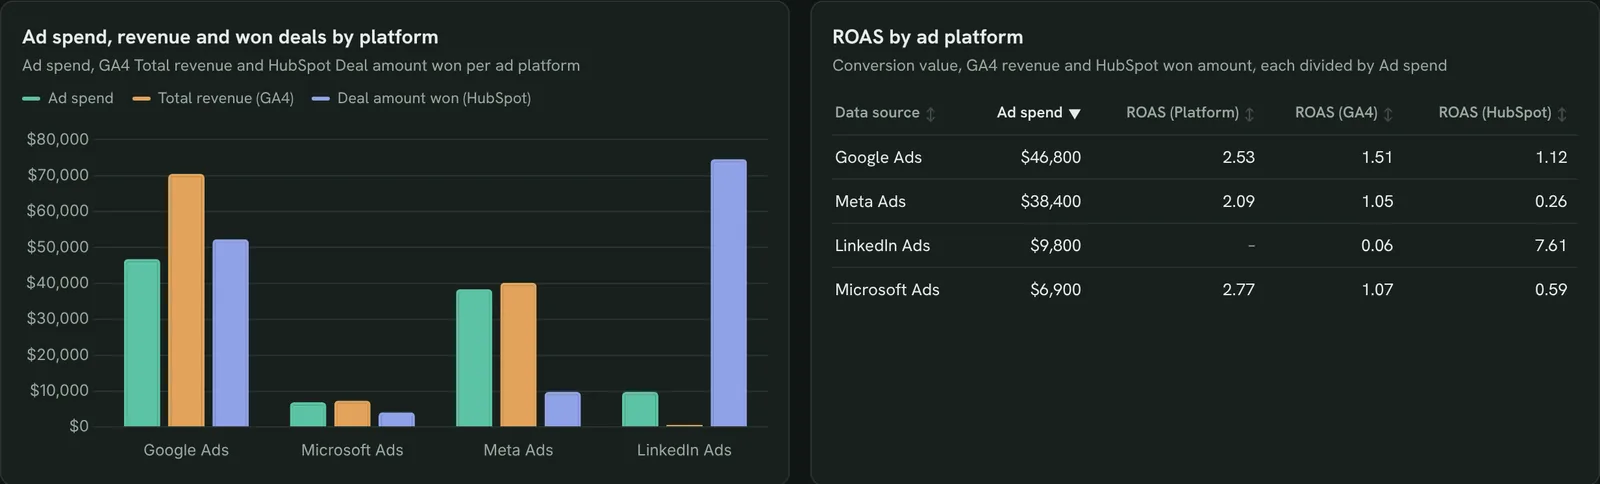
Tie ad spend to won revenue
Spend, GA4 revenue and won deals per ad platform with three ROAS figures, so budget follows real revenue.
- Which platform returns the most per dollar?
- Which one looks good in-platform but not in the CRM?
For each ad platform, show ad spend, conversion value, GA4 total revenue and HubSpot deal amount won for the last 14 days, with ROAS on each of the three.How to set up the marketing dashboard in Claude
You need GA4, at least one of Google Ads or Meta Ads, HubSpot for the lead views, a free Porter account and Claude Pro, Max, Team or Enterprise for Claude Dashboards. Setup takes about 15 minutes.
Connect your ad platforms, GA4 and HubSpot in Porter
Sign up free at Porter, open Data sources and connect Google Analytics 4, Google Ads, Meta Ads and HubSpot, one account each. The Google Ads, Meta Ads and HubSpot to Claude tutorials show each click.
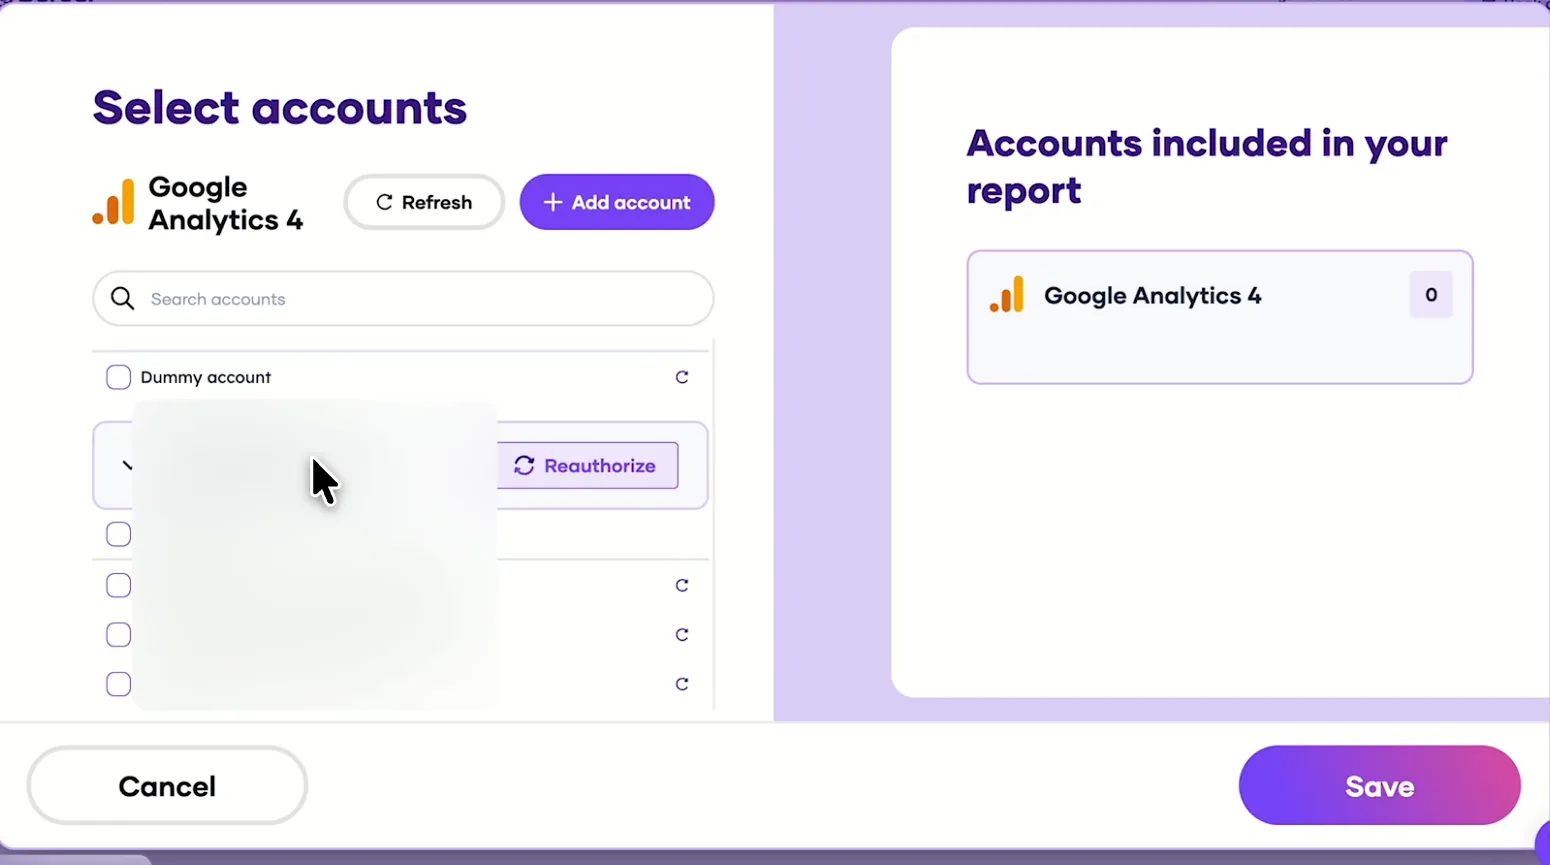
Pick the GA4 property, then add each ad account and HubSpot the same way. Add Porter to Claude
In Claude, go to Customize → Connectors → Add custom connector, paste https://mcp.portermetrics.com/mcp and name it Porter Metrics. Click Continue, then sign in to Porter and allow access.
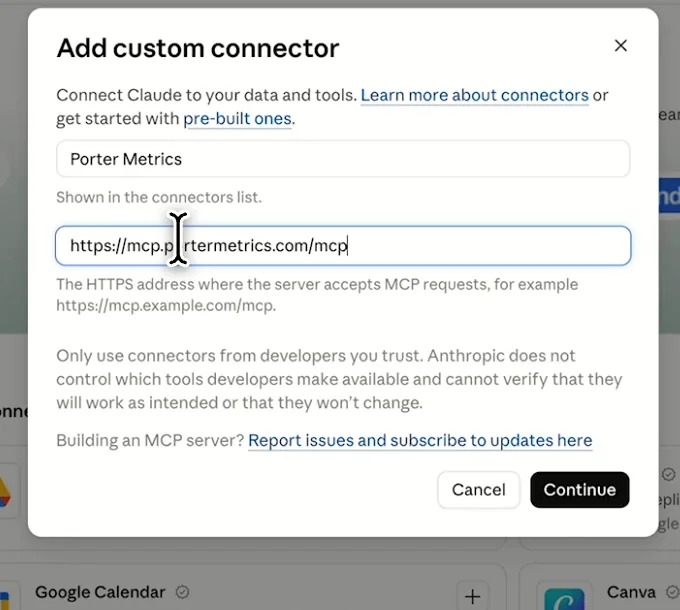
In Claude: Customize, Connectors, Add custom connector, then paste Porter’s MCP URL Paste the install prompt
Open a new chat in Claude and paste this prompt. Claude queries every connected source through Porter and builds the dashboard.
Install promptDuplicate this Claude dashboard template and keep its layout, views and styling: https://claude.ai/artifact/StnehJxKH6FqHvoS8PeMZk Then rebuild it with my own data through Porter: a marketing dashboard from Google Ads, Meta Ads, GA4 and HubSpot, plus Microsoft Ads and LinkedIn Ads if connected, last 14 days vs the 14 before: KPI cards for ad spend, clicks, conversions, conversion value, ROAS, sessions, key events, revenue, new contacts and deal amount won; daily ad spend and key events; channels with spend, sessions, key events, revenue, contacts and won deals; campaigns with spend, CTR, conversions, cost per conversion and ROAS; HubSpot contacts, MQLs, SQLs and deals by original source; a paid funnel from impressions to won deals; won deals by source next to platform conversions; and ROAS per ad platform on platform value, GA4 revenue and won deals. Open in Claude with this prompt
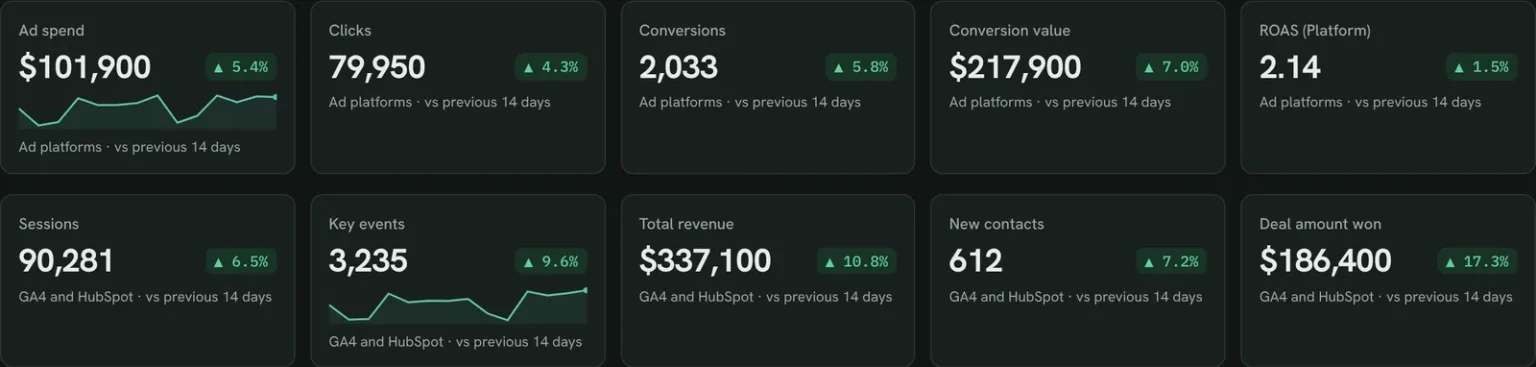
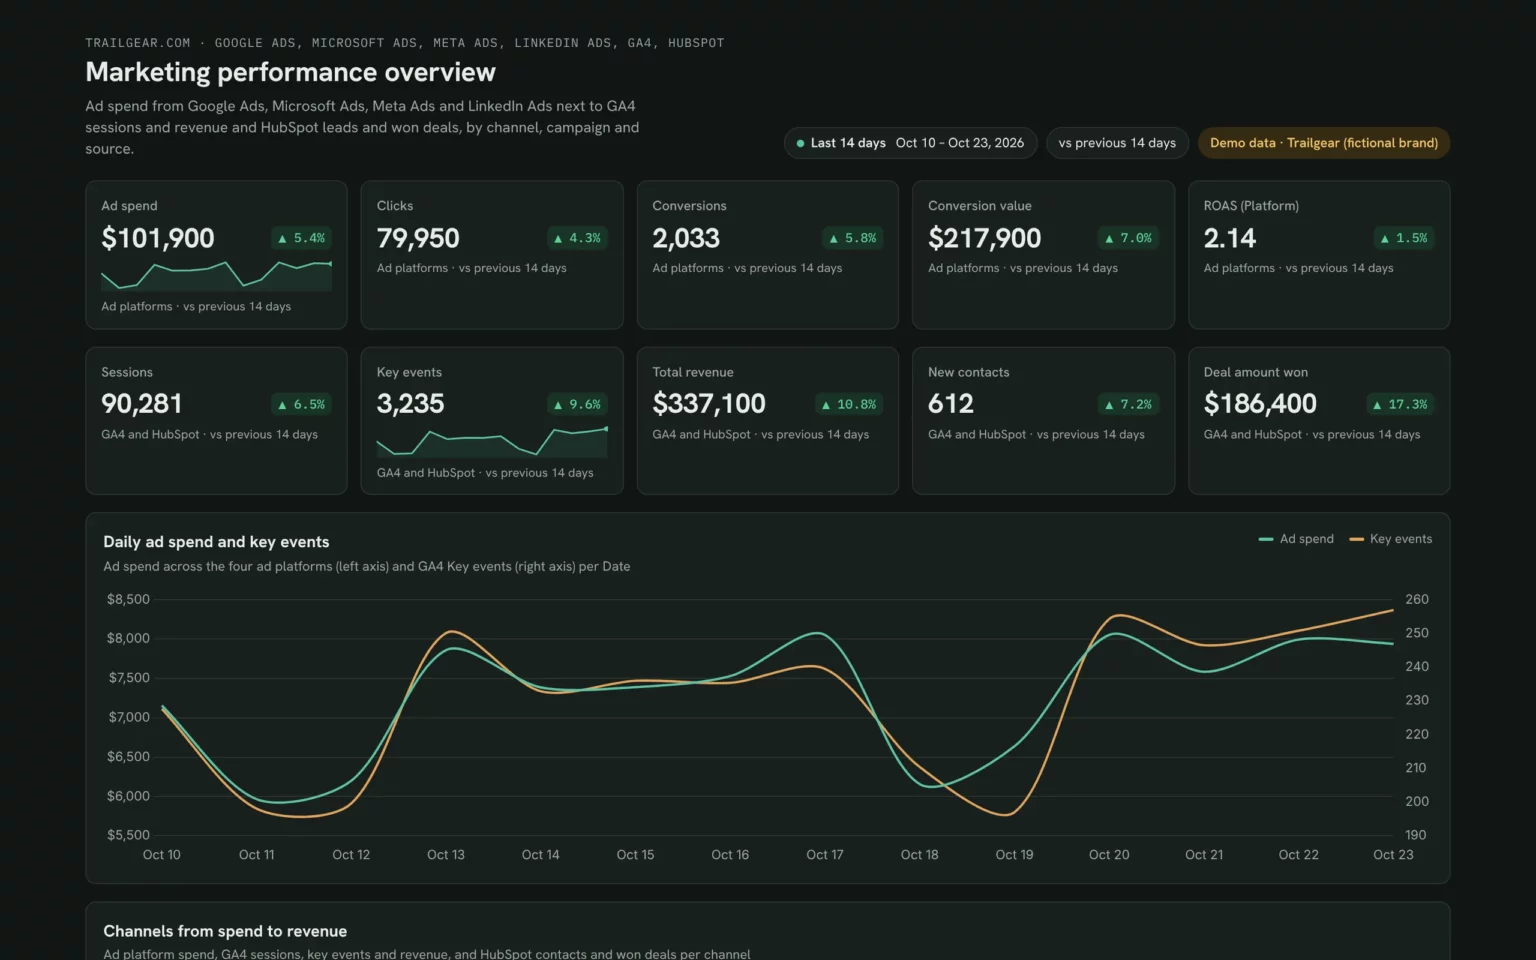
The first thing Claude builds: ad platform, GA4 and HubSpot KPI cards. Demo data shown.
How to connect Google Analytics 4 to Claude (no code)
Marketing dashboard fields and data
The marketing dashboard blends ad platform, GA4 and HubSpot fields on date, channel and campaign, so every row carries cost and result together.
Top 5 marketing KPIs to watch
Trailgear demo data · last 14 days vs the 14 before
- Ad spend$101,900+5.4%
Spend up with flat won deals means the extra budget bought traffic, not customers.
- ROAS2.14+1.5%
In-platform ROAS above 2 with a low CRM ROAS means the platform counts sales the CRM never sees.
- Key events3,235+9.6%
Rising faster than sessions means the site converts better; check the funnel before adding budget.
- New contacts612+7.2%
Watch the MQL share, not the count. More contacts with fewer MQLs means looser targeting.
- Deal amount won$186,400+17.3%
The number budget decisions should rest on. The bars are each original source.
How the numbers are calculated
- ROAS (Platform)
- Conversion value the ad platforms report ÷ ad spend.
- ROAS (HubSpot)
- Deal amount won in HubSpot ÷ ad spend.
- Cost per conversion
- Ad spend ÷ conversions, per campaign.
- Cost per lead
- Spend on lead campaigns ÷ new HubSpot contacts from that source.
- Change
- (This period − previous period) ÷ previous period.
Data sources
Metrics
 Cost
- Clicks
- Conversions
- Conversions value
 Amount spent
- Purchases
- Purchase conversion value
 Sessions
- Key events
- Total revenue
 Total contacts
- Total deals
- Deal closed won
- Deal amount won
Dimensions
- Date
- Session default channel group
- Session campaign
- Campaign
- Campaign
- Deal original source
- Deal stage
See all fields:Google Analytics 4 · 285 fieldsGoogle Ads · 1,042 fieldsMeta Ads · 1,378 fieldsHubSpot · 508 fields
What makes this marketing dashboard different
What you get that each ad platform, GA4 and HubSpot only show you one at a time.
See cost and won revenue on one row
Platform spend sits next to GA4 revenue and HubSpot deals, with no spreadsheet in between.
Ask why a channel slipped
See cost per lead jump, then ask Claude in the same chat which campaign or audience caused it.
Check platform claims against the CRM
Platform conversions sit beside HubSpot won deals, so double-counted sales stand out.
Add a channel when you add an account
Connect TikTok Ads in Porter and ask Claude to add it to every table.
Send the weekly report on your logo
Publish it in Porter and email it to your team or client on the day you choose.
Share it without platform logins
Anyone with the Porter link sees the numbers, without seats in your ad accounts or HubSpot.
What the dashboard includes
- Ten KPI cards across ad platforms, GA4 and HubSpot
- Daily ad spend and key events
- Channels from spend to revenue
- Campaigns across every ad platform
- Leads and a paid funnel to won deals
- Won deals by source and ROAS per platform
Related dashboard templates
 Claude

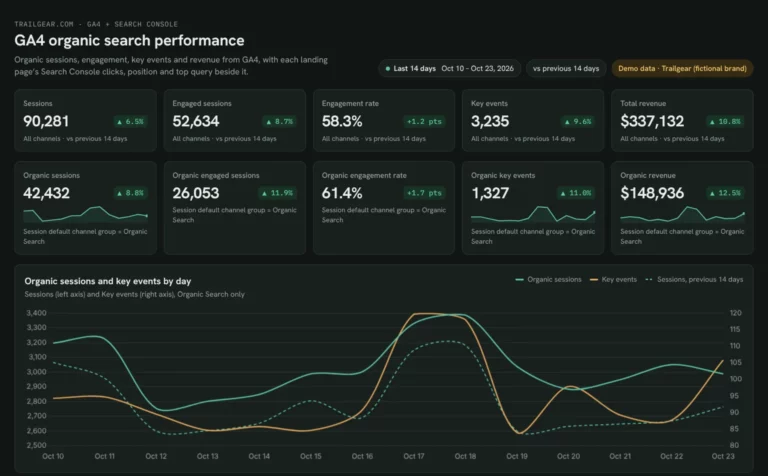
GA4 SEO dashboard template
See which landing pages bring organic sessions and key events.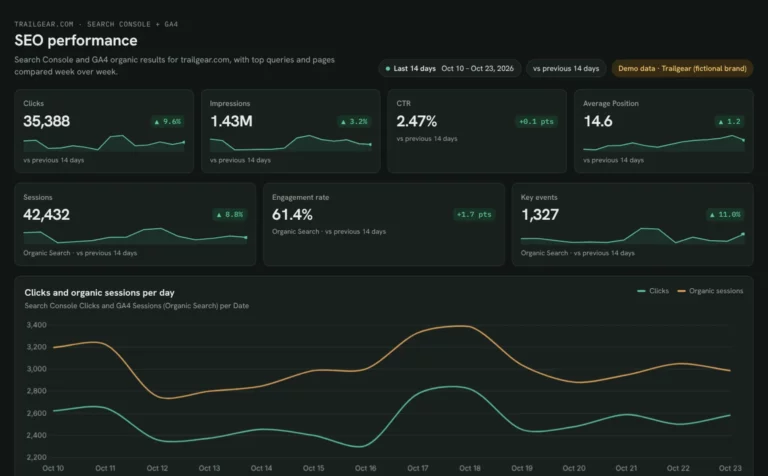 Claude
SEO dashboard template
See which Search Console clicks turn into GA4 sessions and key events.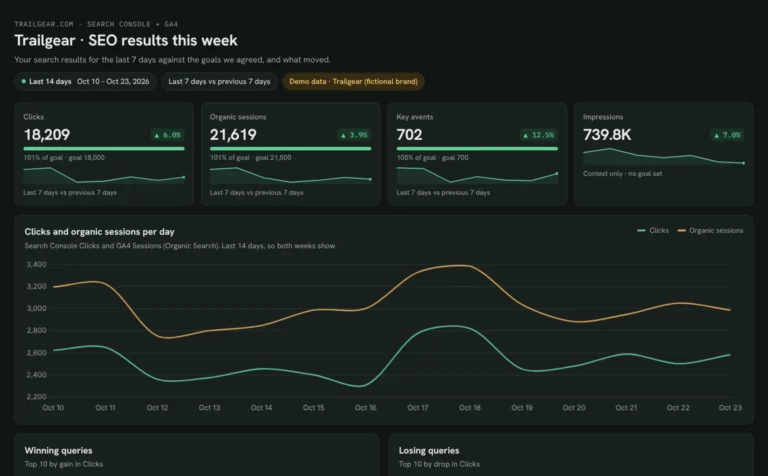 Claude
Client SEO dashboard template
Report clicks, sessions and key events against each client’s goals.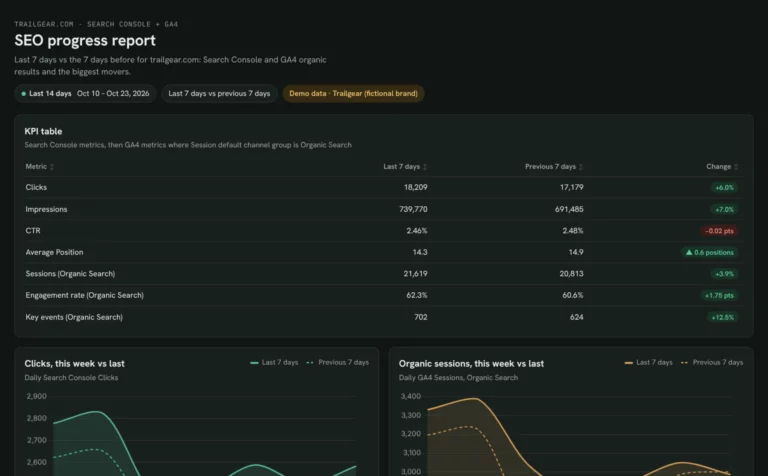 Claude
Monthly SEO dashboard template
Show month-on-month SEO results and the pages that moved them.Browse more Claude dashboard templates
By data source
GA4Google Analytics dashboardROAS dashboardSEO marketing dashboardGA4 SEO dashboardSEO dashboard
Google AdsGoogle Ads dashboardPPC dashboardSEM dashboard
Meta AdsMeta Ads dashboard
By use case: Marketing overview
Marketing KPI dashboardExecutive dashboardCross-channel marketing dashboard
 Data Studio
 Google Sheets
 ChatGPT
Get your free marketing dashboard
Sign up free, connect your ad accounts, GA4 and HubSpot, and paste the prompt. Your own data fills the same layout as the demo.
Free plan · 14-day trial · No card needed