

Browse 28 Acquisition Report Templates for Data Studio
Choose from our library of free, white-label acquisition templates. Each template tracks the full marketing funnel: visibility (impressions, reach), engagement (CTR, interactions), and conversion (leads, revenue). Organized following the SUMAS framework with breakdowns by channel, campaign, audience, and time period.
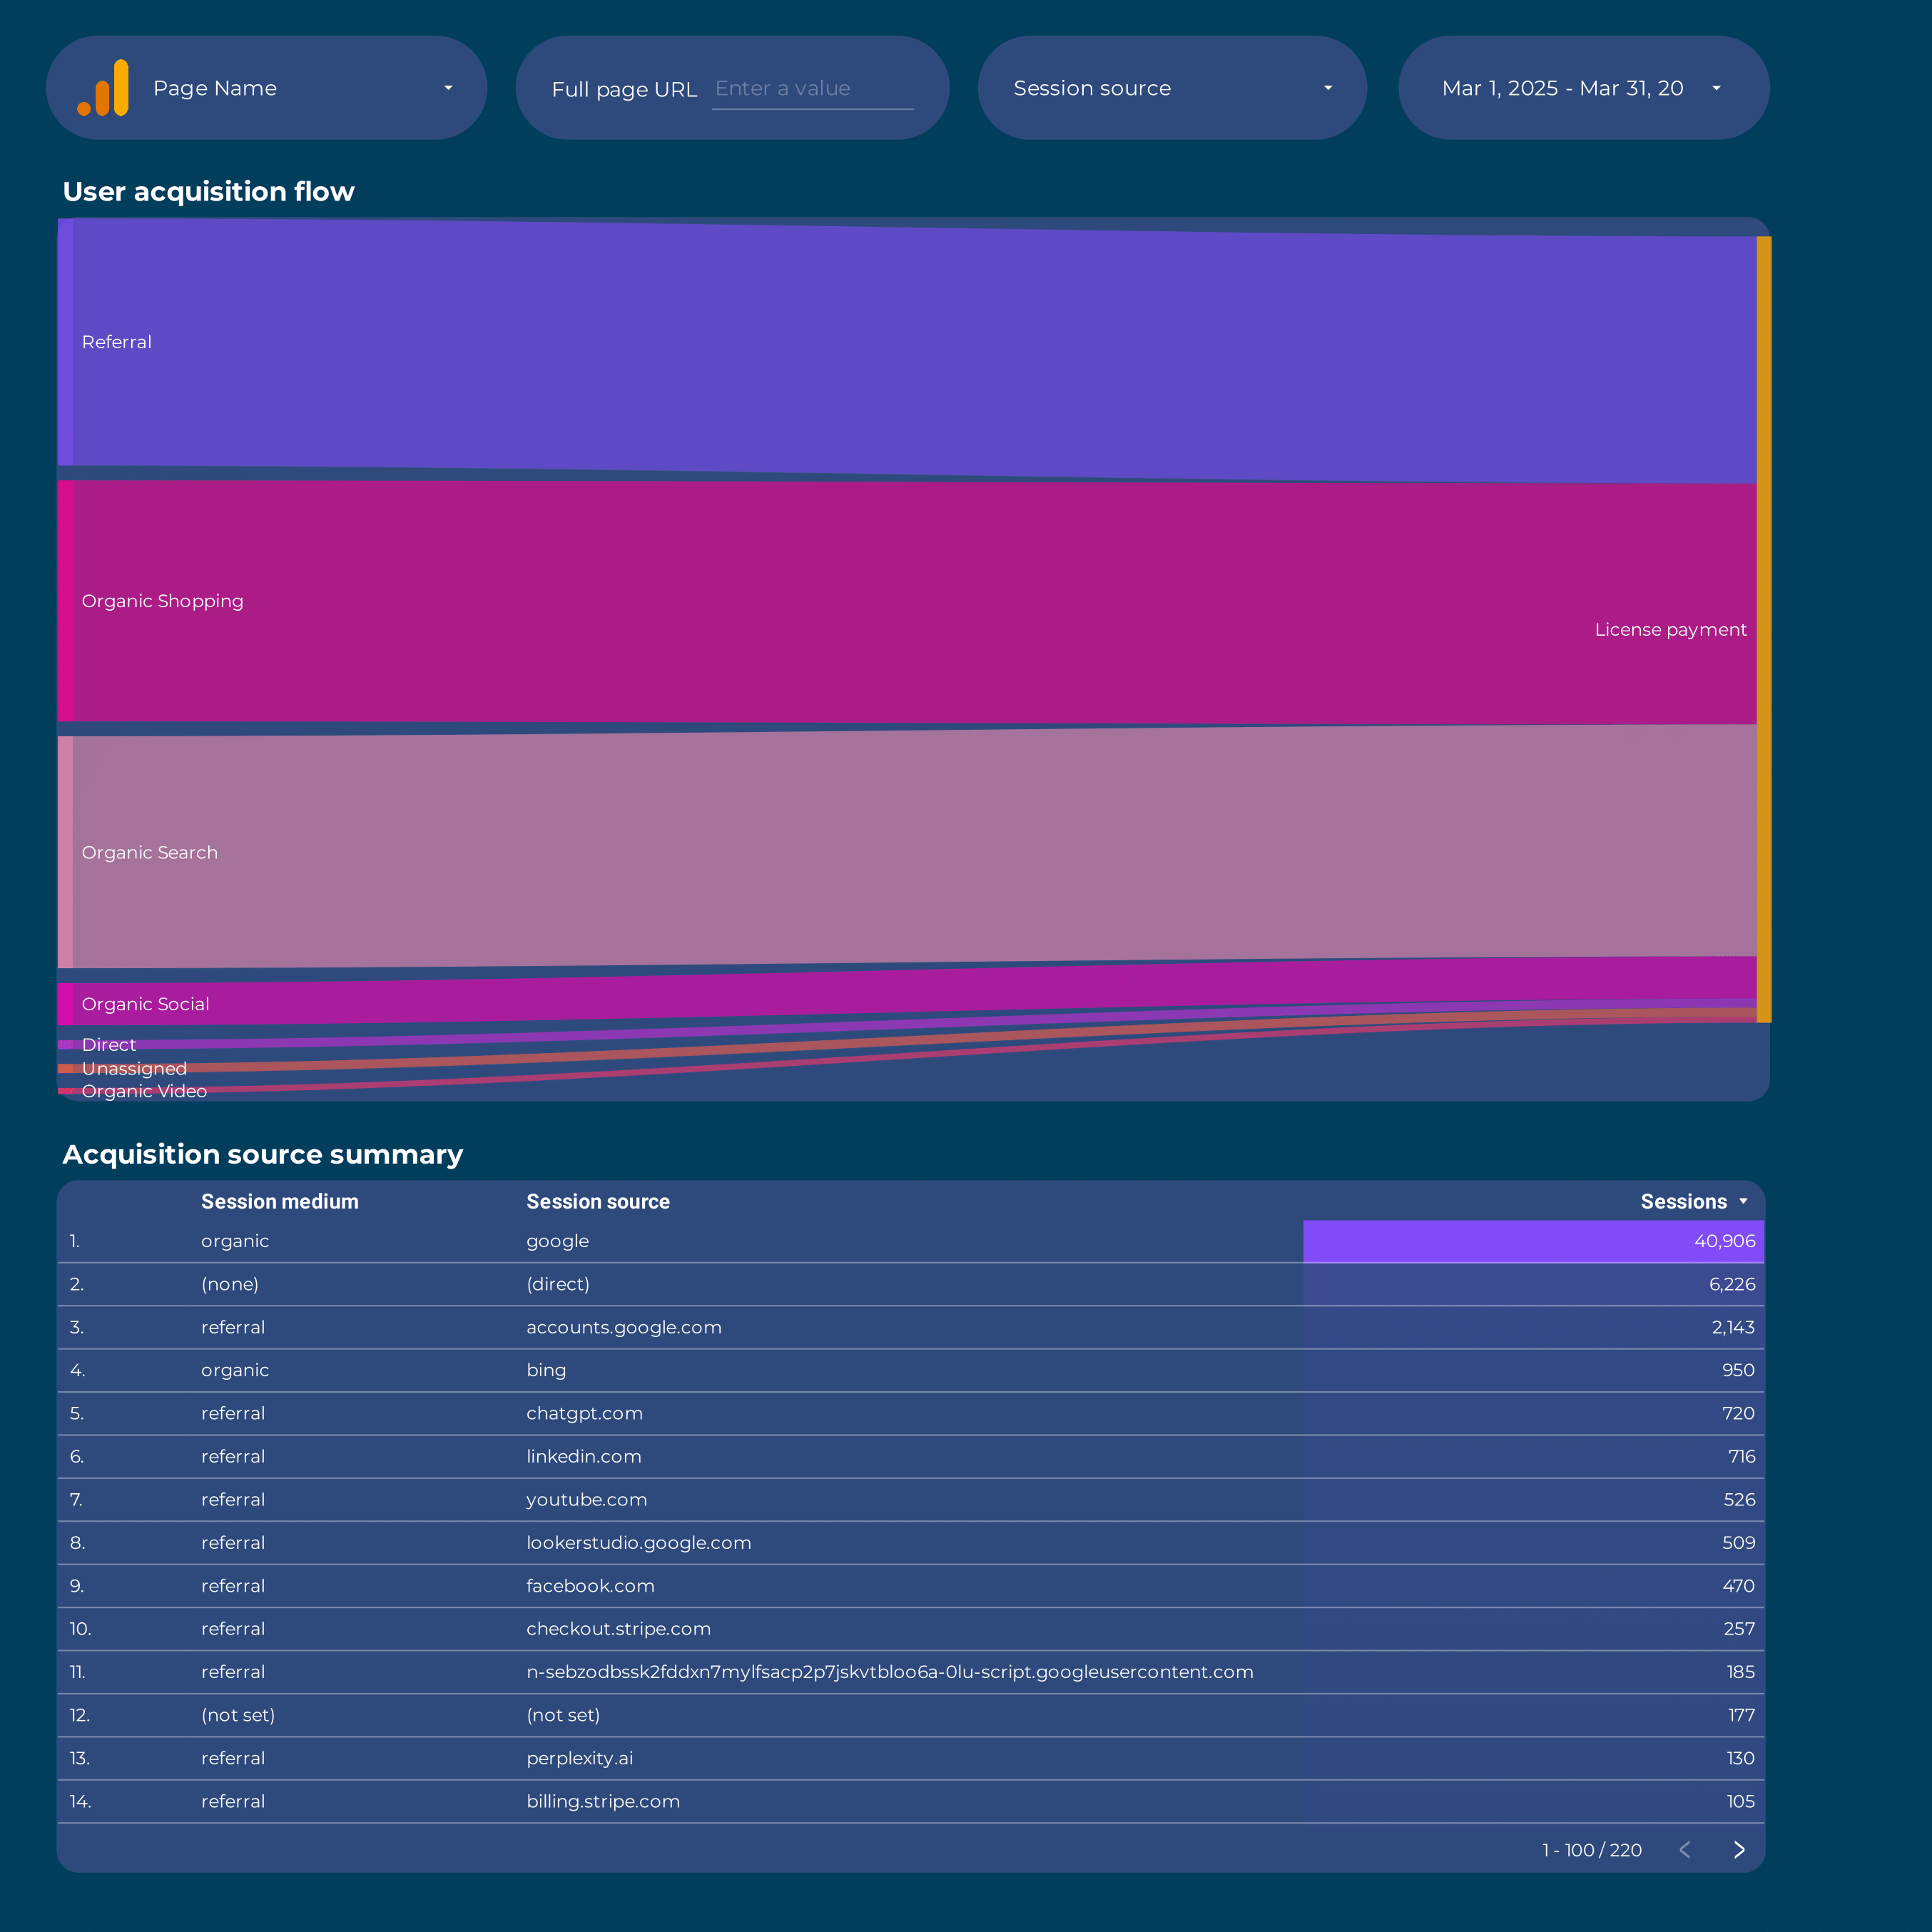
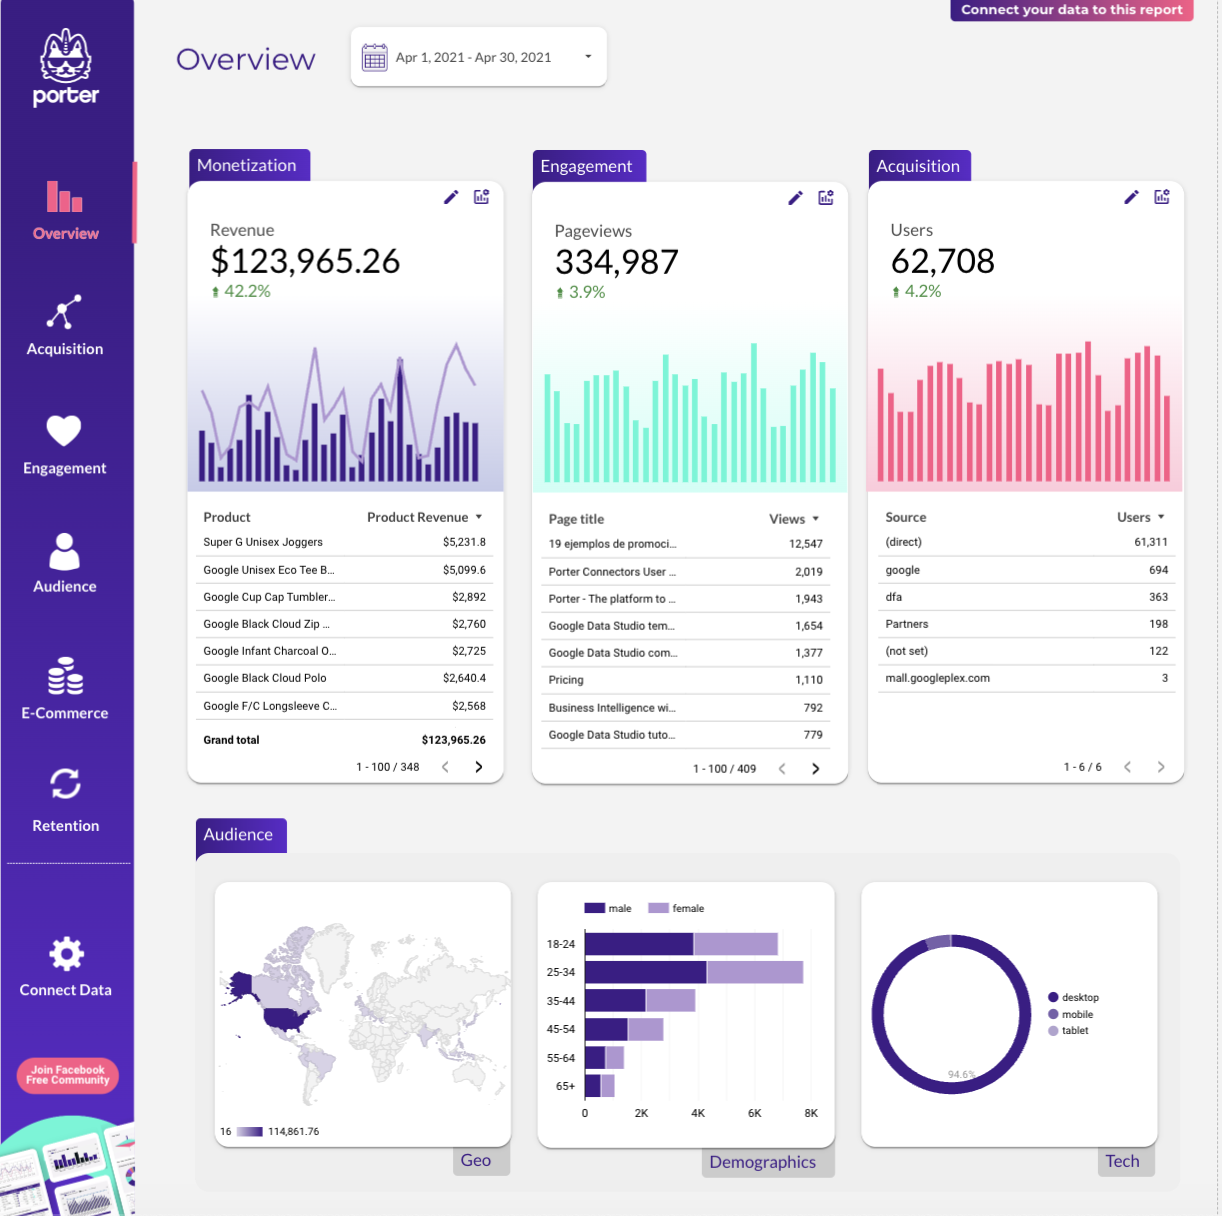
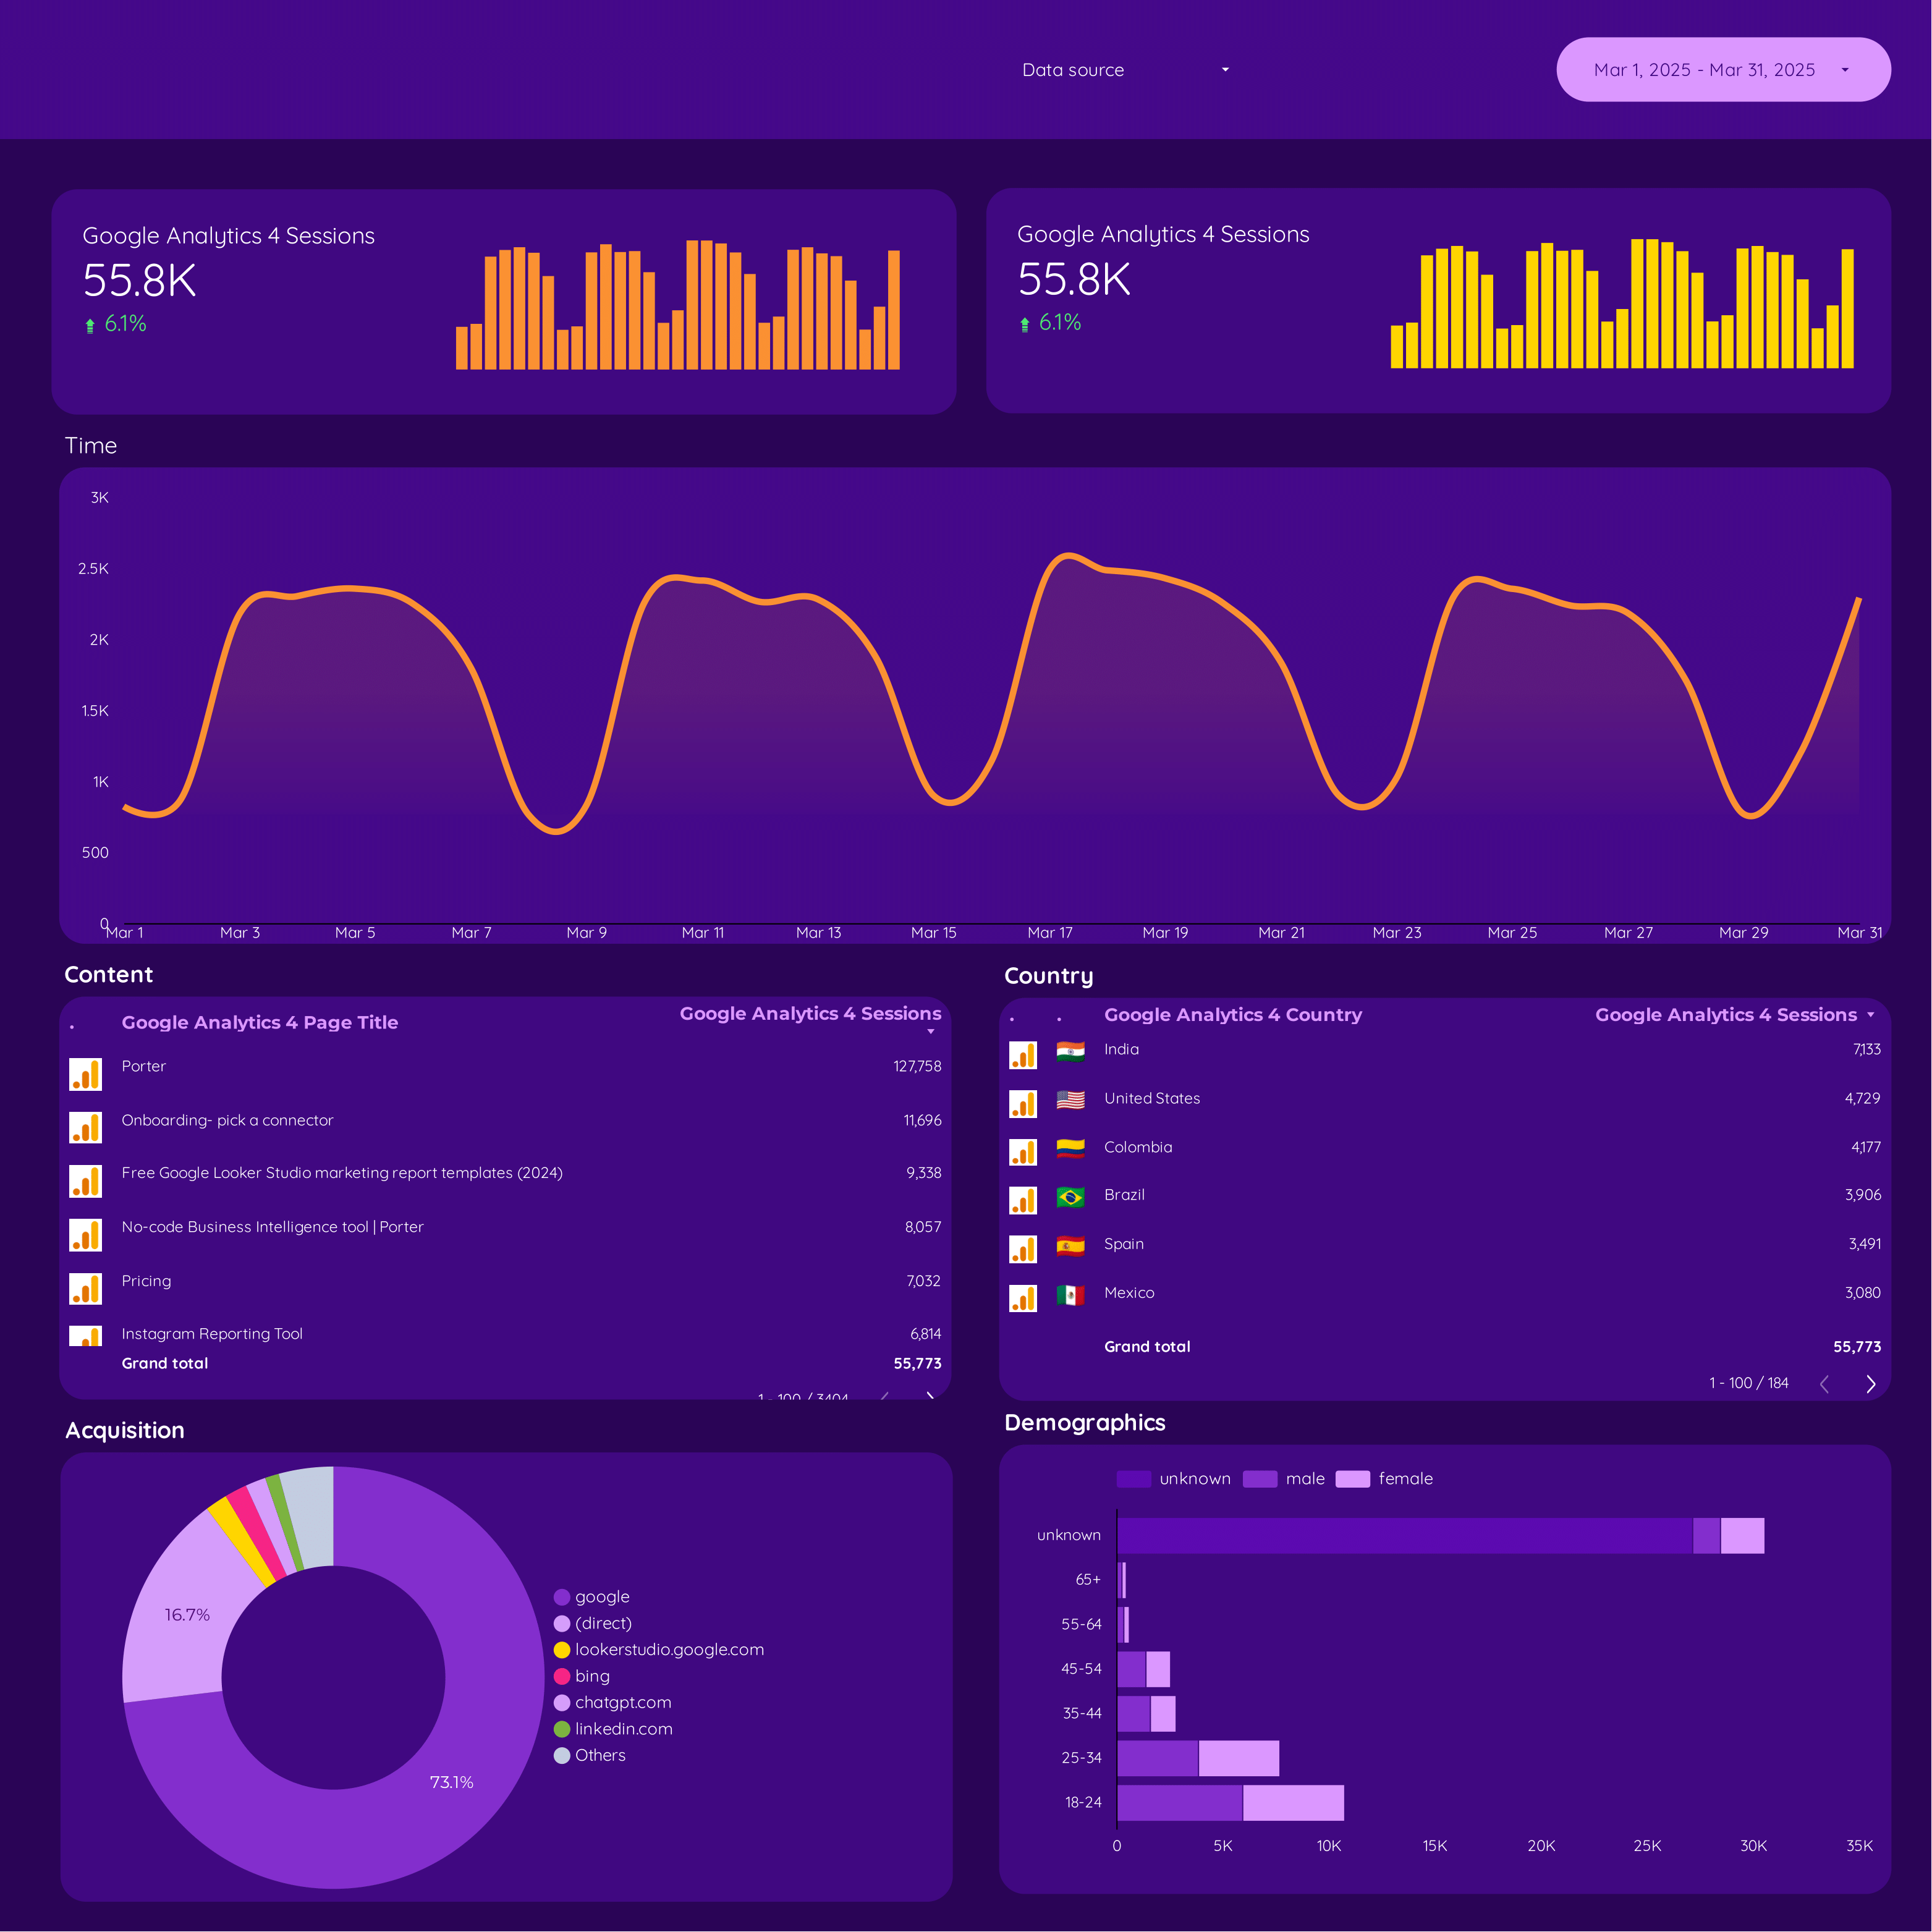
Google Analytics 4 acquisition Report template for Data Studio by Porter
Track sessions, new users by source → engagement rate, events/session → conversions by channel, revenue. Segment by source/medium, campaign, landing page.
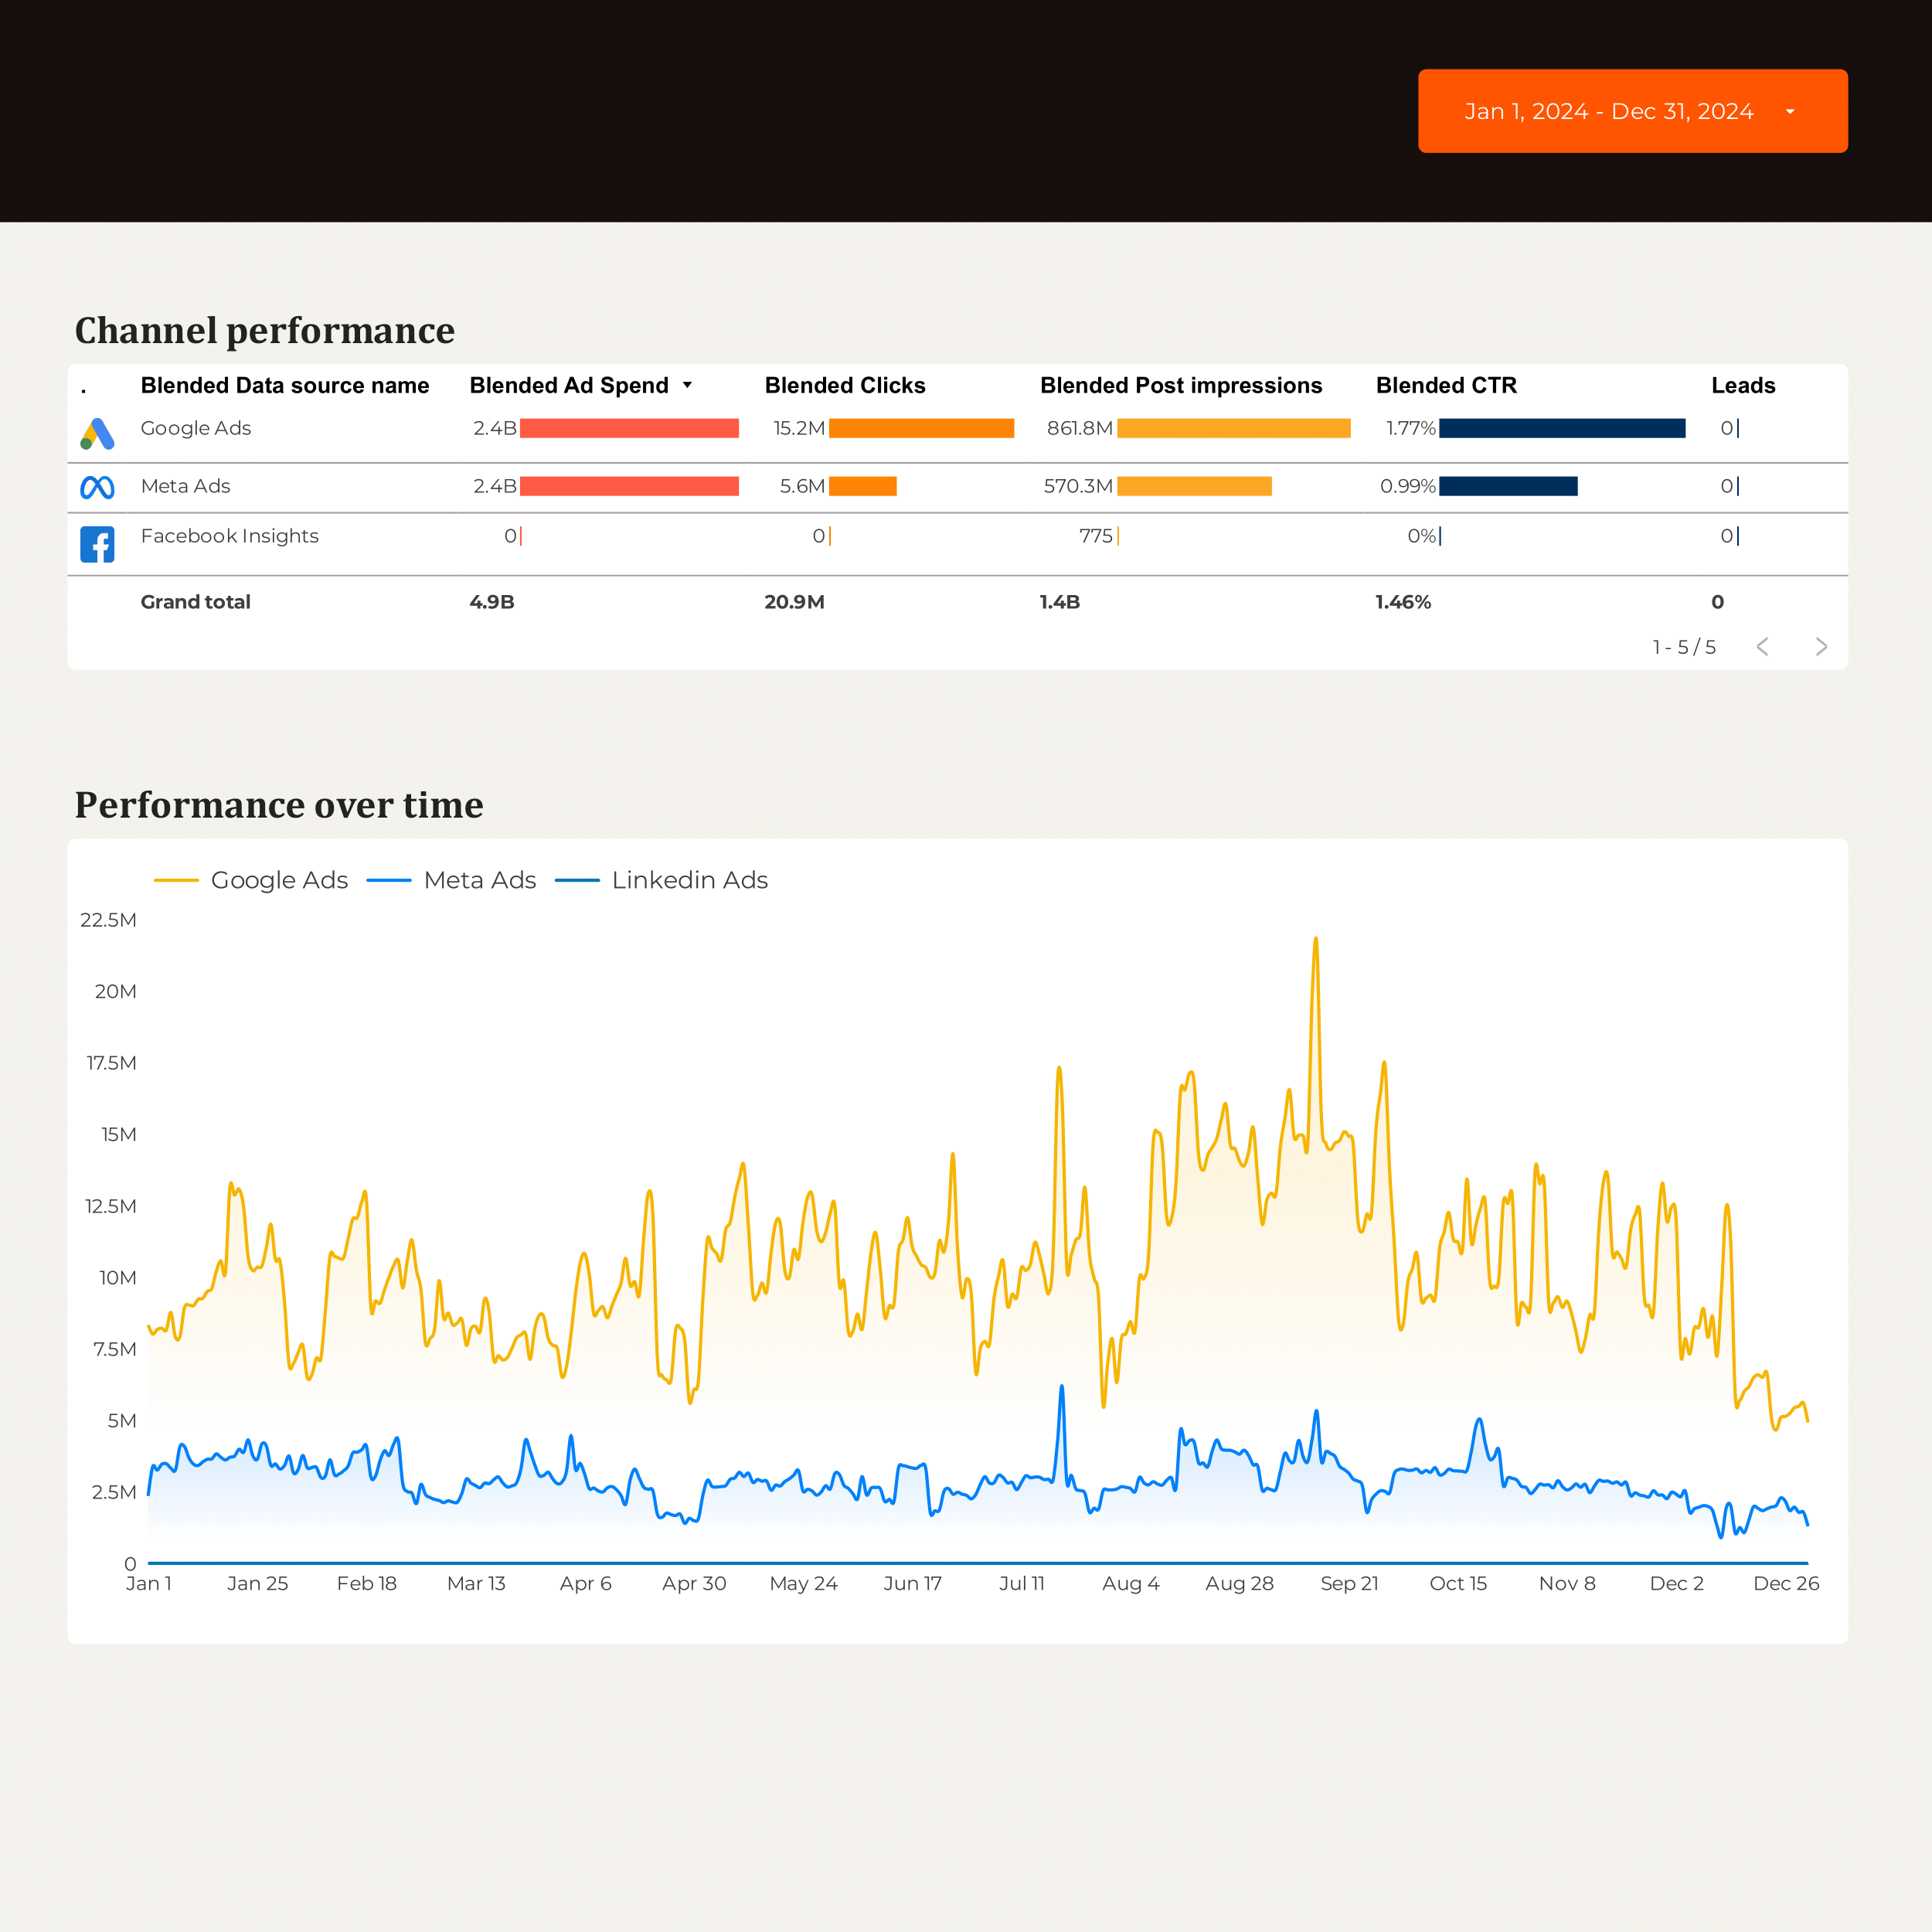
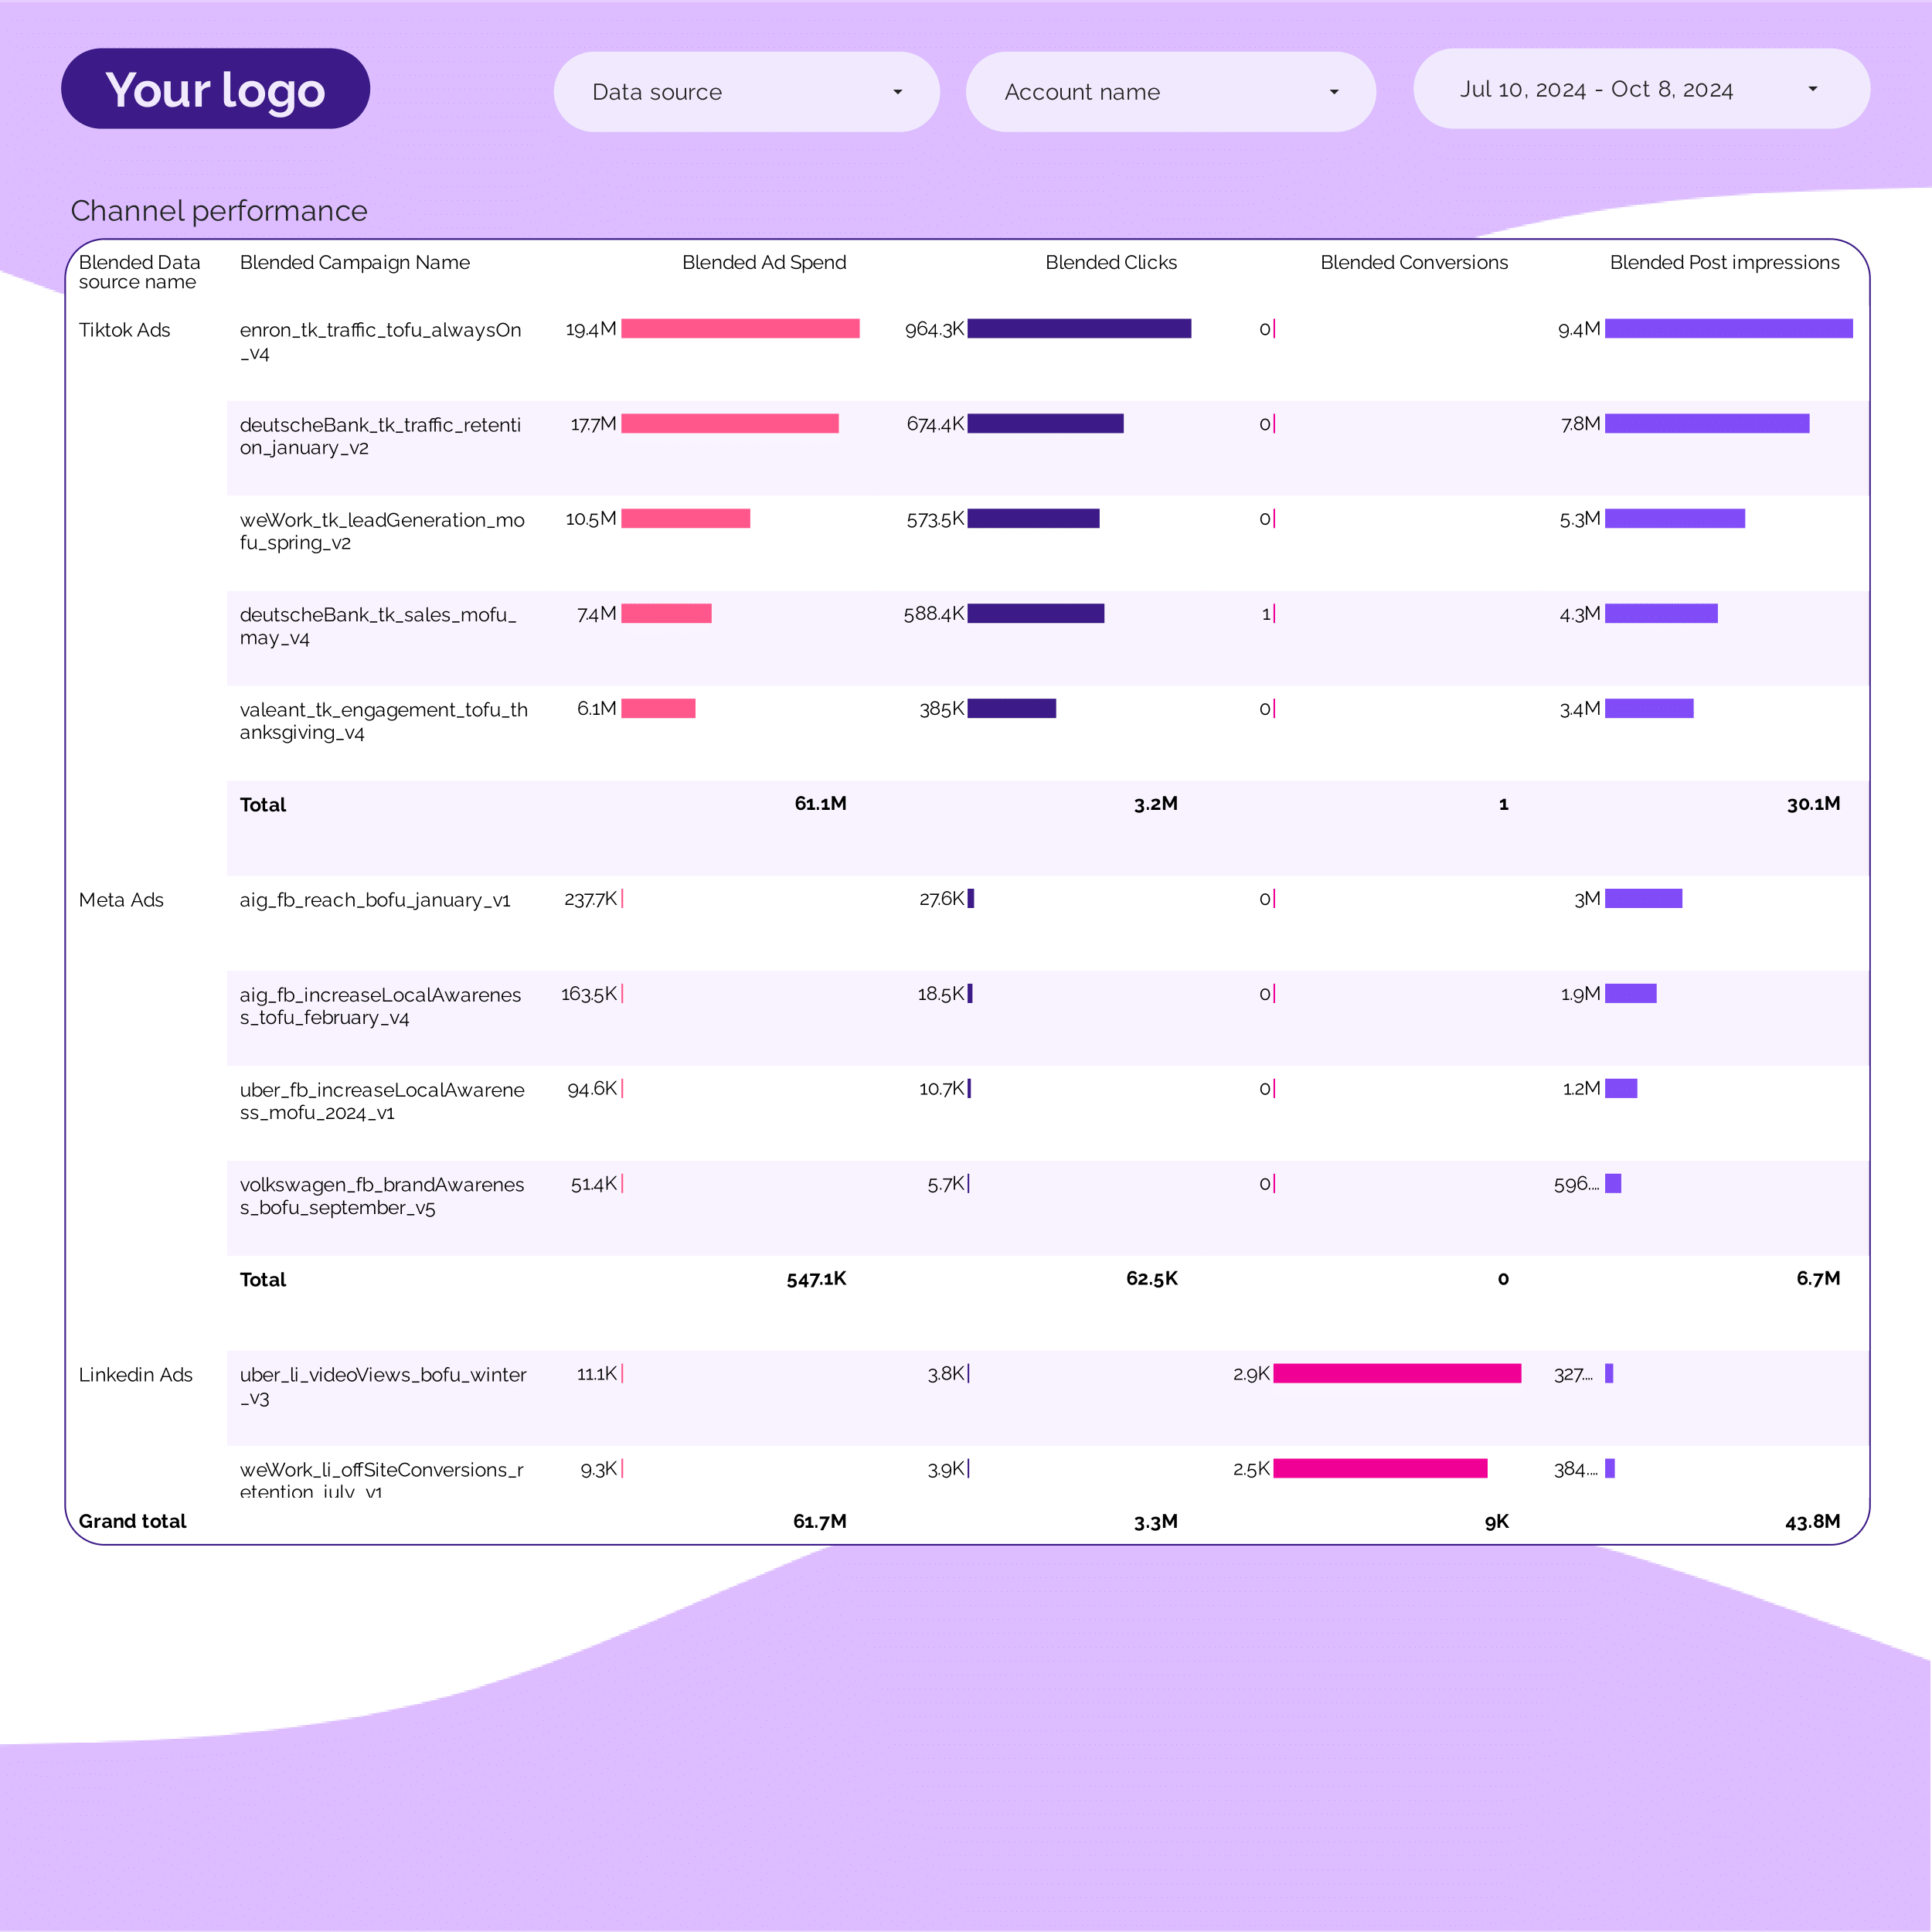
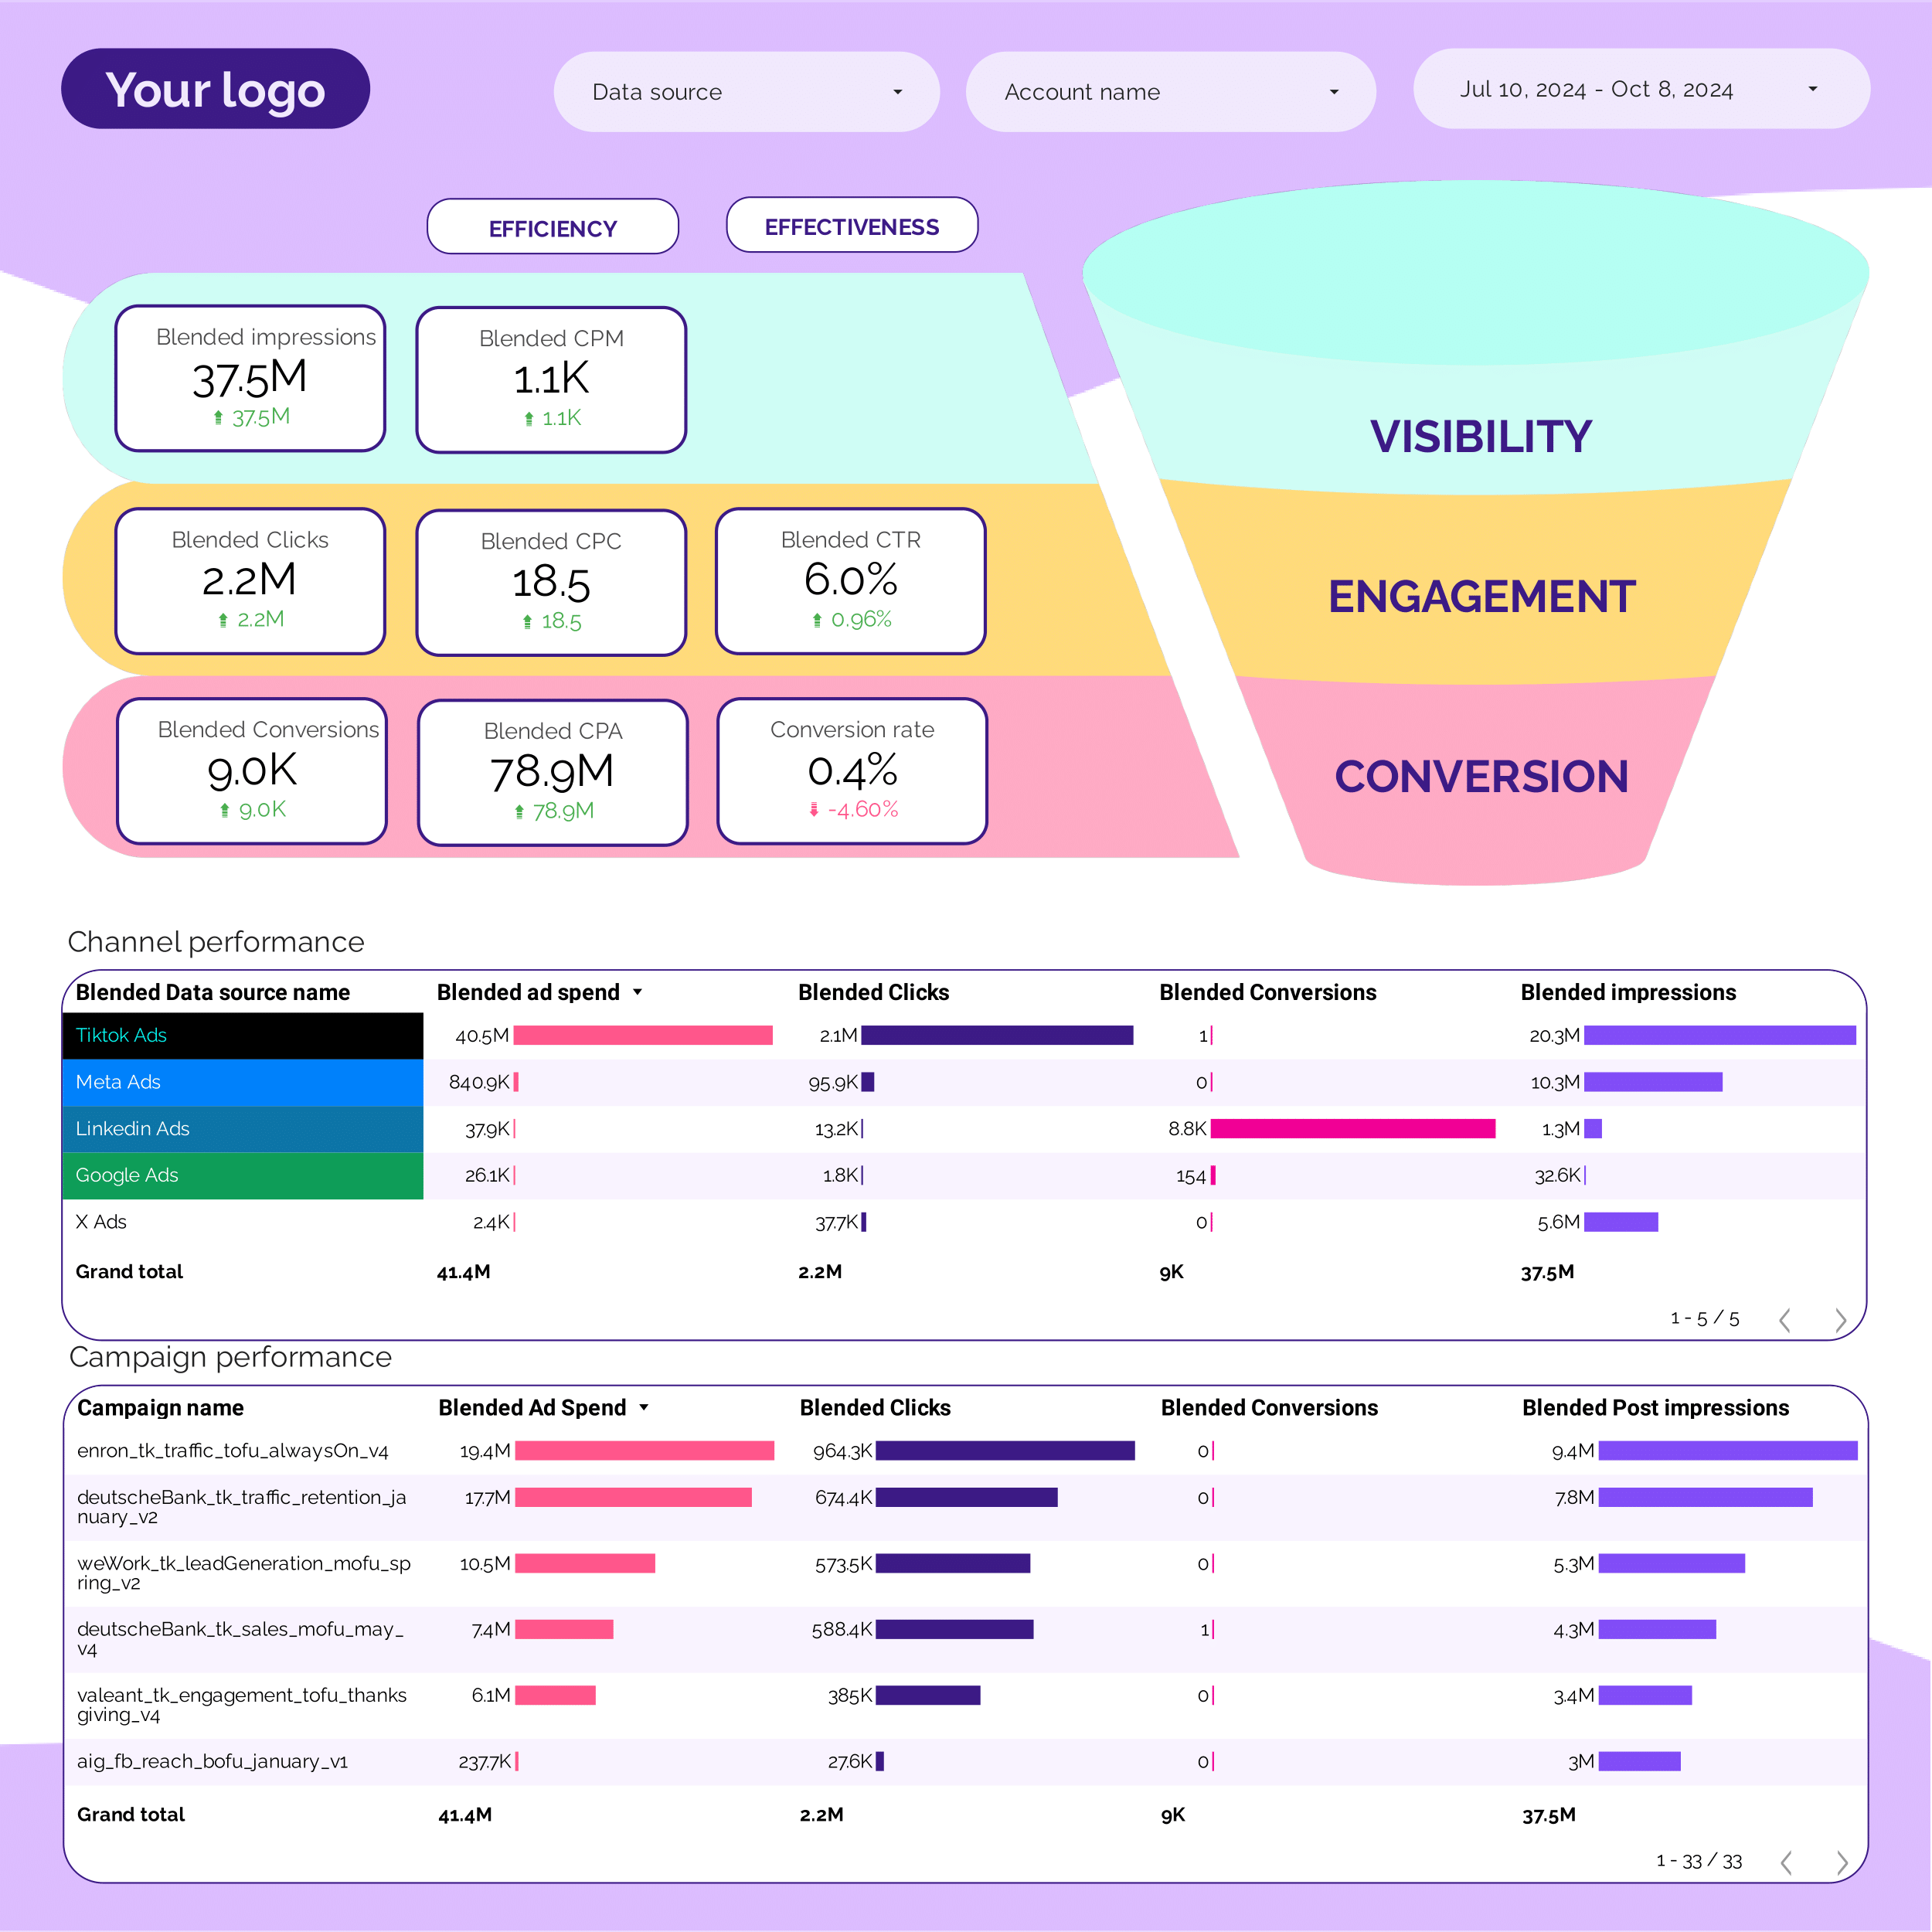
Multi-channel Marketing performance Report template for Data Studio by Porter
Track impressions across channels → CTR by channel, engagement rate → cross-channel conversions, ROI. Segment by channel, campaign, date.
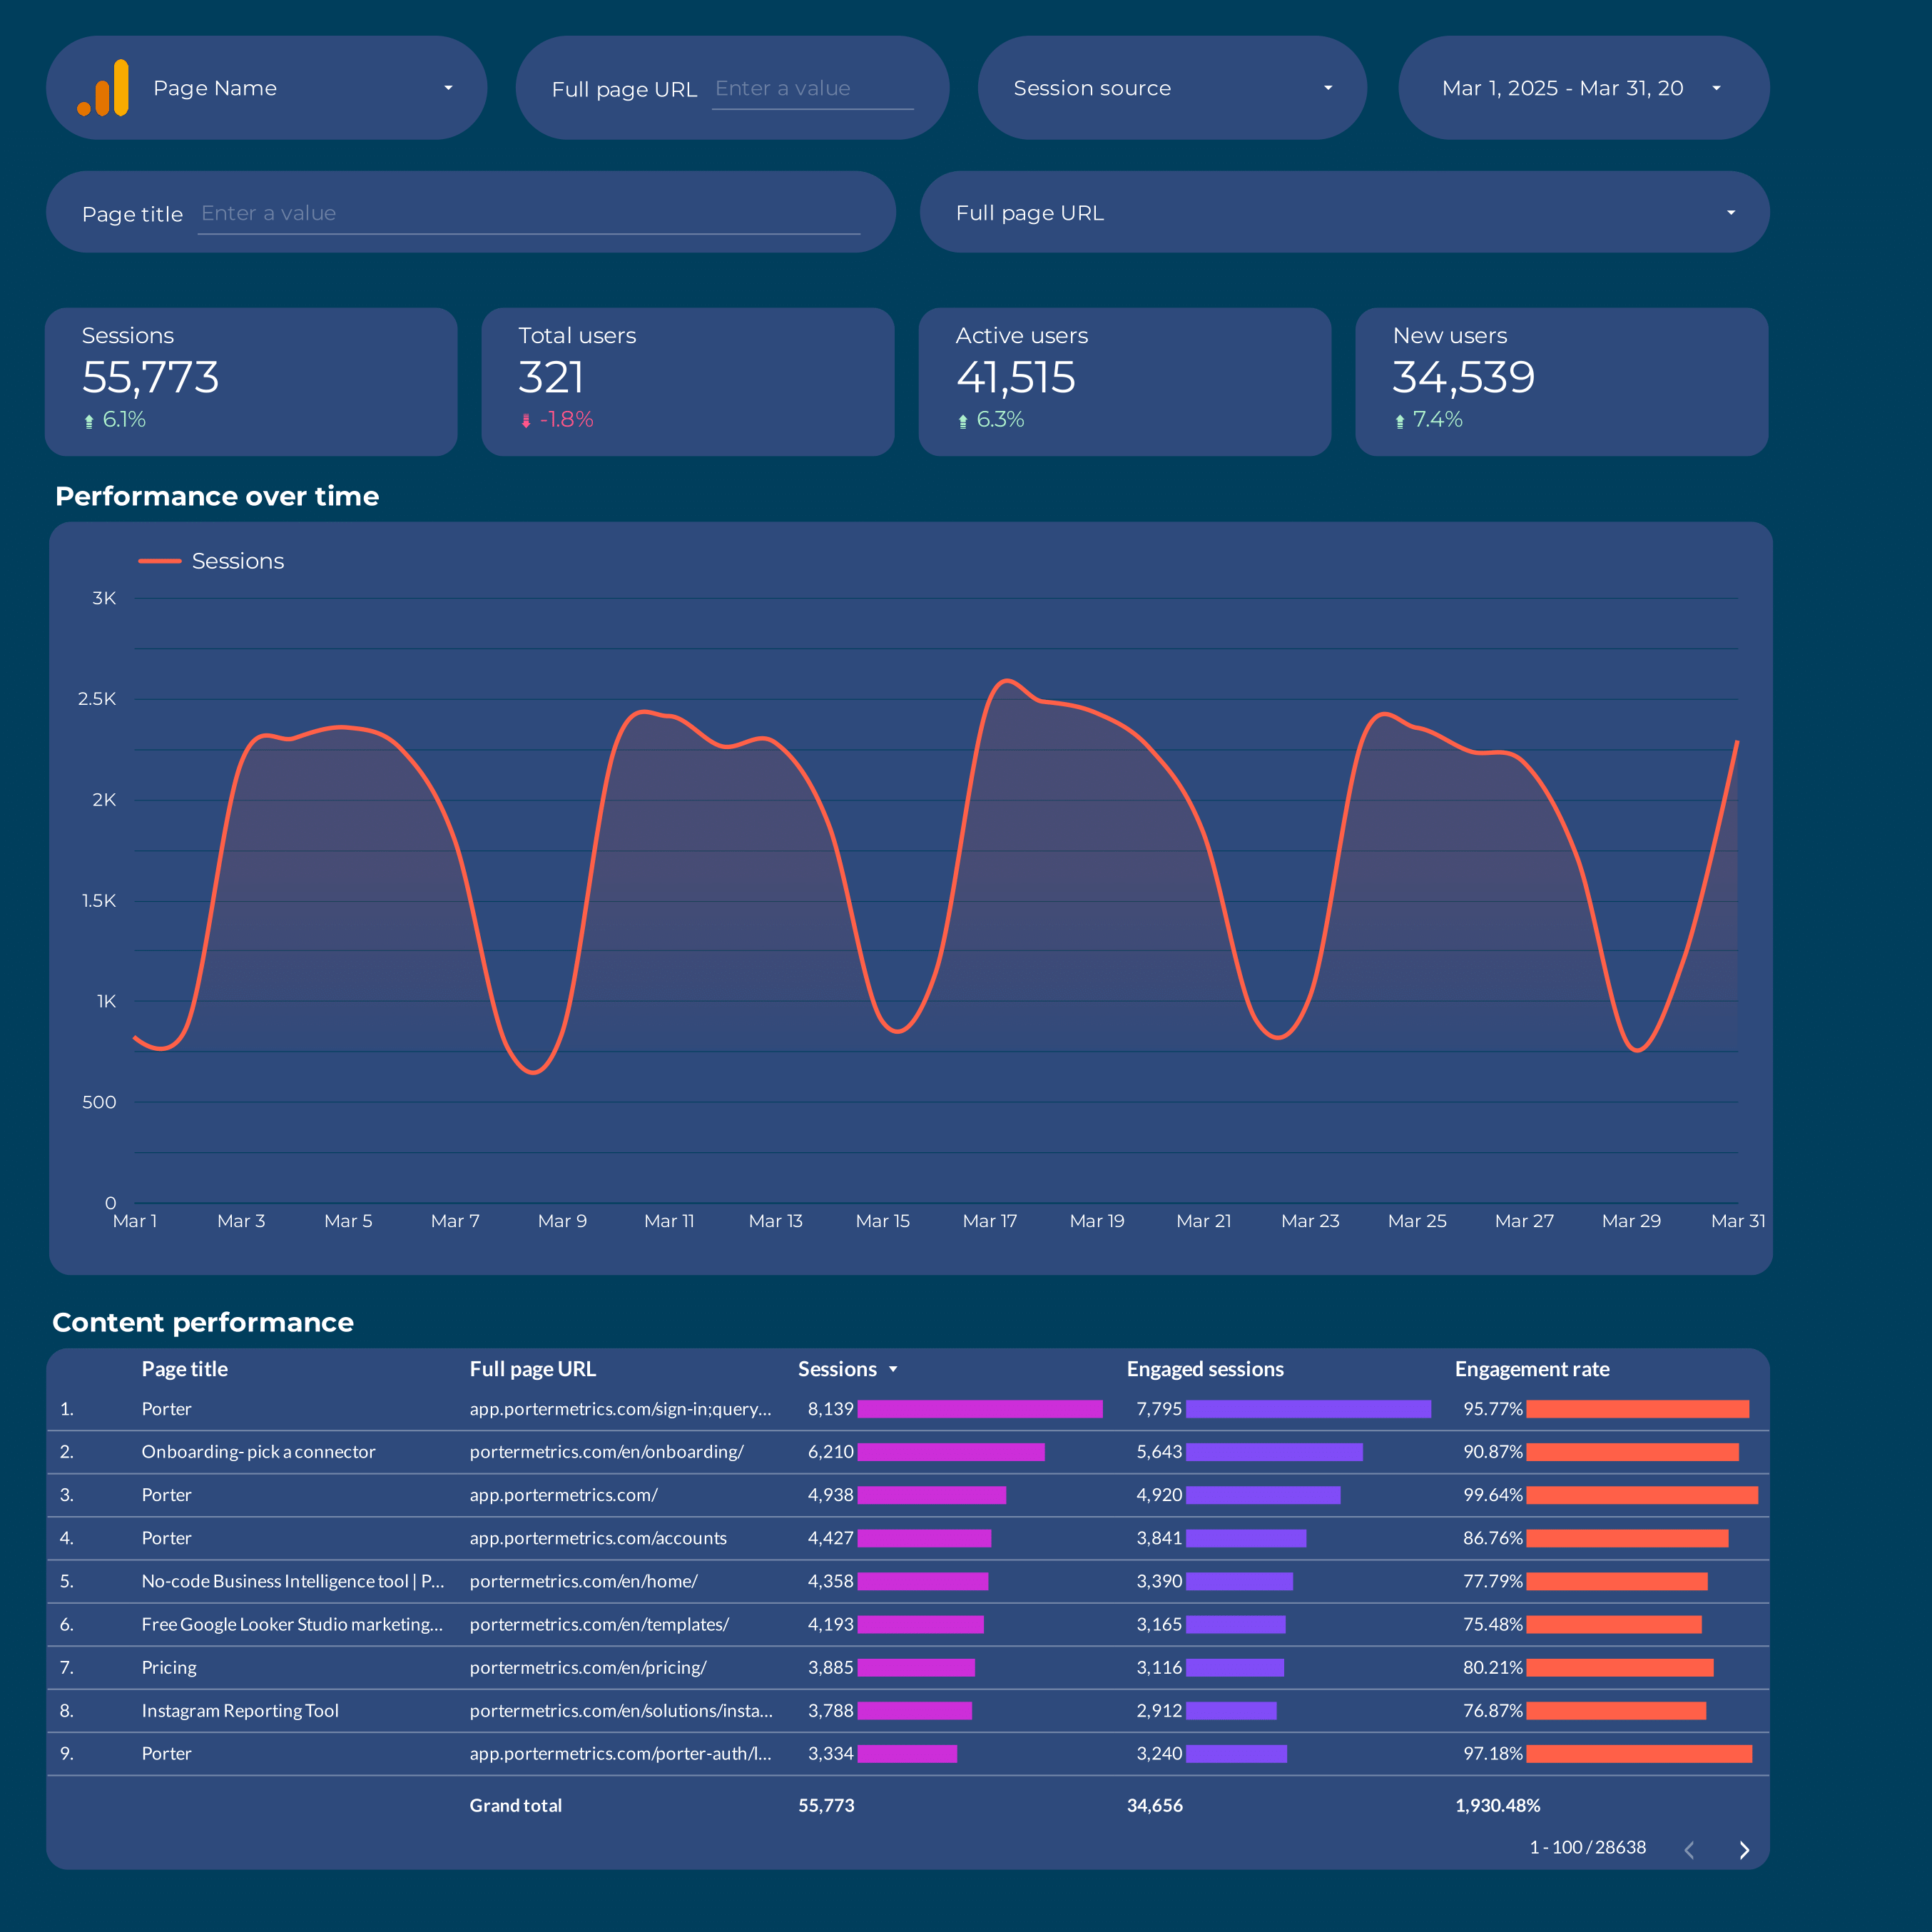
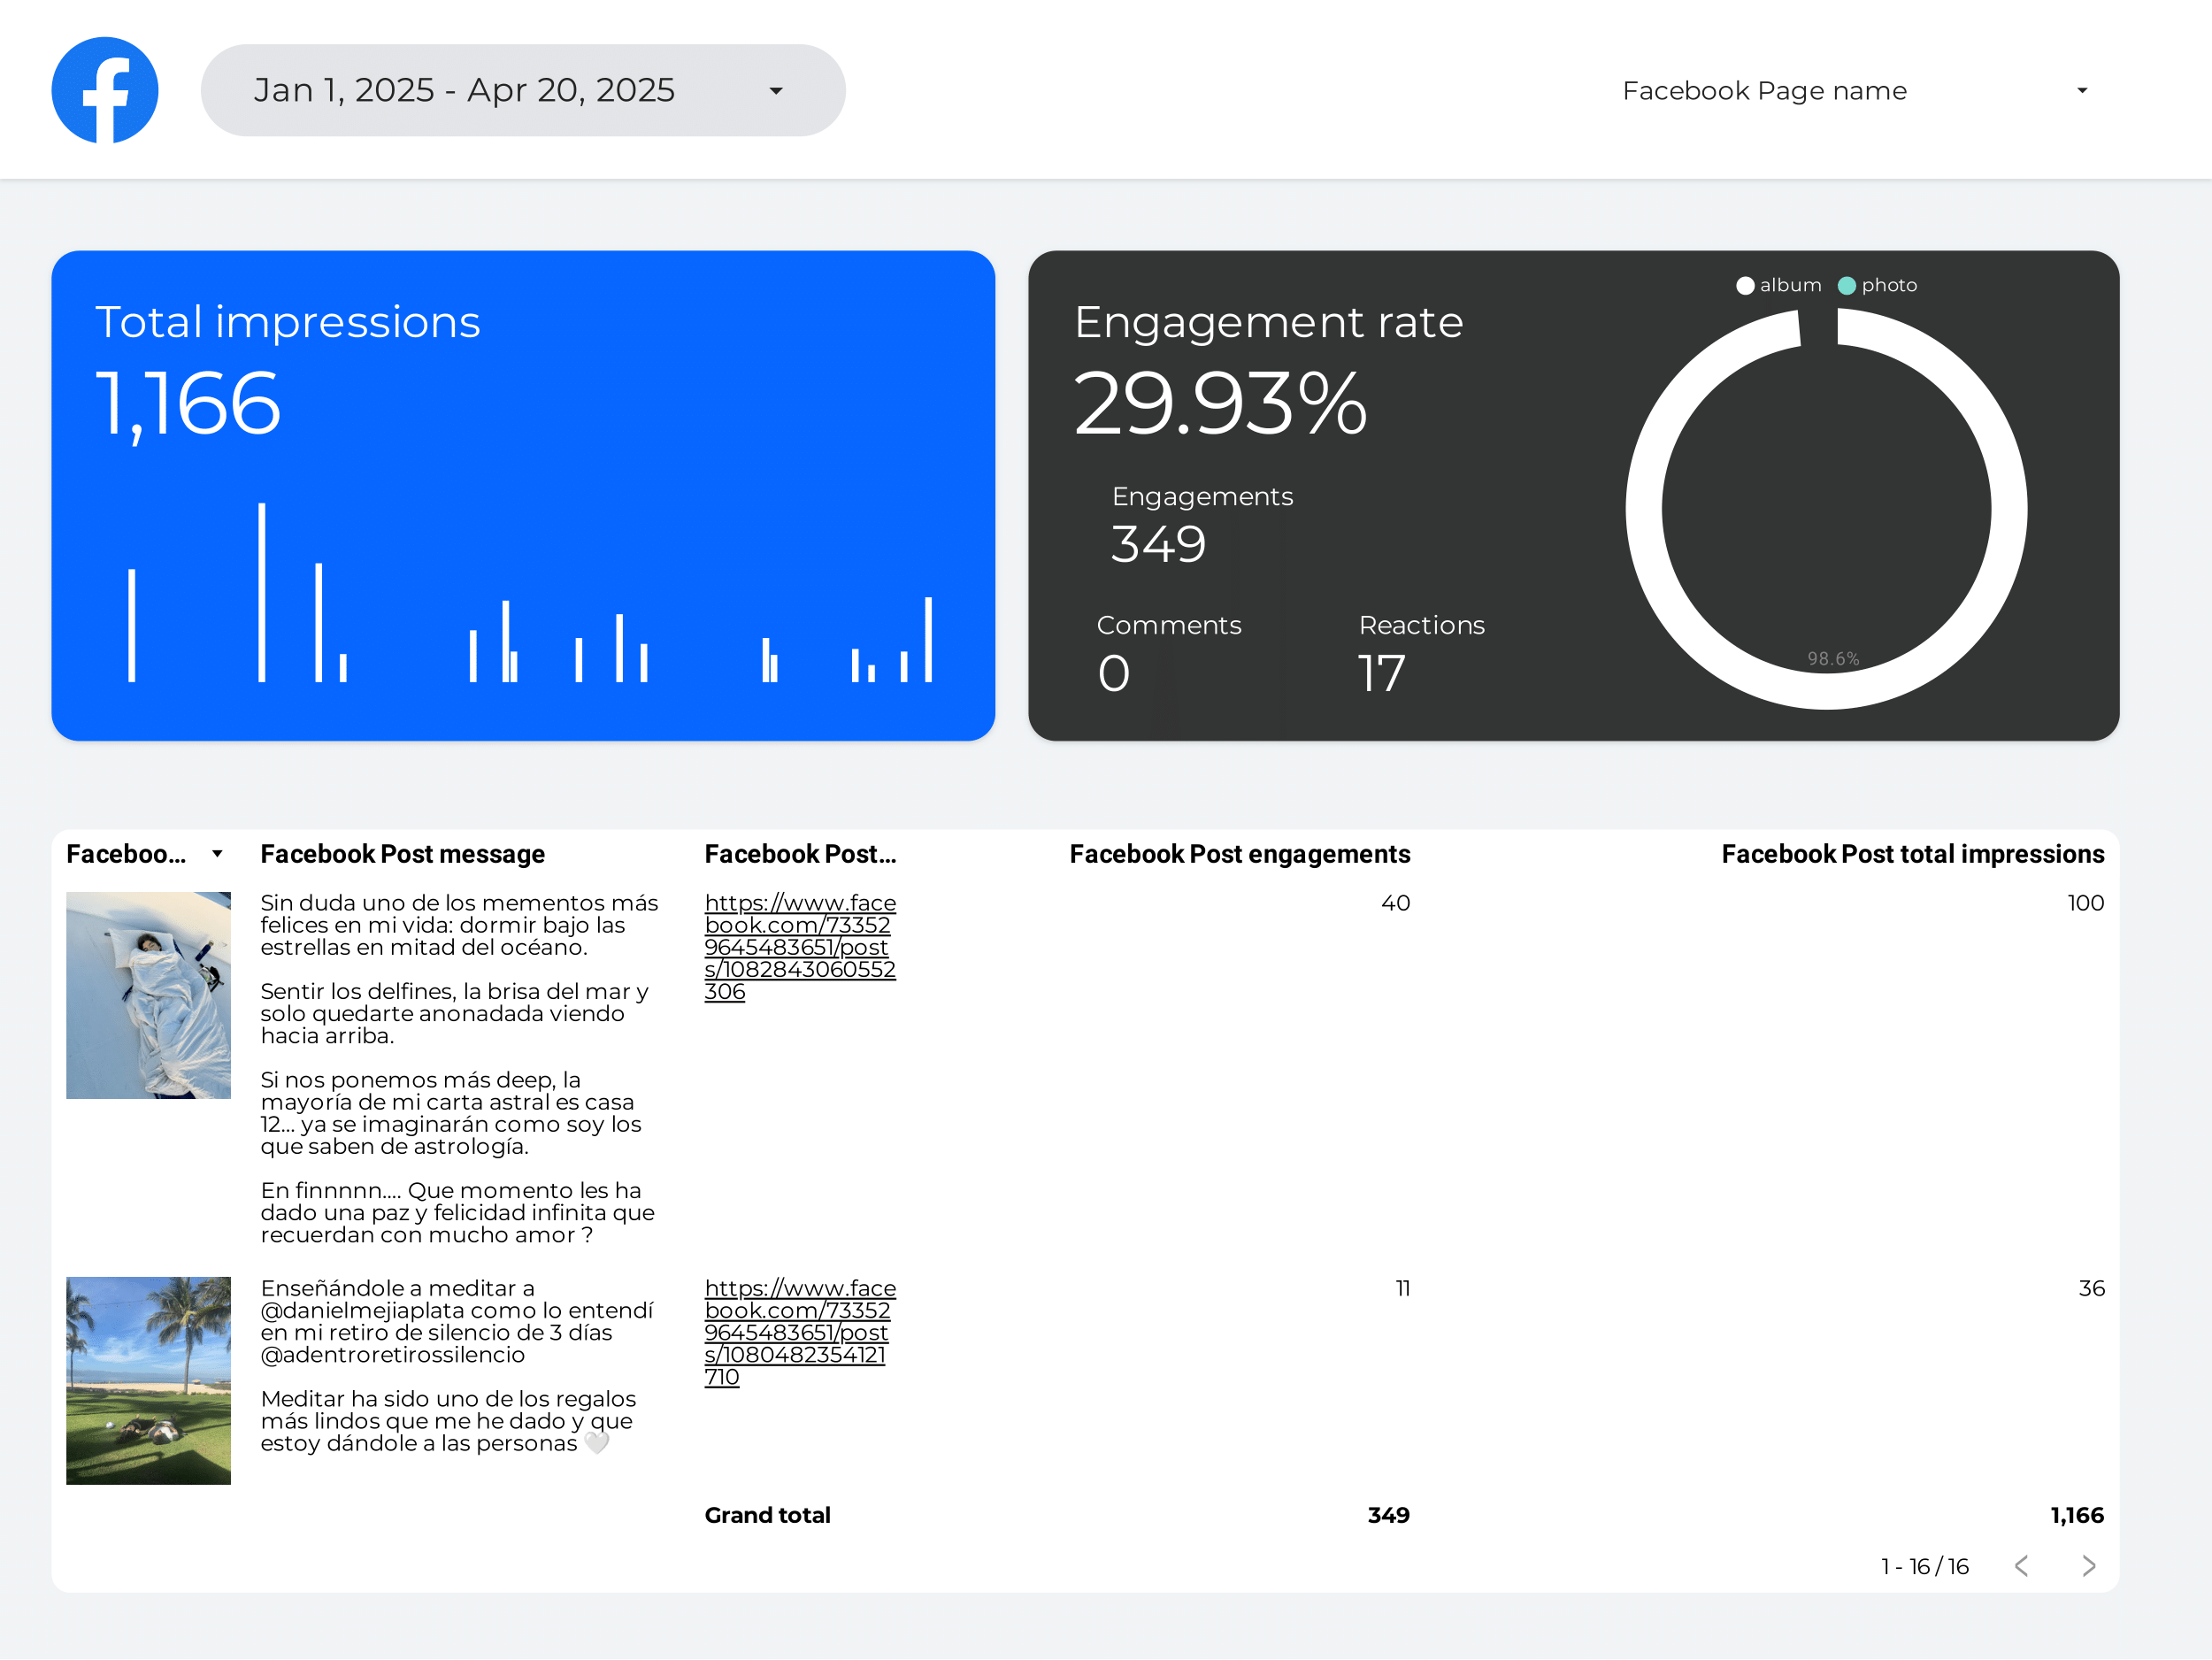
Content marketing Report template for Data Studio by Porter
Track page views, organic impressions → time on page, scroll depth, shares → content conversions, lead captures. Segment by content type, topic, channel.
Google Analytics 4 Attribution Report template for Data Studio by Porter
Track touchpoints, assisted interactions → path length, time to conversion → attributed conversions by model. Segment by channel, model type.
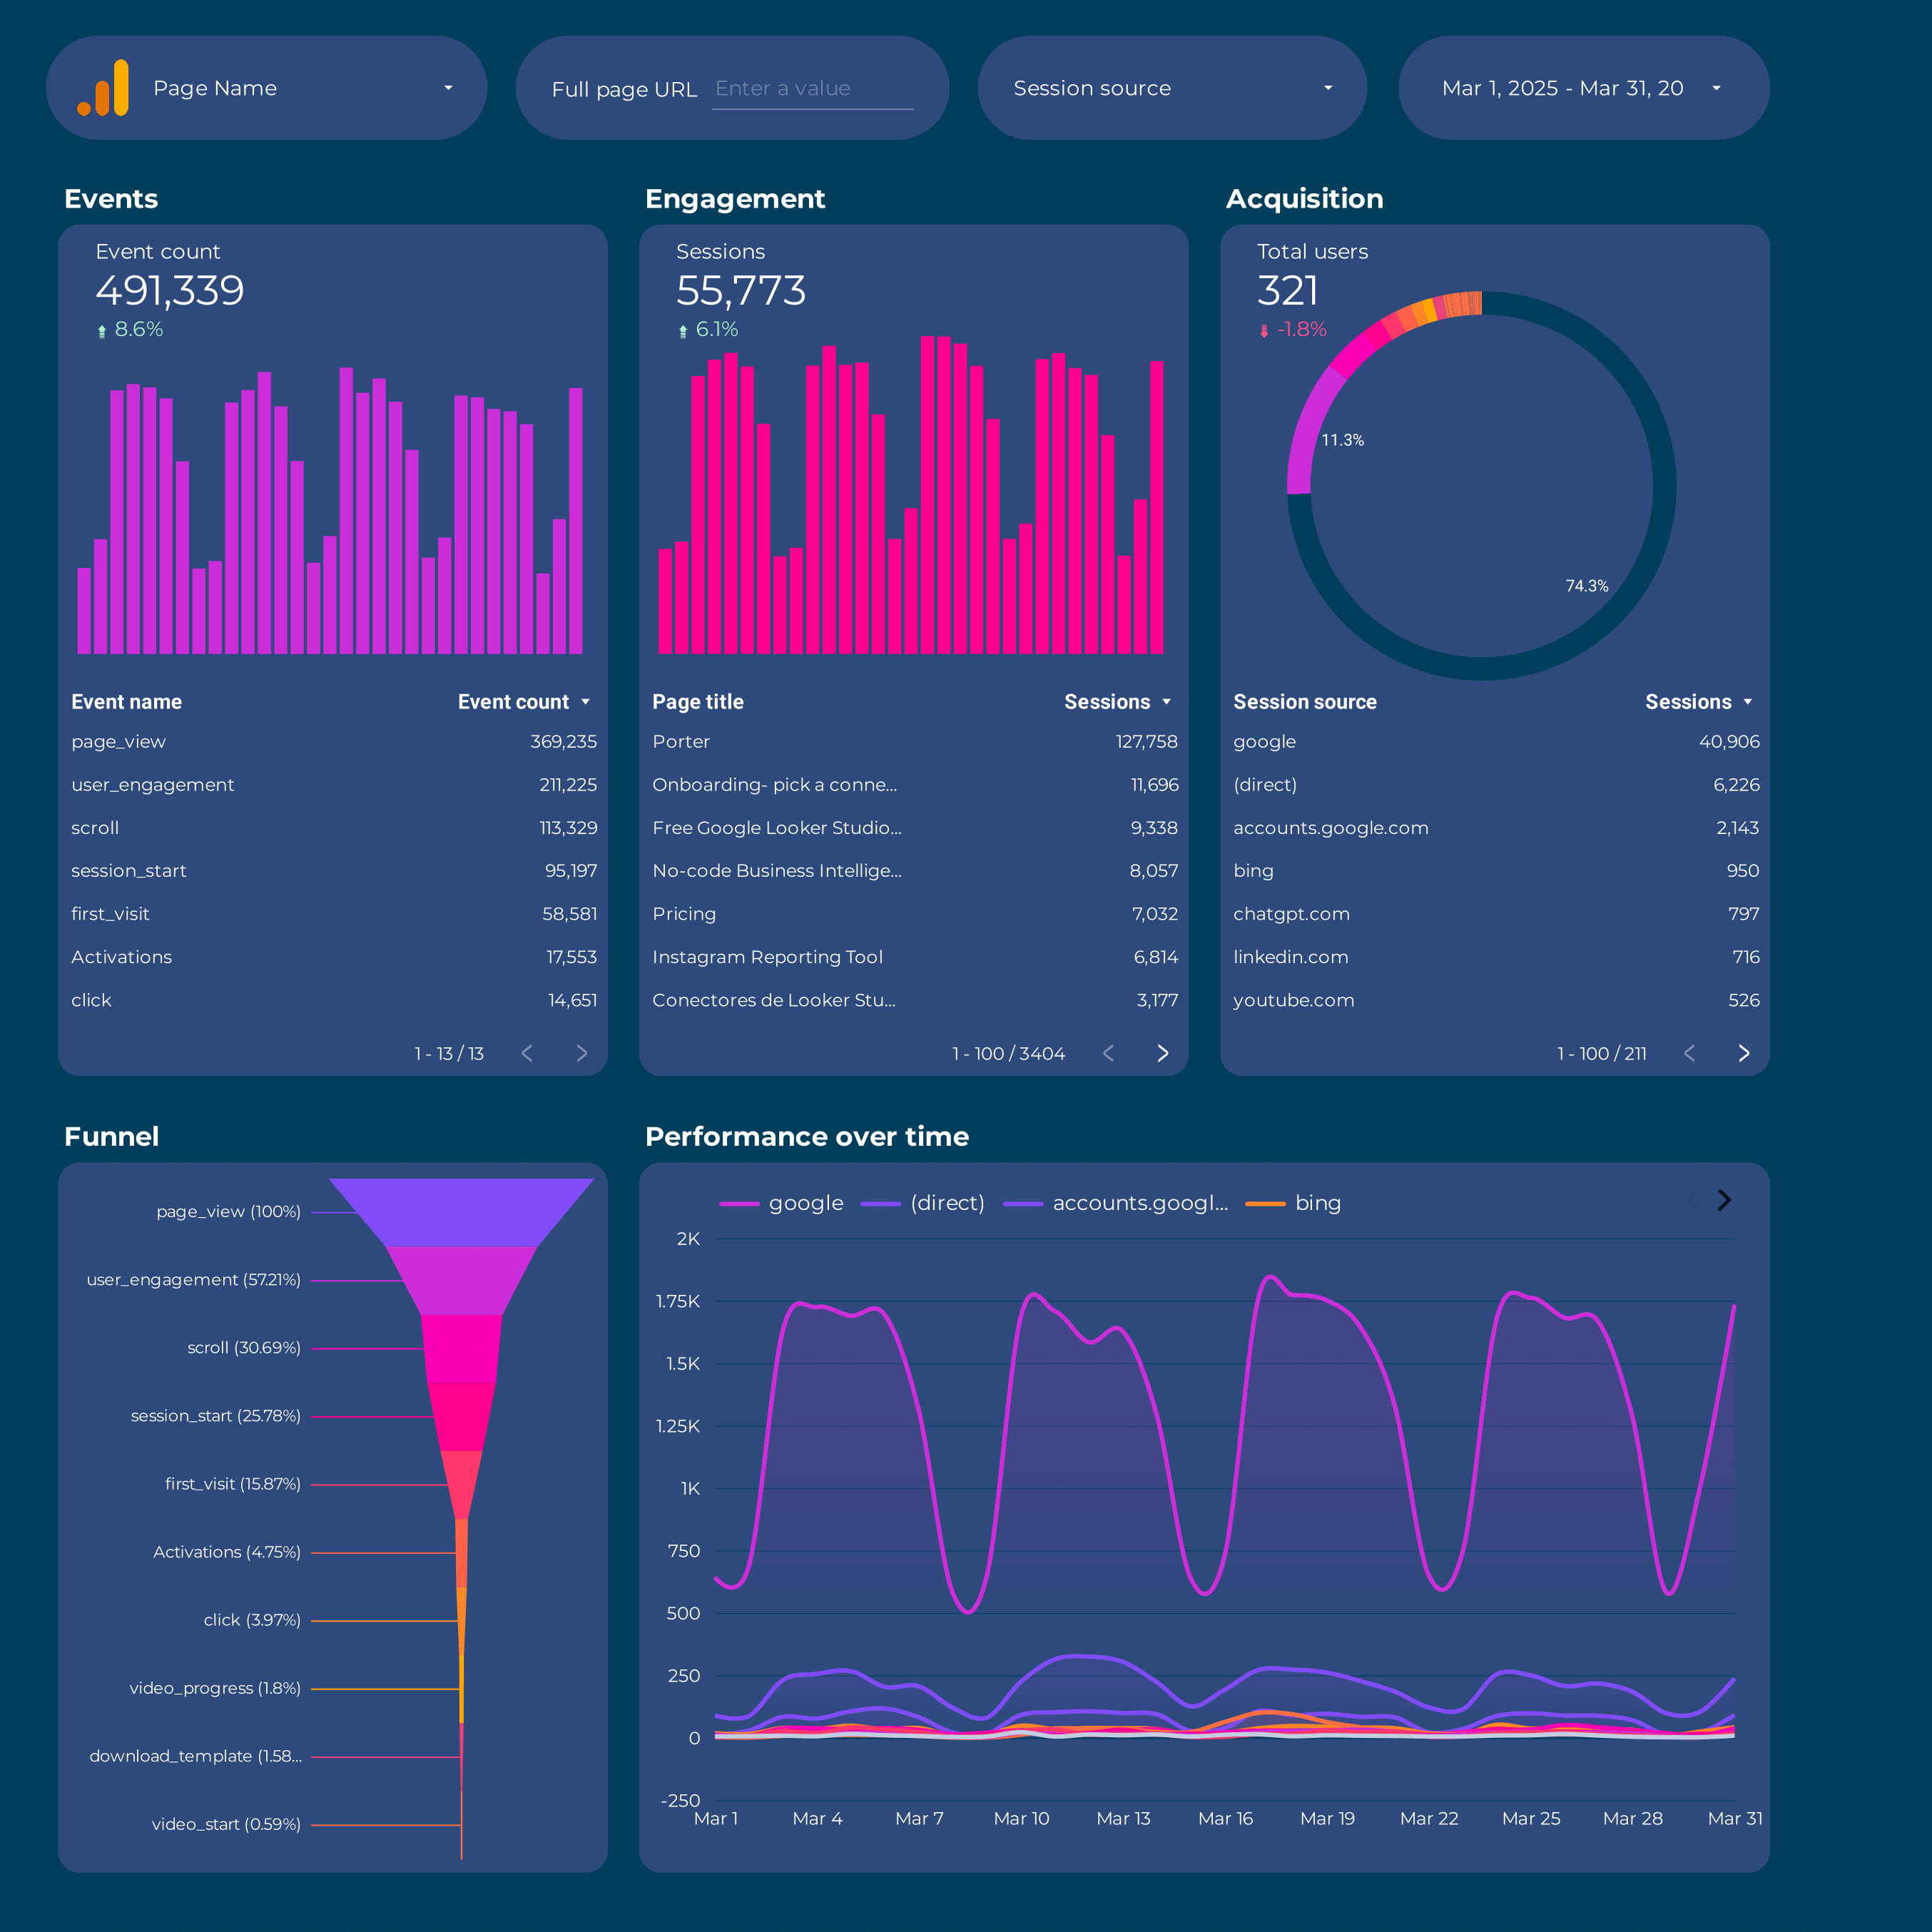
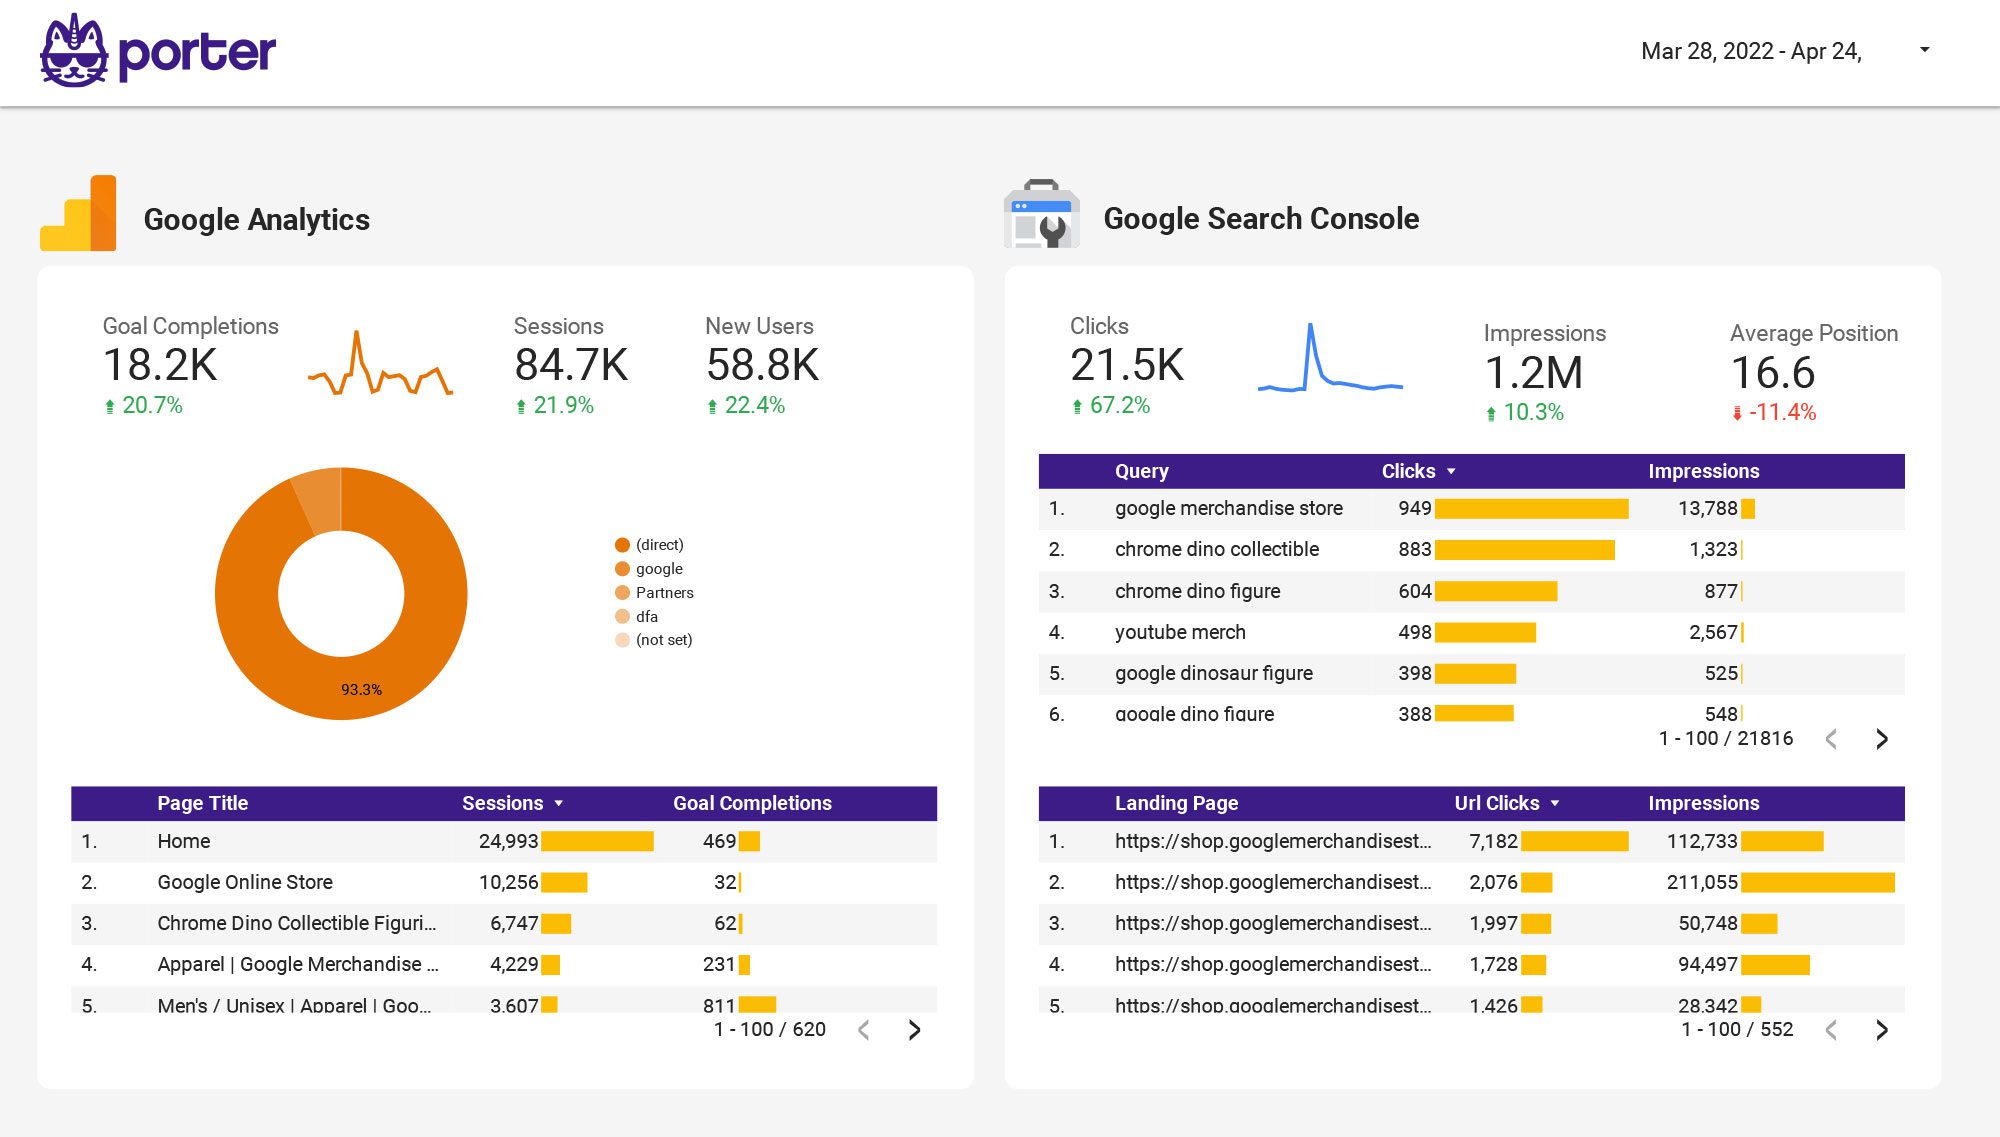
Google Analytics 4 Report template for Data Studio by Porter
Track sessions, new users by source → engagement rate, events/session → conversions by channel, revenue. Segment by source/medium, campaign, landing page.
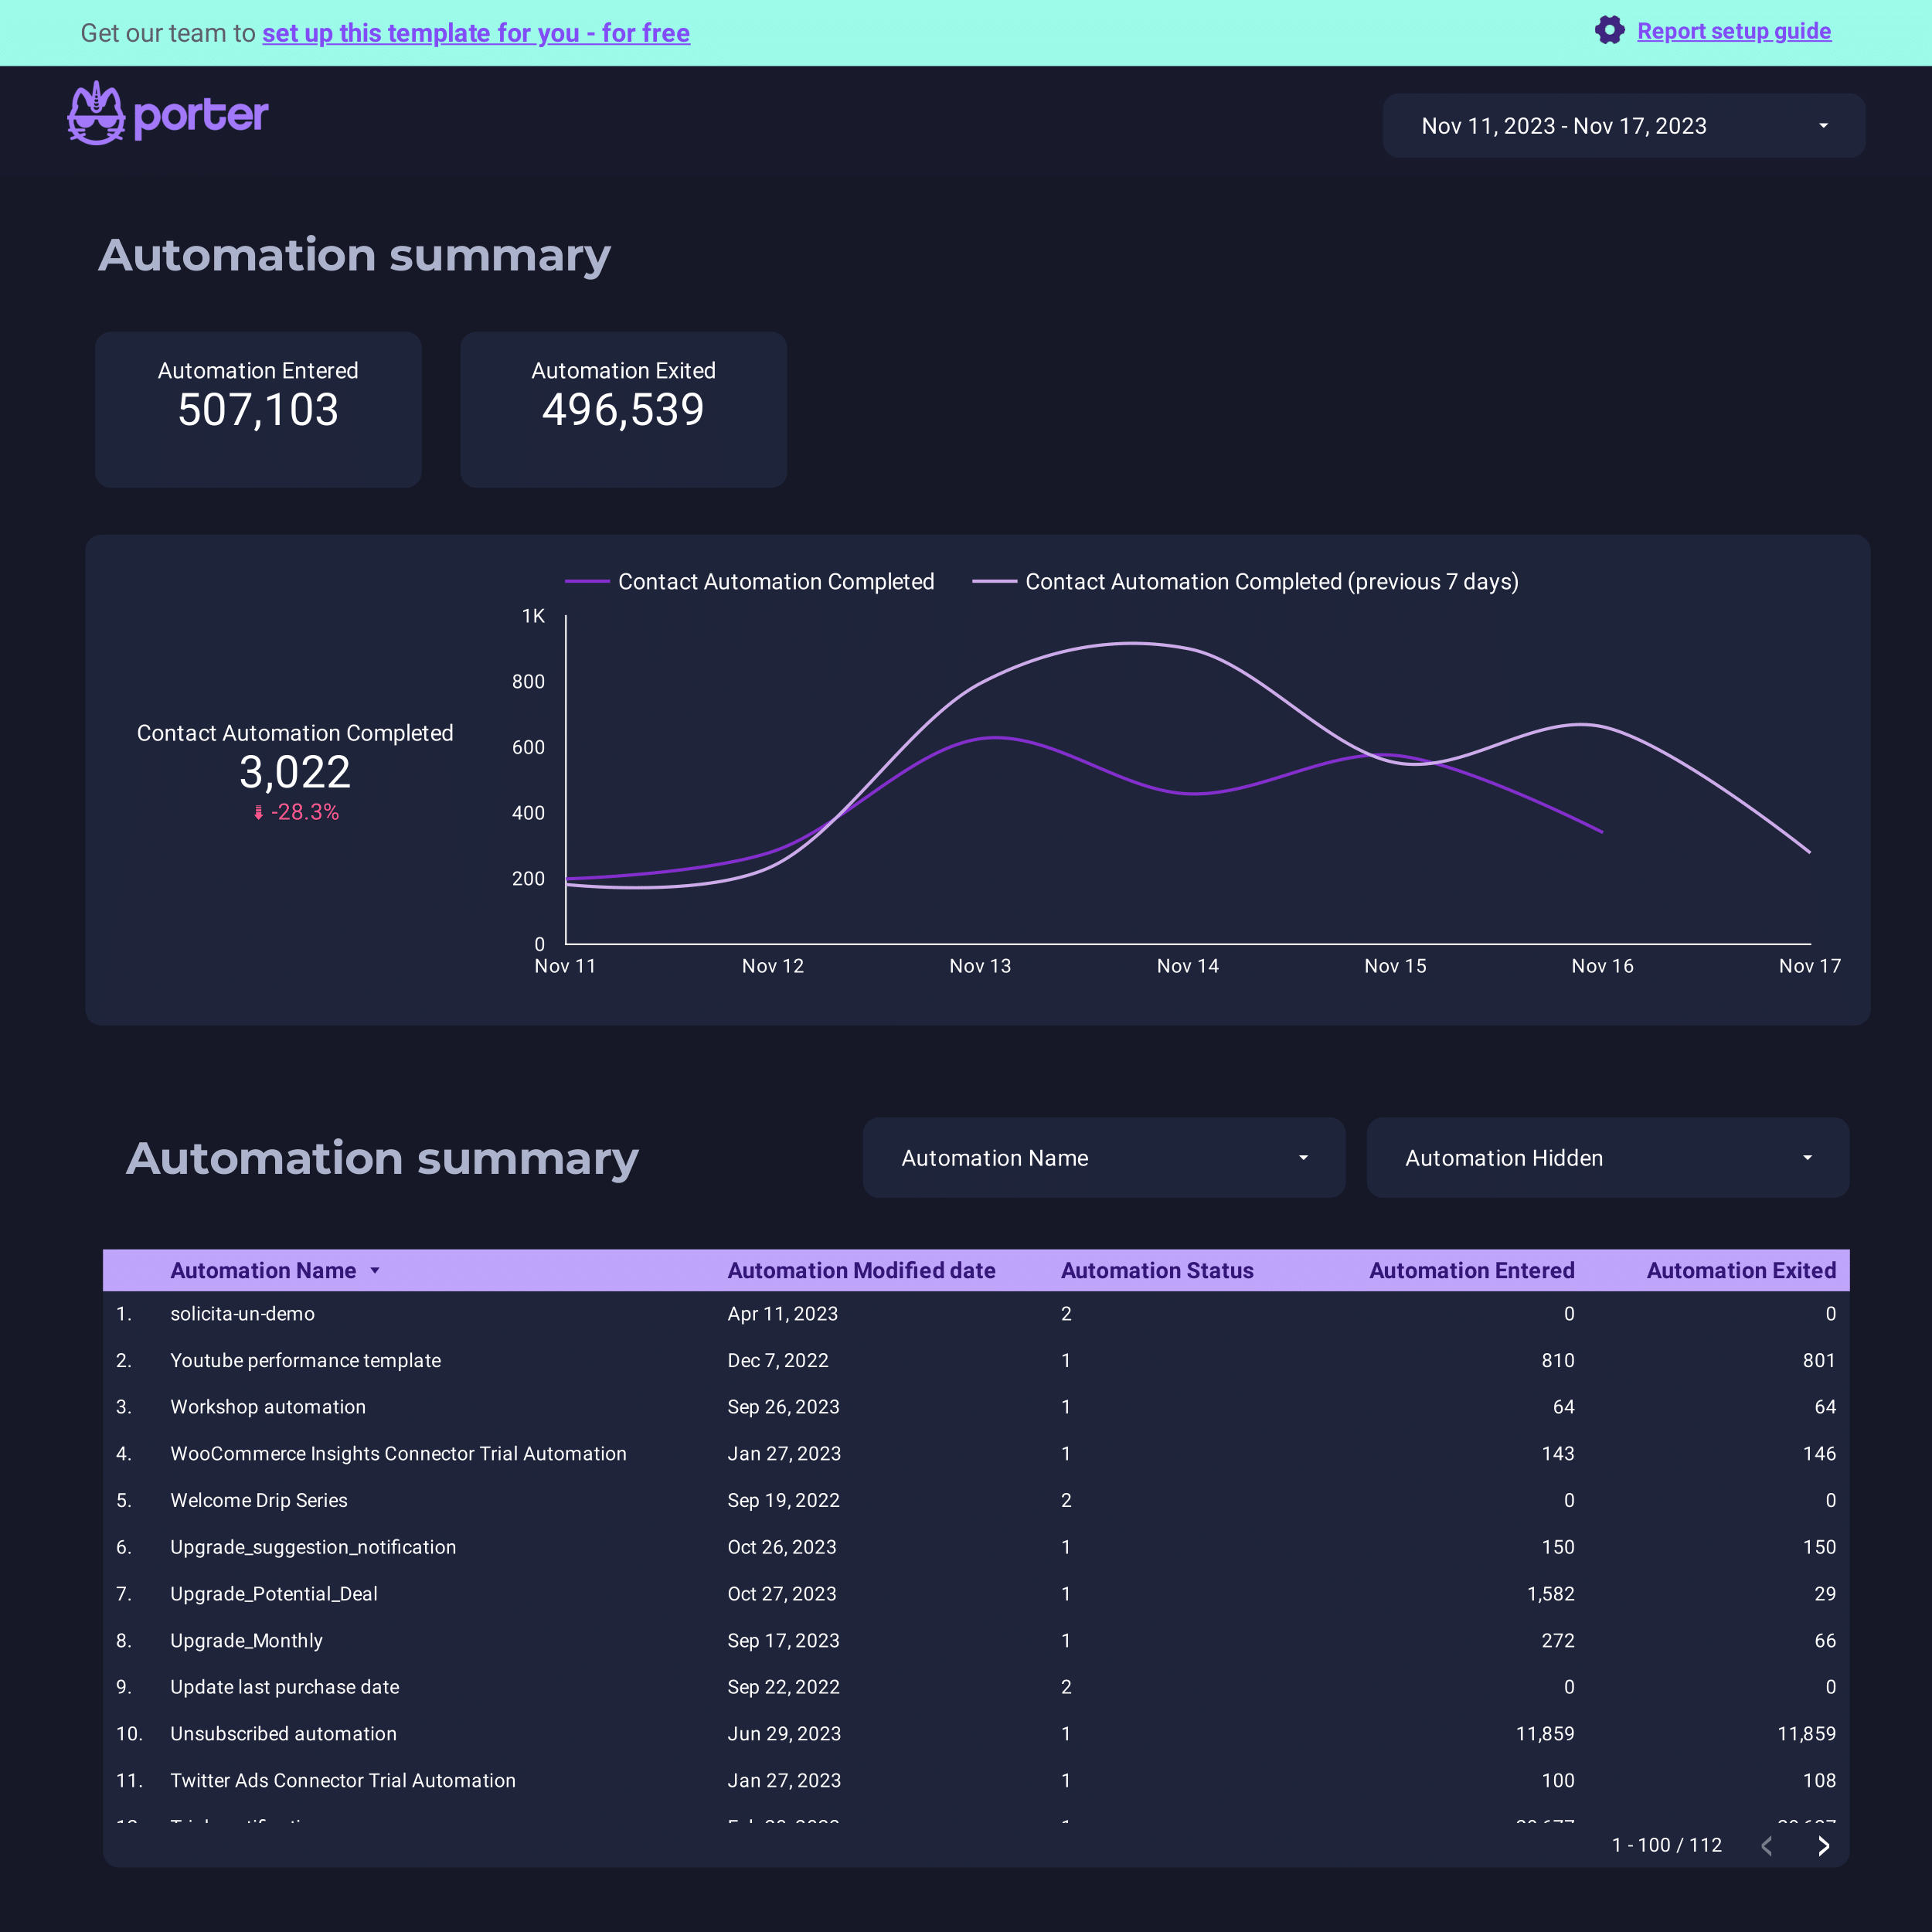
ActiveCampaign Report template for Data Studio by Porter
Track contacts, email deliverability → open rate, click rate → conversion events, deals. Segment by automation, list, campaign.
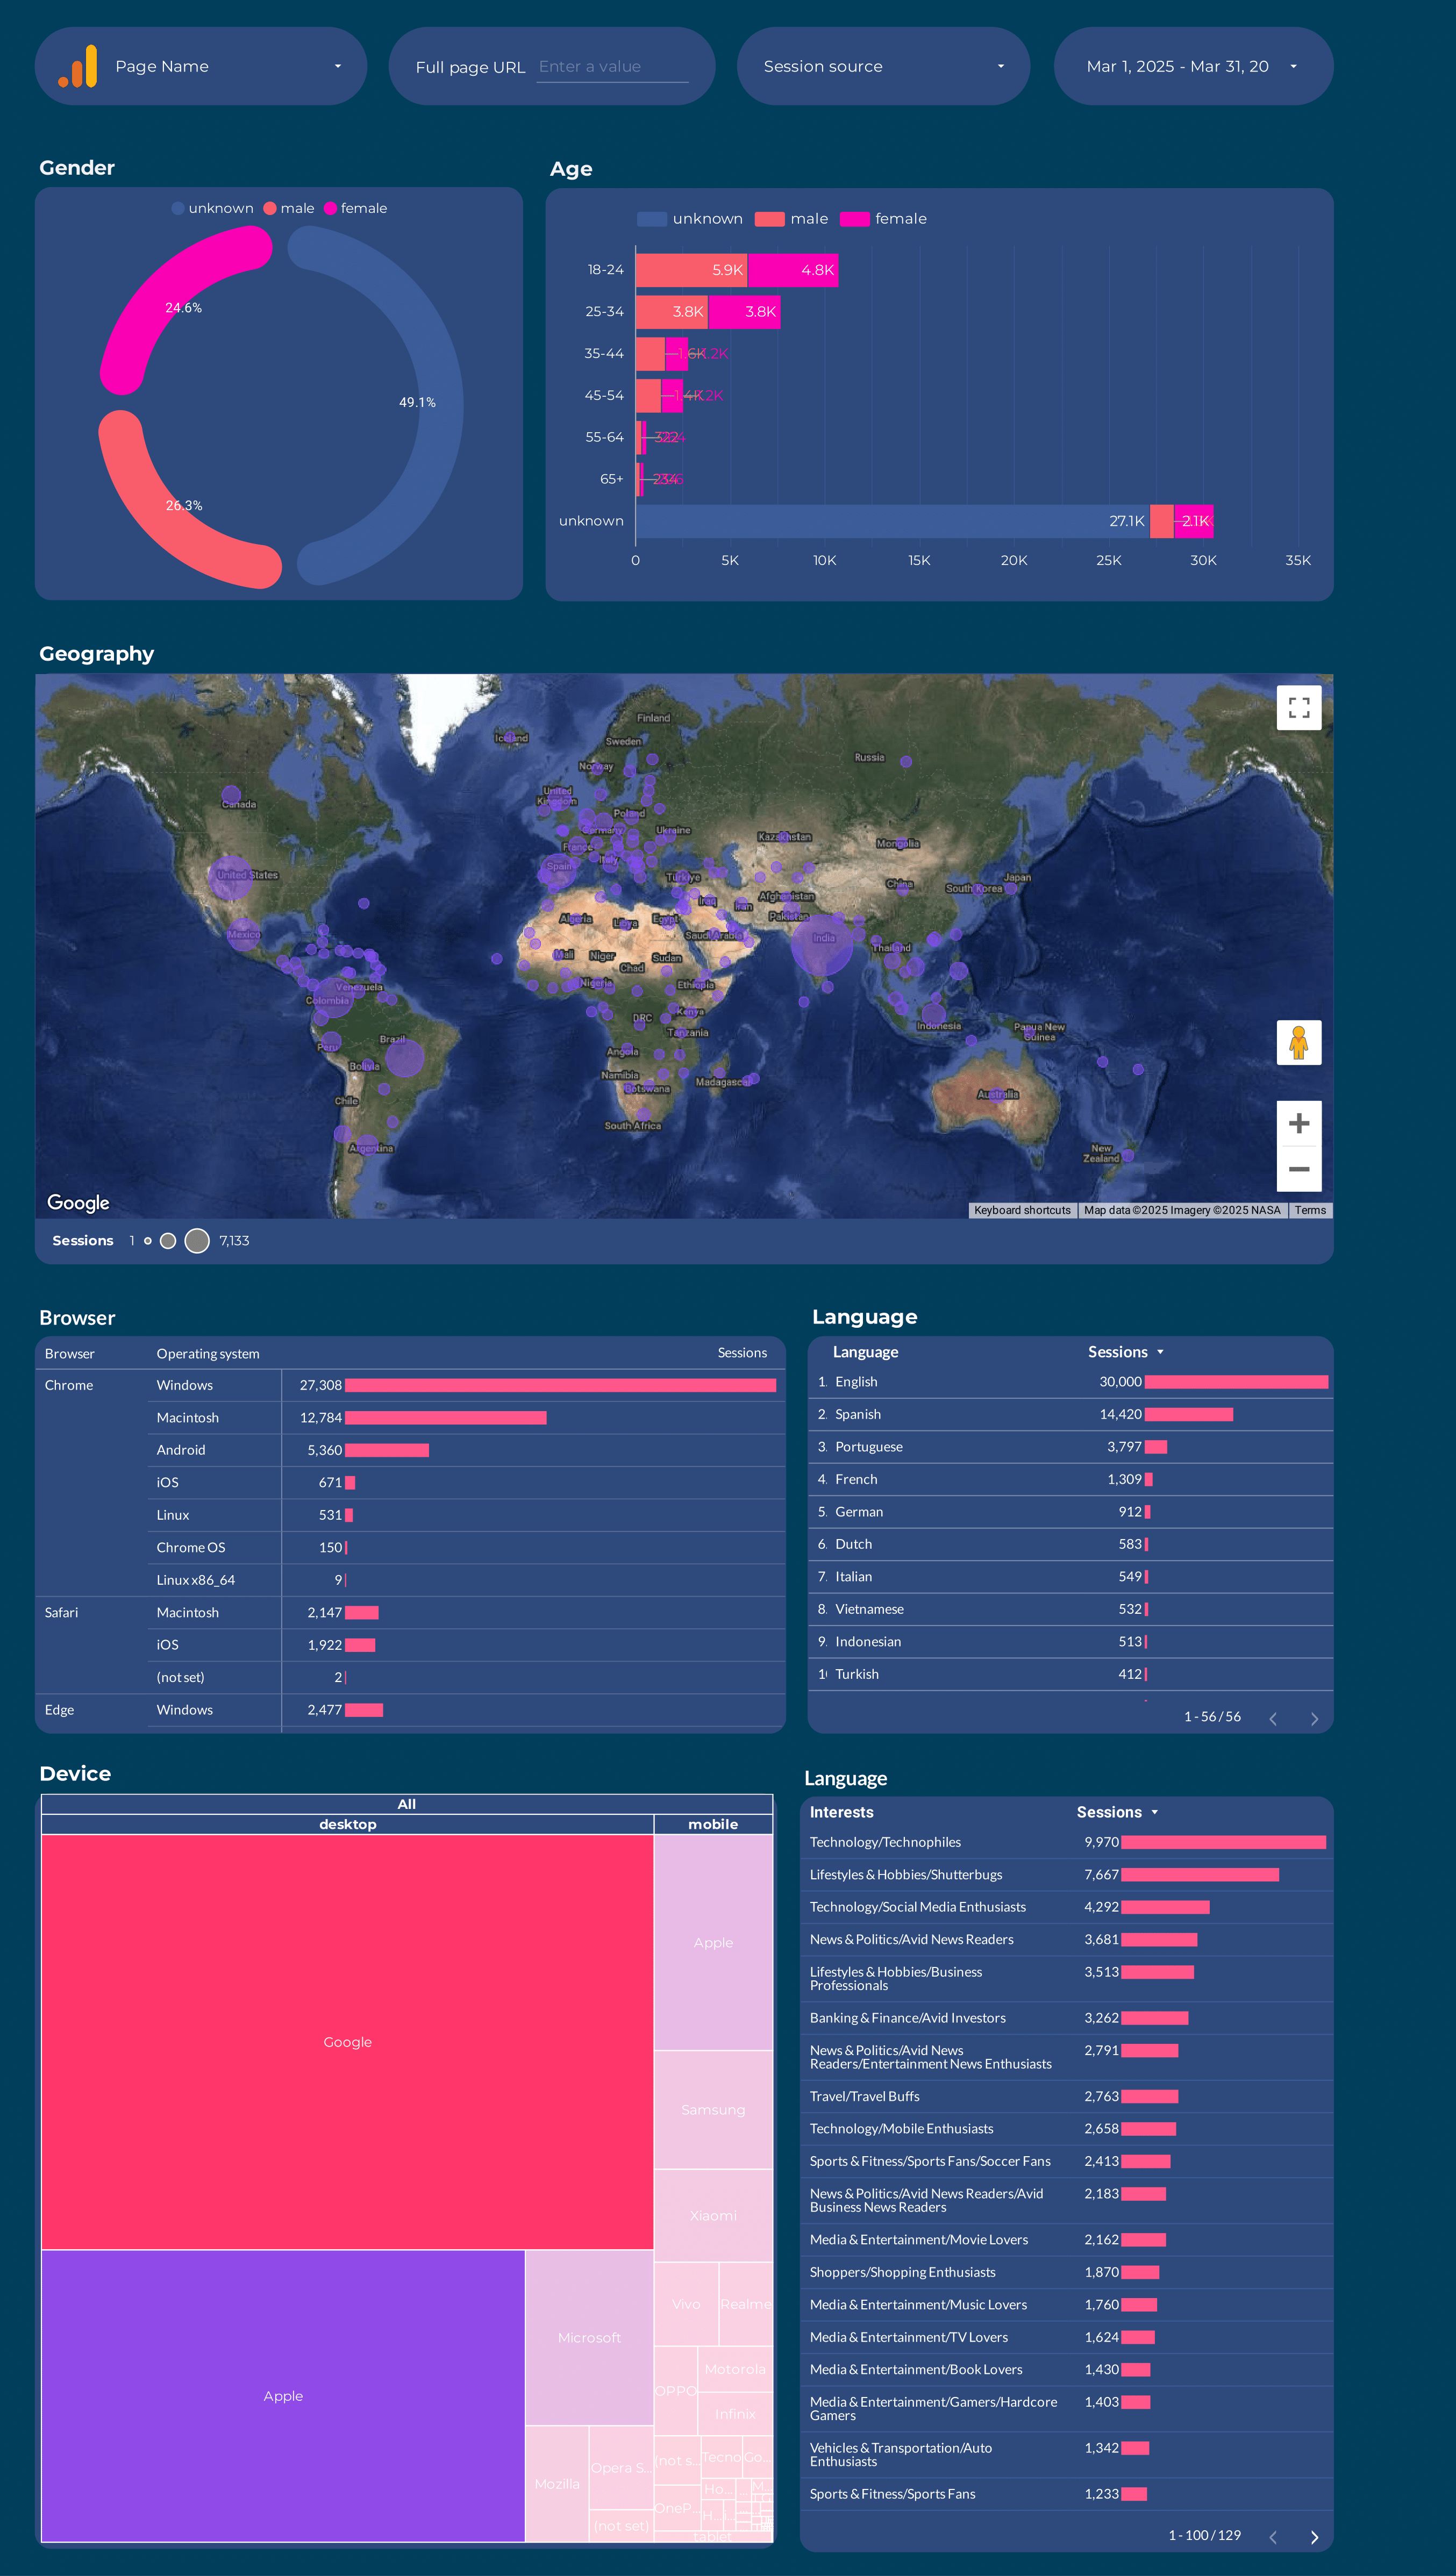
Google Analytics 4 Audience Report template for Data Studio by Porter
Track users, new vs returning → session duration, pages/session → conversion rate by segment. Segment by age, gender, interests, geography.

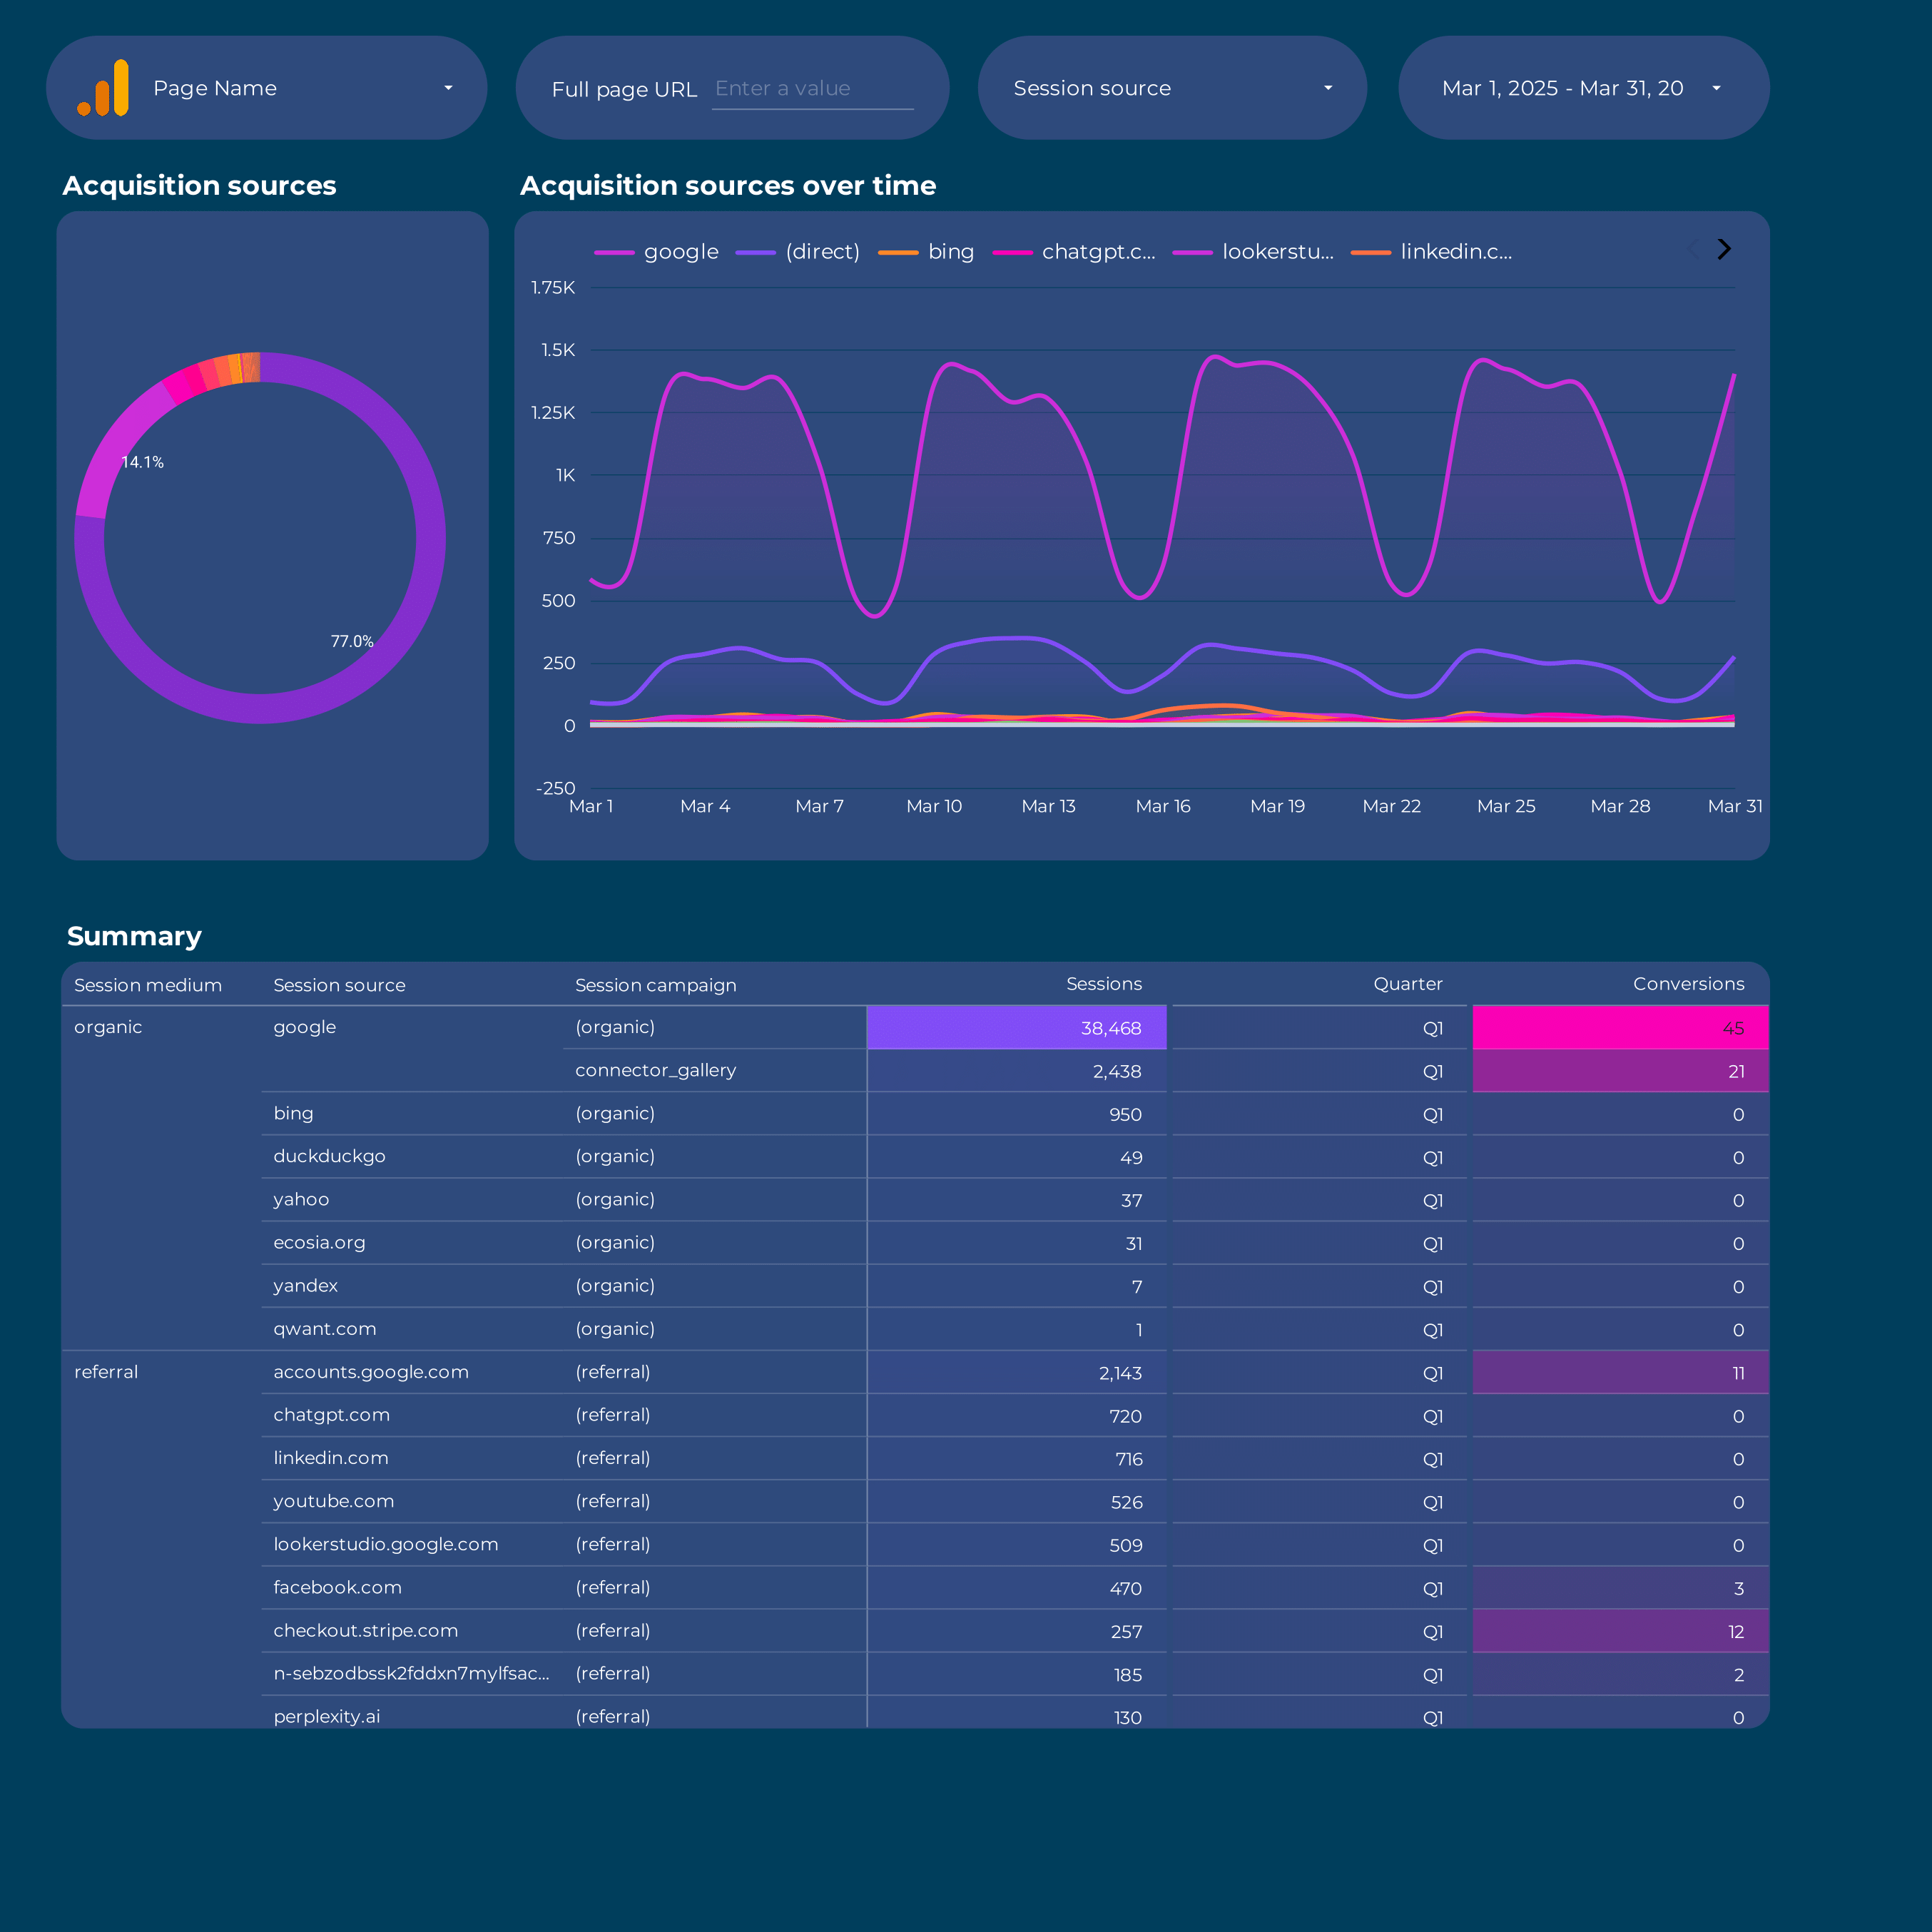
Acquisition Report template for Data Studio by Porter
Track sessions, new users by source → engagement rate, events/session → conversions by channel, revenue. Segment by source/medium, campaign, landing page.
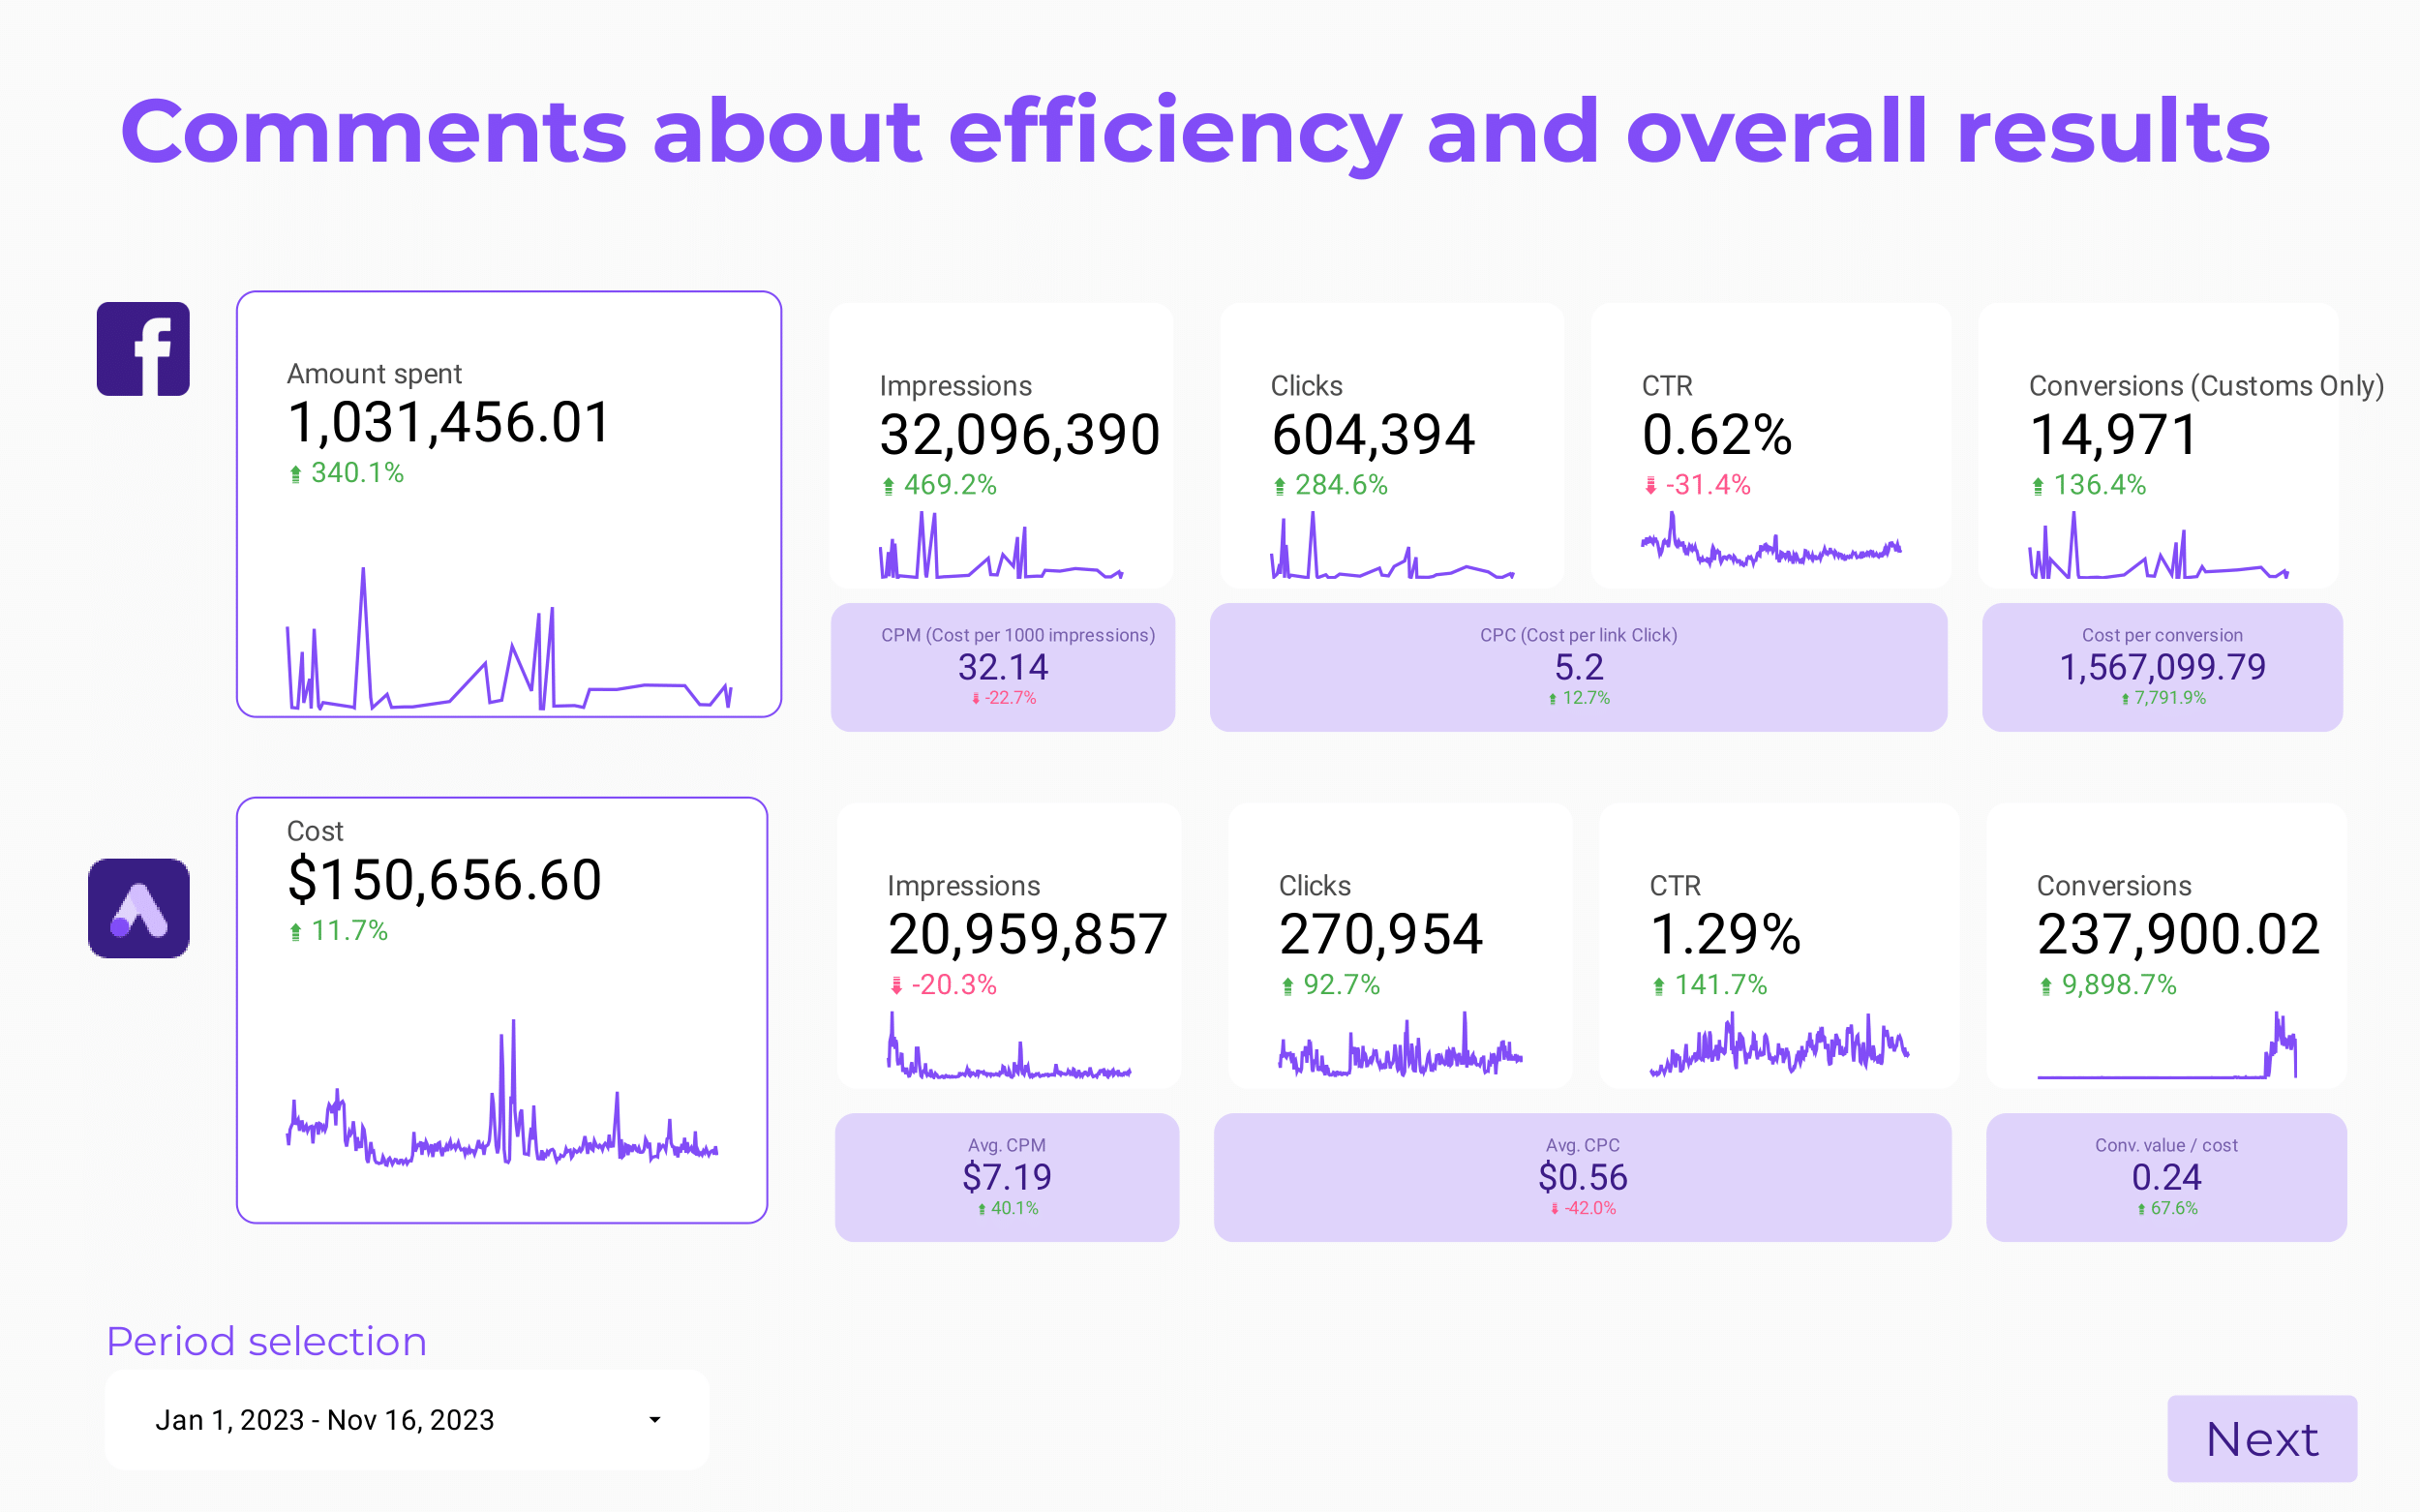
Paid media Client presentation Report template for Data Studio by Porter
Track client reach, impressions → CTR, engagement by platform → client ROAS, CPA, goals. Segment by client, platform, campaign.
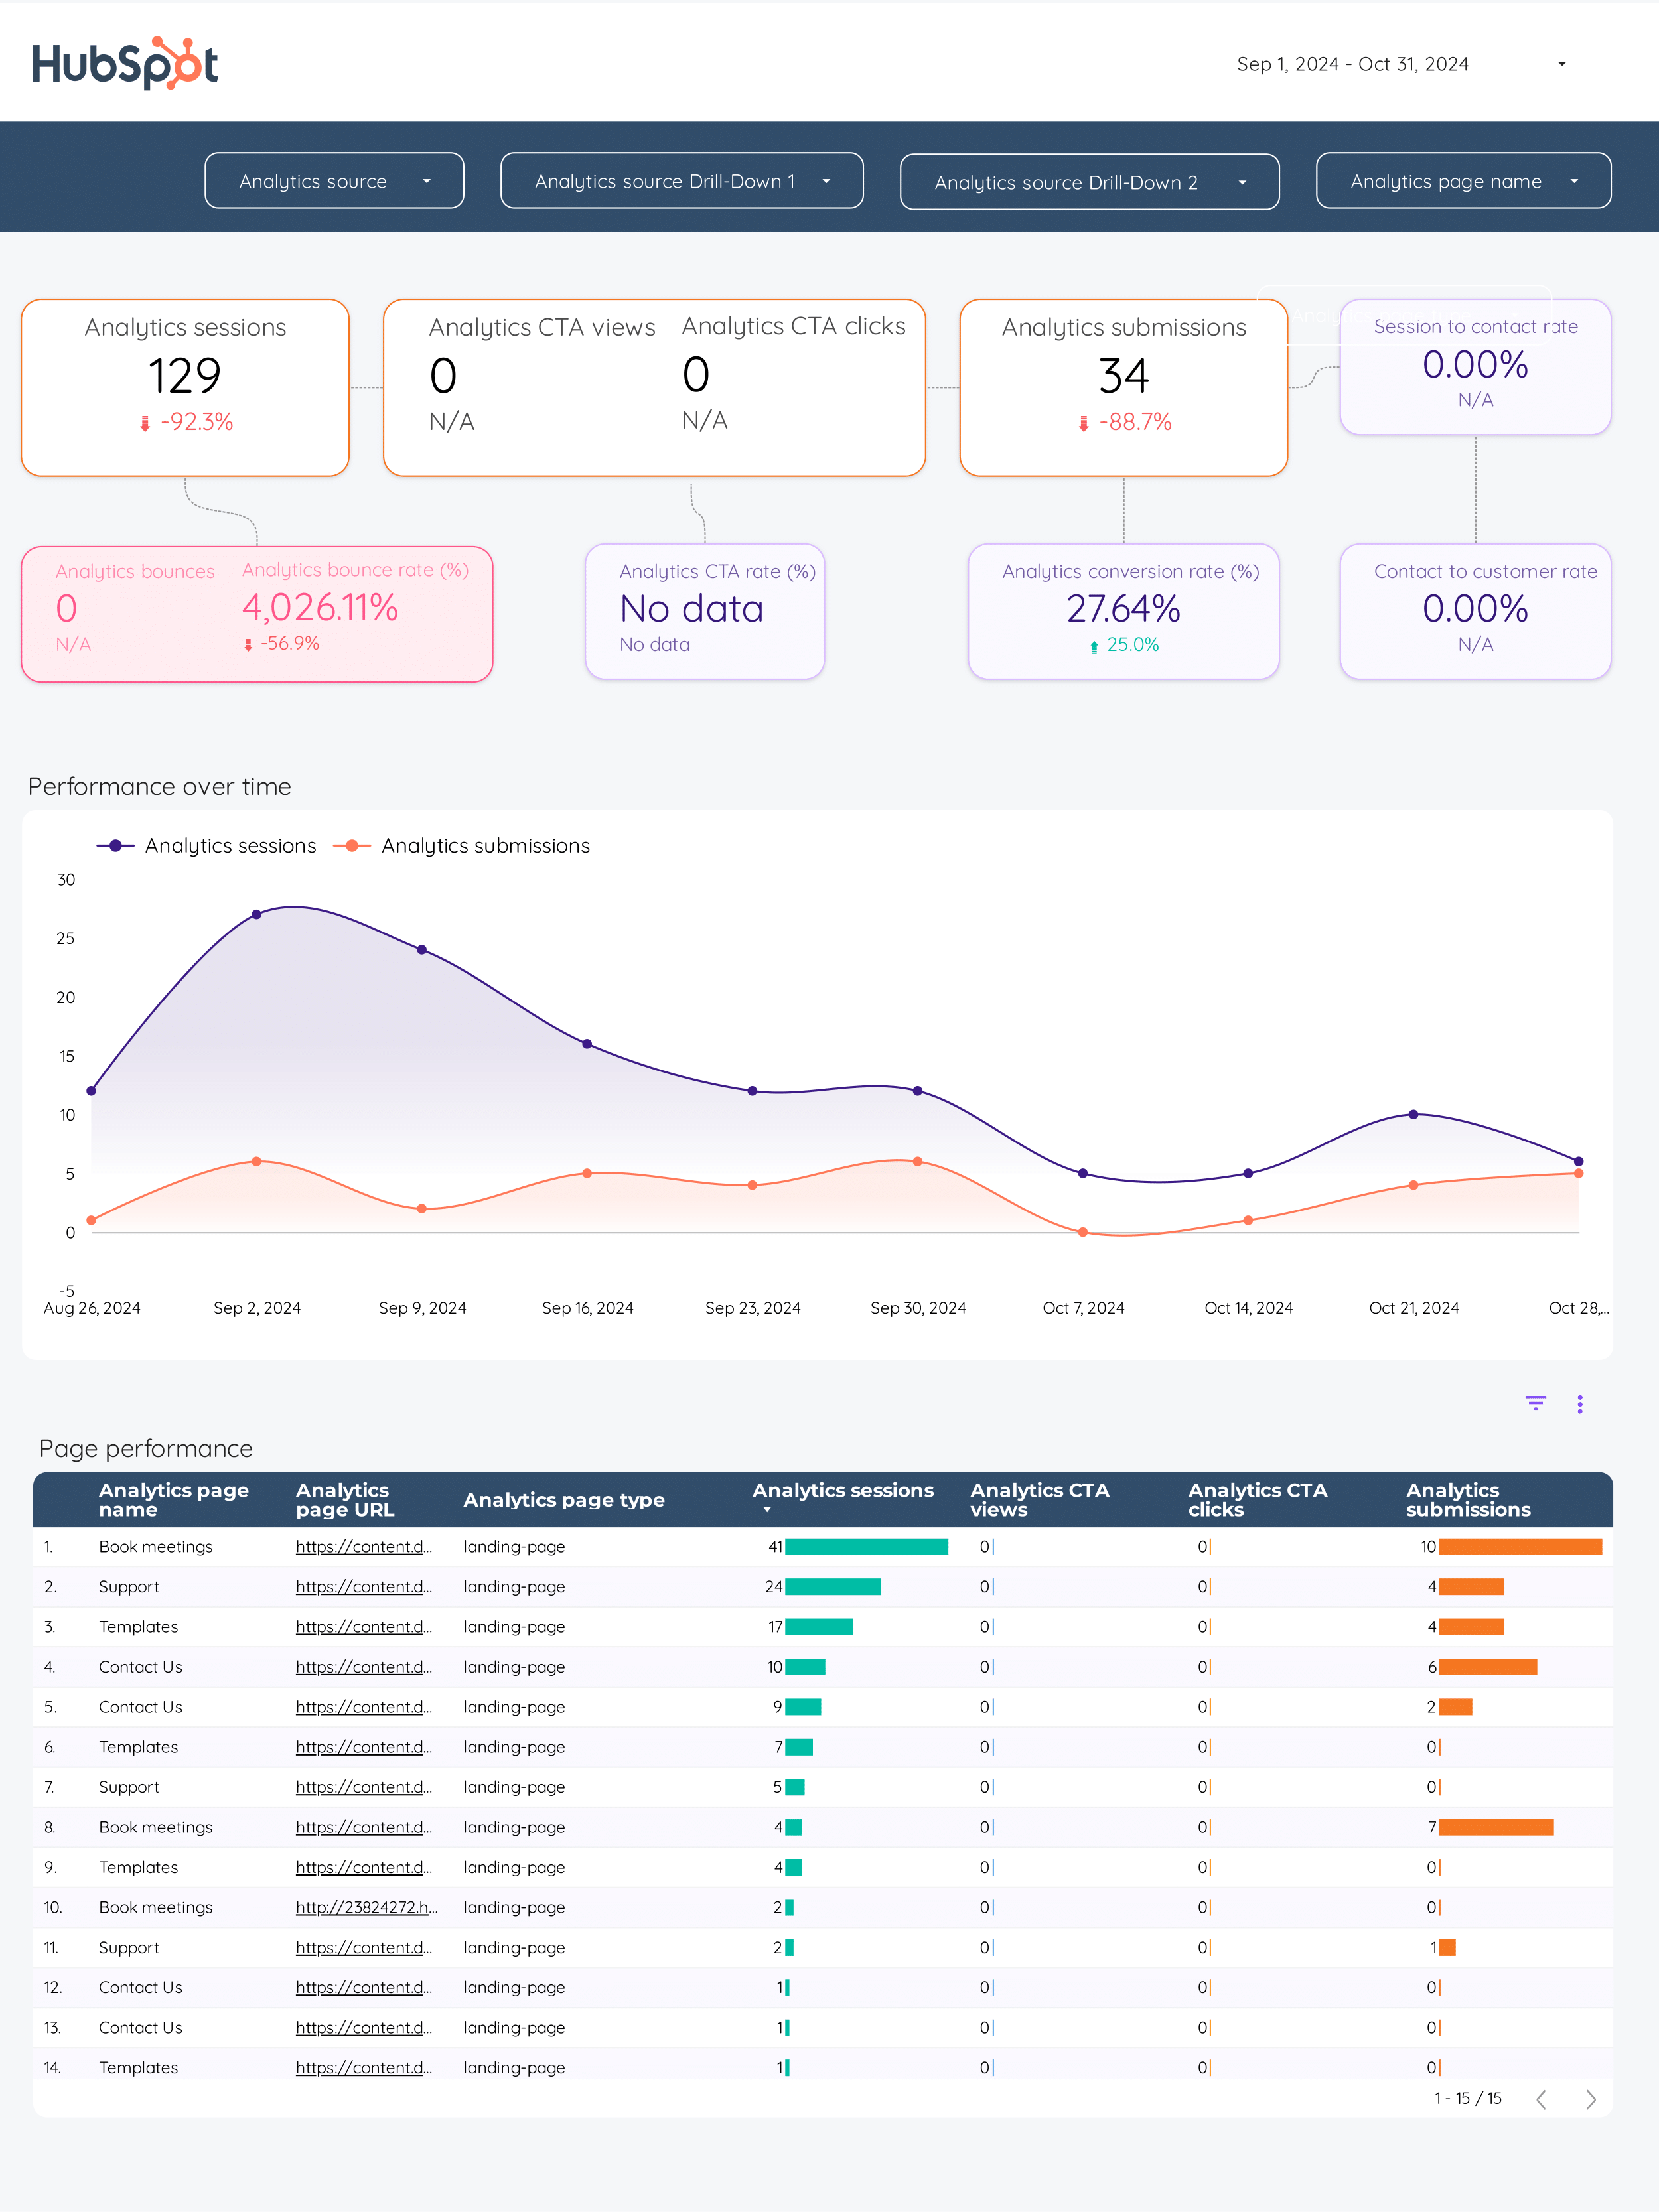
Website Report template for Data Studio by Porter
Track sessions, visitors, traffic sources → bounce rate, pages/session, duration → form submissions, purchases. Segment by landing page, source, device.
Creator marketing Report template for Data Studio by Porter
Track creator reach, impressions → engagement per creator, saves → conversions per creator, ROI. Segment by creator, platform.
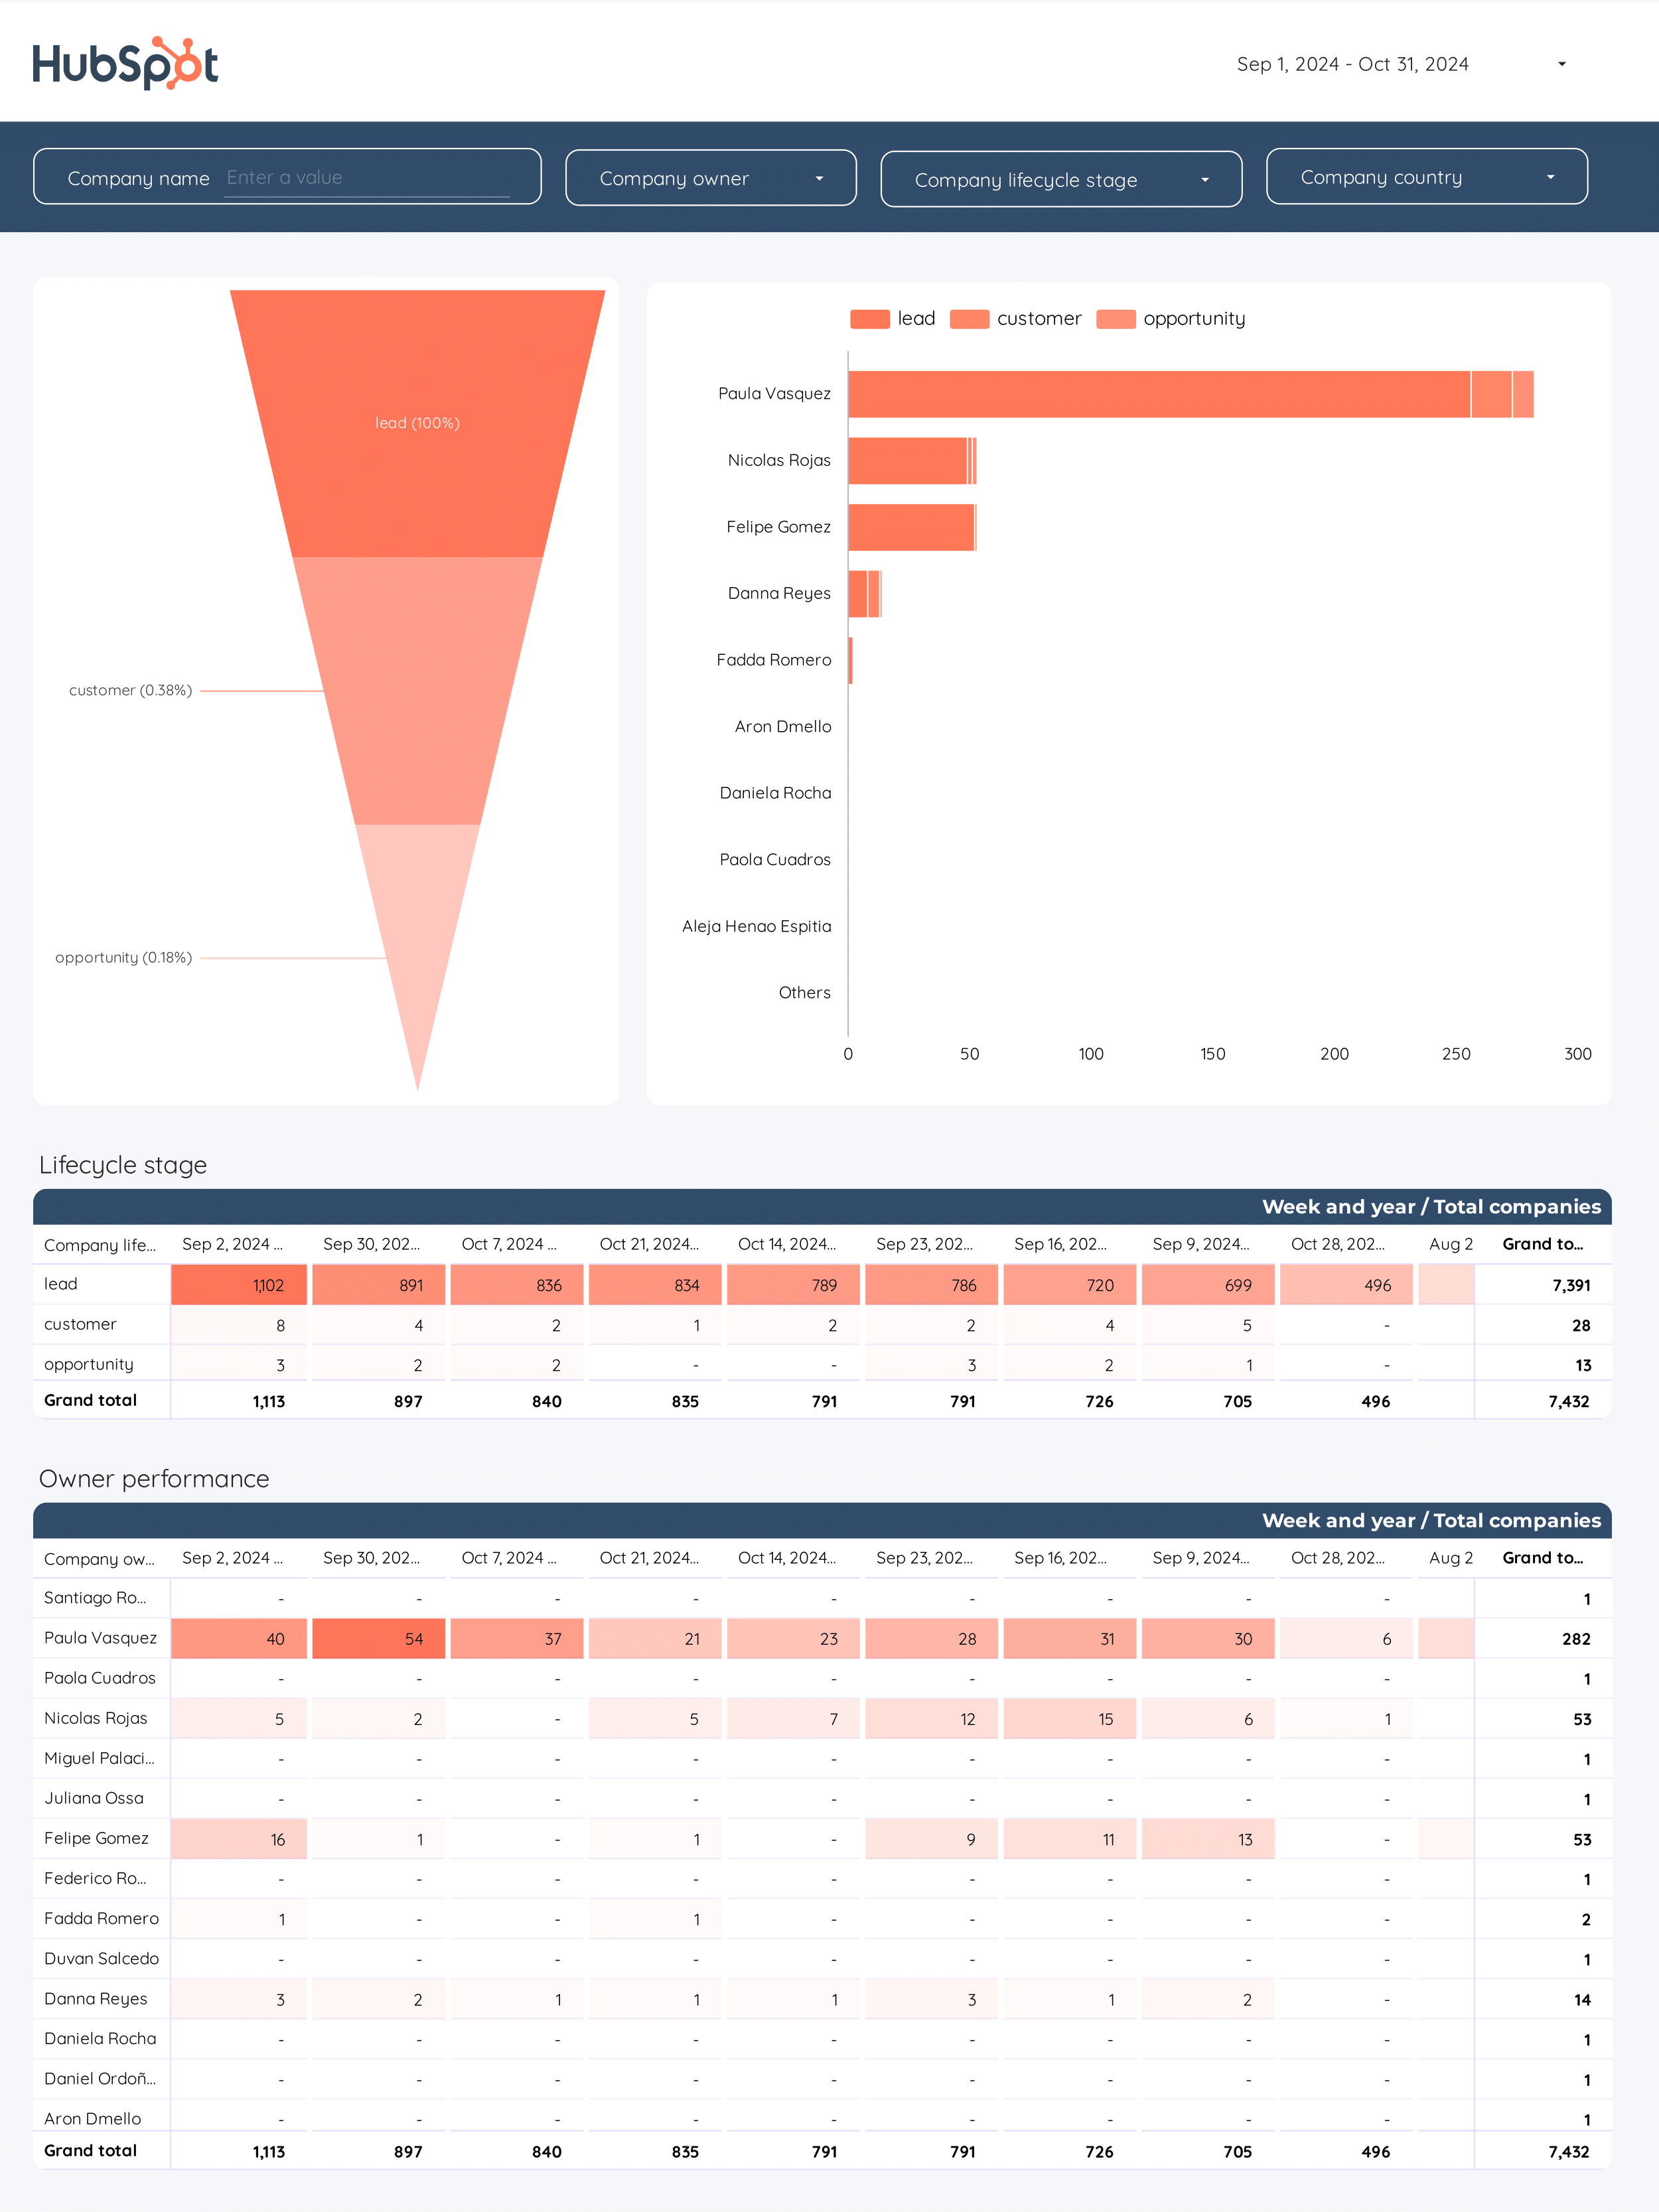
B2B Marketing performance Report template for Data Studio by Porter
Track account reach, impressions → engagement by account → MQLs, SQLs, pipeline contribution. Segment by account, campaign, stage.
Inbound marketing Report template for Data Studio by Porter
Track blog traffic, social reach → content downloads, form views → MQLs, SQLs, pipeline generated. Segment by content asset, channel, stage.
PPC Campaign performance Report template for Data Studio by Porter
Track campaign impressions, SOV → CTR, CPC per campaign → ROAS, conversions per campaign. Segment by campaign, ad group, date.
B2B Funnel Report template for Data Studio by Porter
Track account reach, ad impressions → content engagement, demo requests → pipeline value, deal velocity. Segment by account tier, channel.
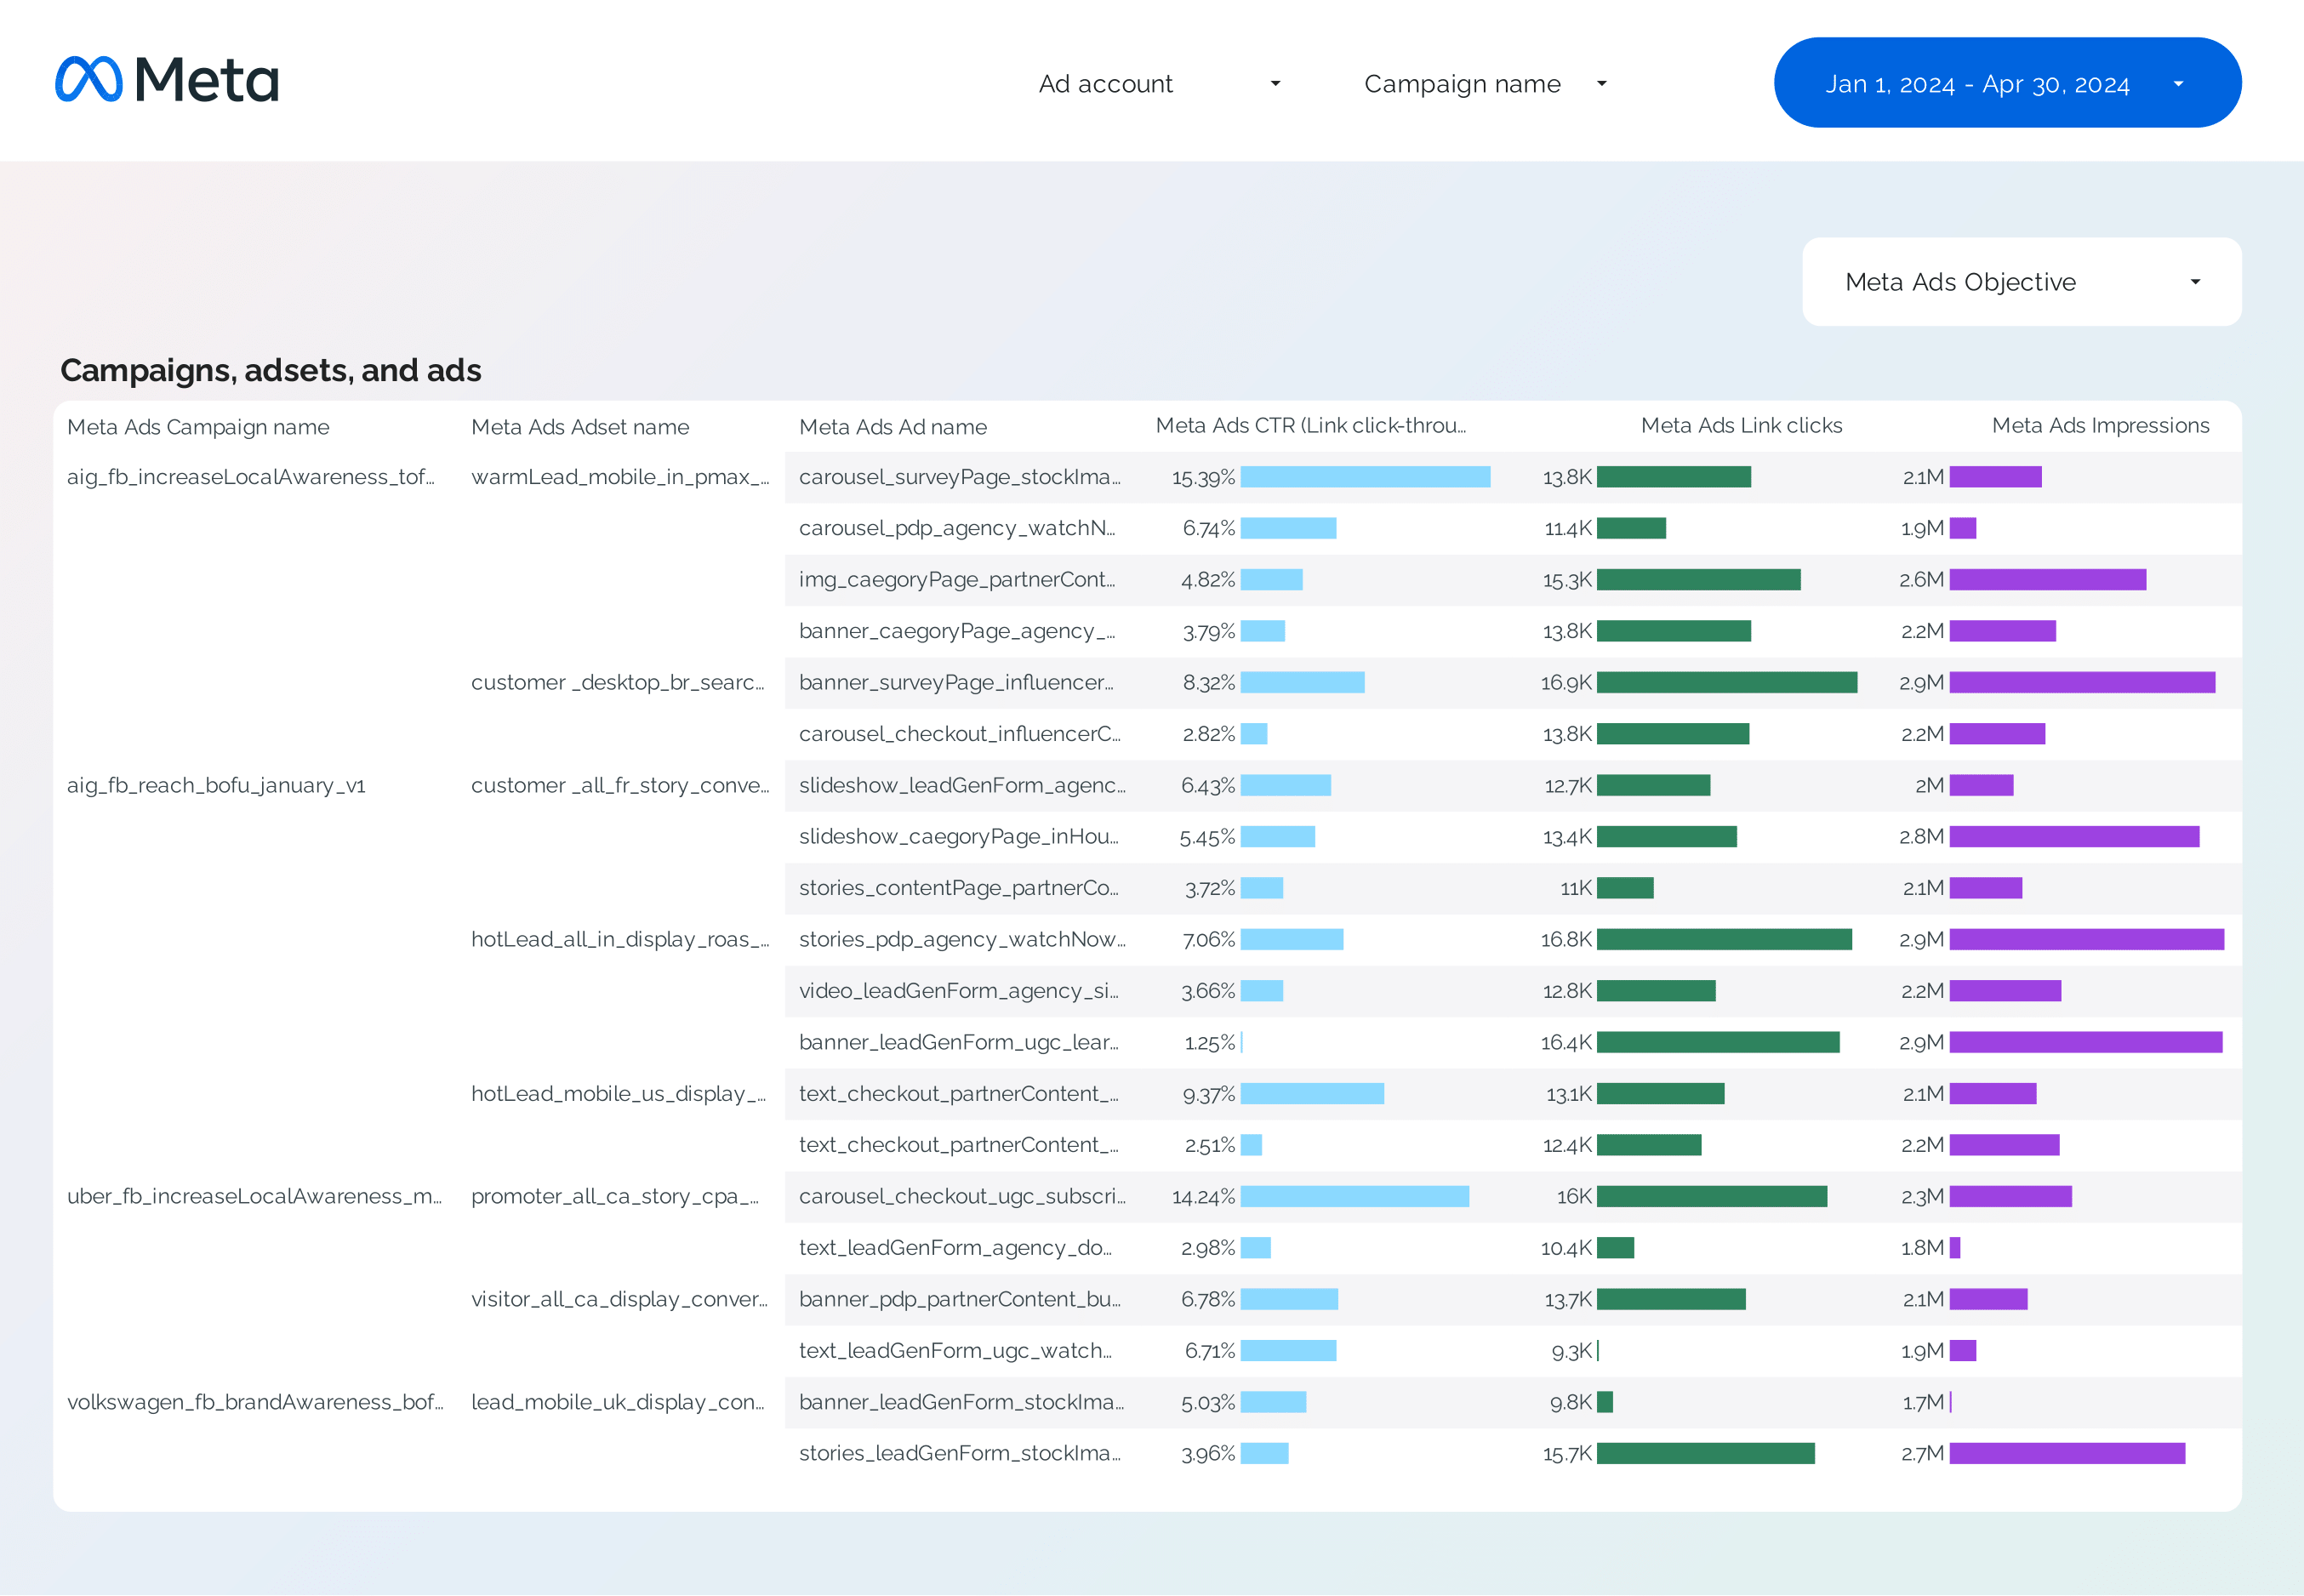
Facebook Ads Campaign performance Report template for Data Studio by Porter
Track campaign reach, impressions → CTR, CPC by campaign → ROAS, CPA per campaign. Segment by campaign, objective, audience.
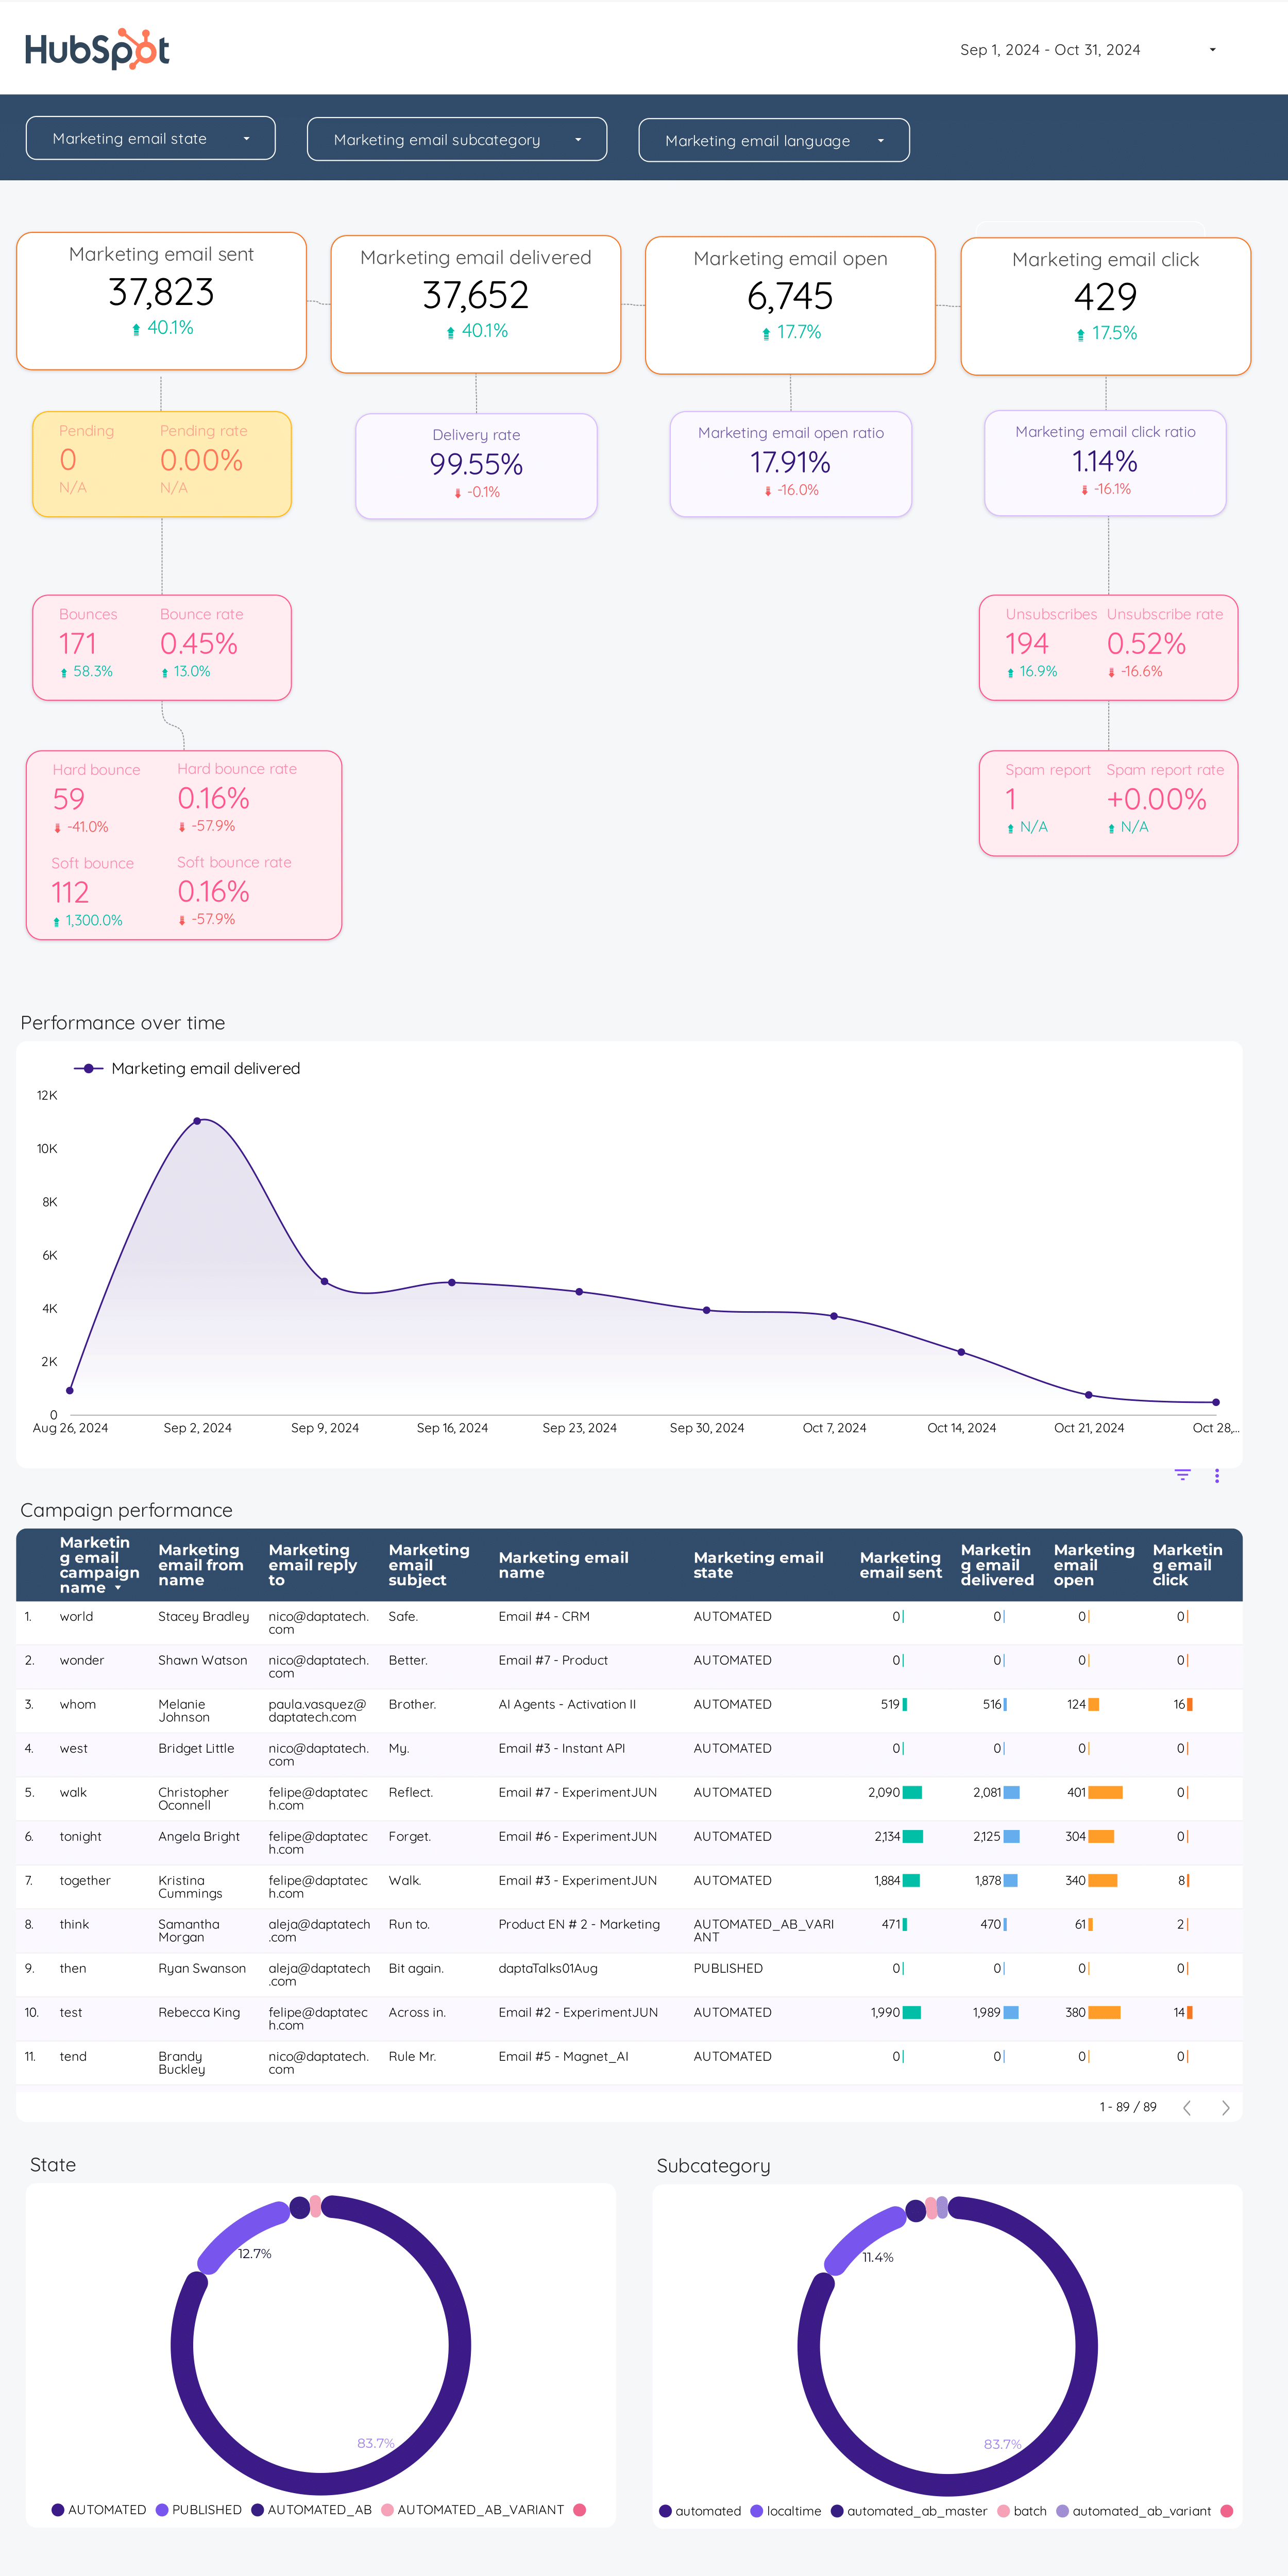
Email marketing Report template for Data Studio by Porter
Track emails sent, deliverability → open rate, CTR, unsubscribes → email revenue, conversion. Segment by campaign, segment, time.
Google Analytics 4 E-commerce Report template for Data Studio by Porter
Track product impressions, catalog views → add-to-cart rate, product clicks → purchase rate, revenue, AOV. Segment by product, category, source.
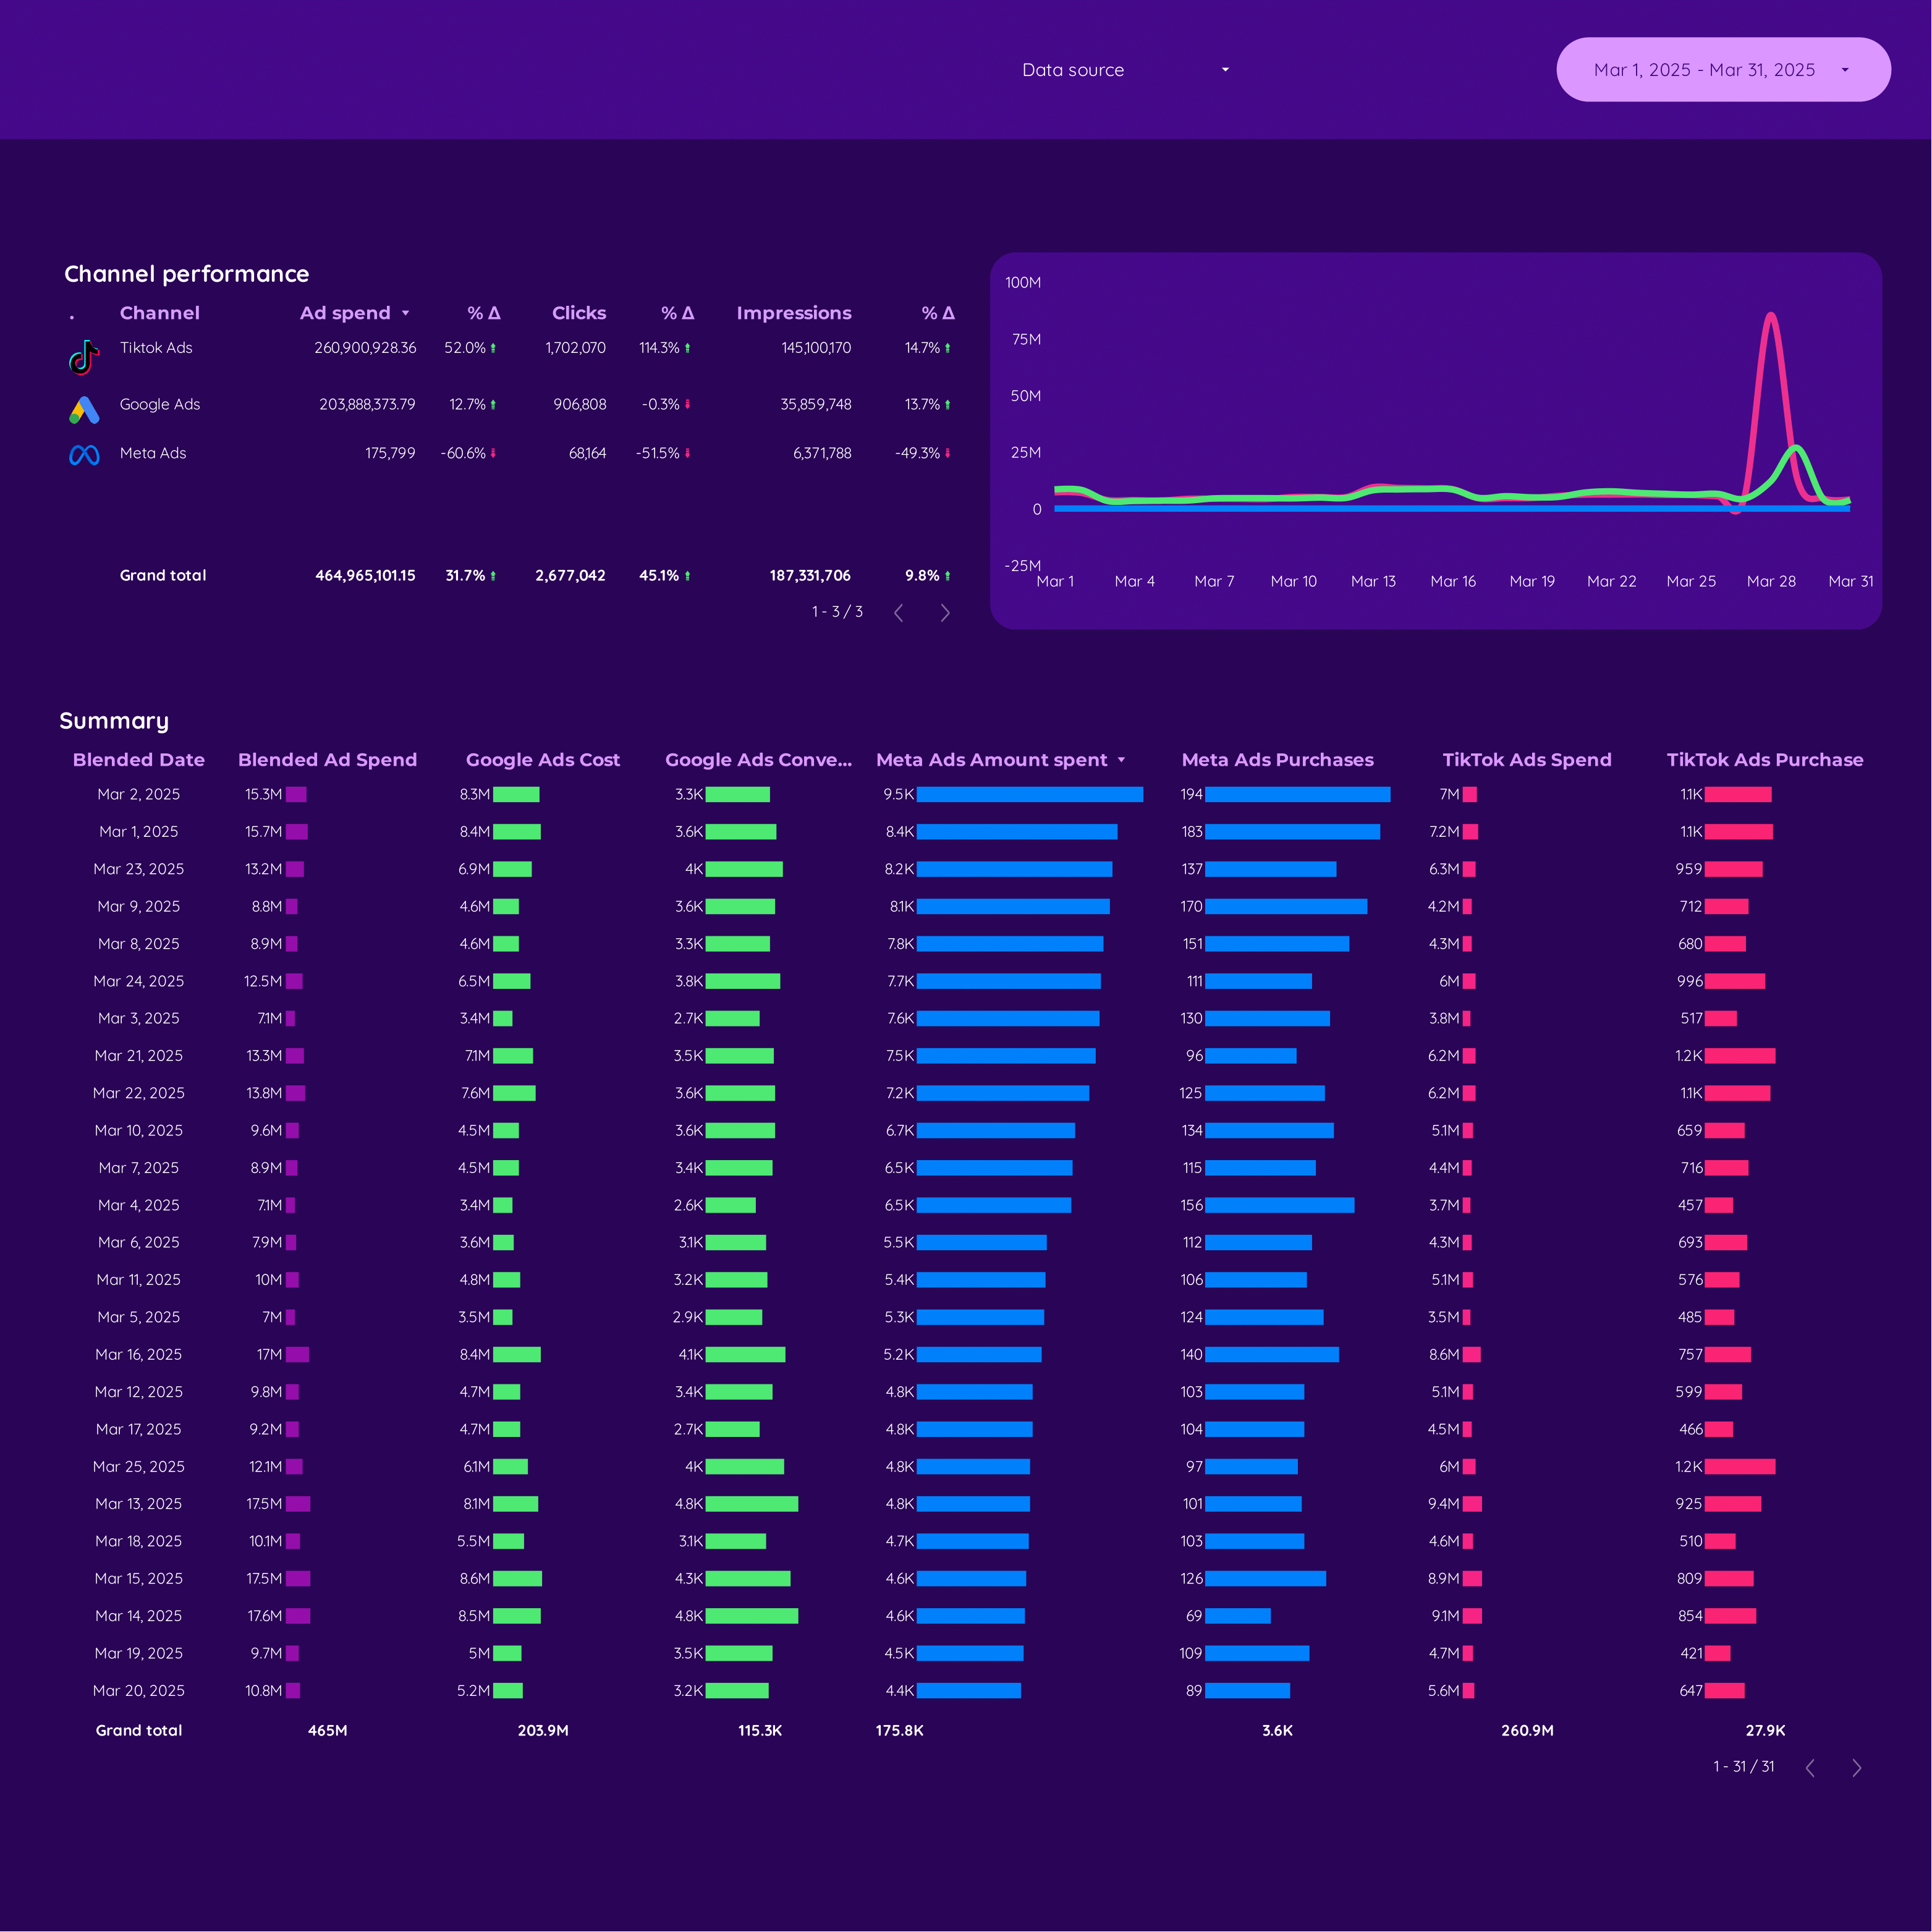
Marketing Ad spend Report template for Data Studio by Porter
Track spend distribution, budget allocation → efficiency (CPC, CPM by channel) → ROAS by channel, blended CPA. Segment by channel, campaign, period.
PPC Funnel Report template for Data Studio by Porter
Track top-funnel reach → mid-funnel engagement → bottom-funnel ROAS, CPA. Segment by funnel stage, campaign.
ActiveCampaign Report template for Data Studio by Porter
Track contacts, email deliverability → open rate, click rate → conversion events, deals. Segment by automation, list, campaign.
Google Ads Funnel Report template for Data Studio by Porter
Track top-funnel impressions → mid-funnel clicks → bottom-funnel conversions, ROAS. Segment by funnel stage, campaign.
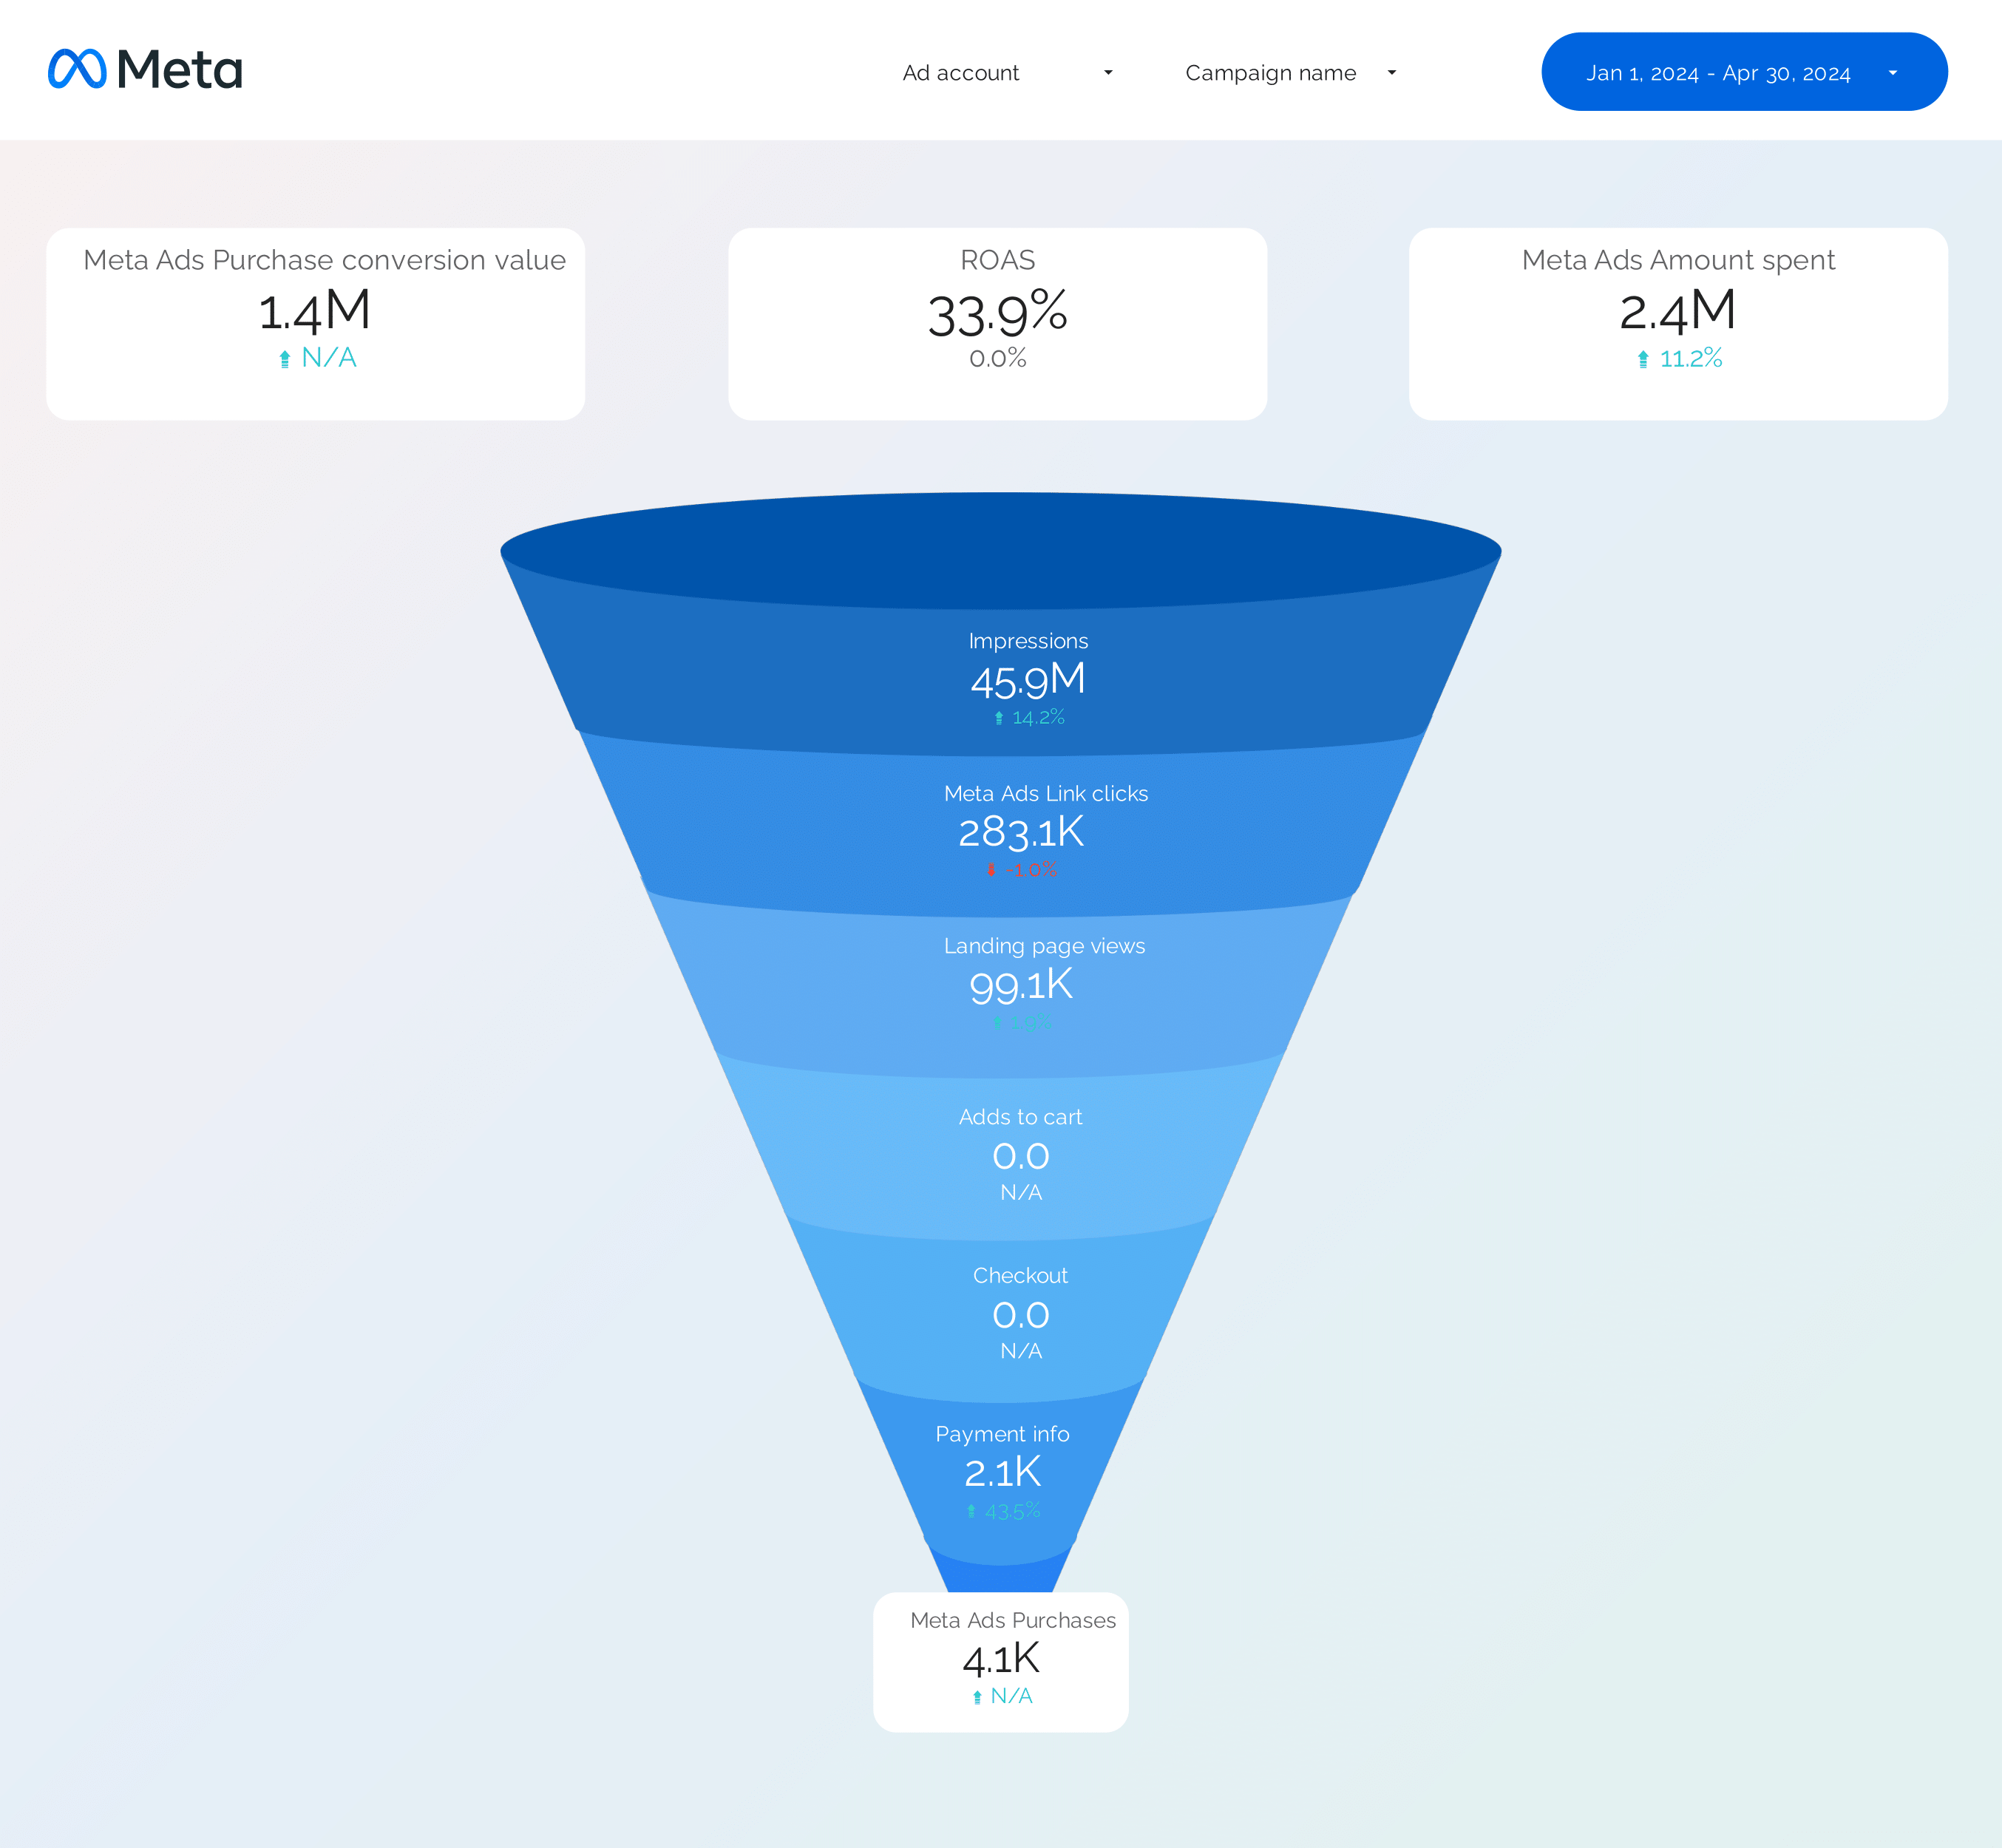
Facebook Ads Funnel Report template for Data Studio by Porter
Track awareness reach → consideration clicks → conversion ROAS by stage. Segment by funnel stage, audience.
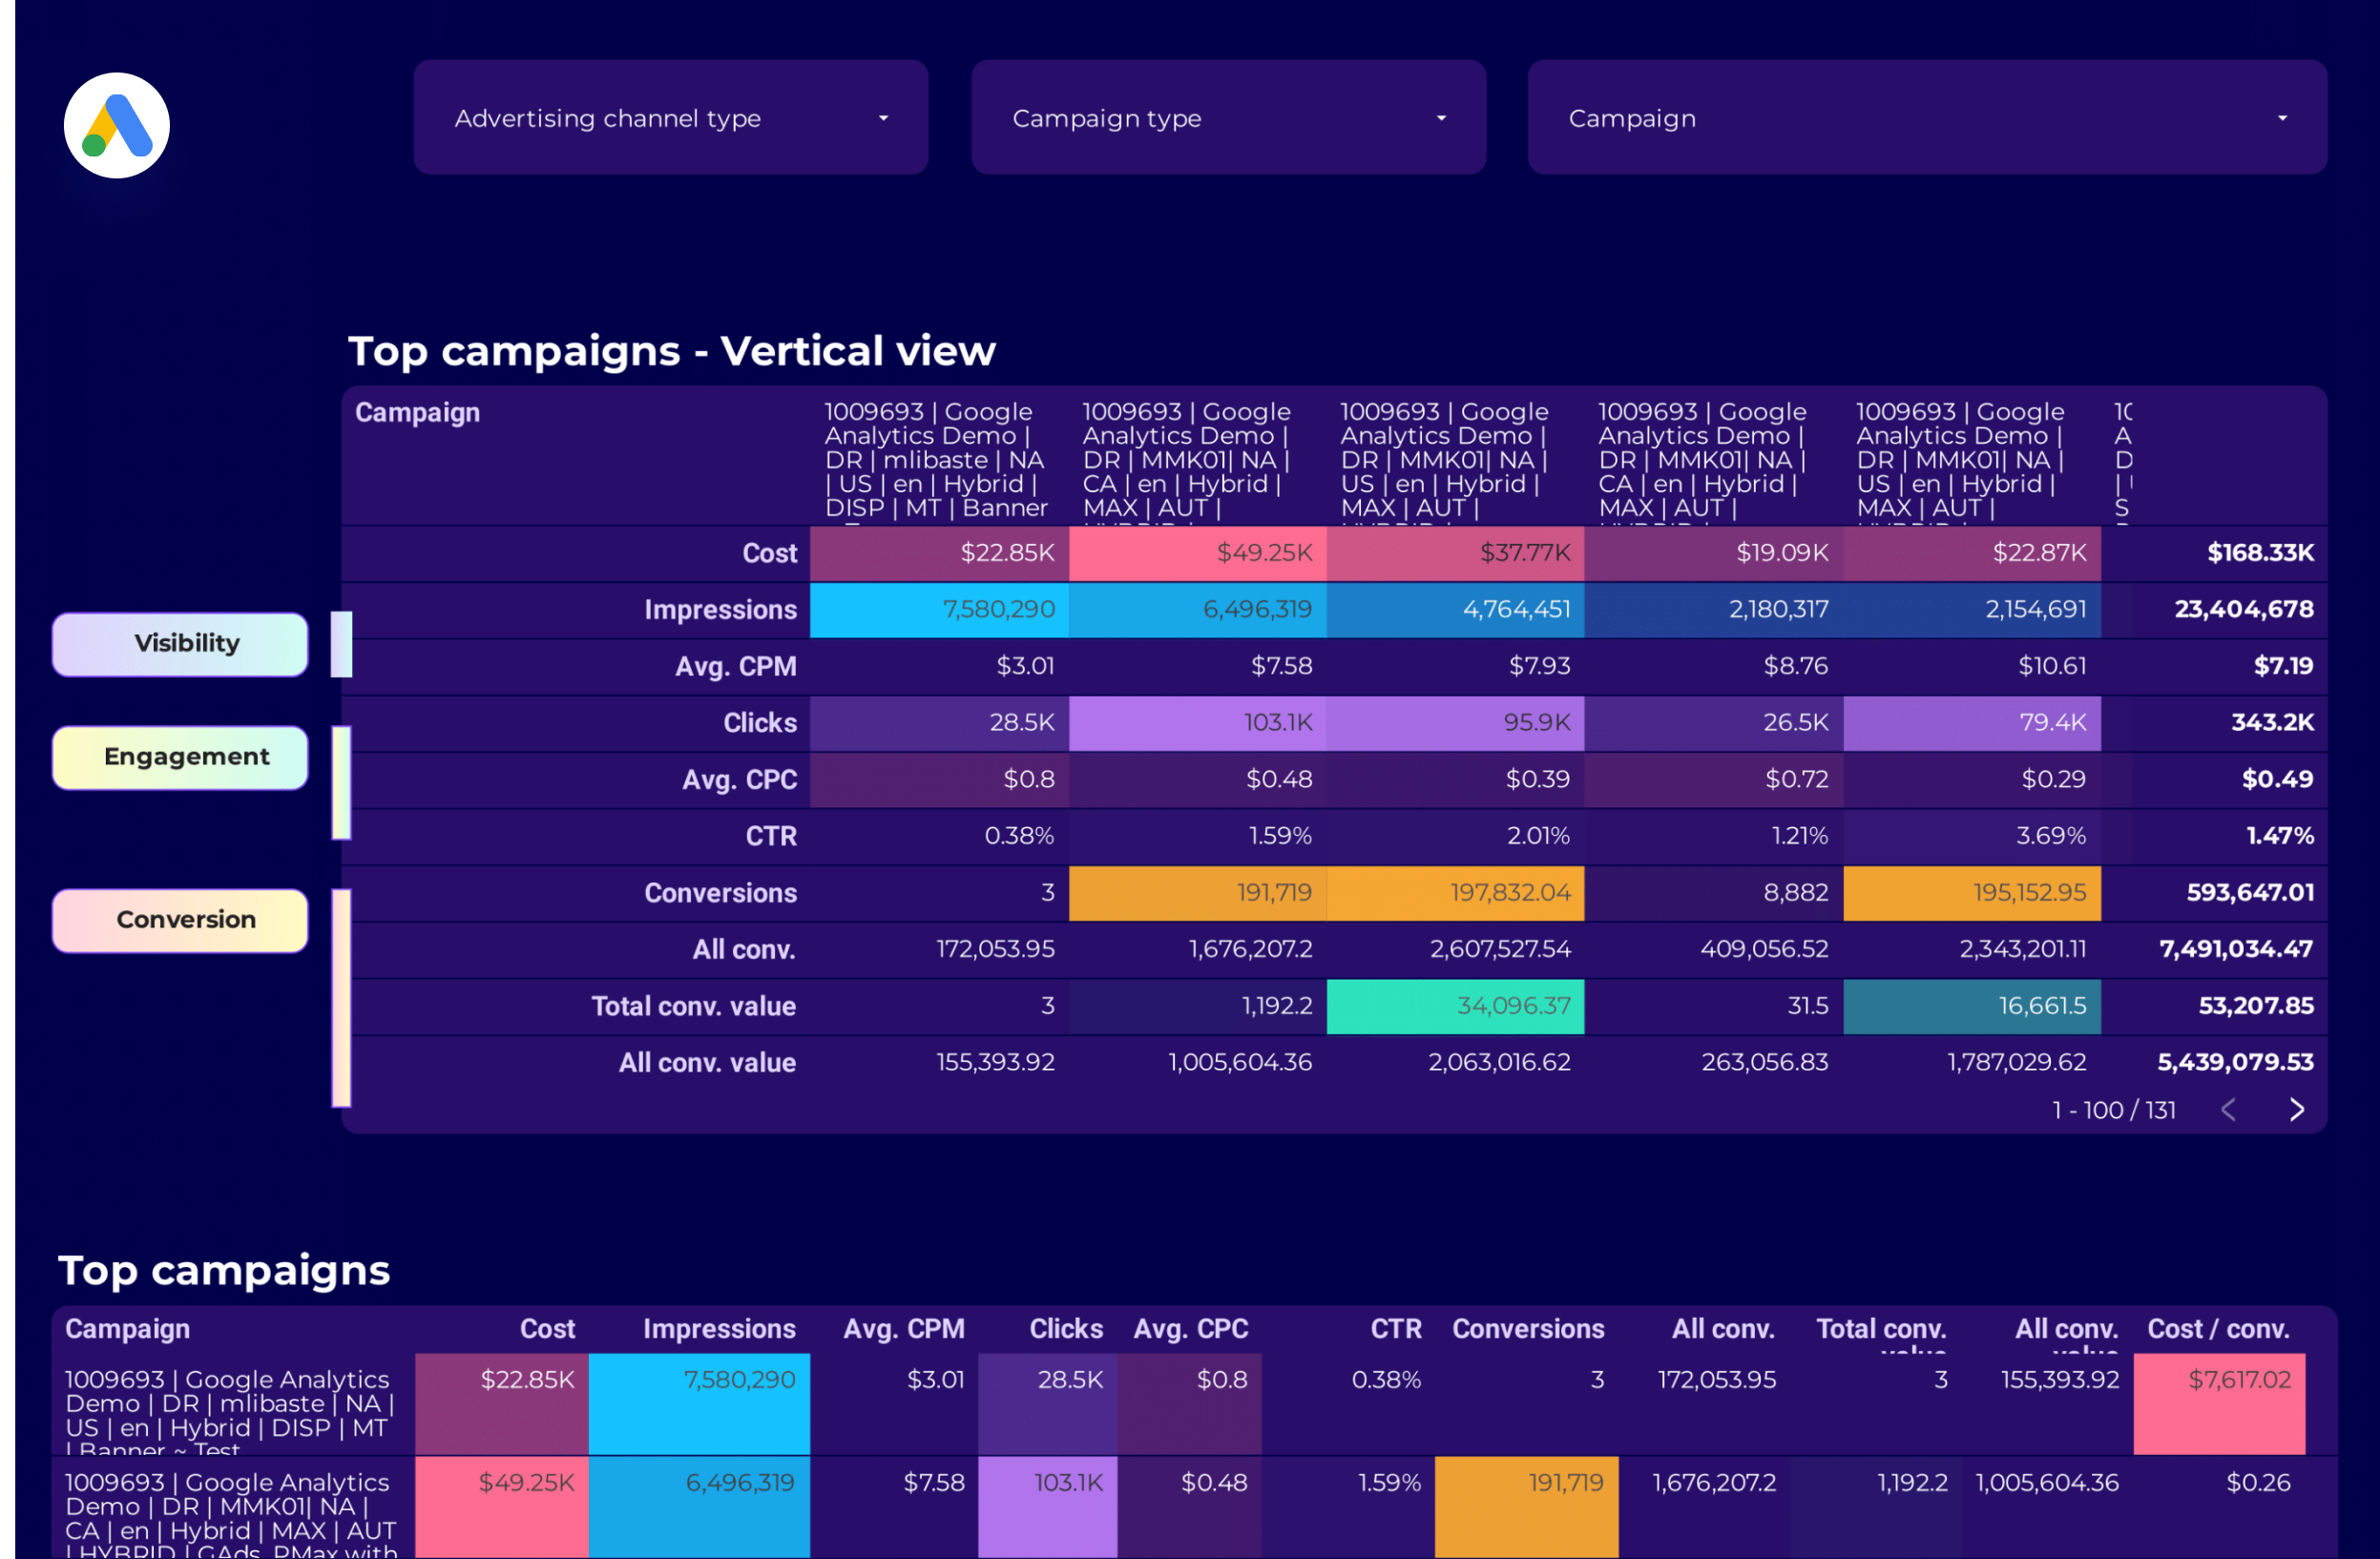
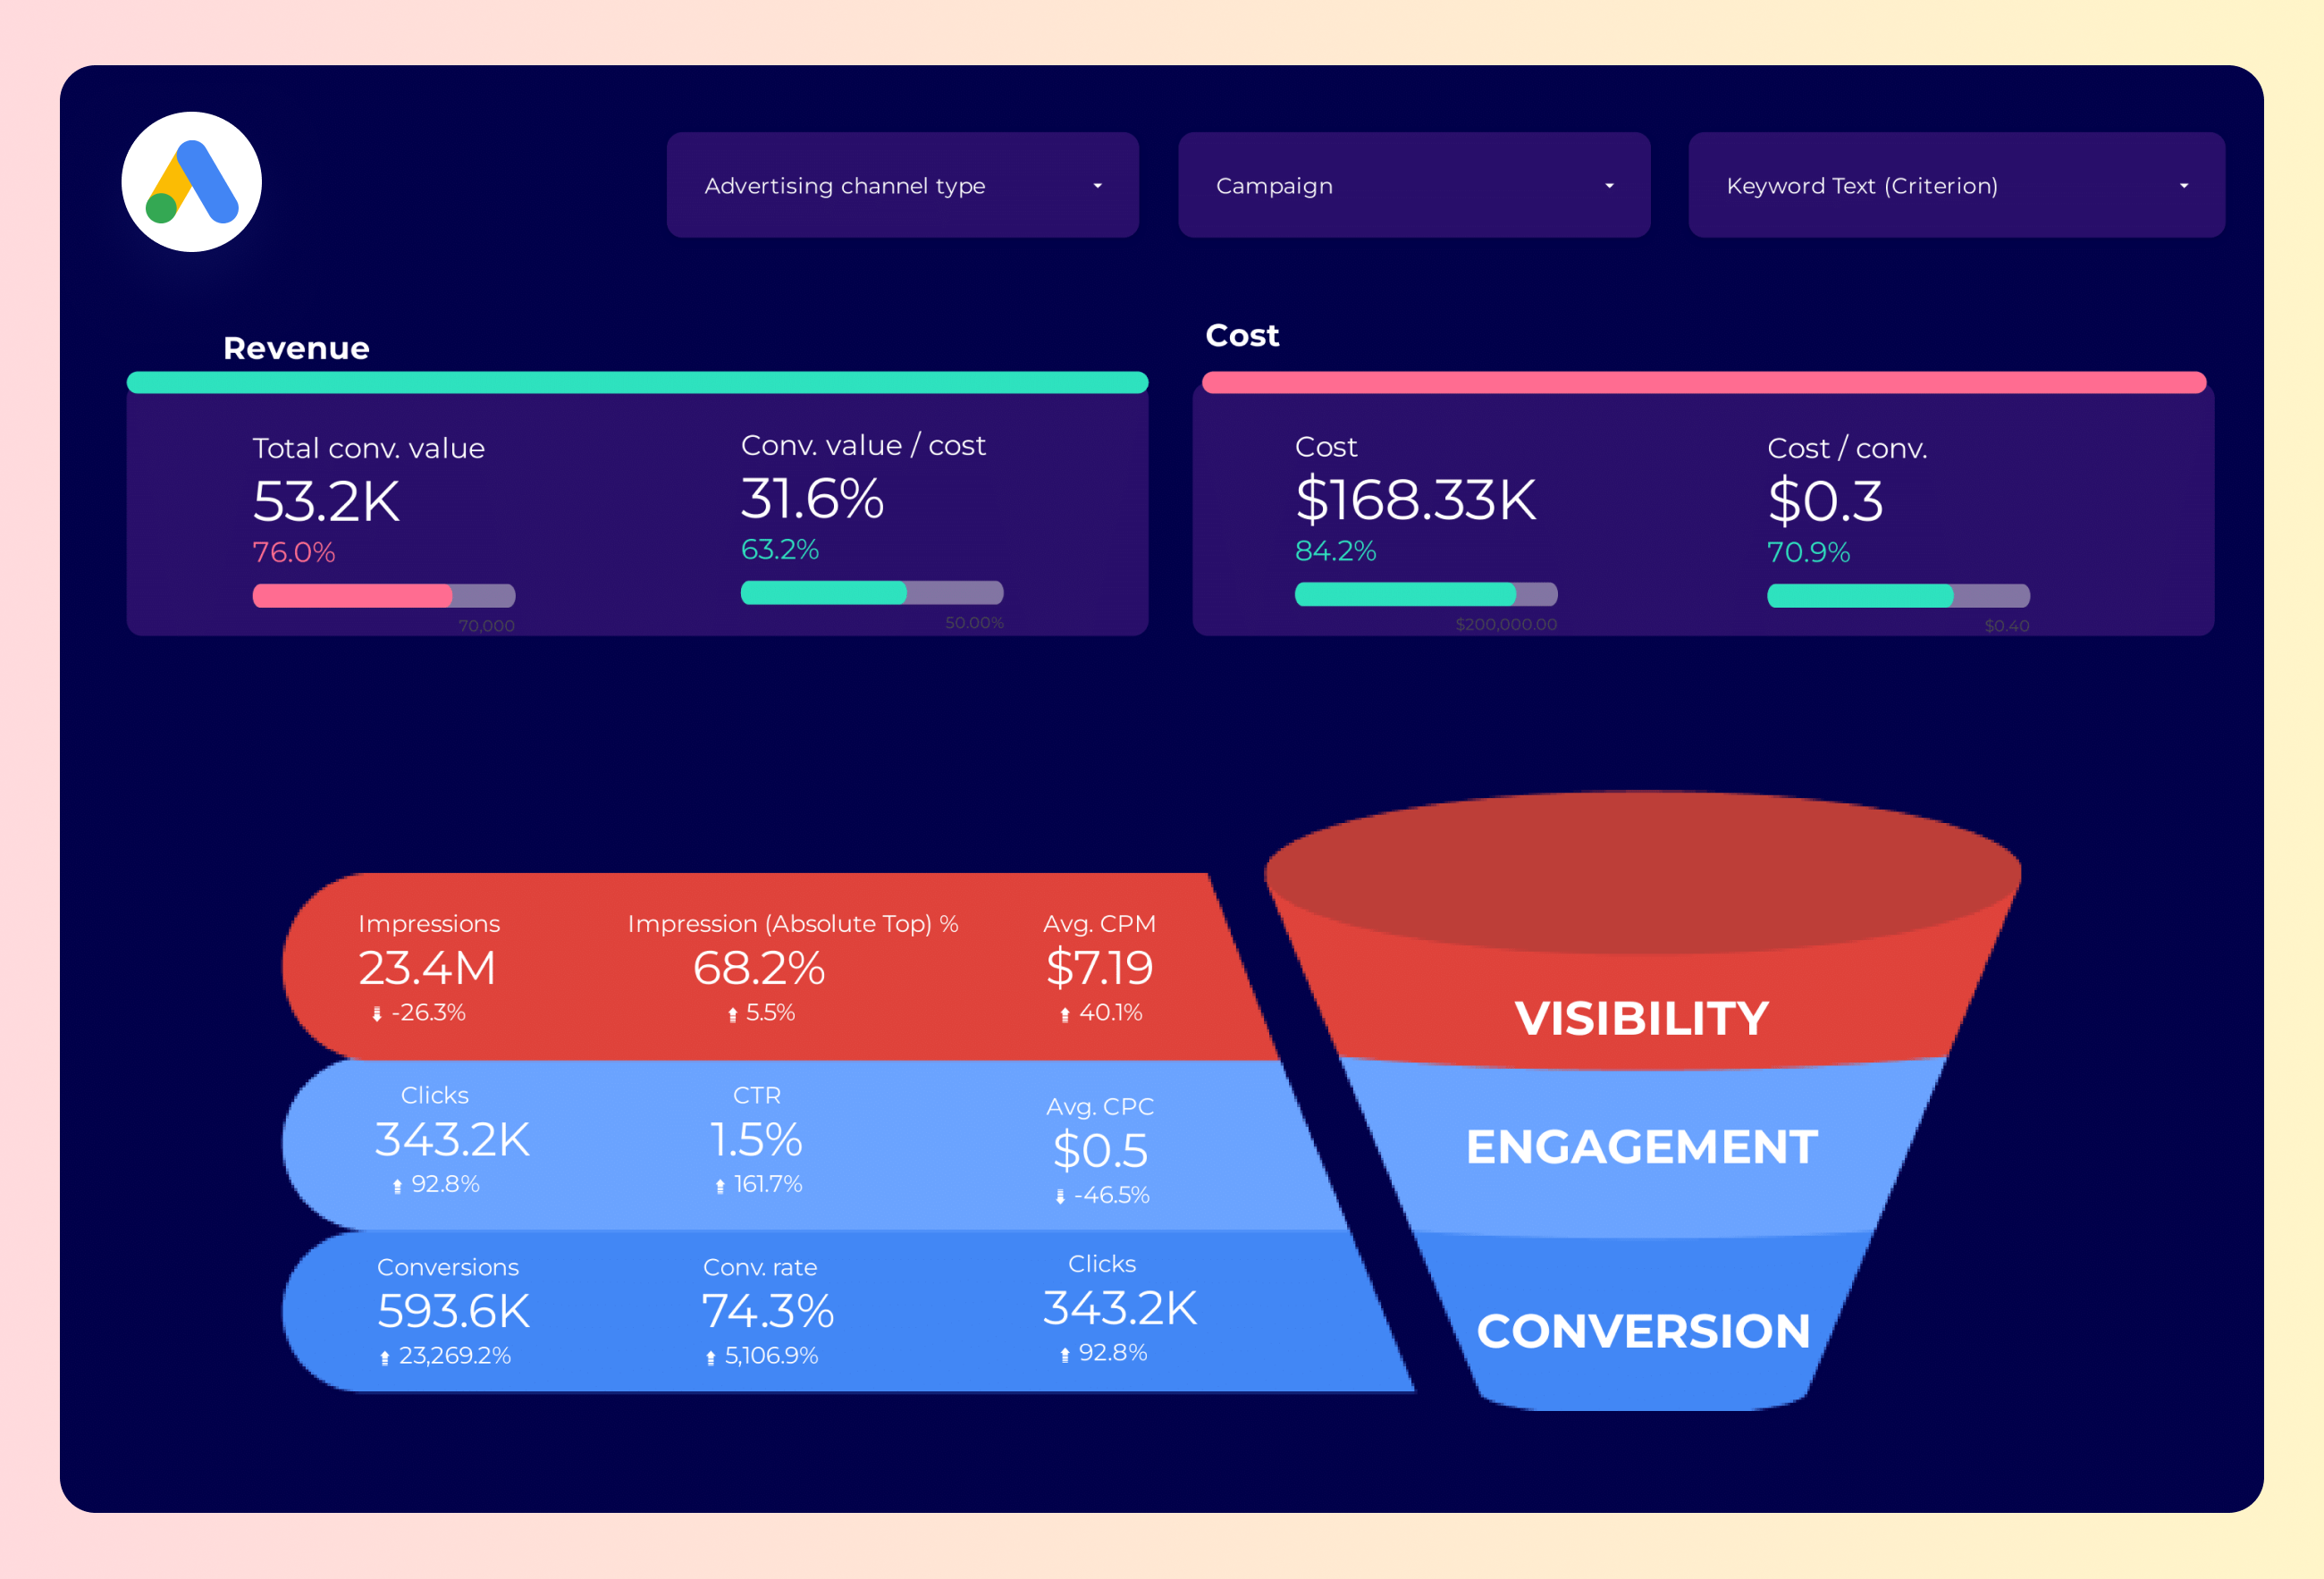
Google Ads Campaign performance Report template for Data Studio by Porter
Track campaign impressions, reach → CTR, CPC by campaign → ROAS, conversions per campaign. Segment by campaign, network, device.
Cross-channel Report template for Data Studio by Porter
Track unified impressions, reach → cross-platform CTR comparison → attributed conversions, blended ROAS. Segment by platform, campaign, audience.

PPC multi-channel Report template for Data Studio by Porter
Track cross-platform impressions → CTR comparison by platform → blended ROAS, CPA by platform. Segment by platform, campaign type.
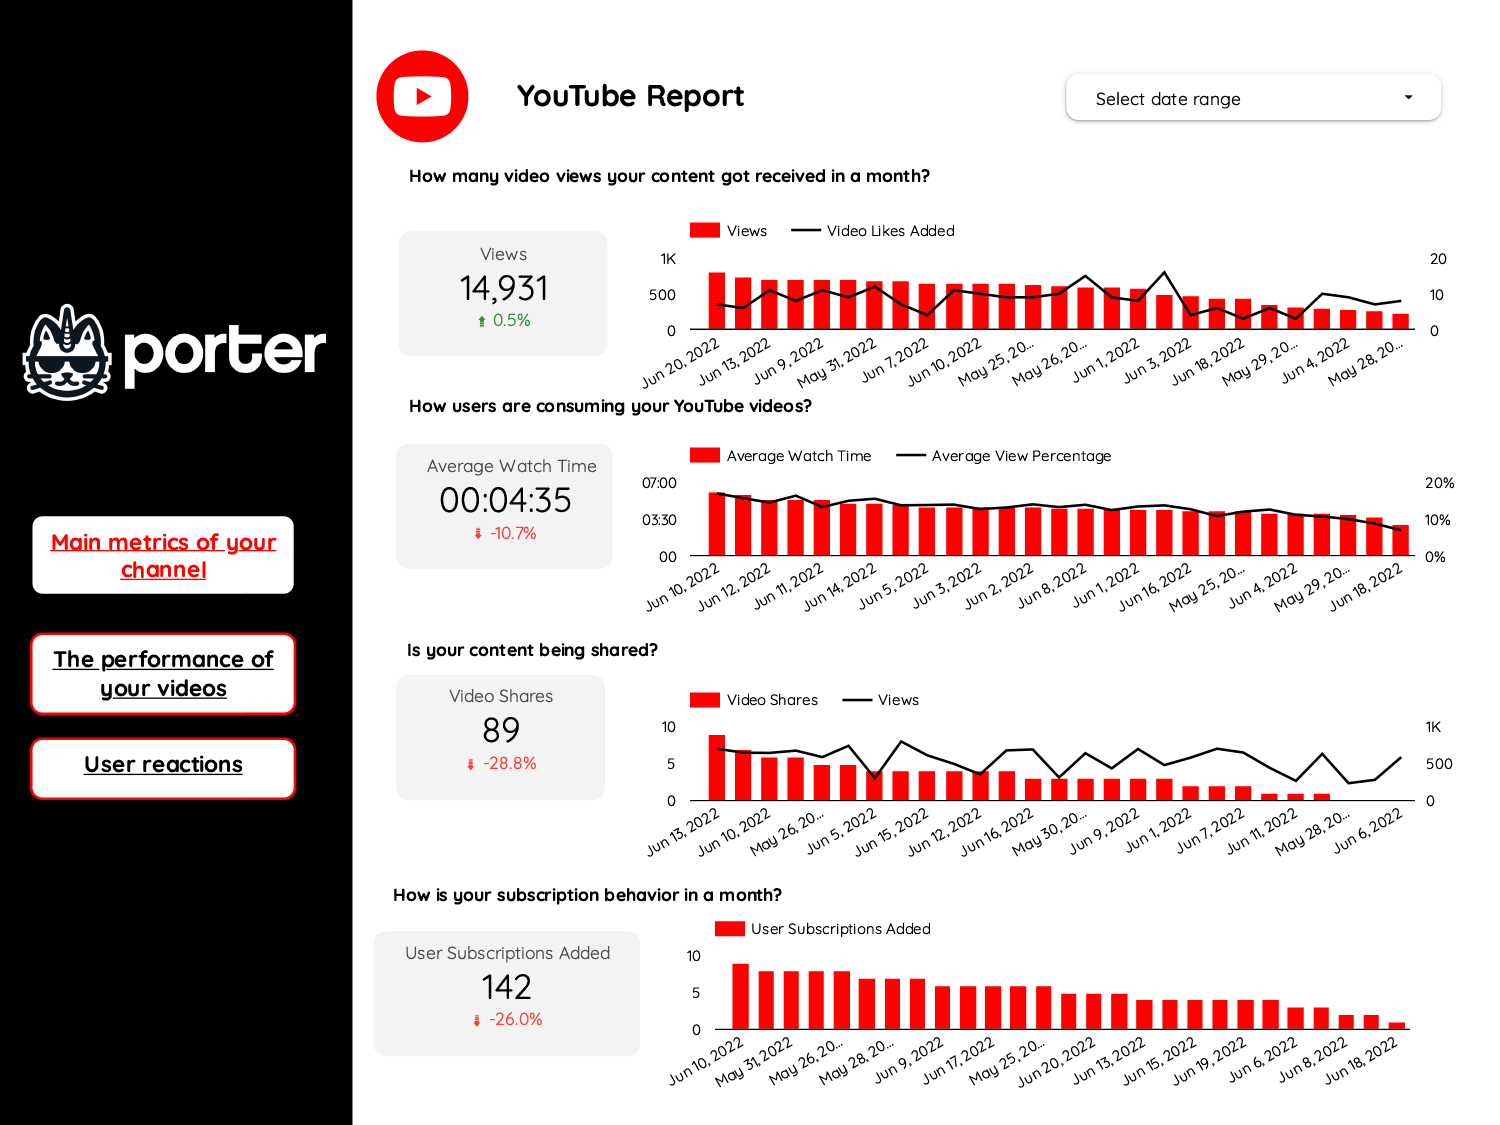
Video marketing Report template for Data Studio by Porter
Track video views, reach → watch time, completion rate → CTA clicks, subscriber growth. Segment by platform, video type.
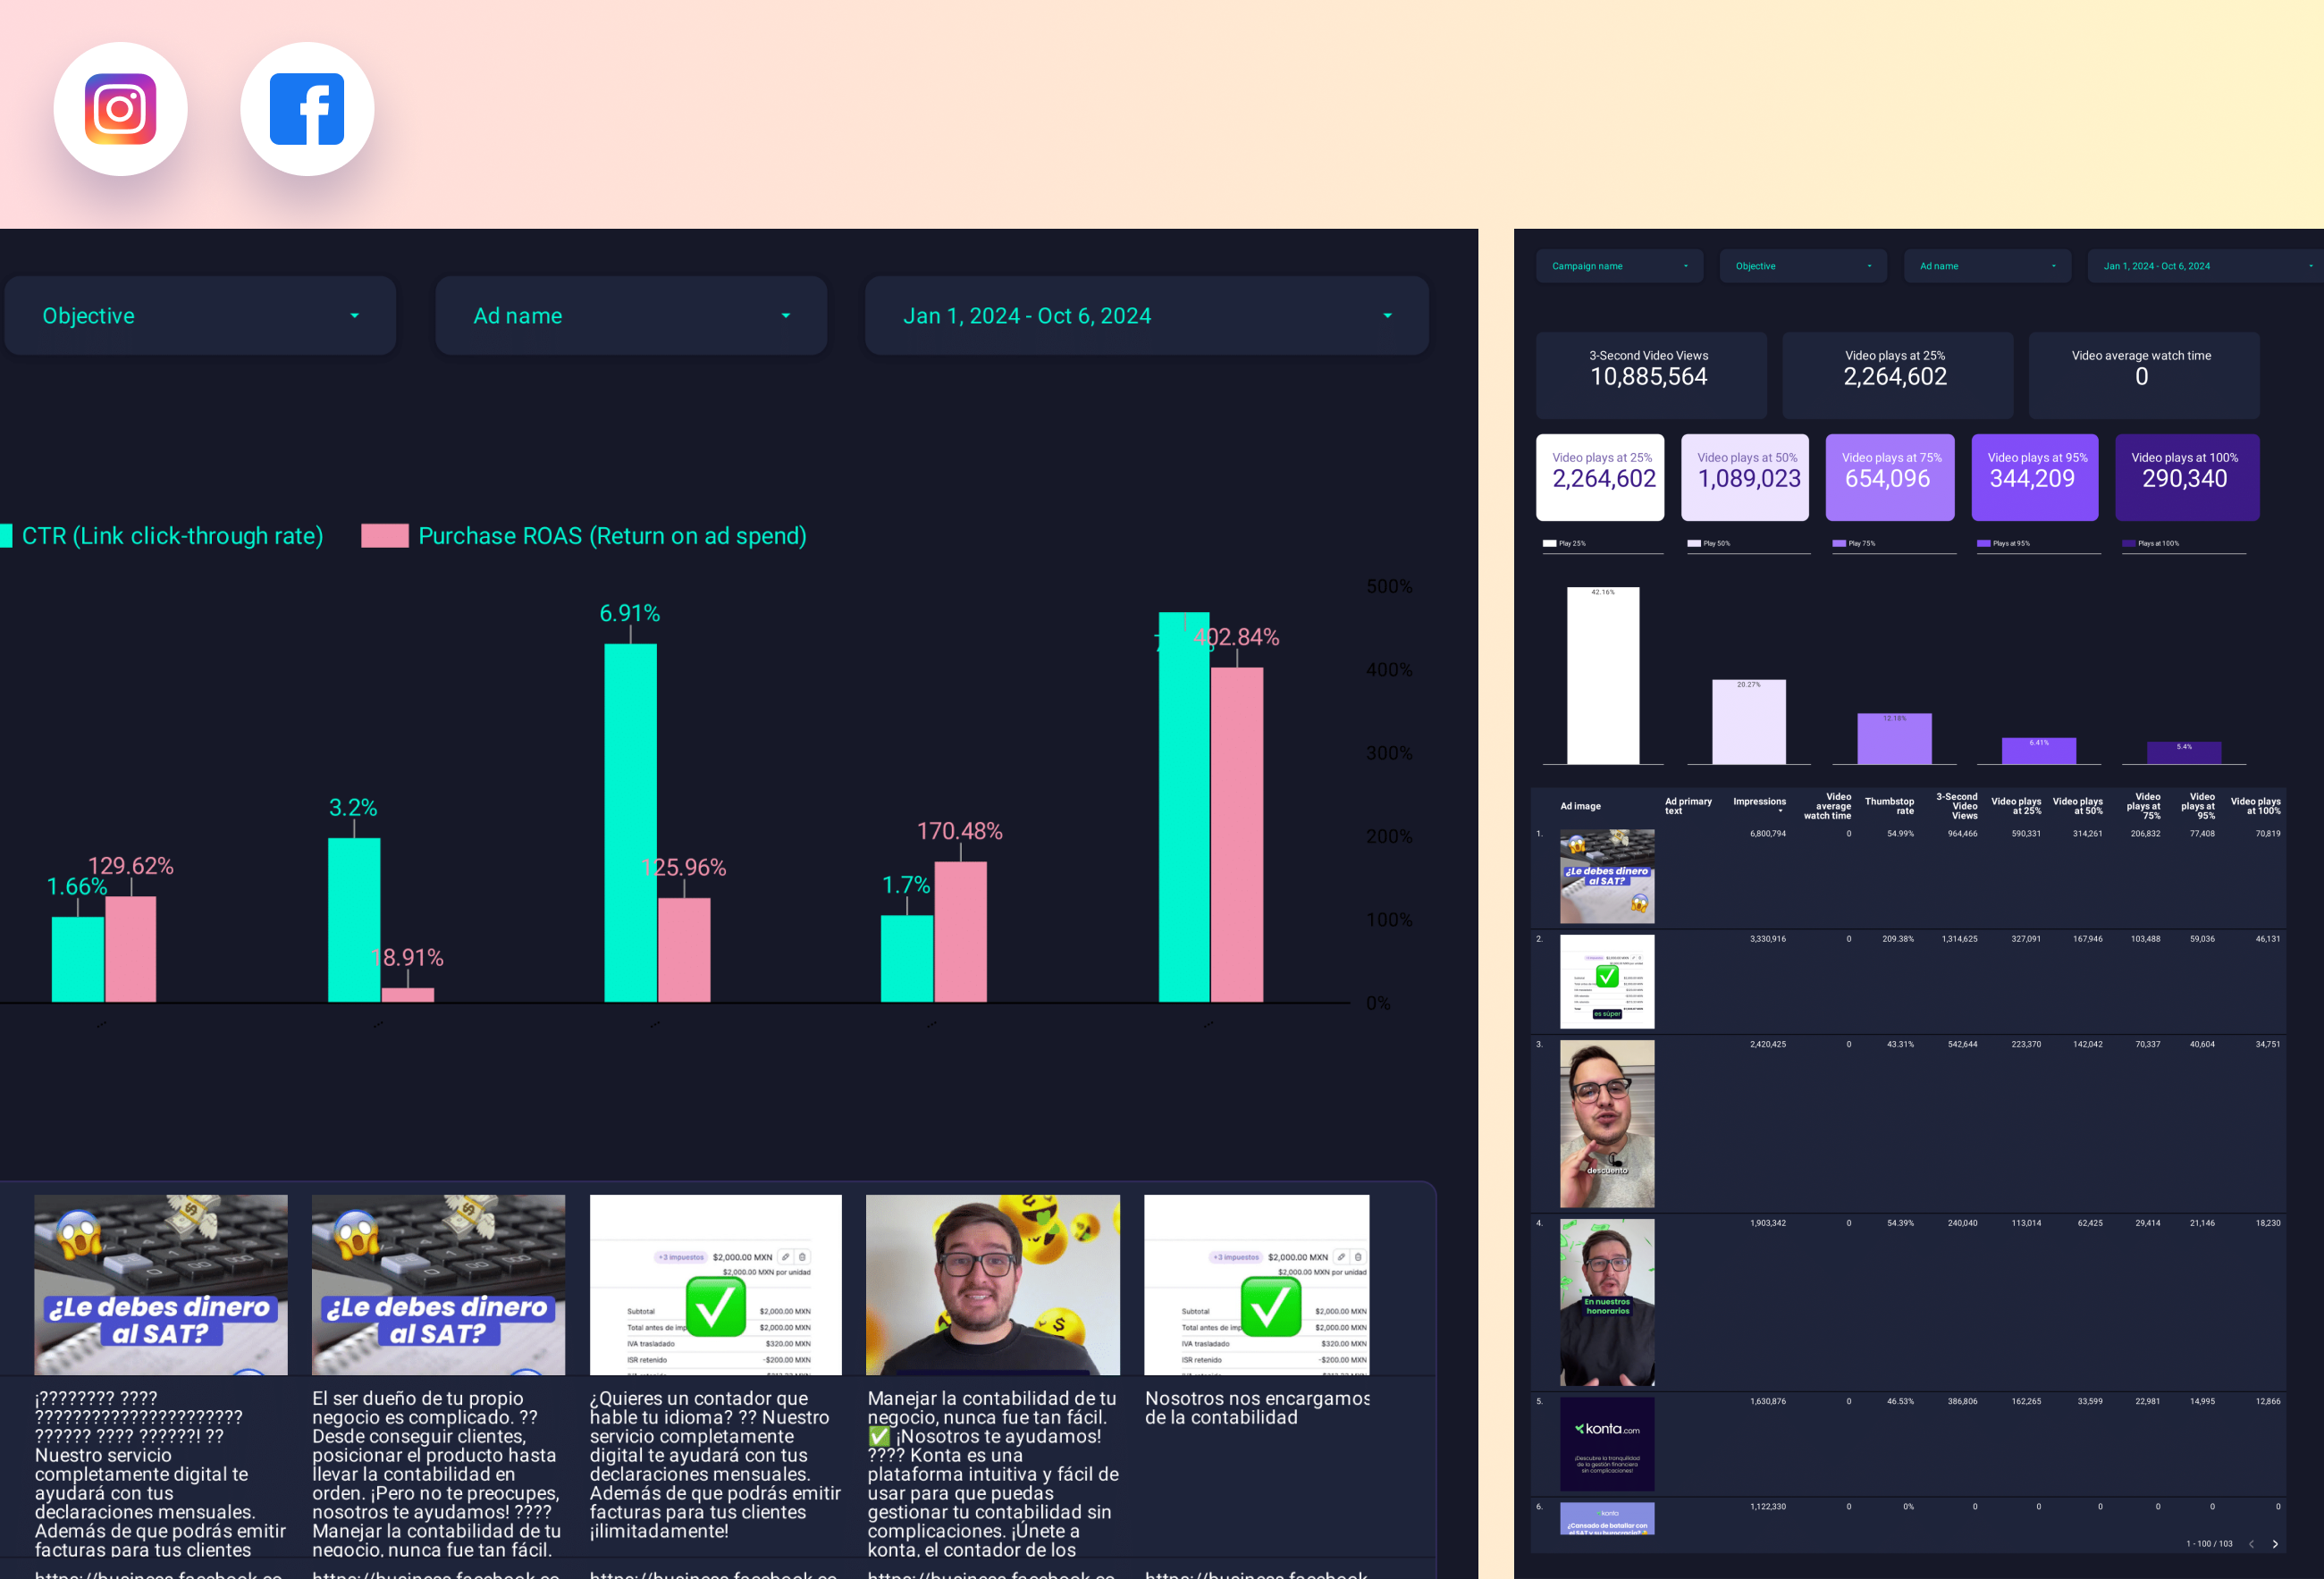
Paid media Creative performance Report template for Data Studio by Porter
Track creative reach, frequency → CTR, view rate by creative → ROAS per creative, CPA. Segment by creative format, platform.

