

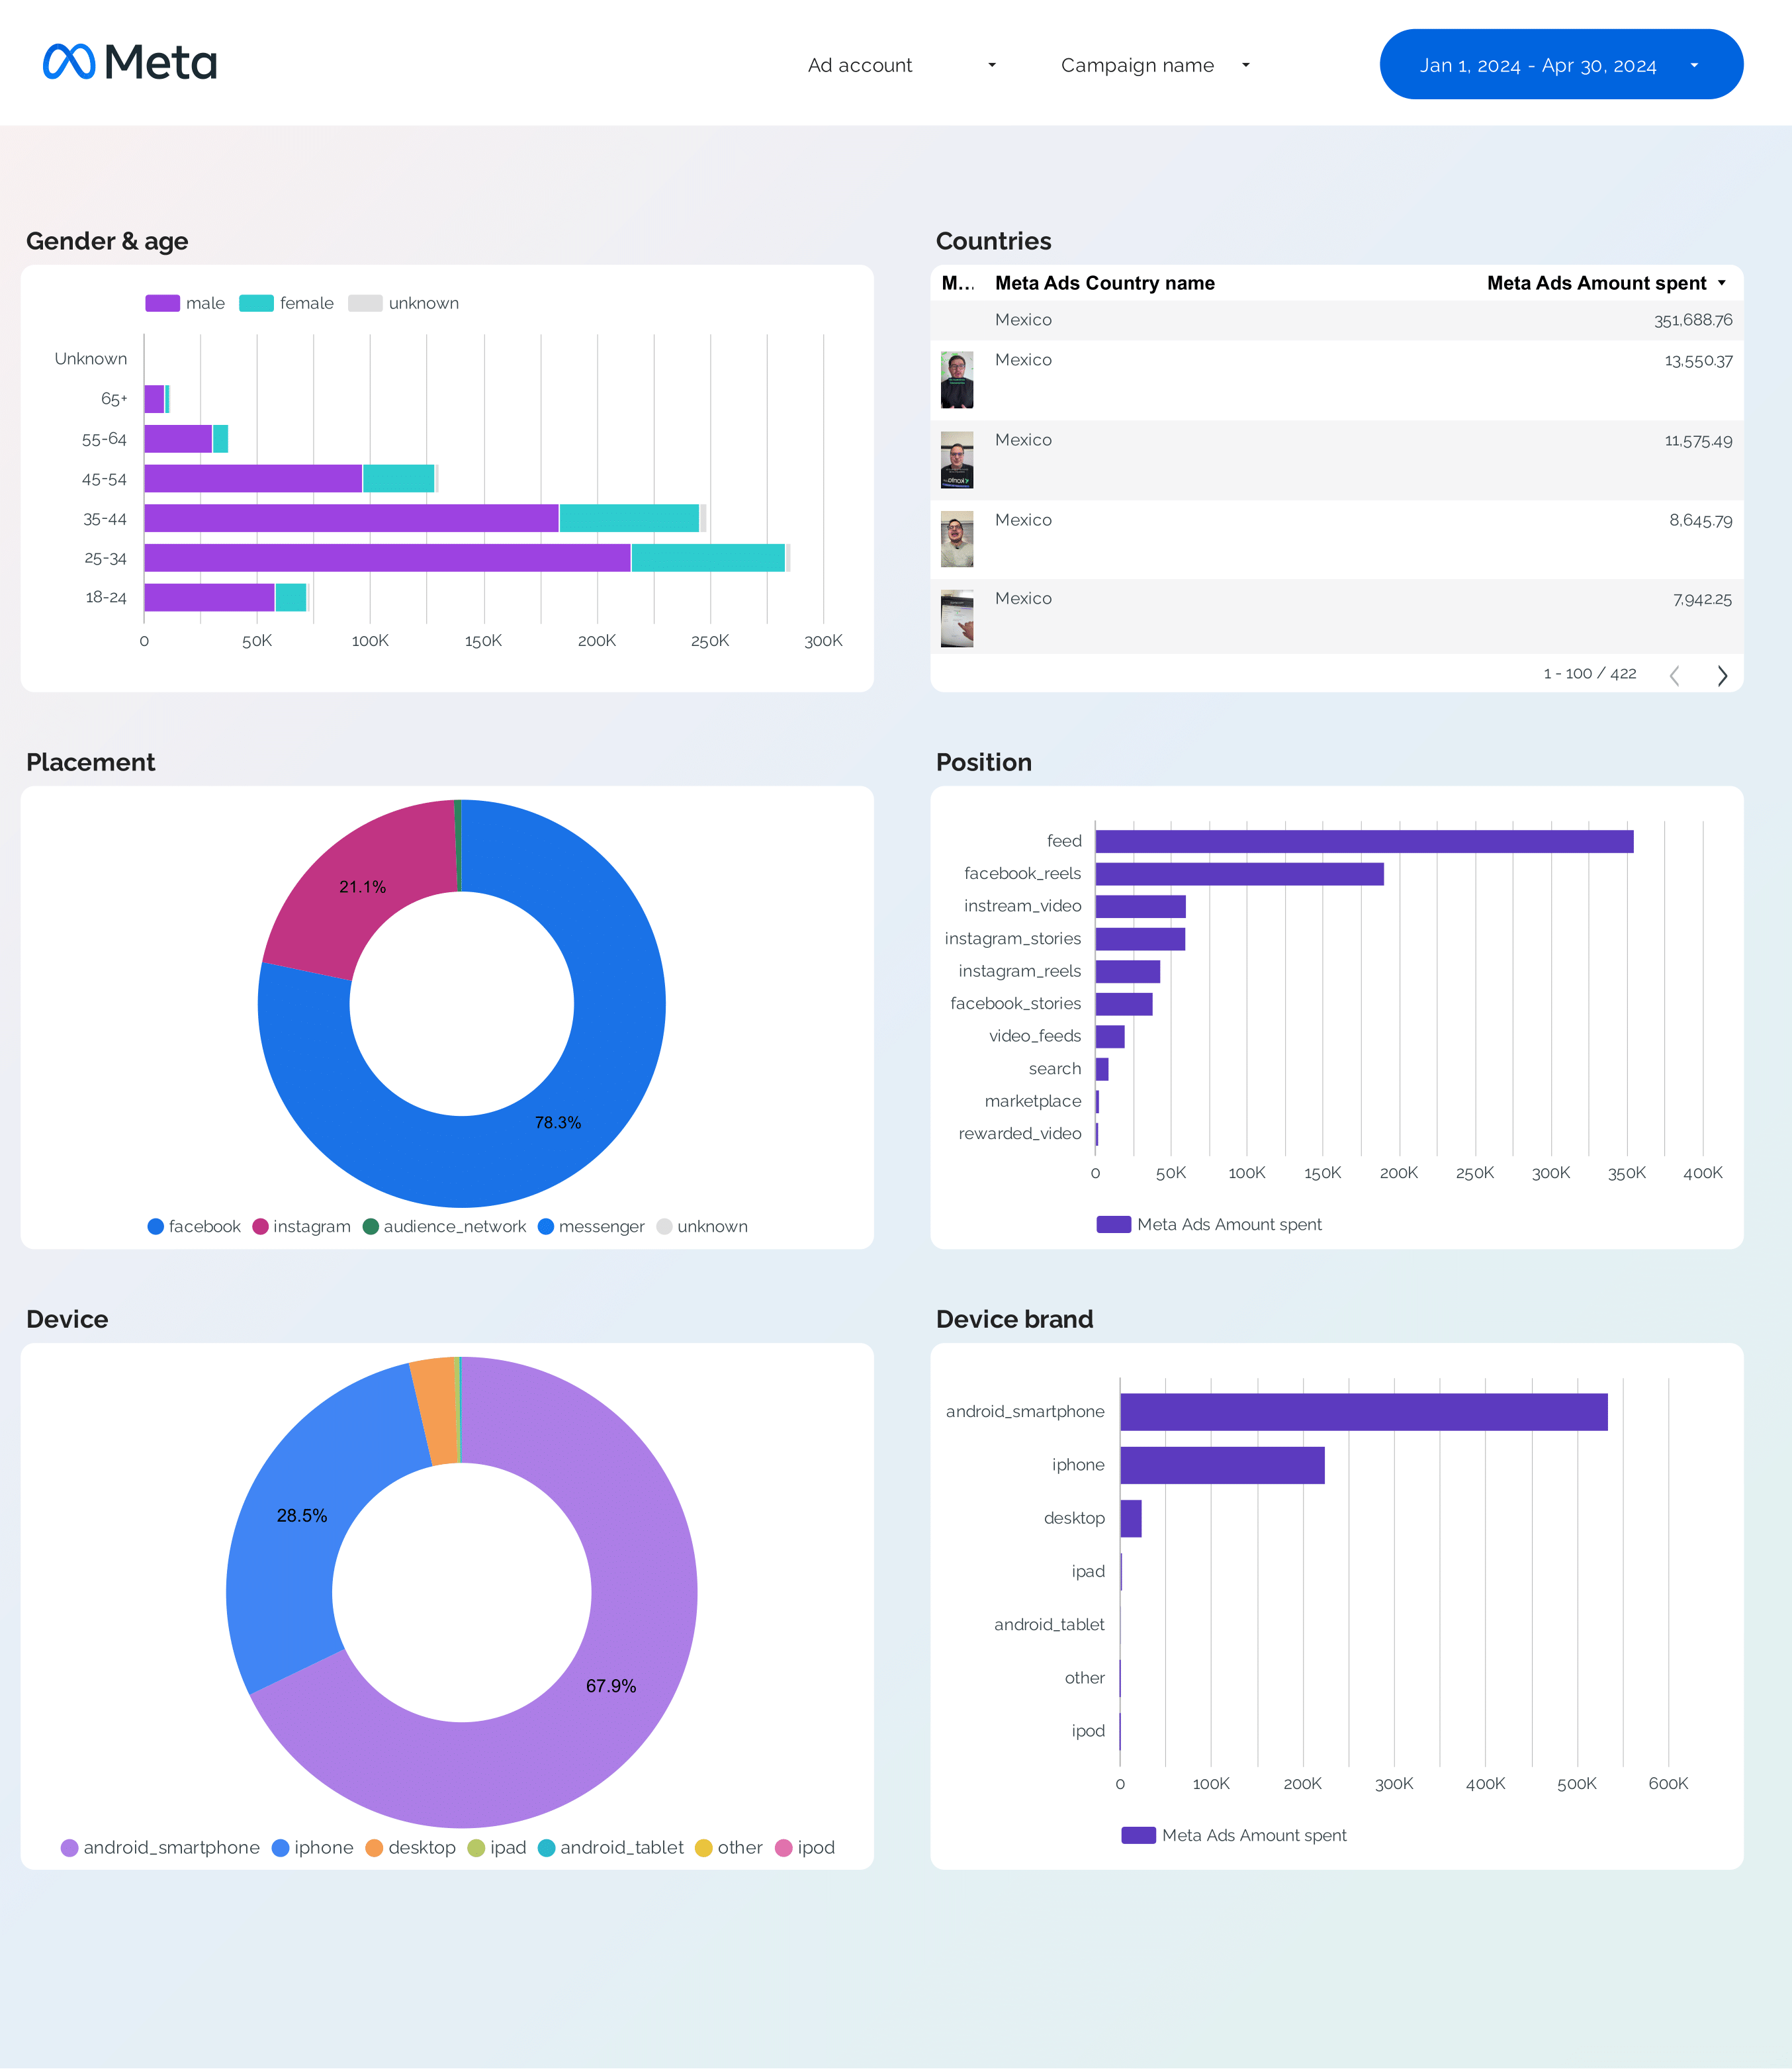
Facebook Ads Audience Report template for Marketing teams and agencies
Get the actual Facebook Ads Audience on Looker Studio template used by Porter to monitor PPC performance.
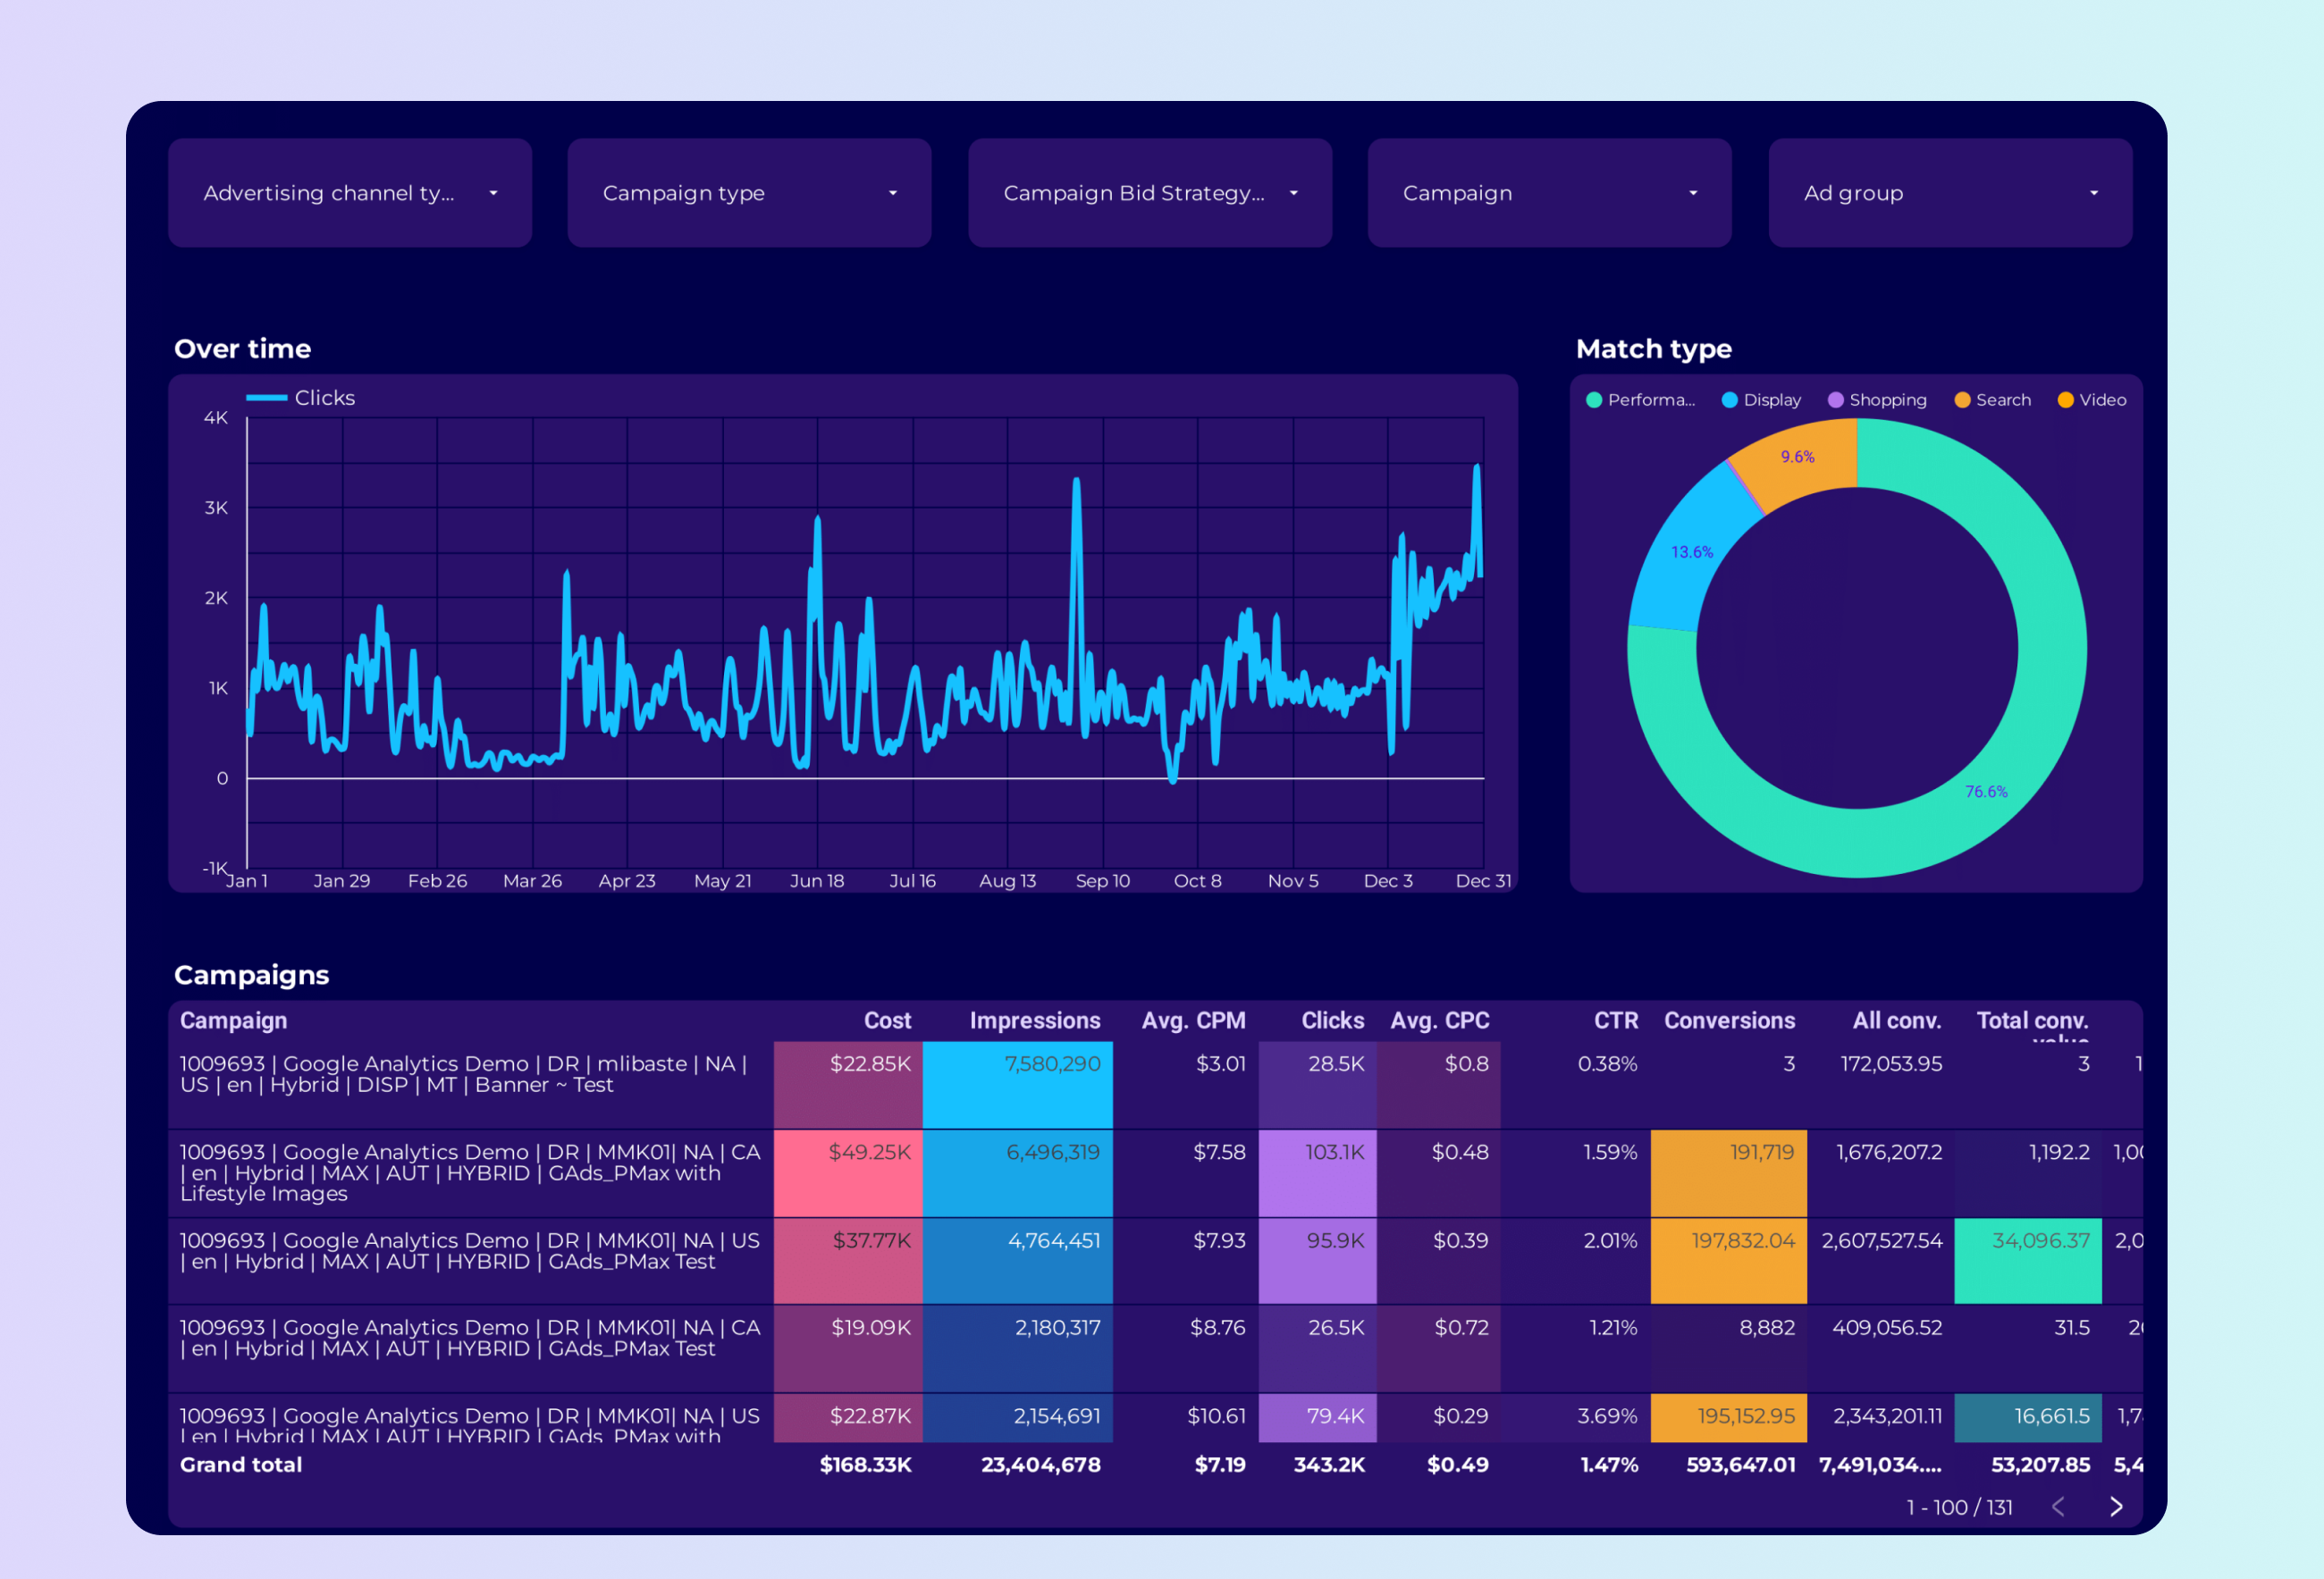
Google Ads PMax Report template for Marketing teams and agencies
Track key metrics with this Google Ads PMax report template. Measure conversion value, CTR, and impressions. Analyze by campaign type, audience segment, and time period. Consolidate data from Google Ads and Paid Media for actionable insights. Ideal for marketing teams focused on optimizing PPC performance and achieving strategic goals.
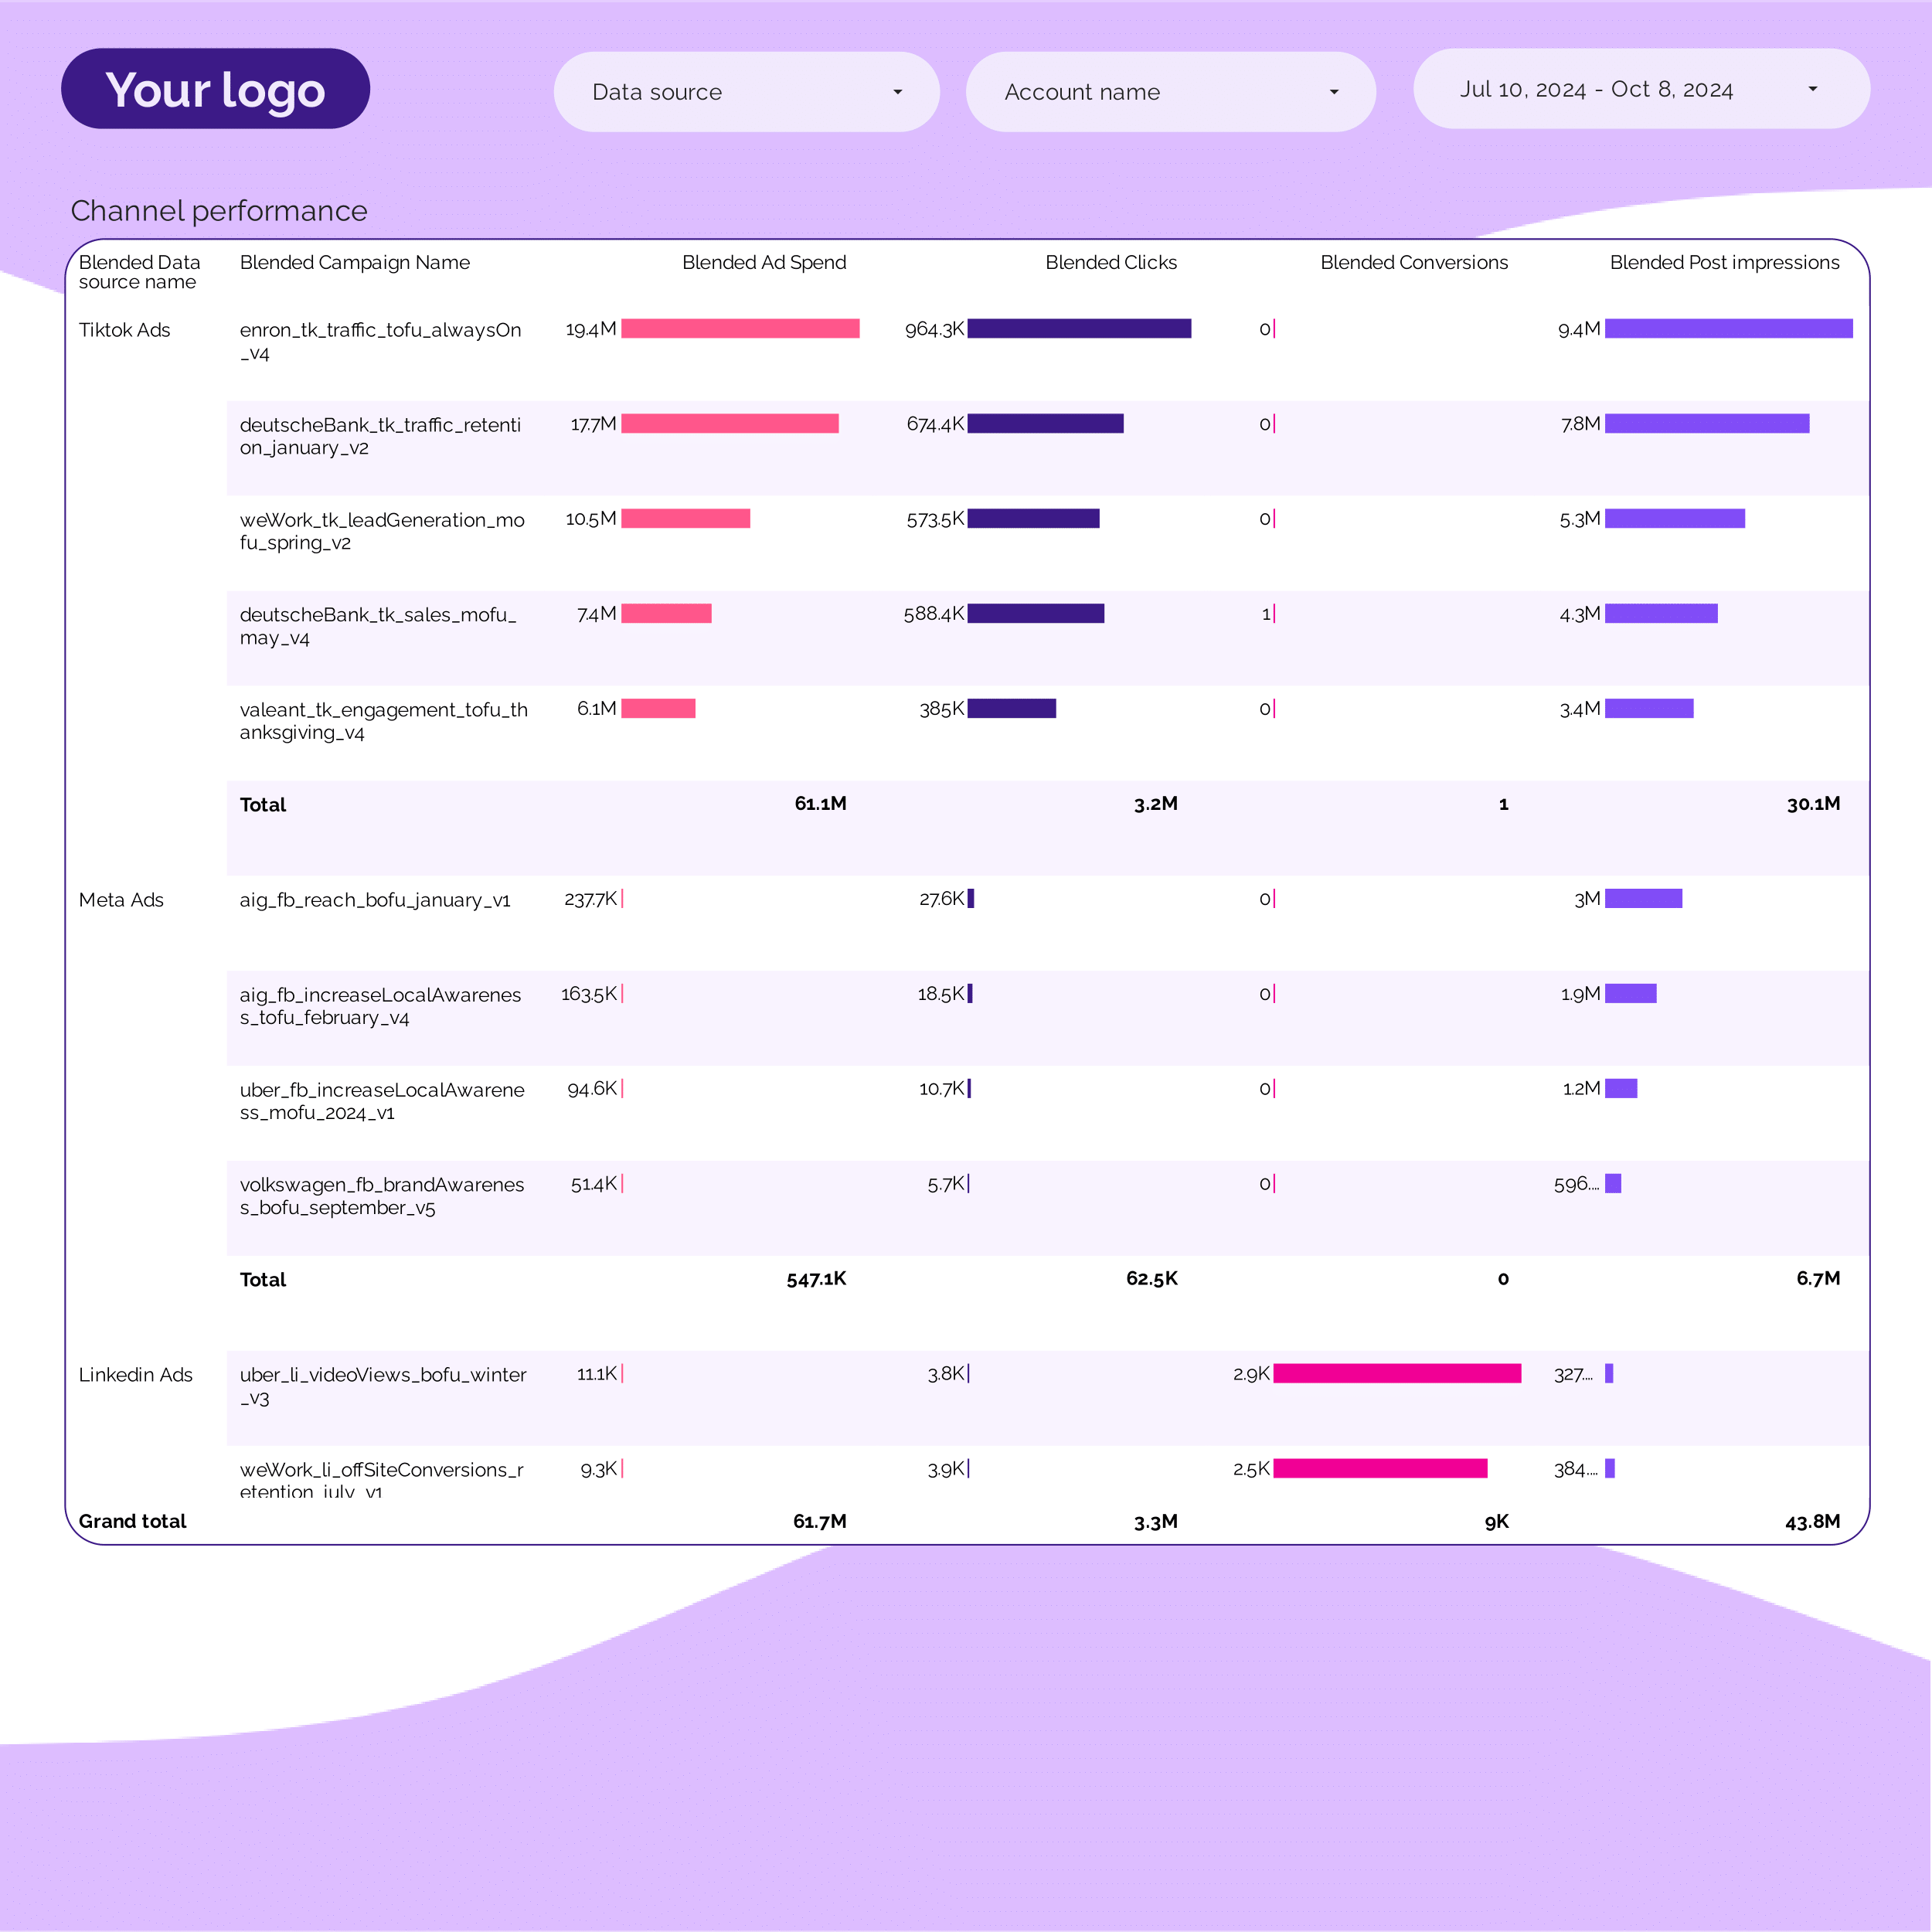
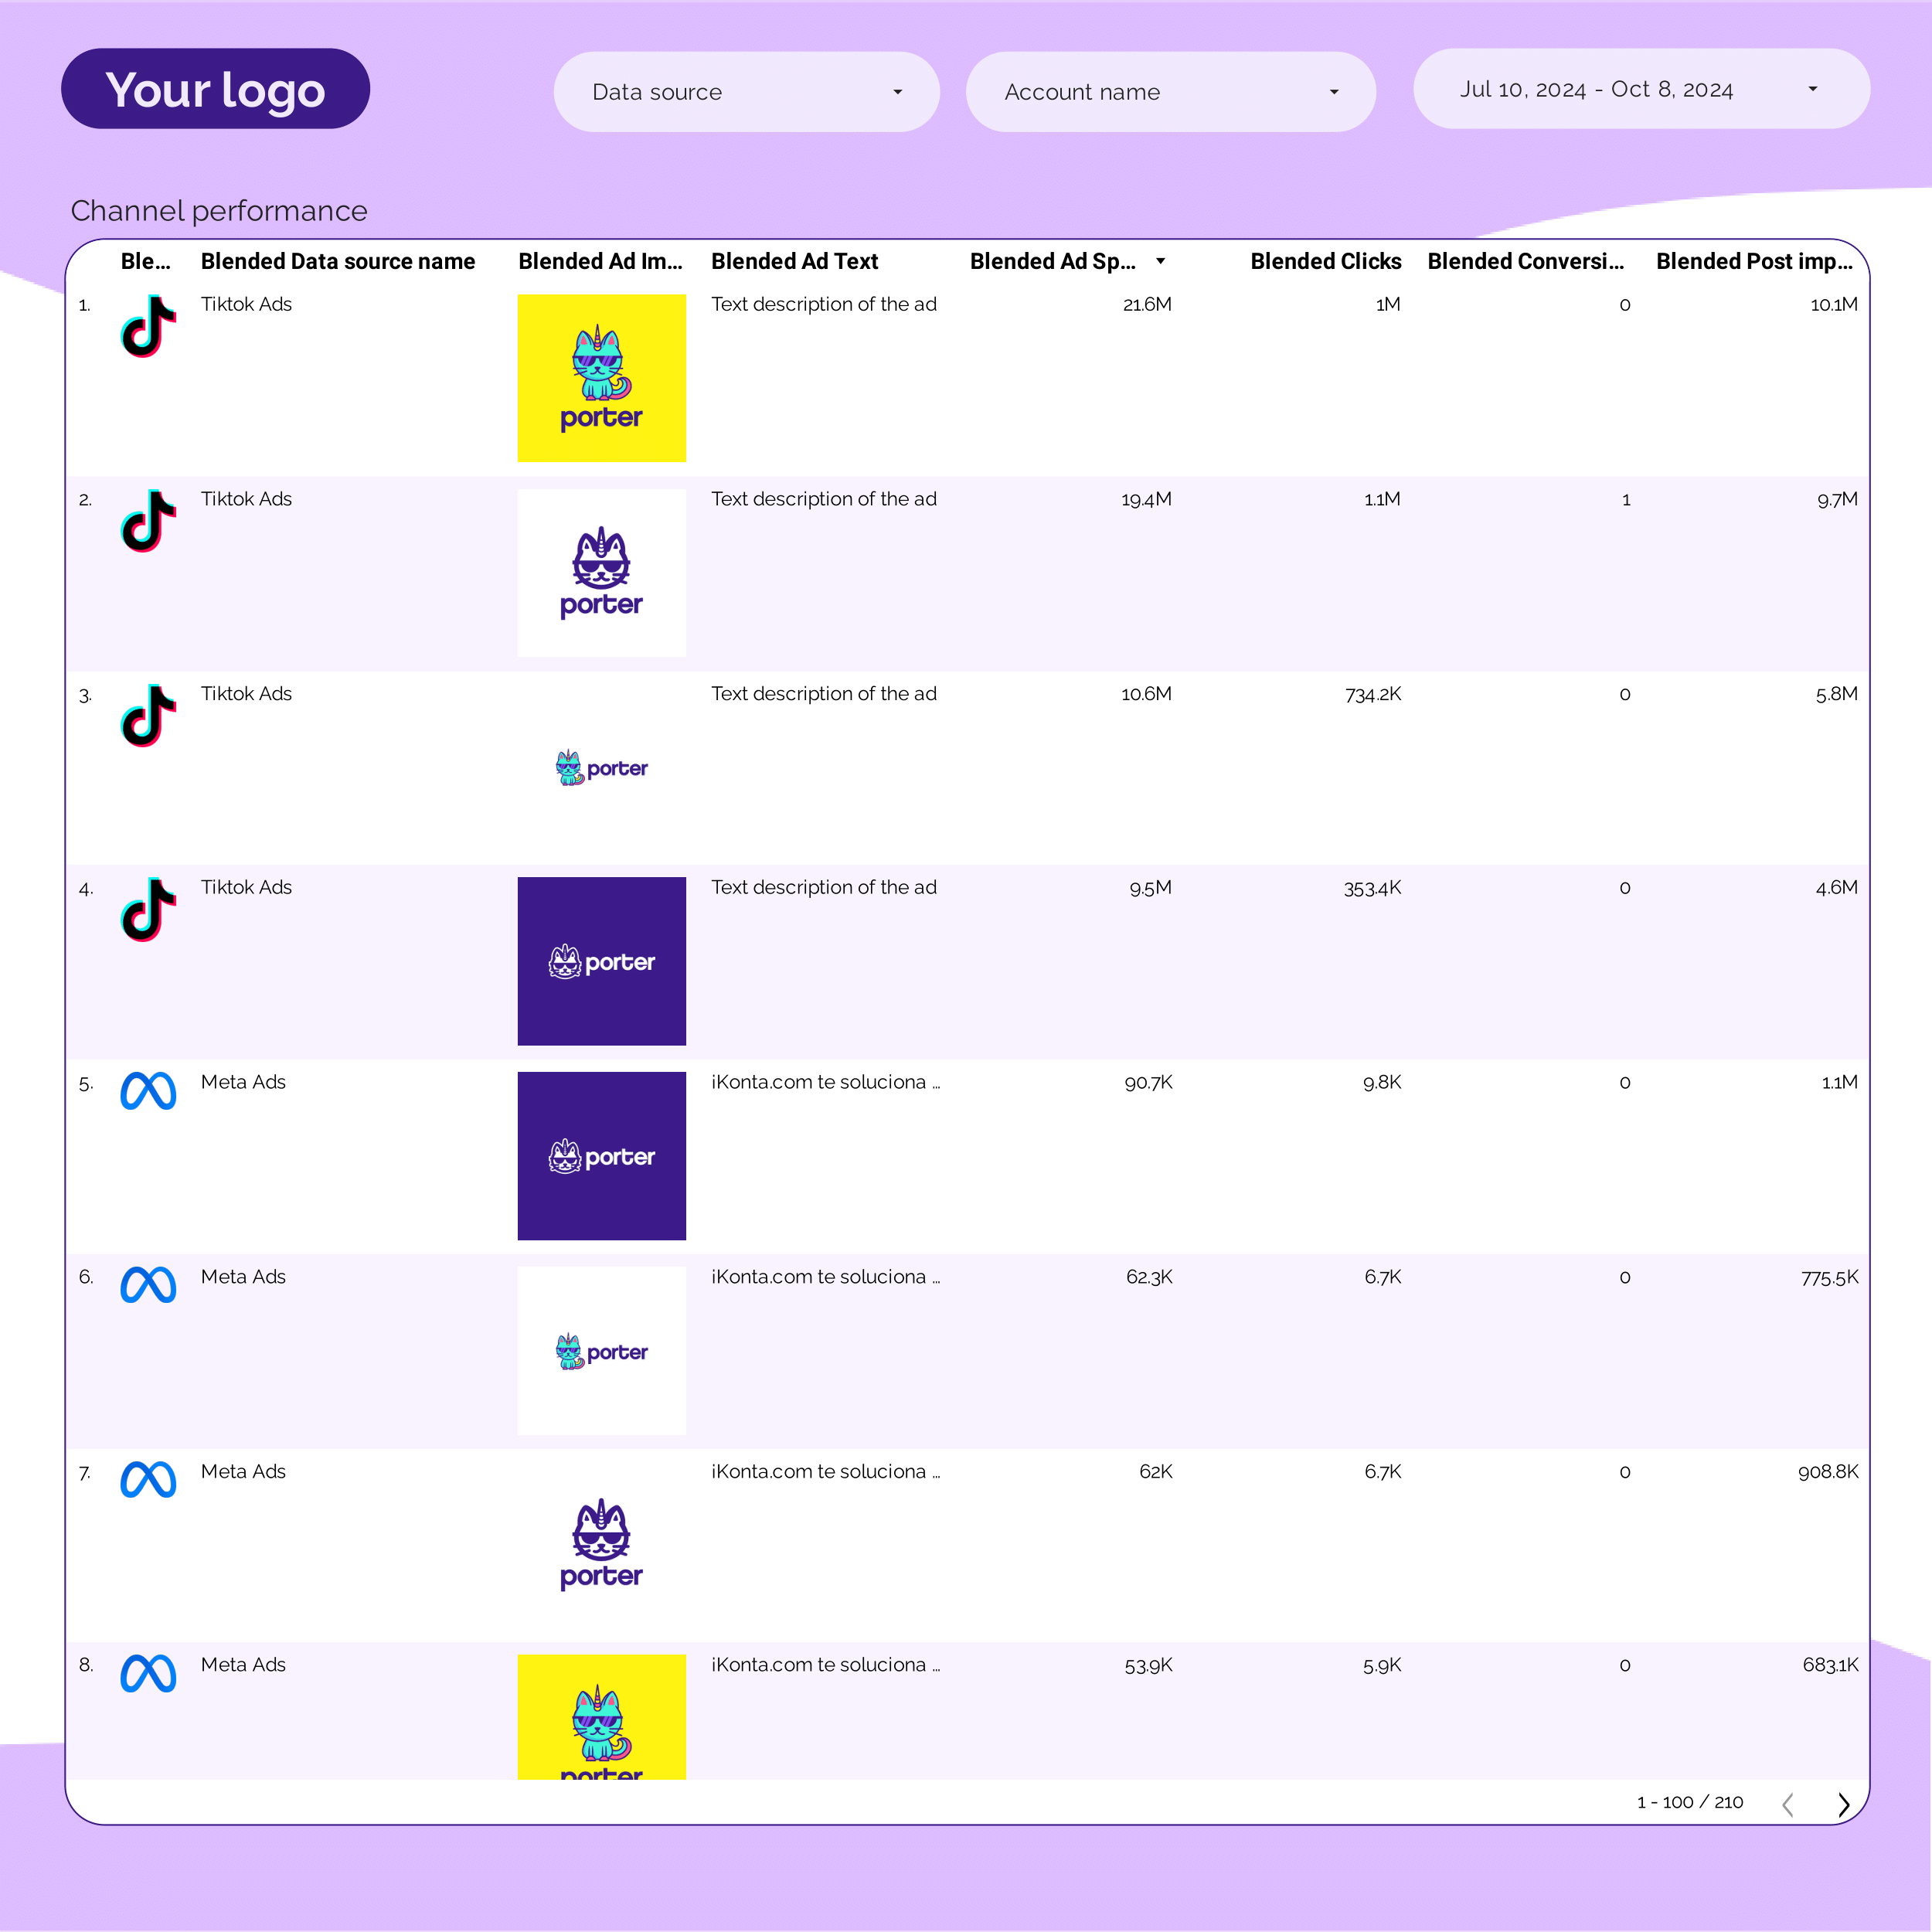
PPC Campaign performance Report template for Marketing teams and agencies
Get the actual PPC Campaign performance on Looker Studio template used by Porter to monitor PPC performance.
Twitter Ads Report template for Marketing teams and agencies
Analyze key metrics like CTR, conversion rate, and social actions with this Twitter Ads report template. Track performance by campaign objective, ad format, and audience targeting. Segment data by time, location, gender, and age. Perfect for PPC specialists to consolidate Twitter Ads and Paid Media strategies for actionable insights.

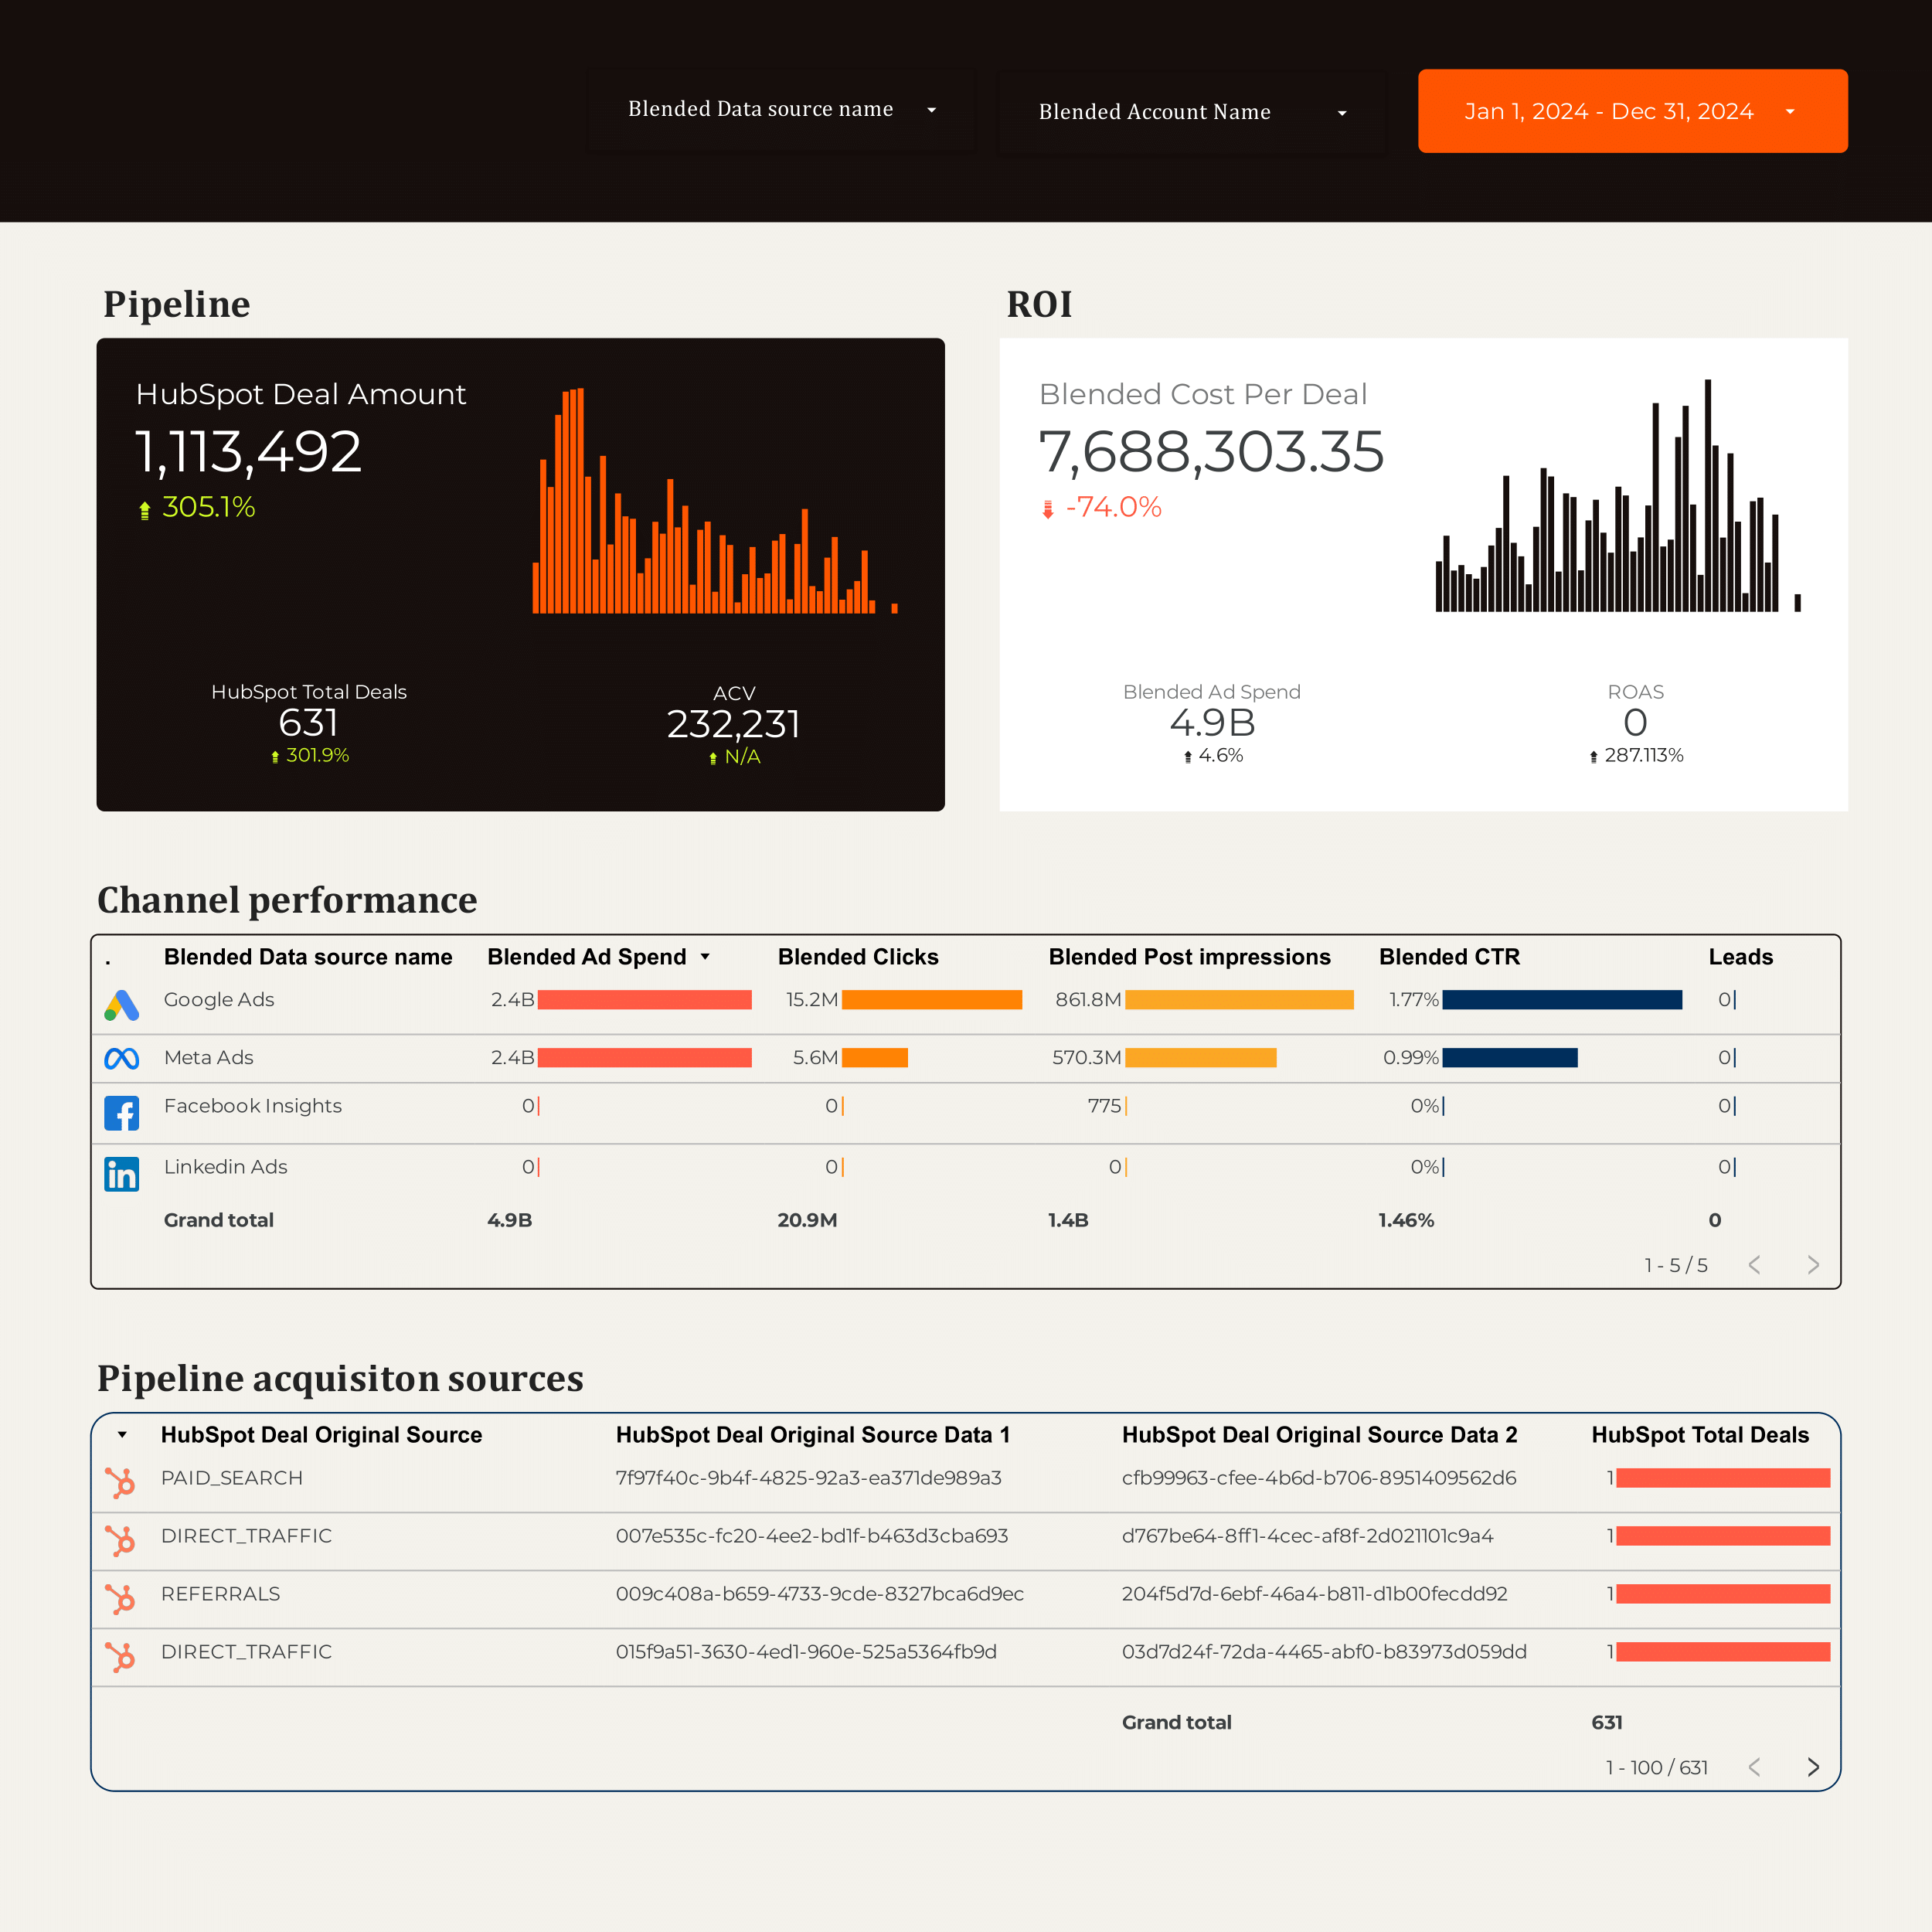
ROAS Report template for Marketing teams and agencies
Track PPC performance with this PPC ROAS report template. Measure CTR, CPA, and conversion rates. Analyze ad placement, audience, and creative formats. Integrate data from Facebook Ads and Paid Media. Segment by time and demographics for actionable insights. Ideal for marketing teams aiming to optimize their strategy and achieve specific goals.
Facebook Ads budget tracking and pacing Report template for Marketing teams and agencies
Optimize your Facebook Ads budget with this tracking and pacing report template. Analyze CTR, conversion rates, and cost per conversion. Segment by audience, ad placement, and timing. Track key metrics across demographics and timeframes. Perfect for PPC specialists aiming to enhance Facebook Ads performance and budget efficiency.
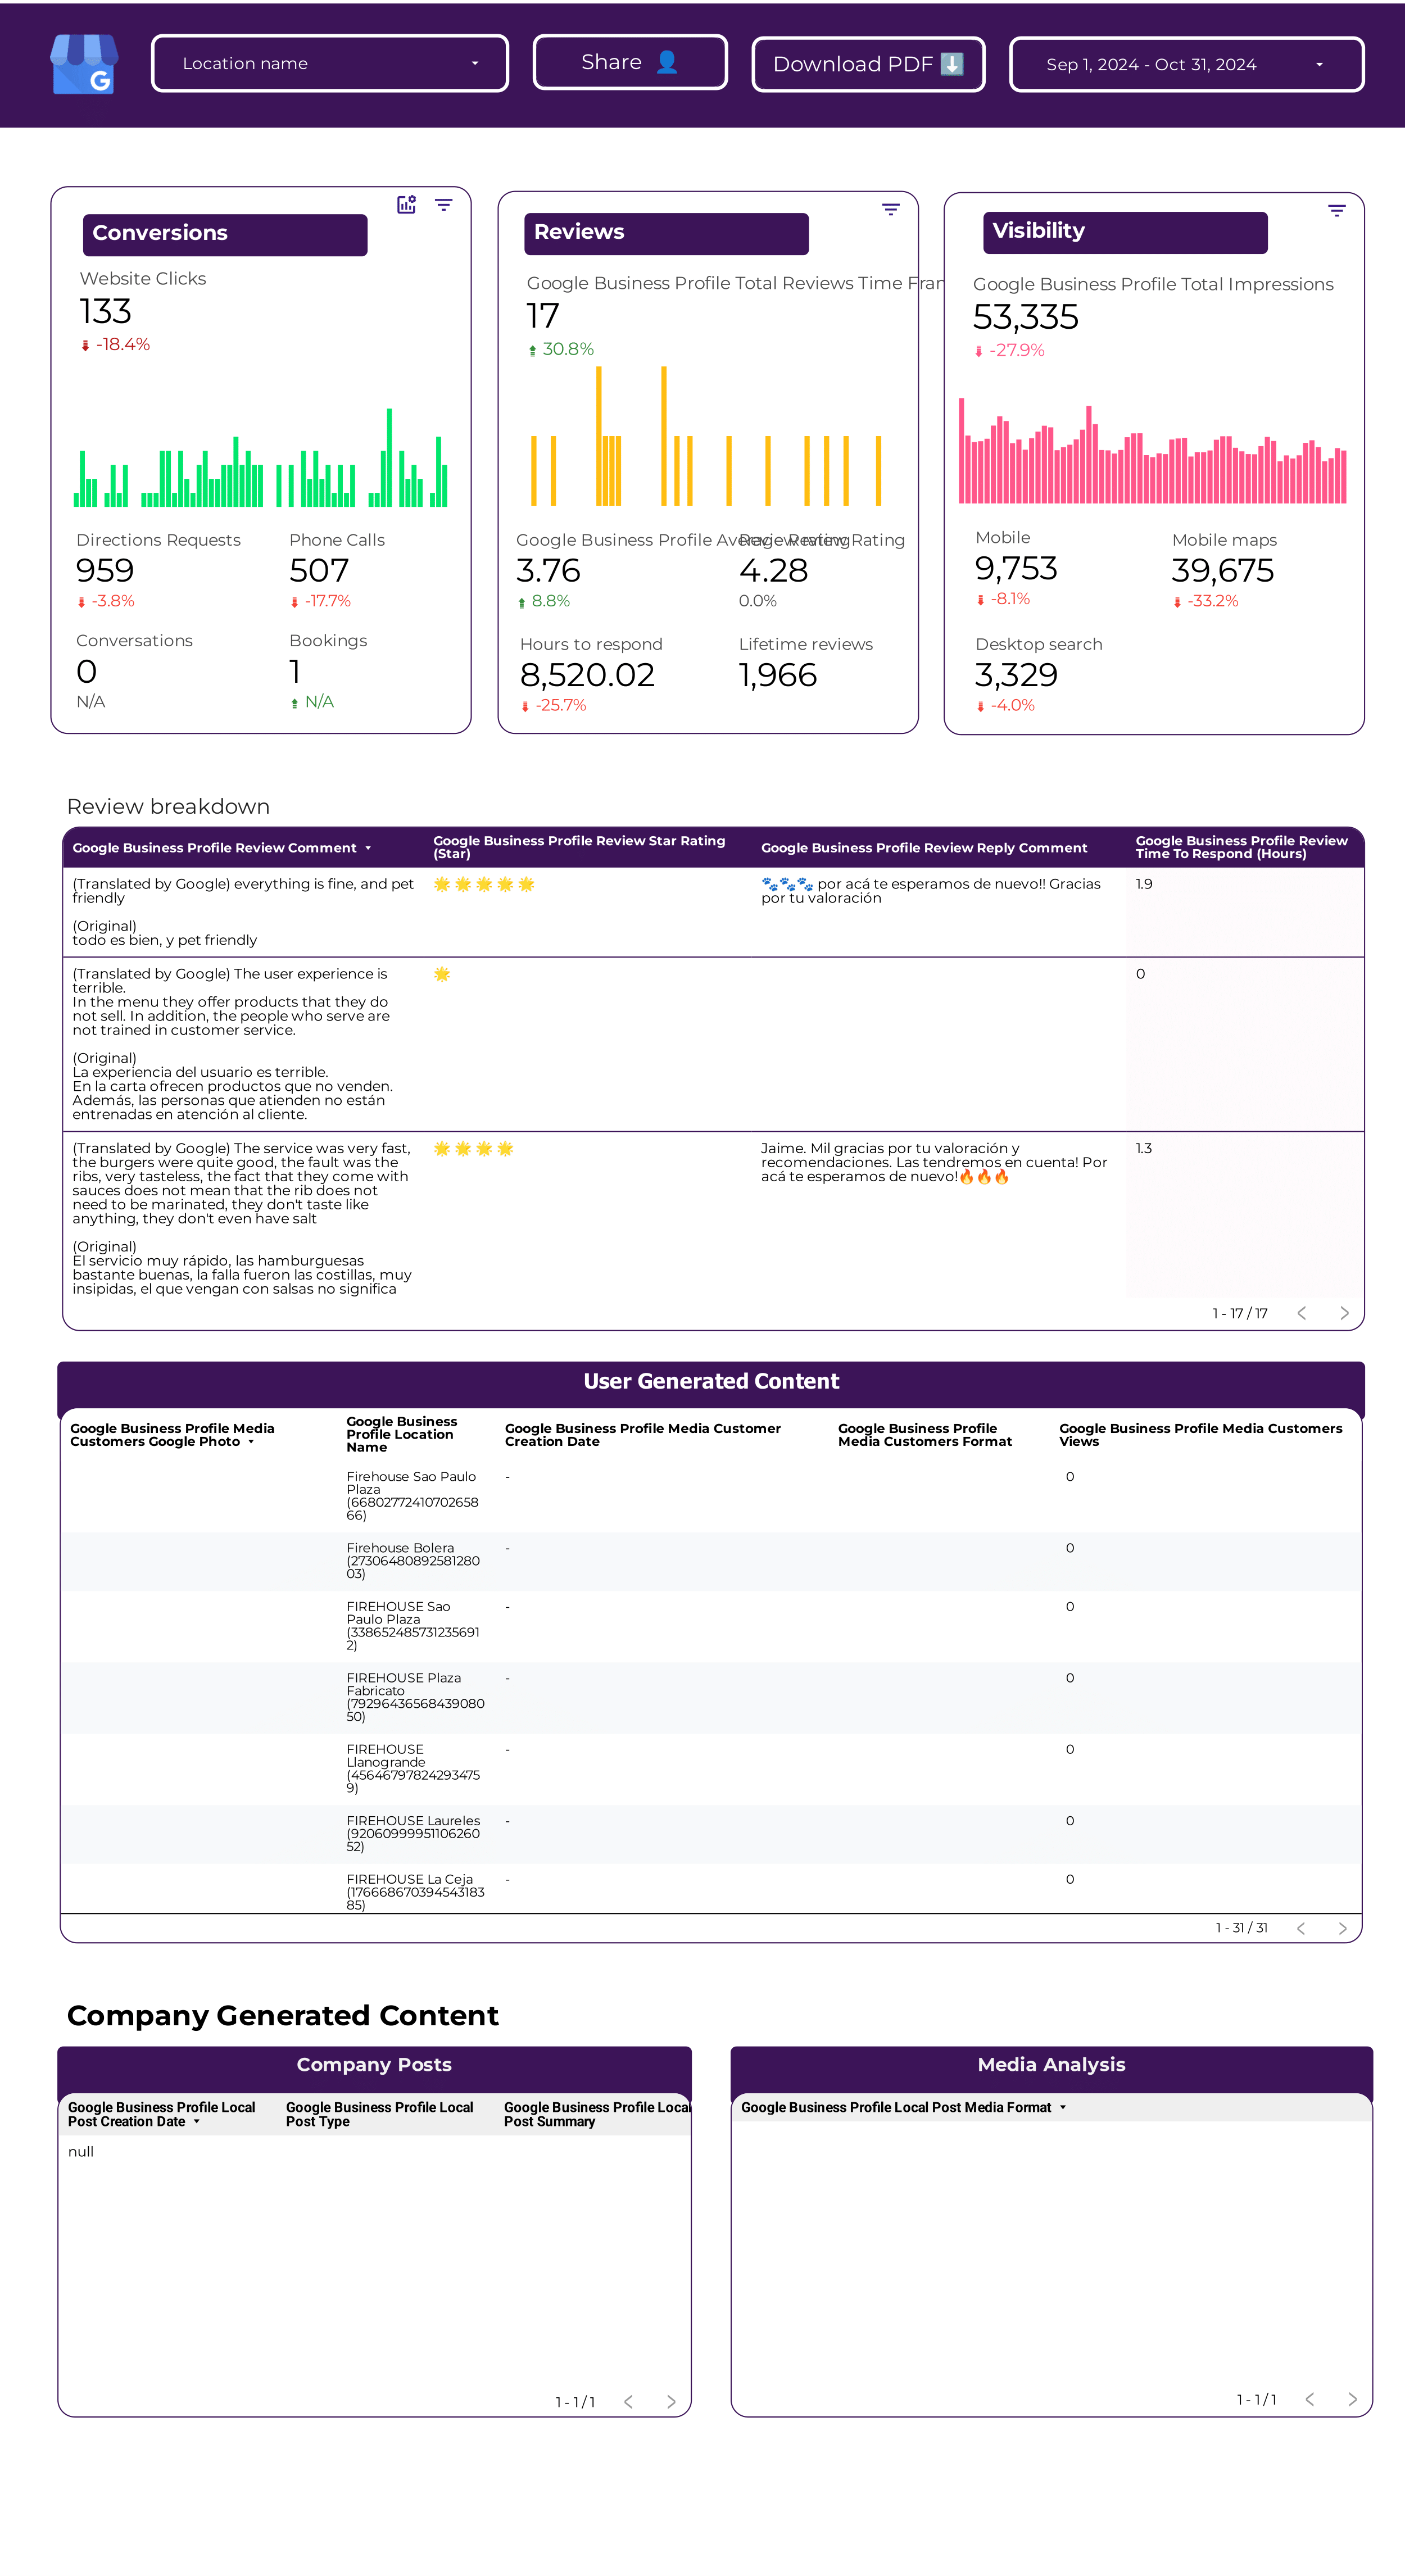
Google Business Profile Report template for Marketing teams and agencies
Optimize your local SEO strategy with this Google Business Profile report template. Track CTR, conversion rate, CAC, clicks, impressions, and reviews. Analyze data by location, age, gender, and time. Perfect for marketing teams aiming to consolidate performance insights and meet specific goals.
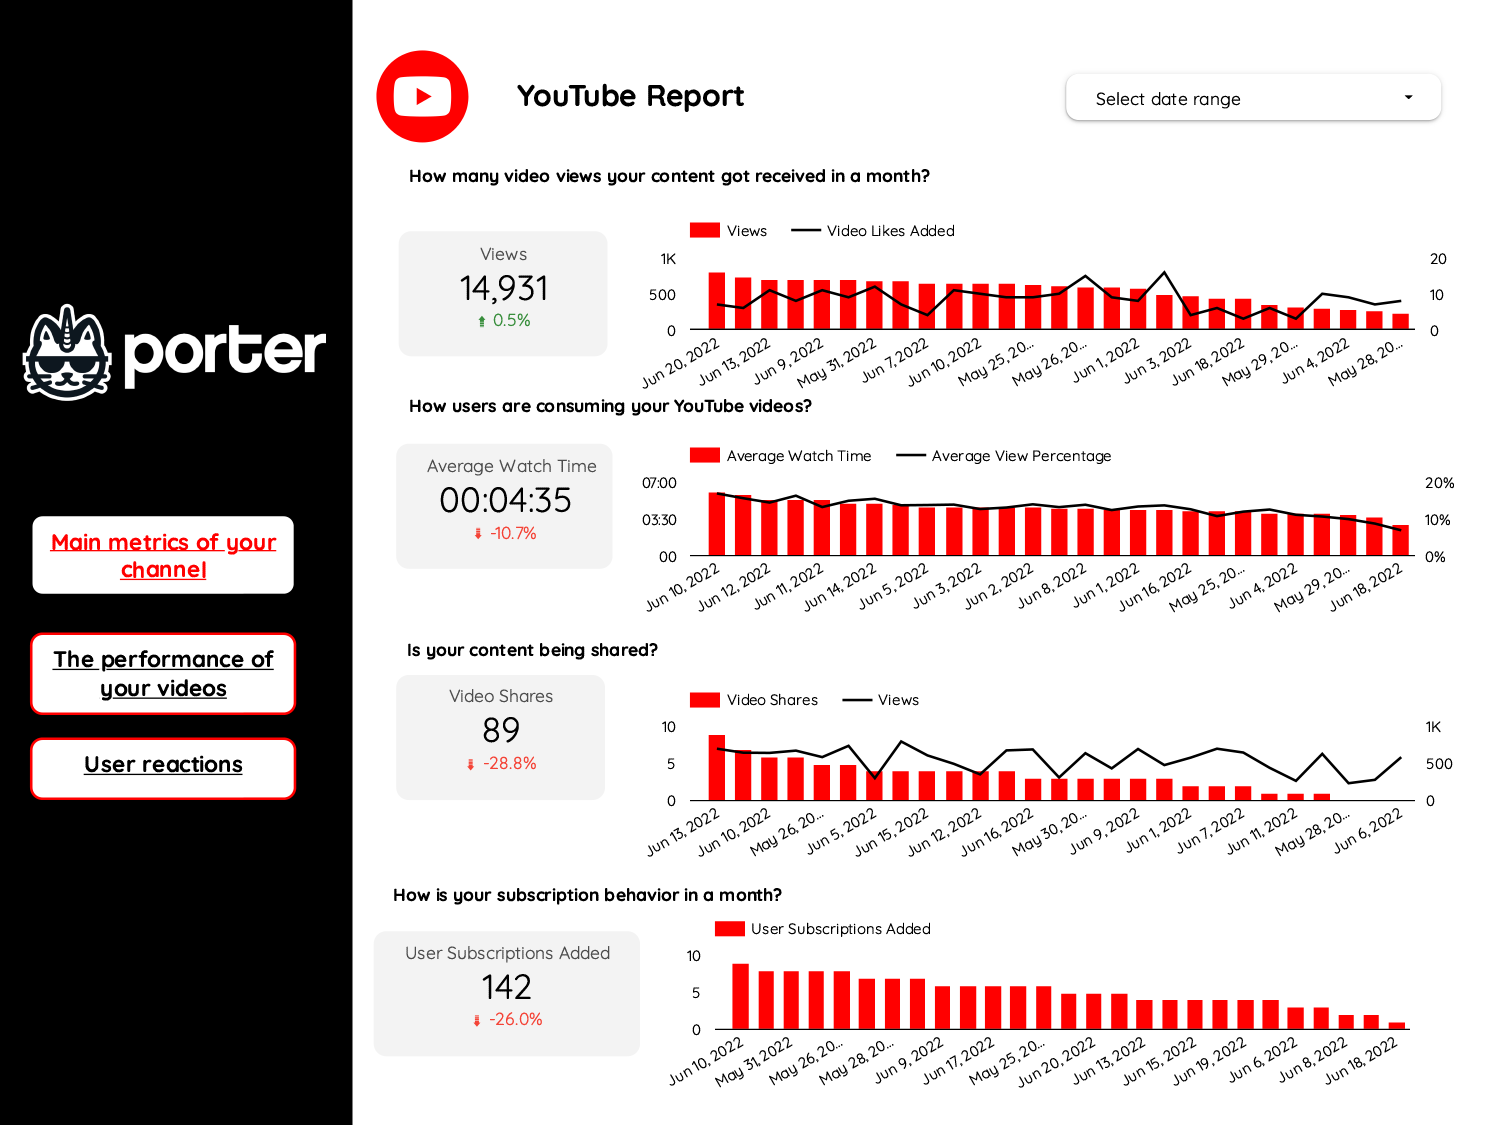
Youtube Report template for Marketing teams and agencies
Optimize your social media strategy with this Youtube report template. Track CTR, conversion rate, CPA, likes, comments, shares, views, watch time, and subscribers. Analyze by audience, age, gender, interests, and time. Perfect for marketing teams seeking actionable insights to enhance performance across advertising platforms and align with SEO objectives.
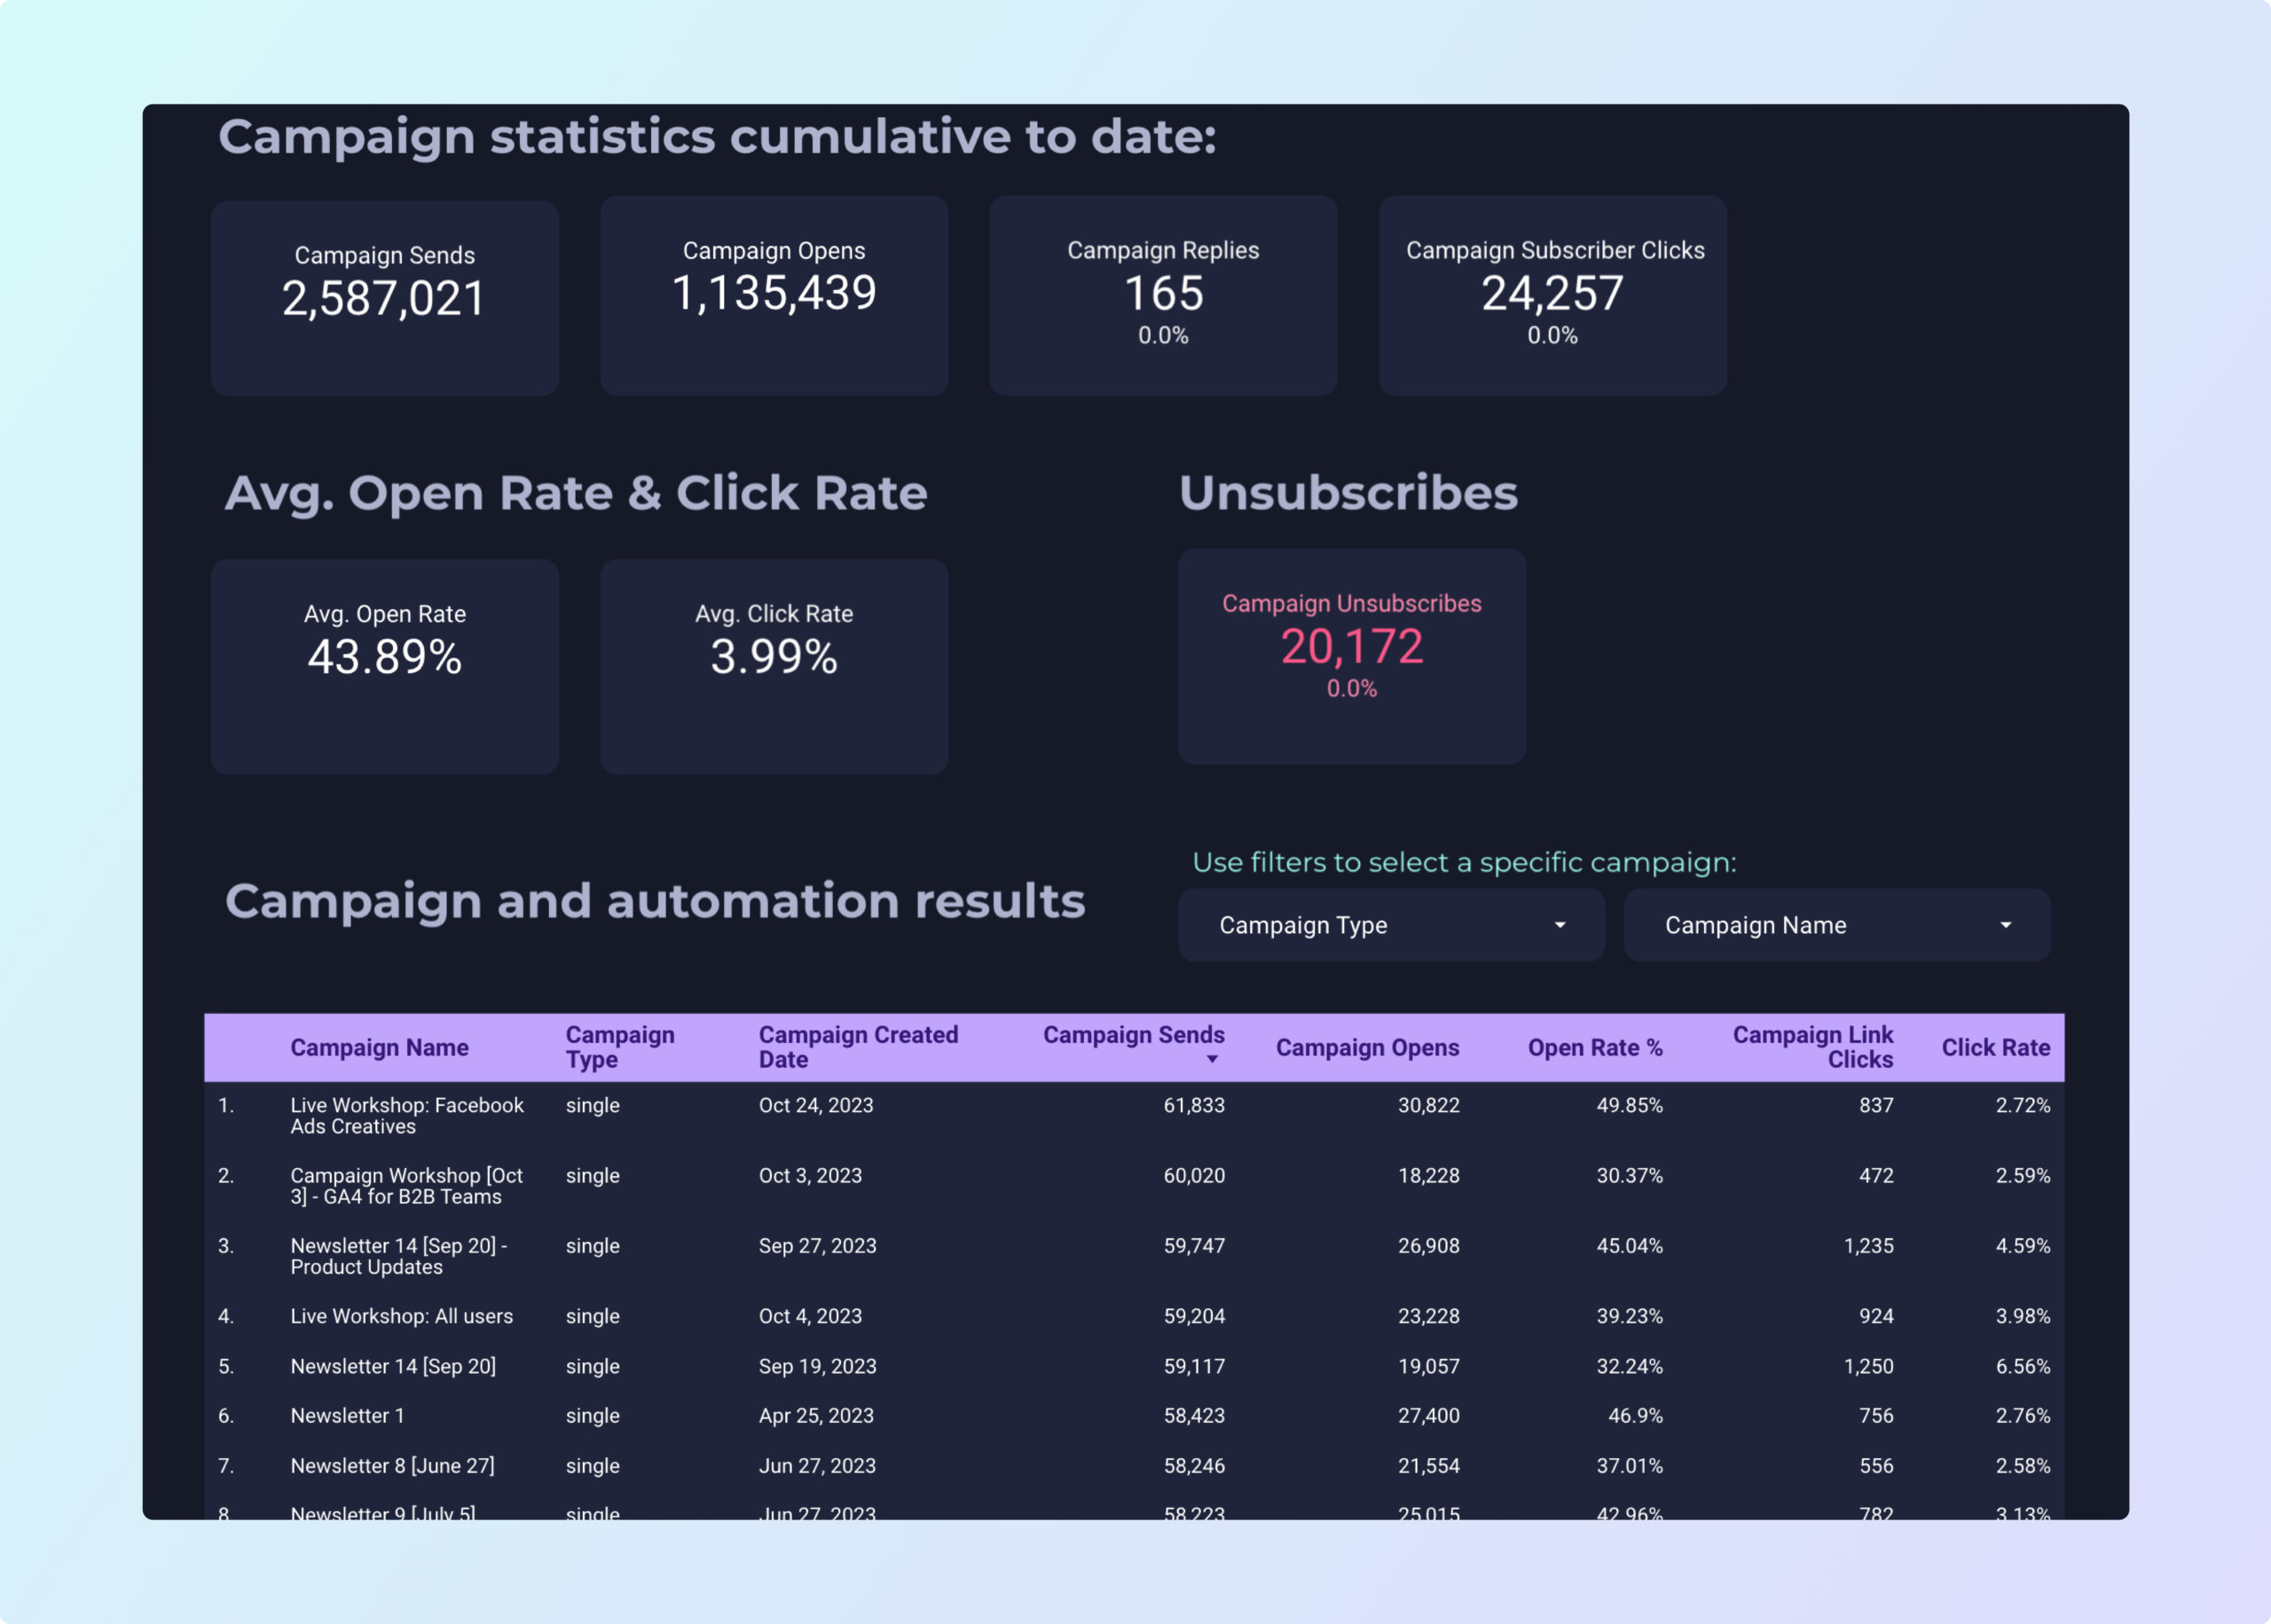
ActiveCampaign Report template for Marketing teams and agencies
ActiveCampaign report template: Track key metrics like click-through rate, conversion rate, and ROI. Analyze customer acquisition cost and average order value. Segment by audience, campaign objectives, and timeline. Ideal for B2B, CRM, and email marketing teams seeking actionable insights through automation.
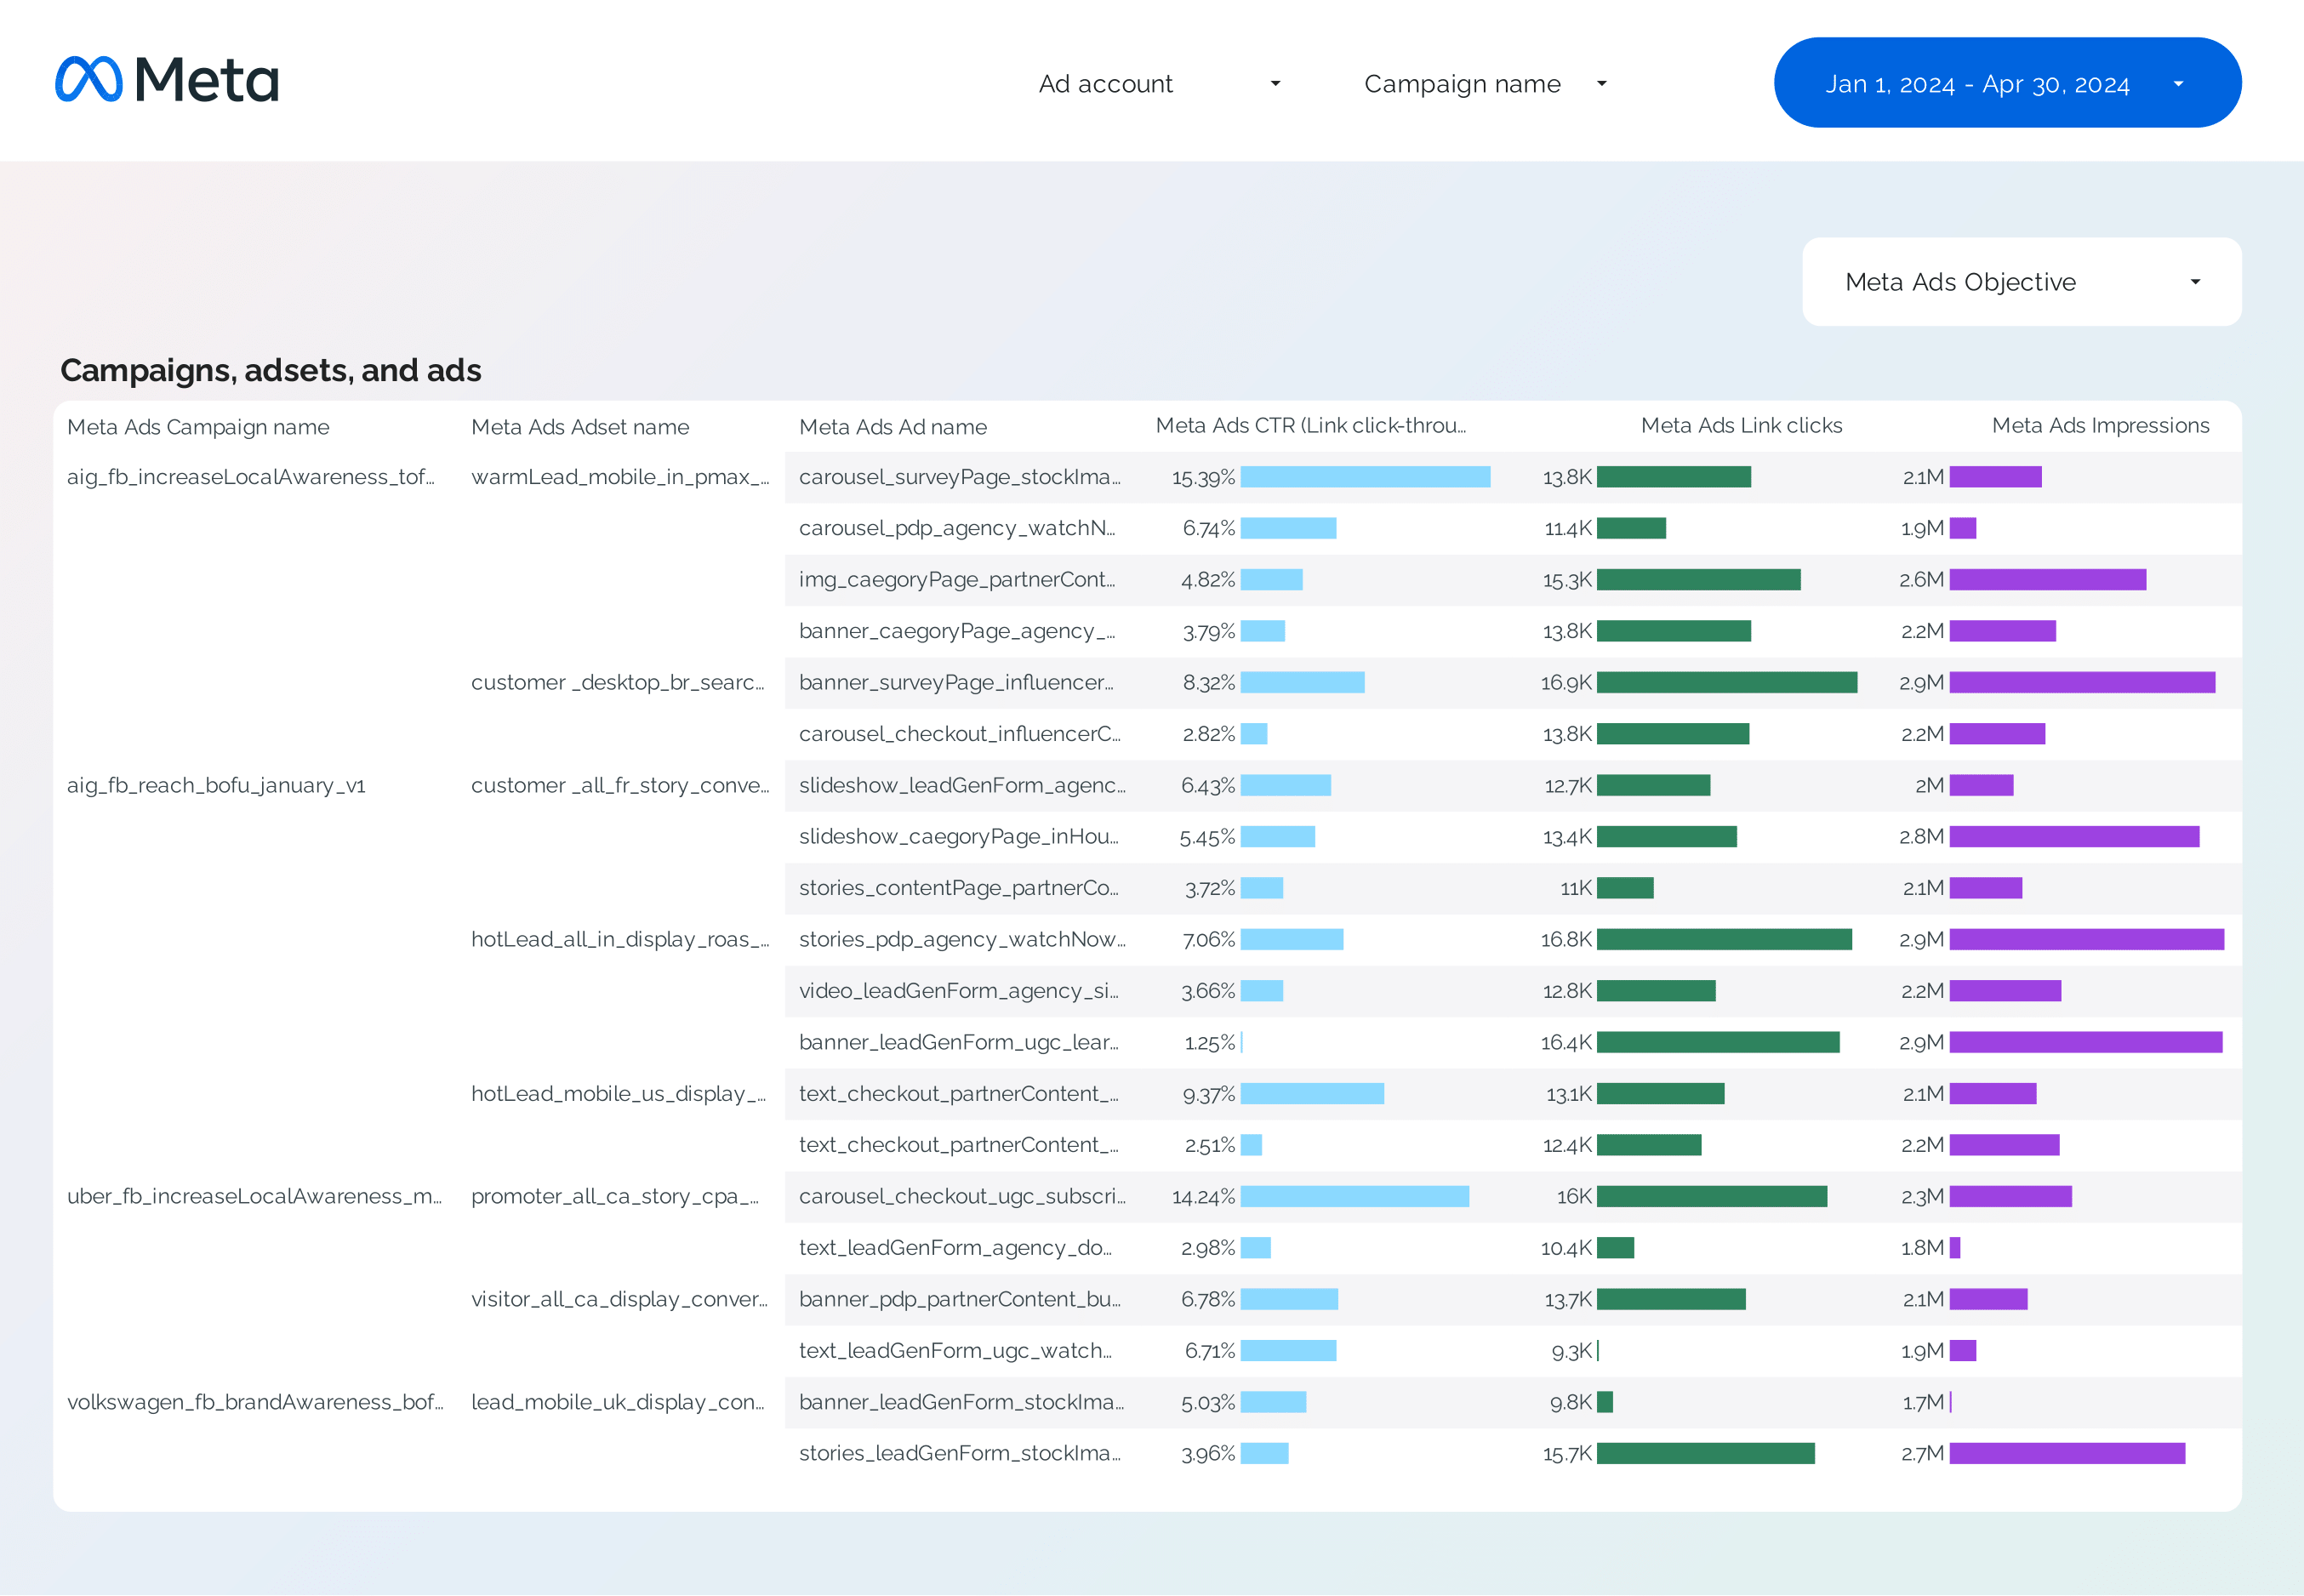
Facebook Ads Campaign performance Report template for Marketing teams and agencies
Get the actual Facebook Ads Campaign performance on Looker Studio template used by Porter to monitor PPC performance.
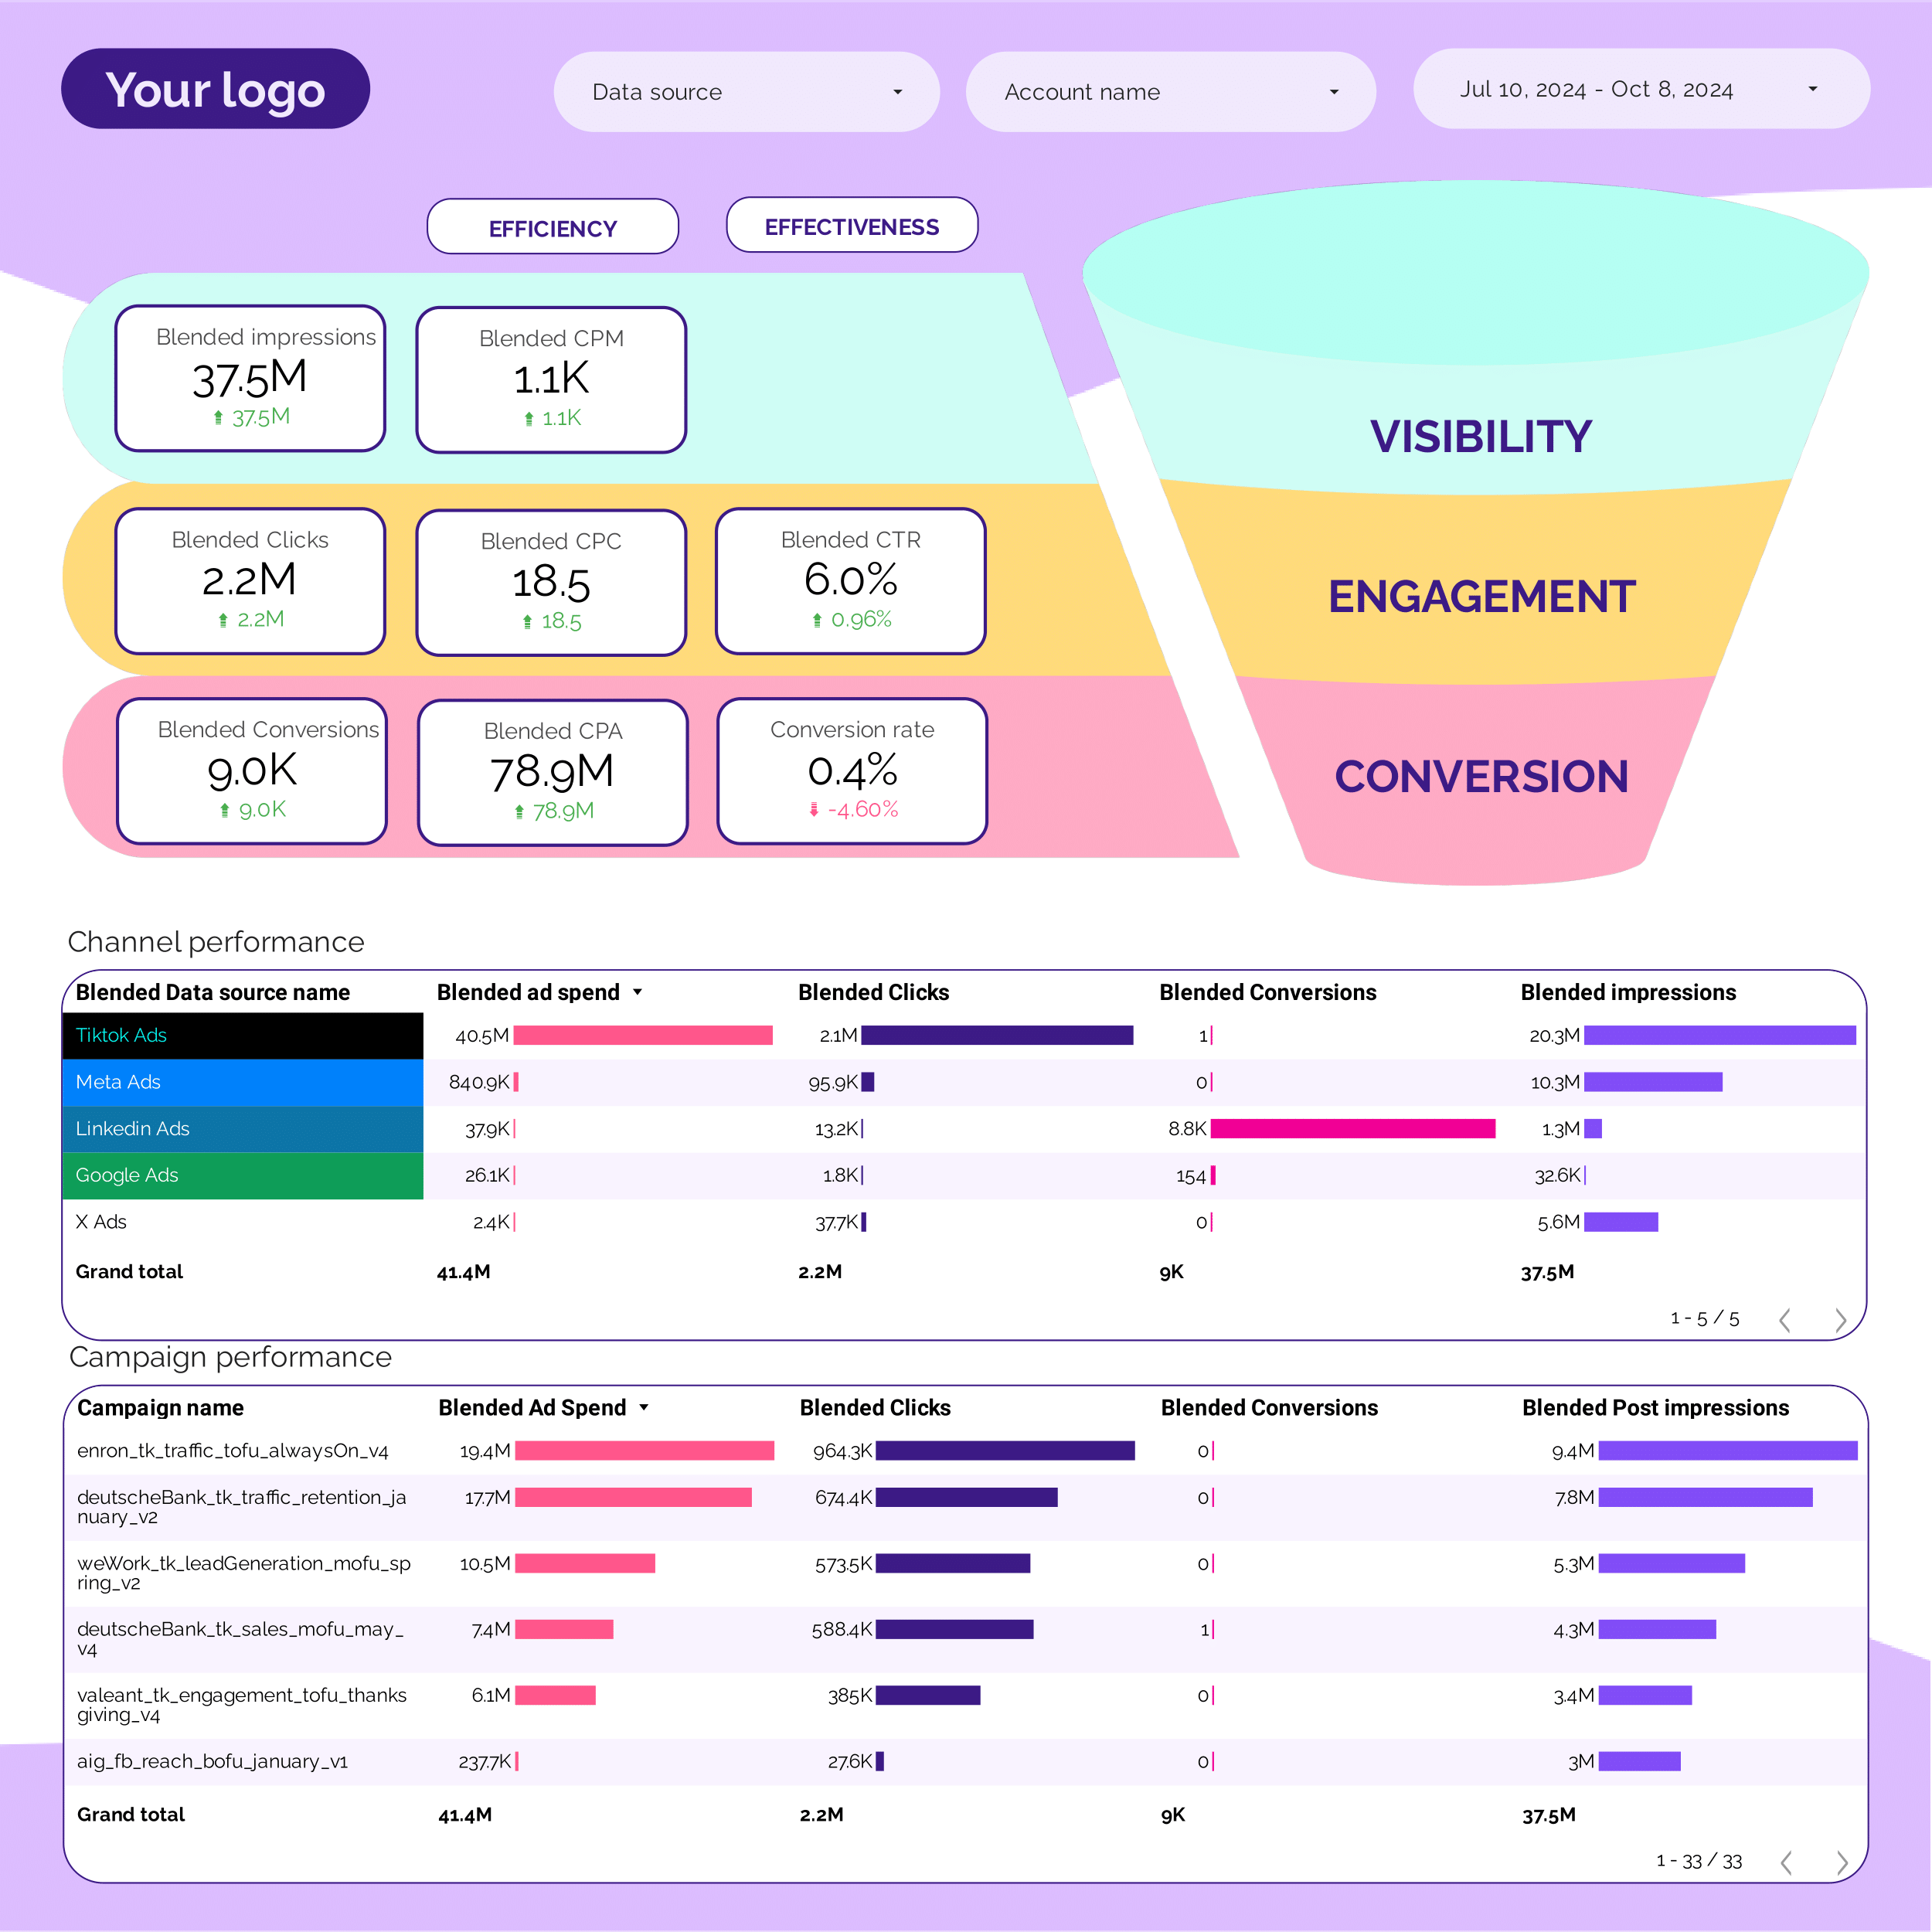
PPC Funnel Report template for Marketing teams and agencies
Get the actual PPC Funnel on Looker Studio template used by Porter to monitor PPC performance.
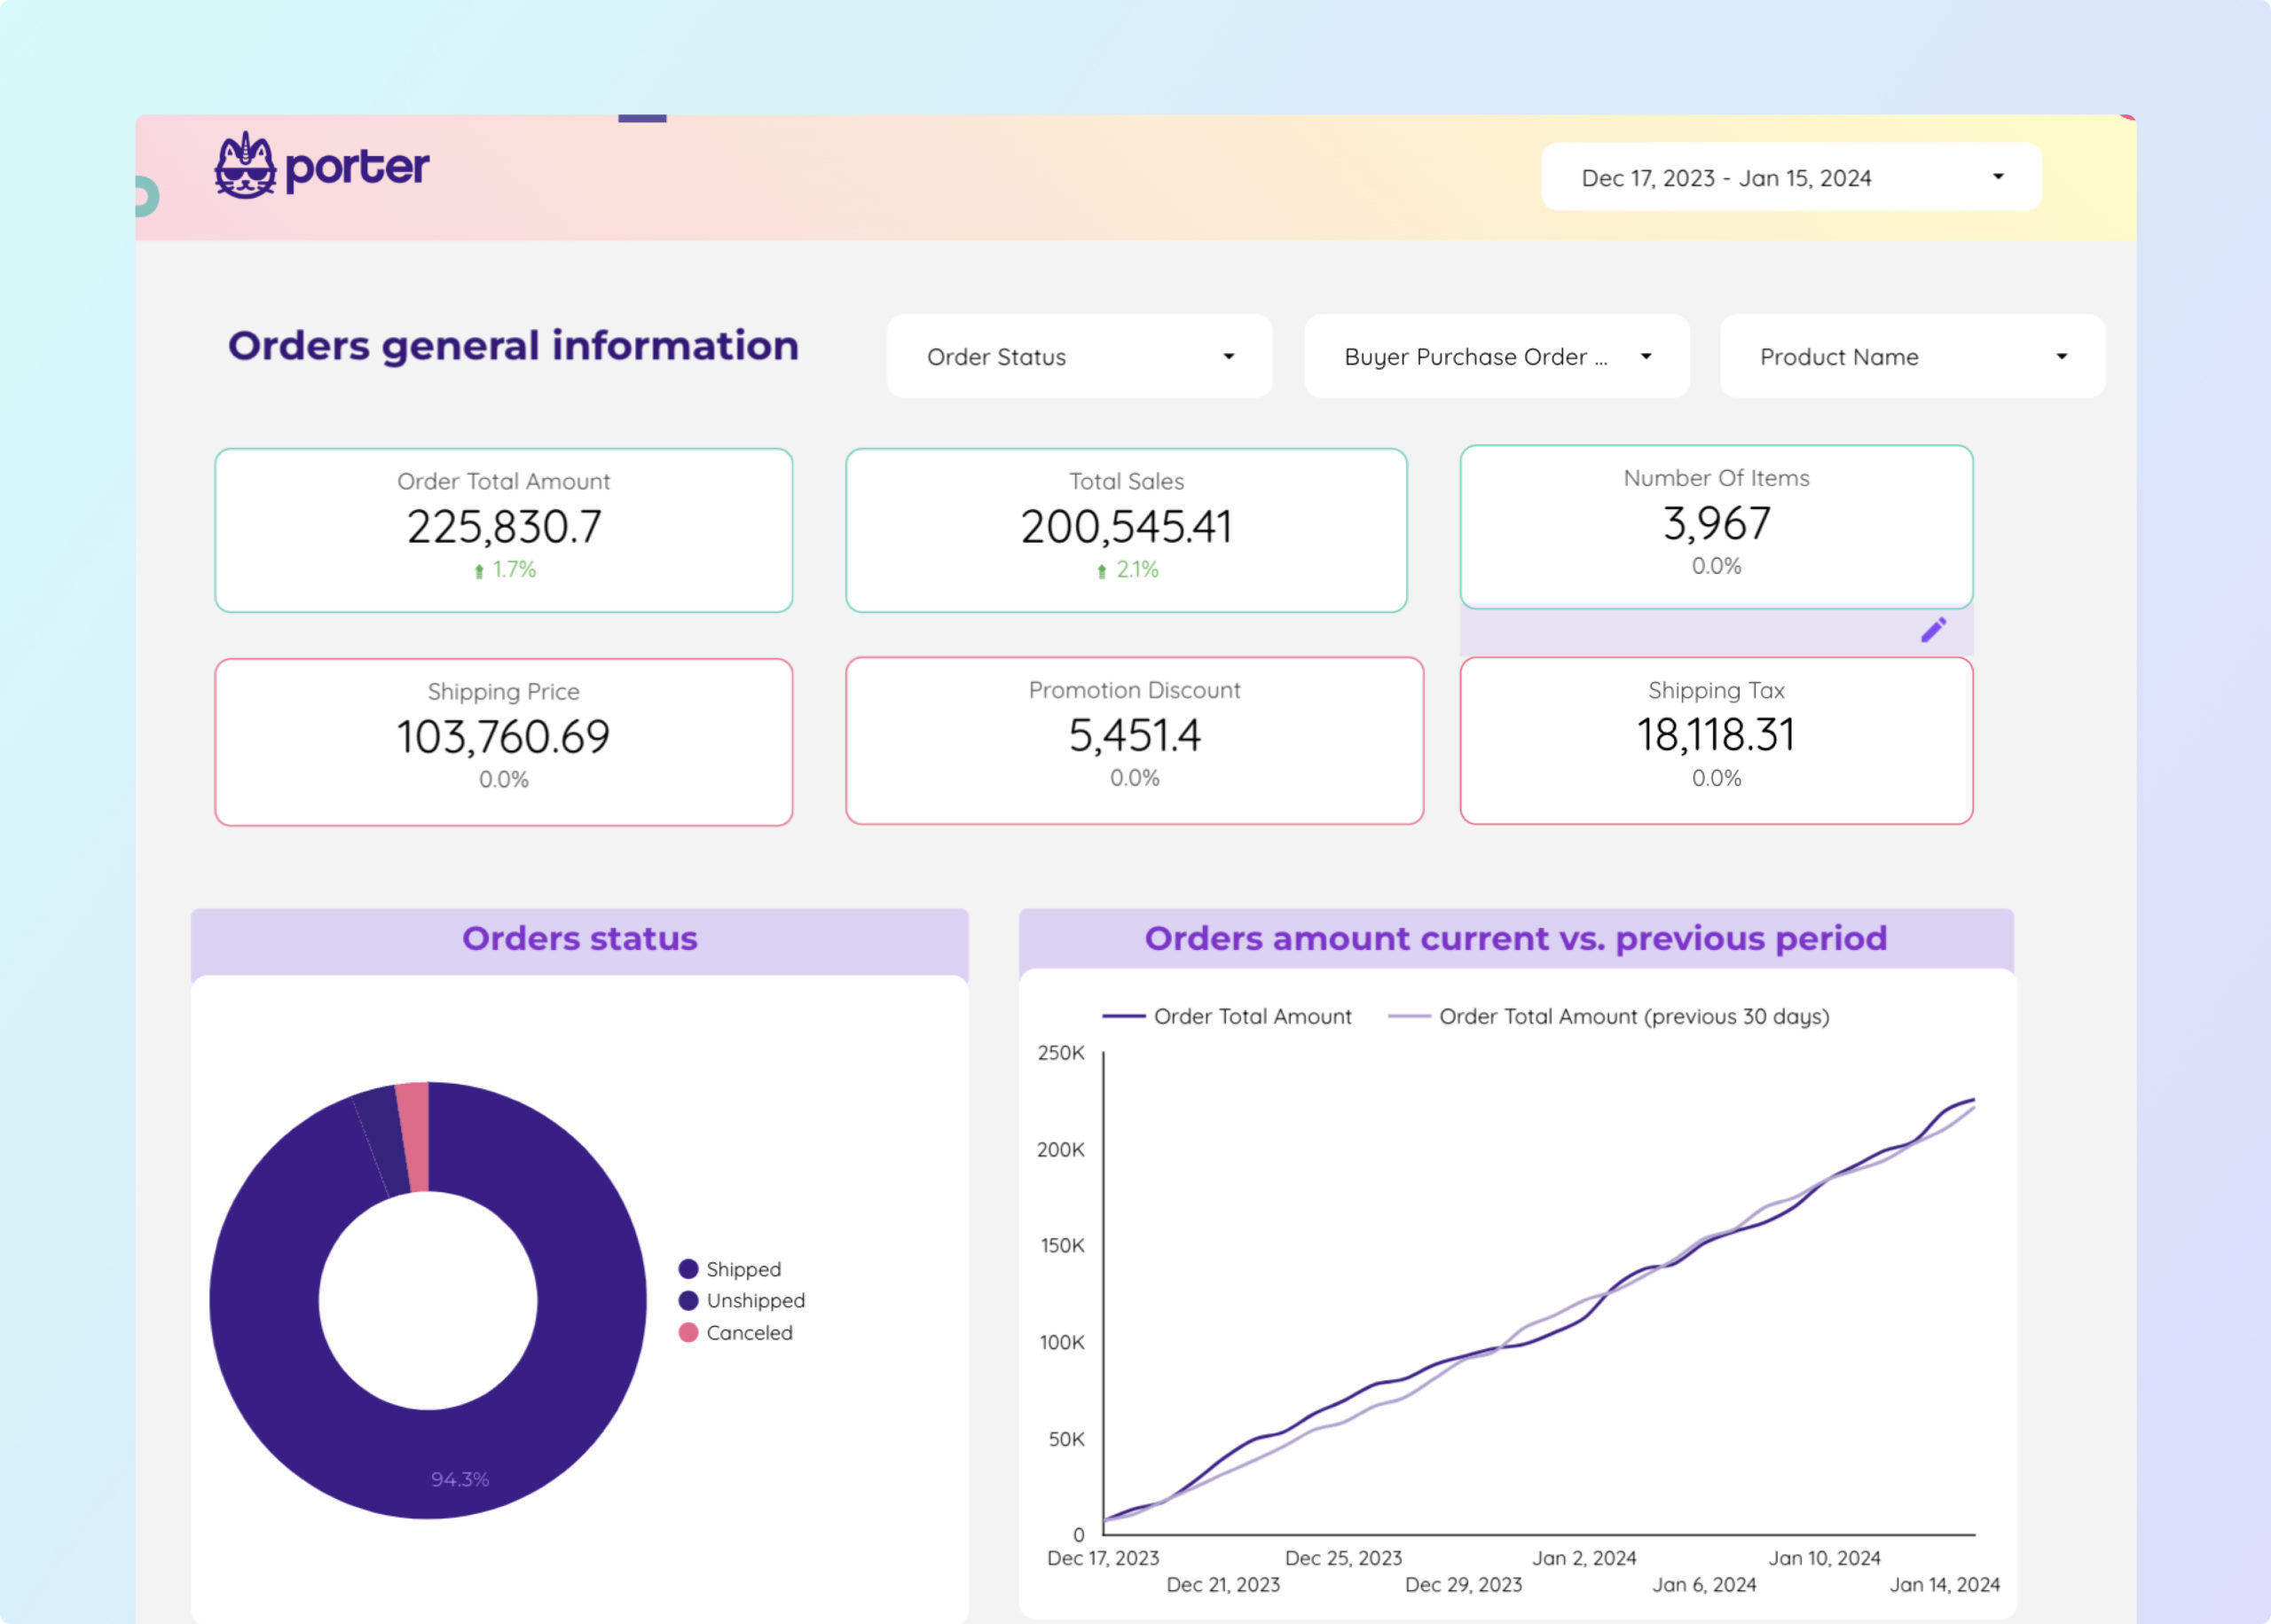
Amazon Seller Central Report template for Marketing teams and agencies
Analyze key metrics with this Amazon Seller Central report template. Track GMV, AOV, and CPA. Segment by demographics, ad format, and time. Perfect for e-commerce marketing teams to consolidate data from Amazon Seller Central. Optimize performance and refine strategies for targeted audiences. Measure success across platforms efficiently.
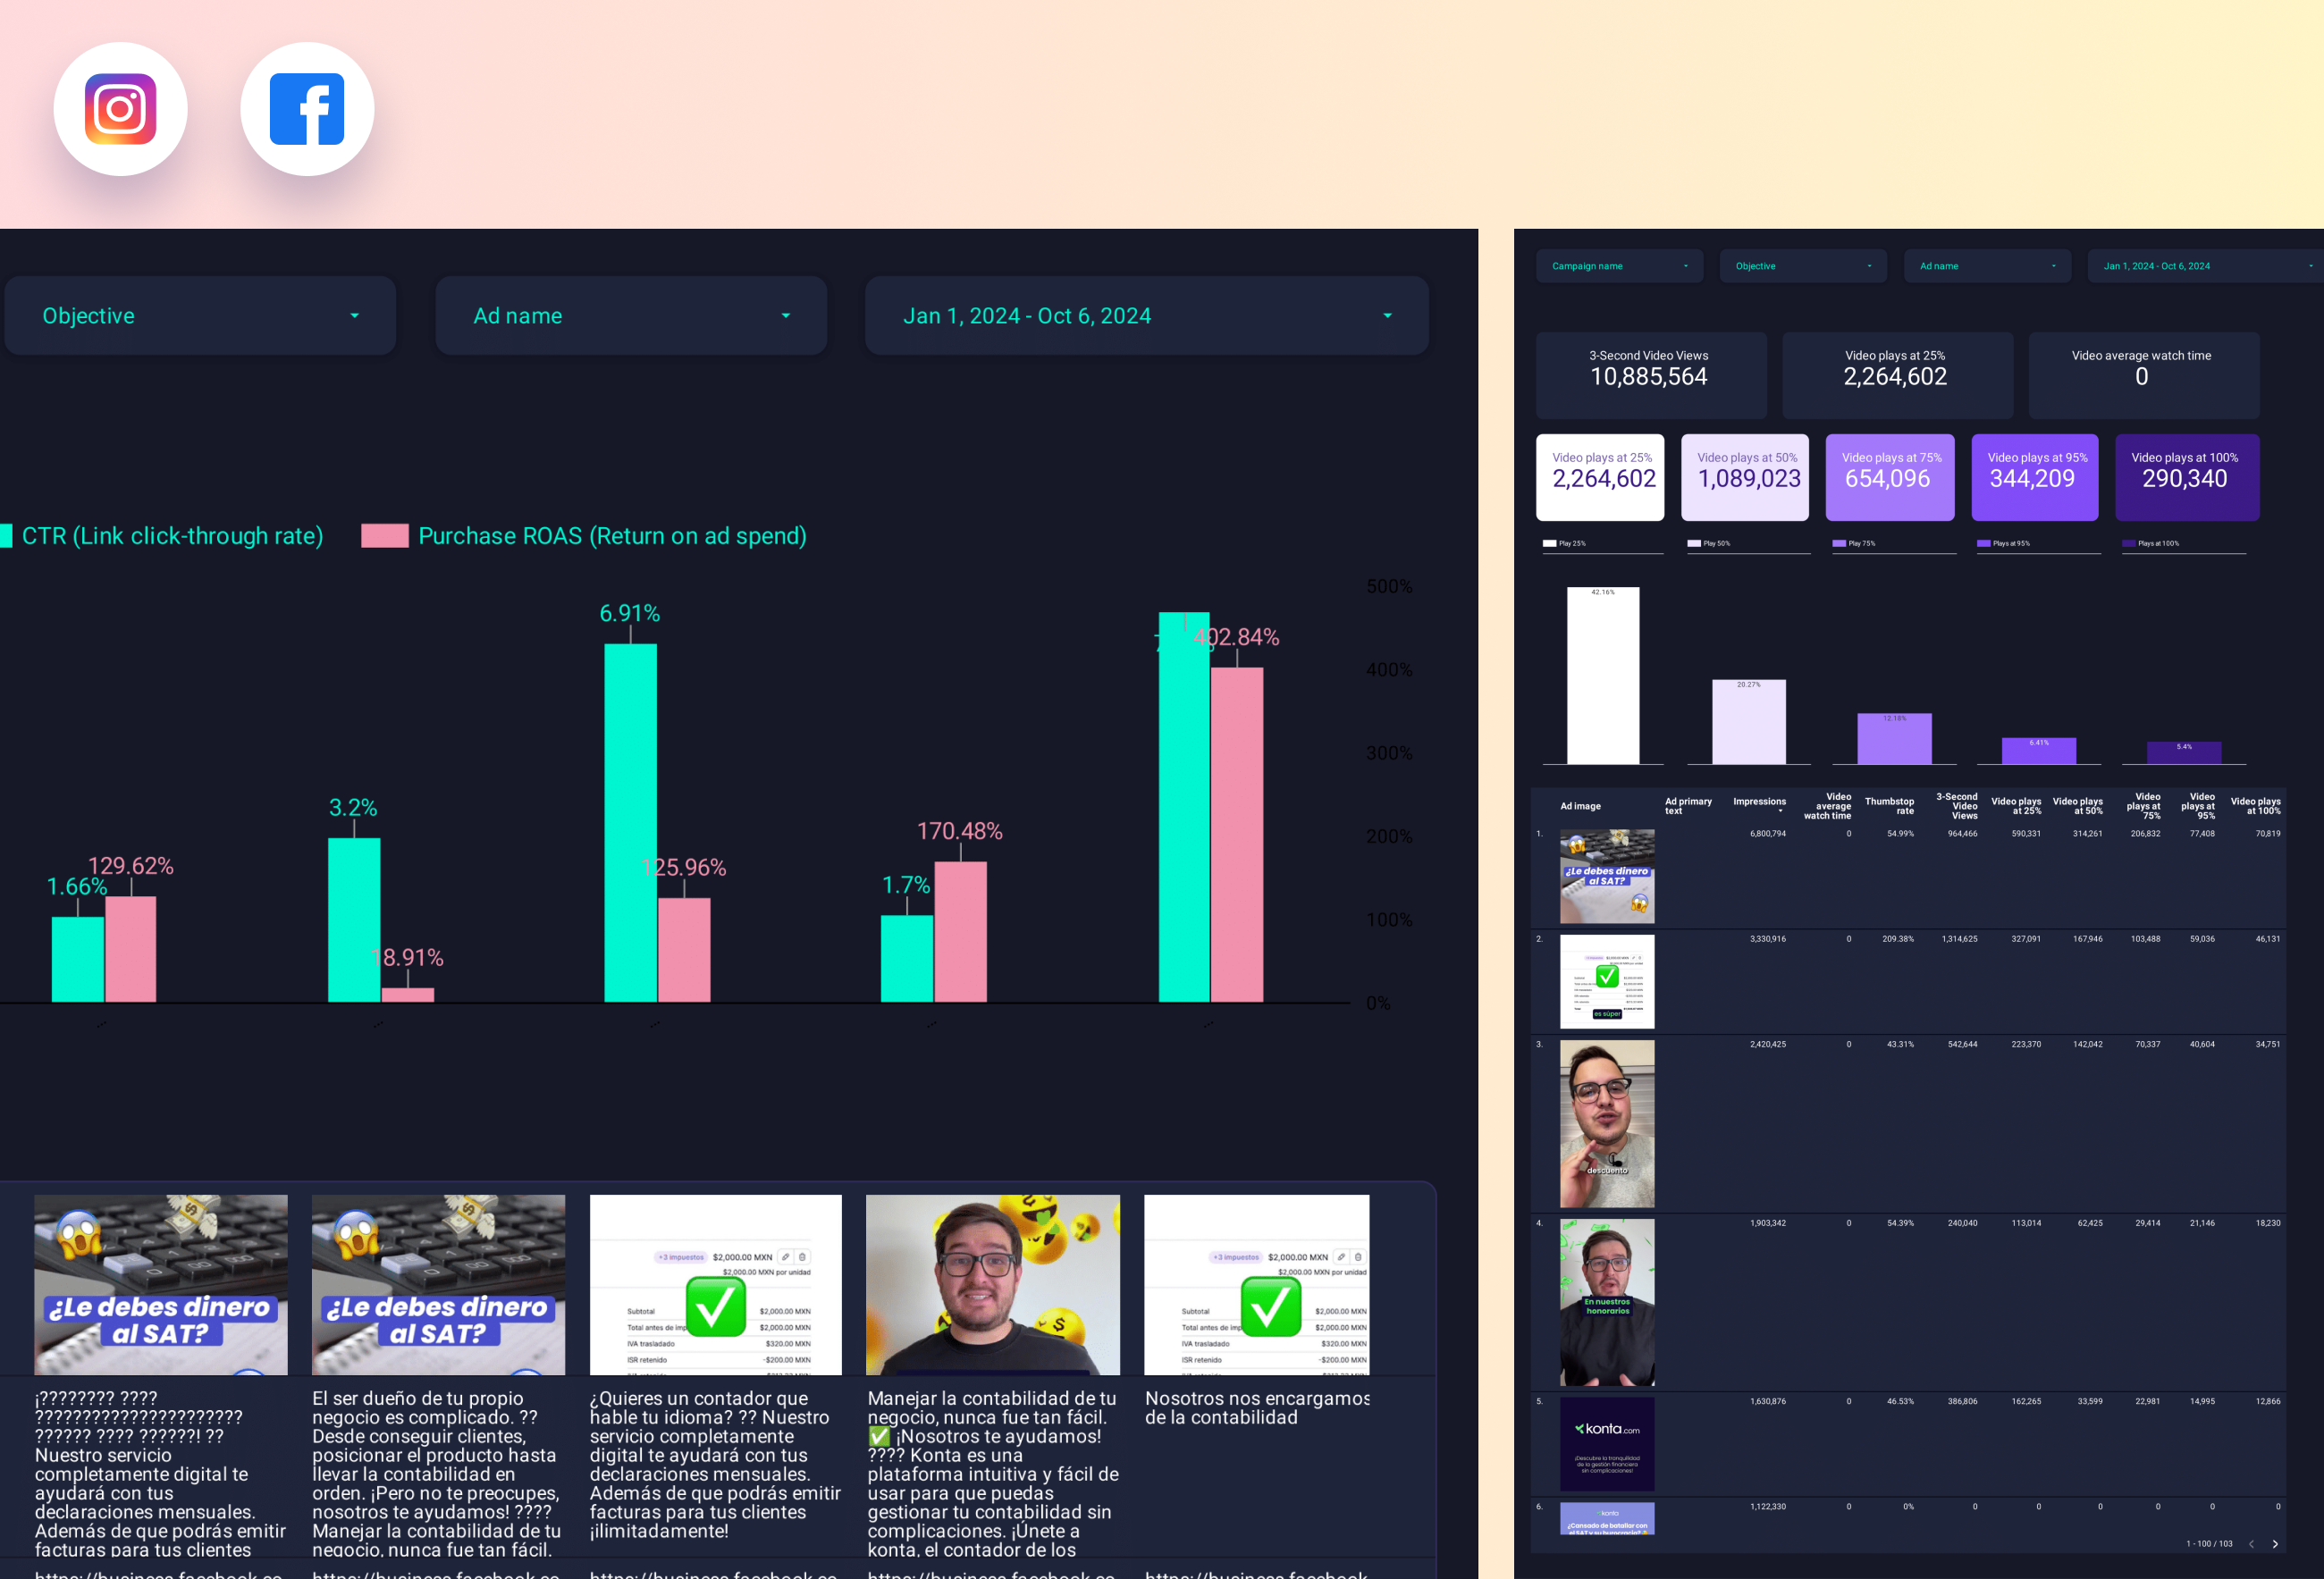
Facebook Ads Creative performance Report template for Marketing teams and agencies
Analyze key metrics like CTR, CPA, and conversion rates with the Facebook Ads Creative performance report template. Segment by audience, message, and channels. Perfect for PPC and Paid Media teams to track performance. Monitor engagement through likes, comments, and shares across demographics and behaviors. Optimize strategy with actionable insights.
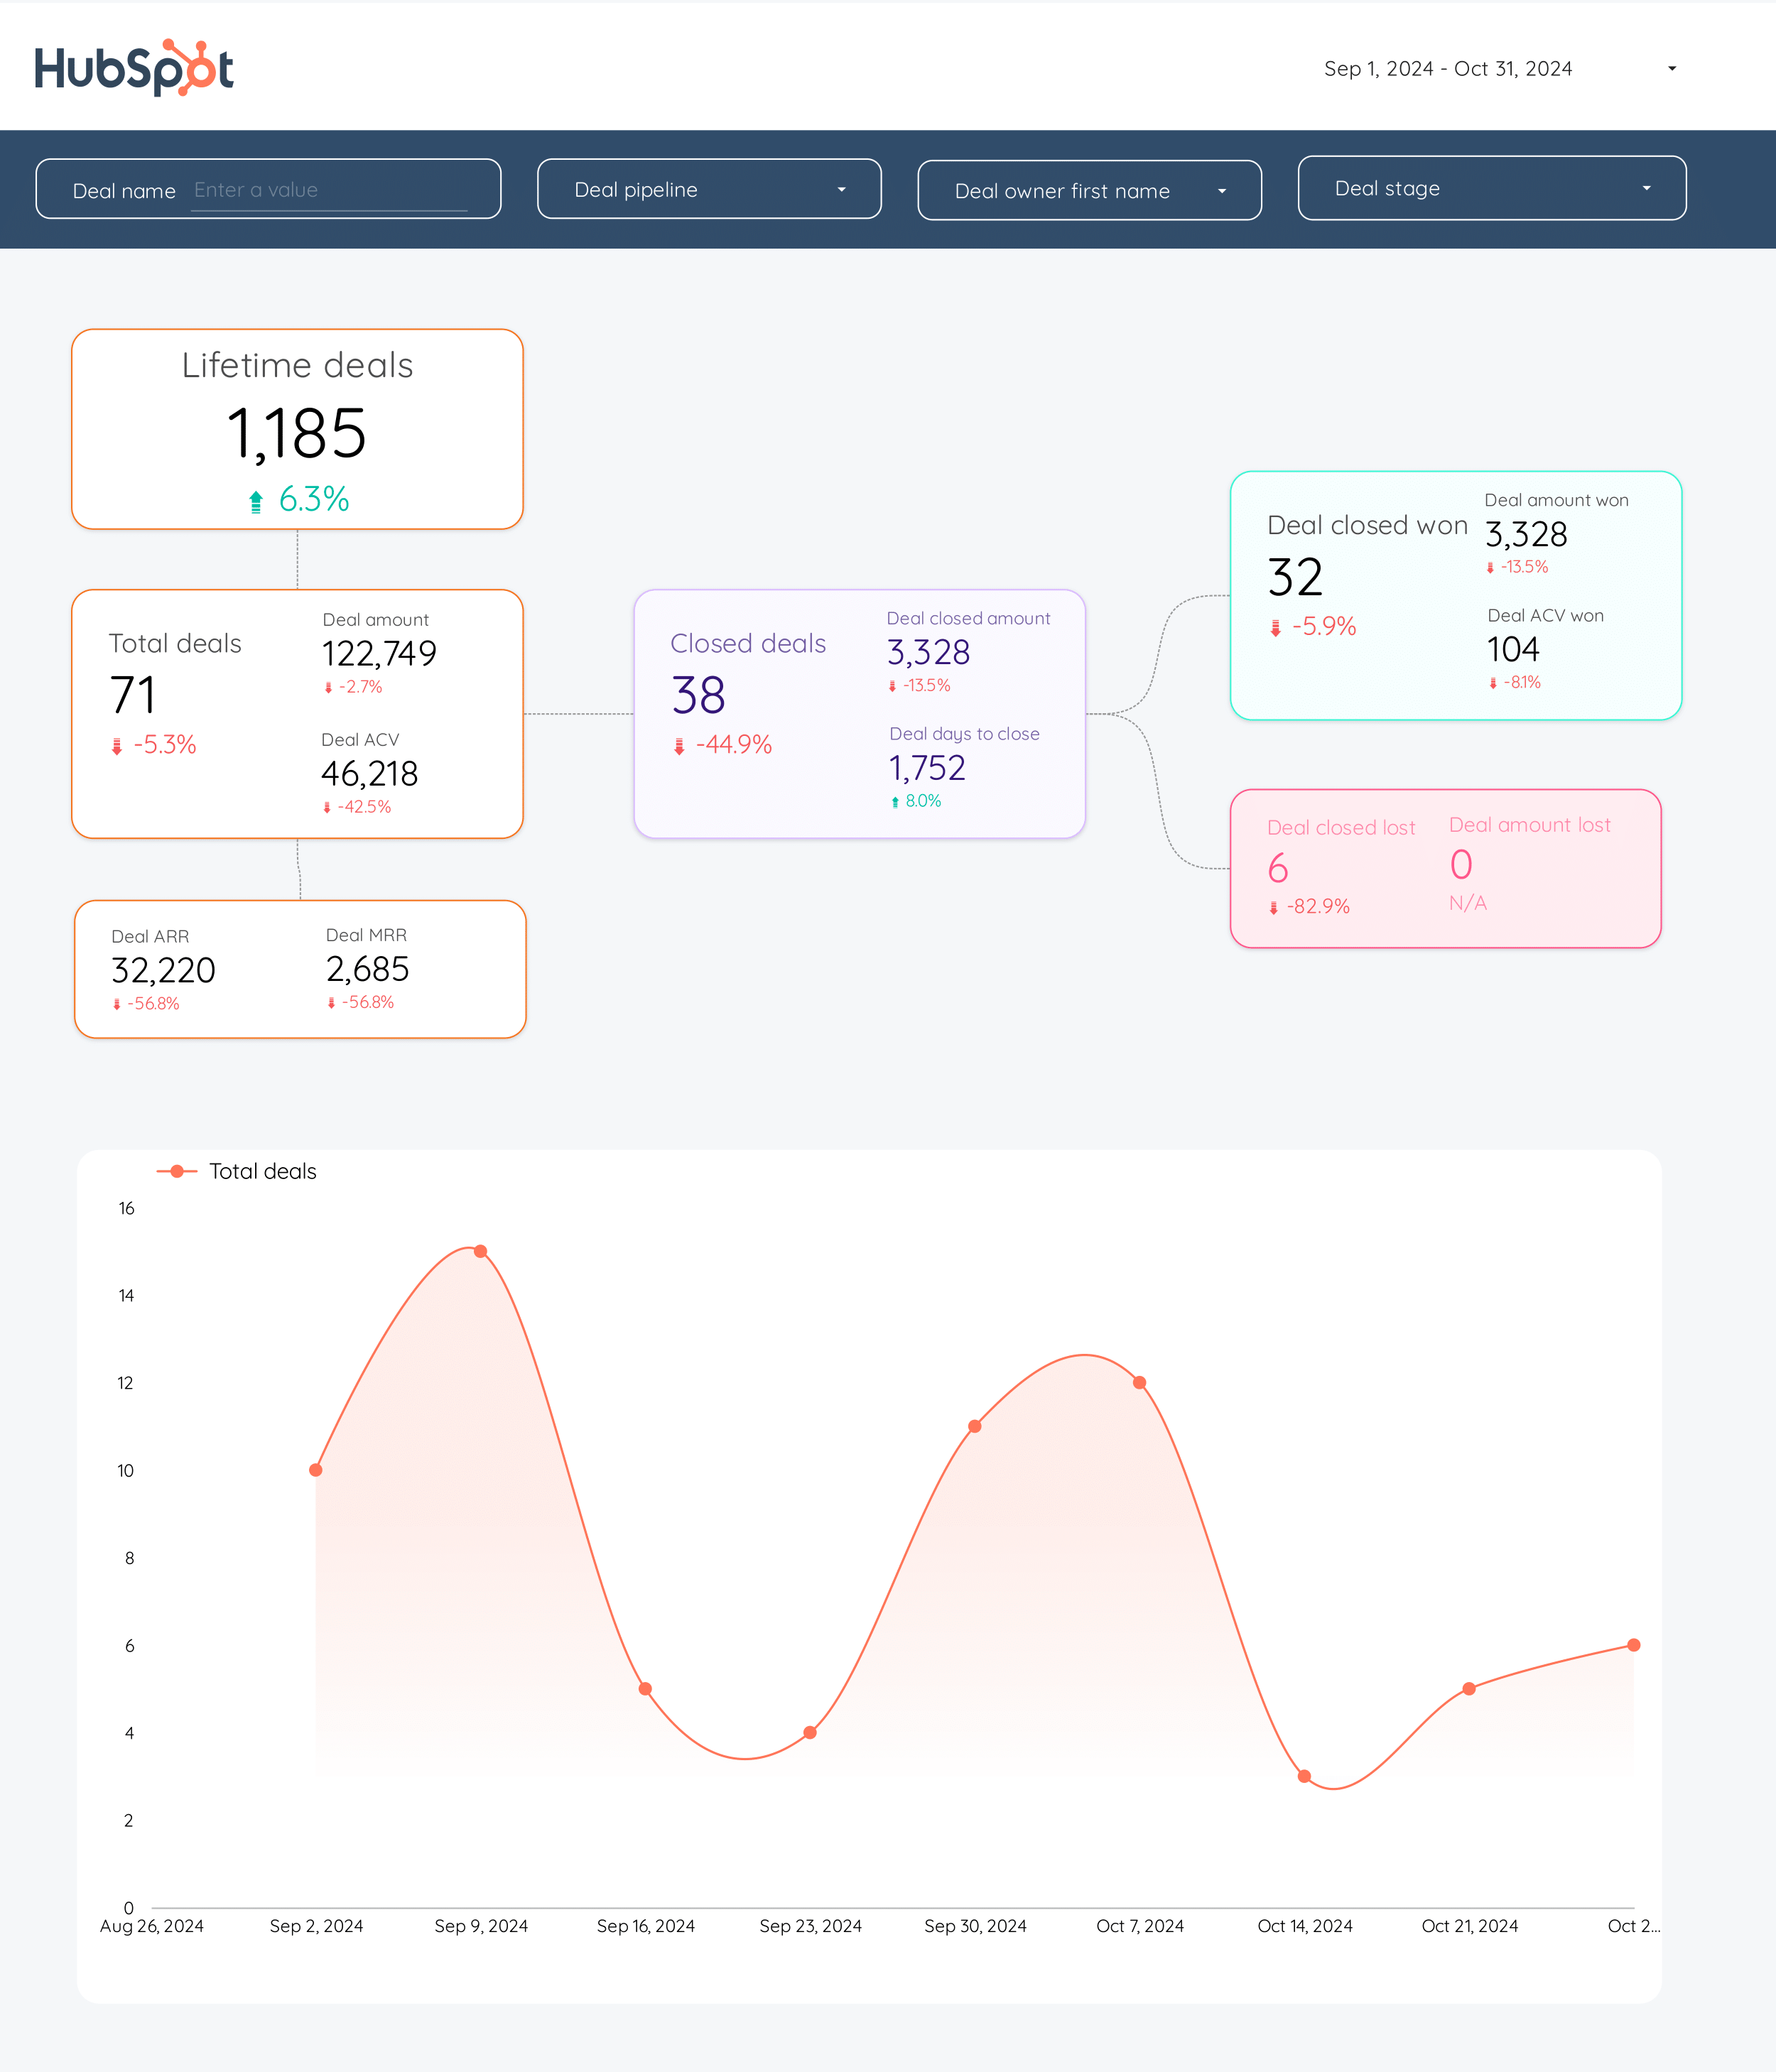
HubSpot Report template for Marketing teams and agencies
Optimize B2B marketing with this HubSpot report template. Track metrics like conversion rate, ROI, and average deal size. Analyze CRM contacts and campaign performance by demographic and psychographic breakdowns. Ideal for inbound marketing teams to measure and refine email marketing and funnel strategies across different timeframes.
PPC KPIs Report template for Marketing teams and agencies
Get the actual PPC KPIs on Looker Studio template used by Porter to monitor PPC performance.
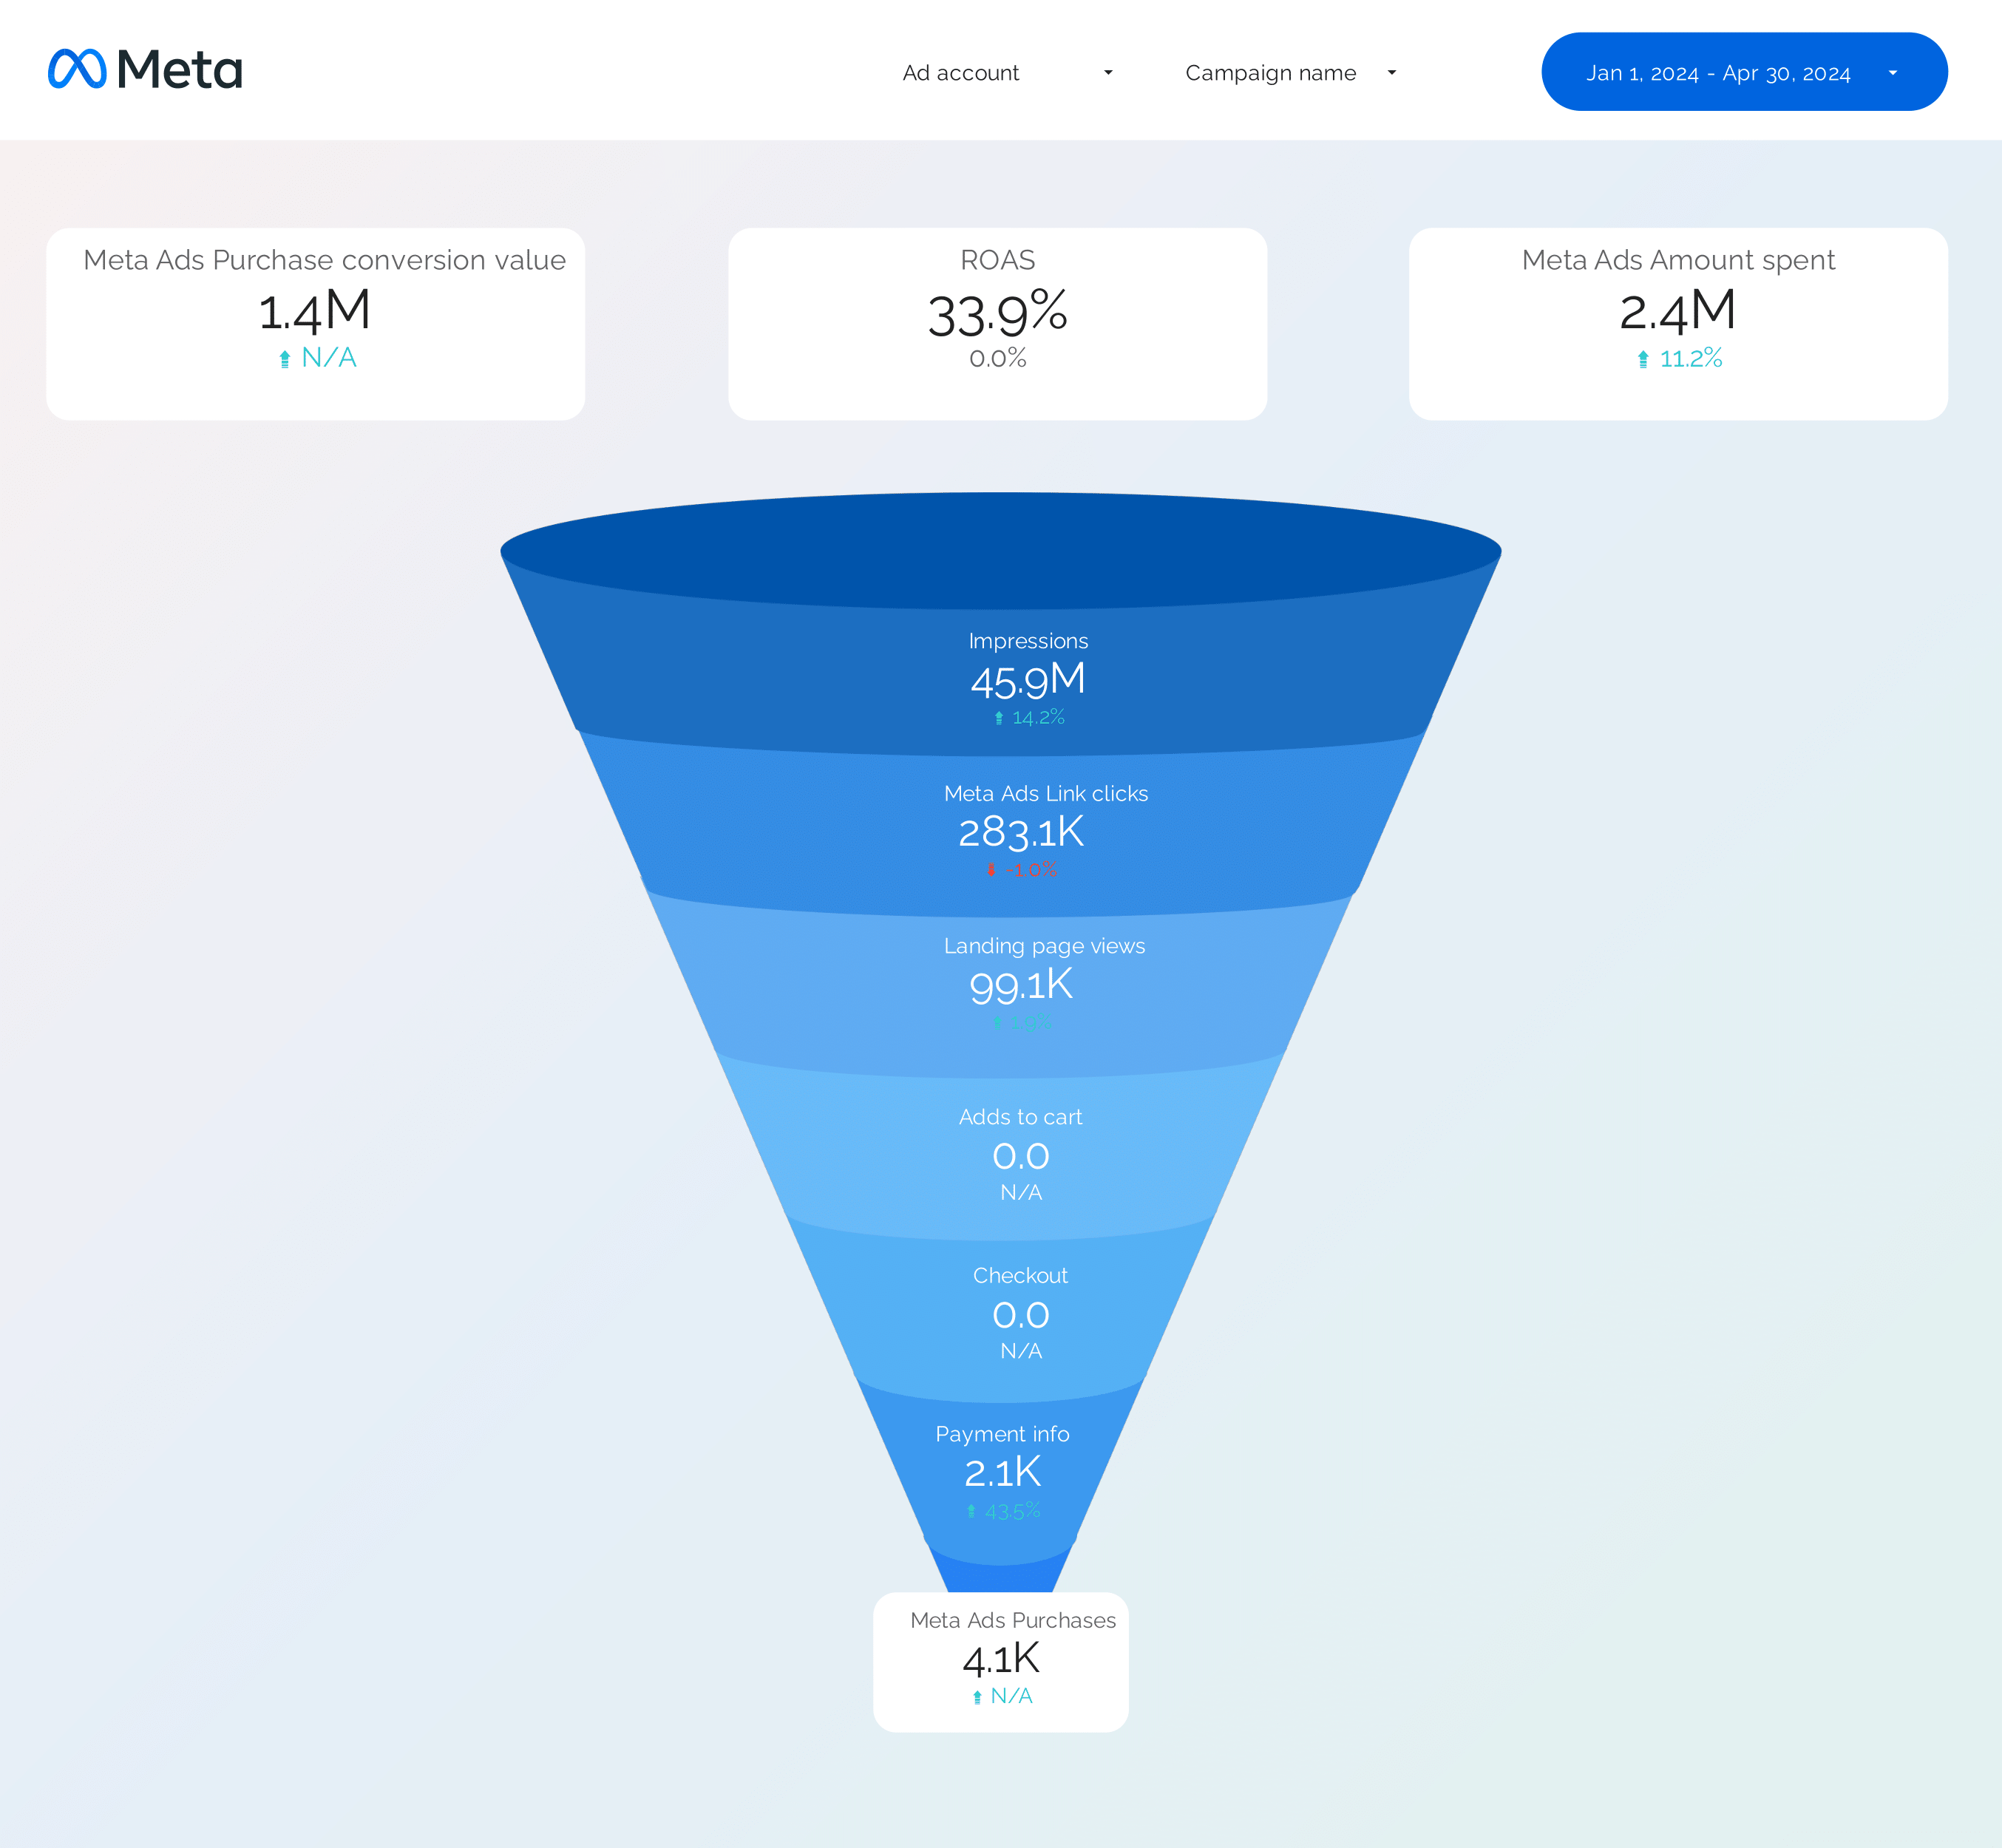
Facebook Ads Funnel Report template for Marketing teams and agencies
Optimize your Facebook Ads Funnel with this report template. Track CTR, conversion rate, CPA, and more. Analyze audience targeting, ad creative, and placement strategy. Segment by demographics and behavior. Ideal for PPC and paid media specialists to enhance campaign performance and achieve marketing objectives. Perfect for understanding reach, impressions, and organic search traffic.
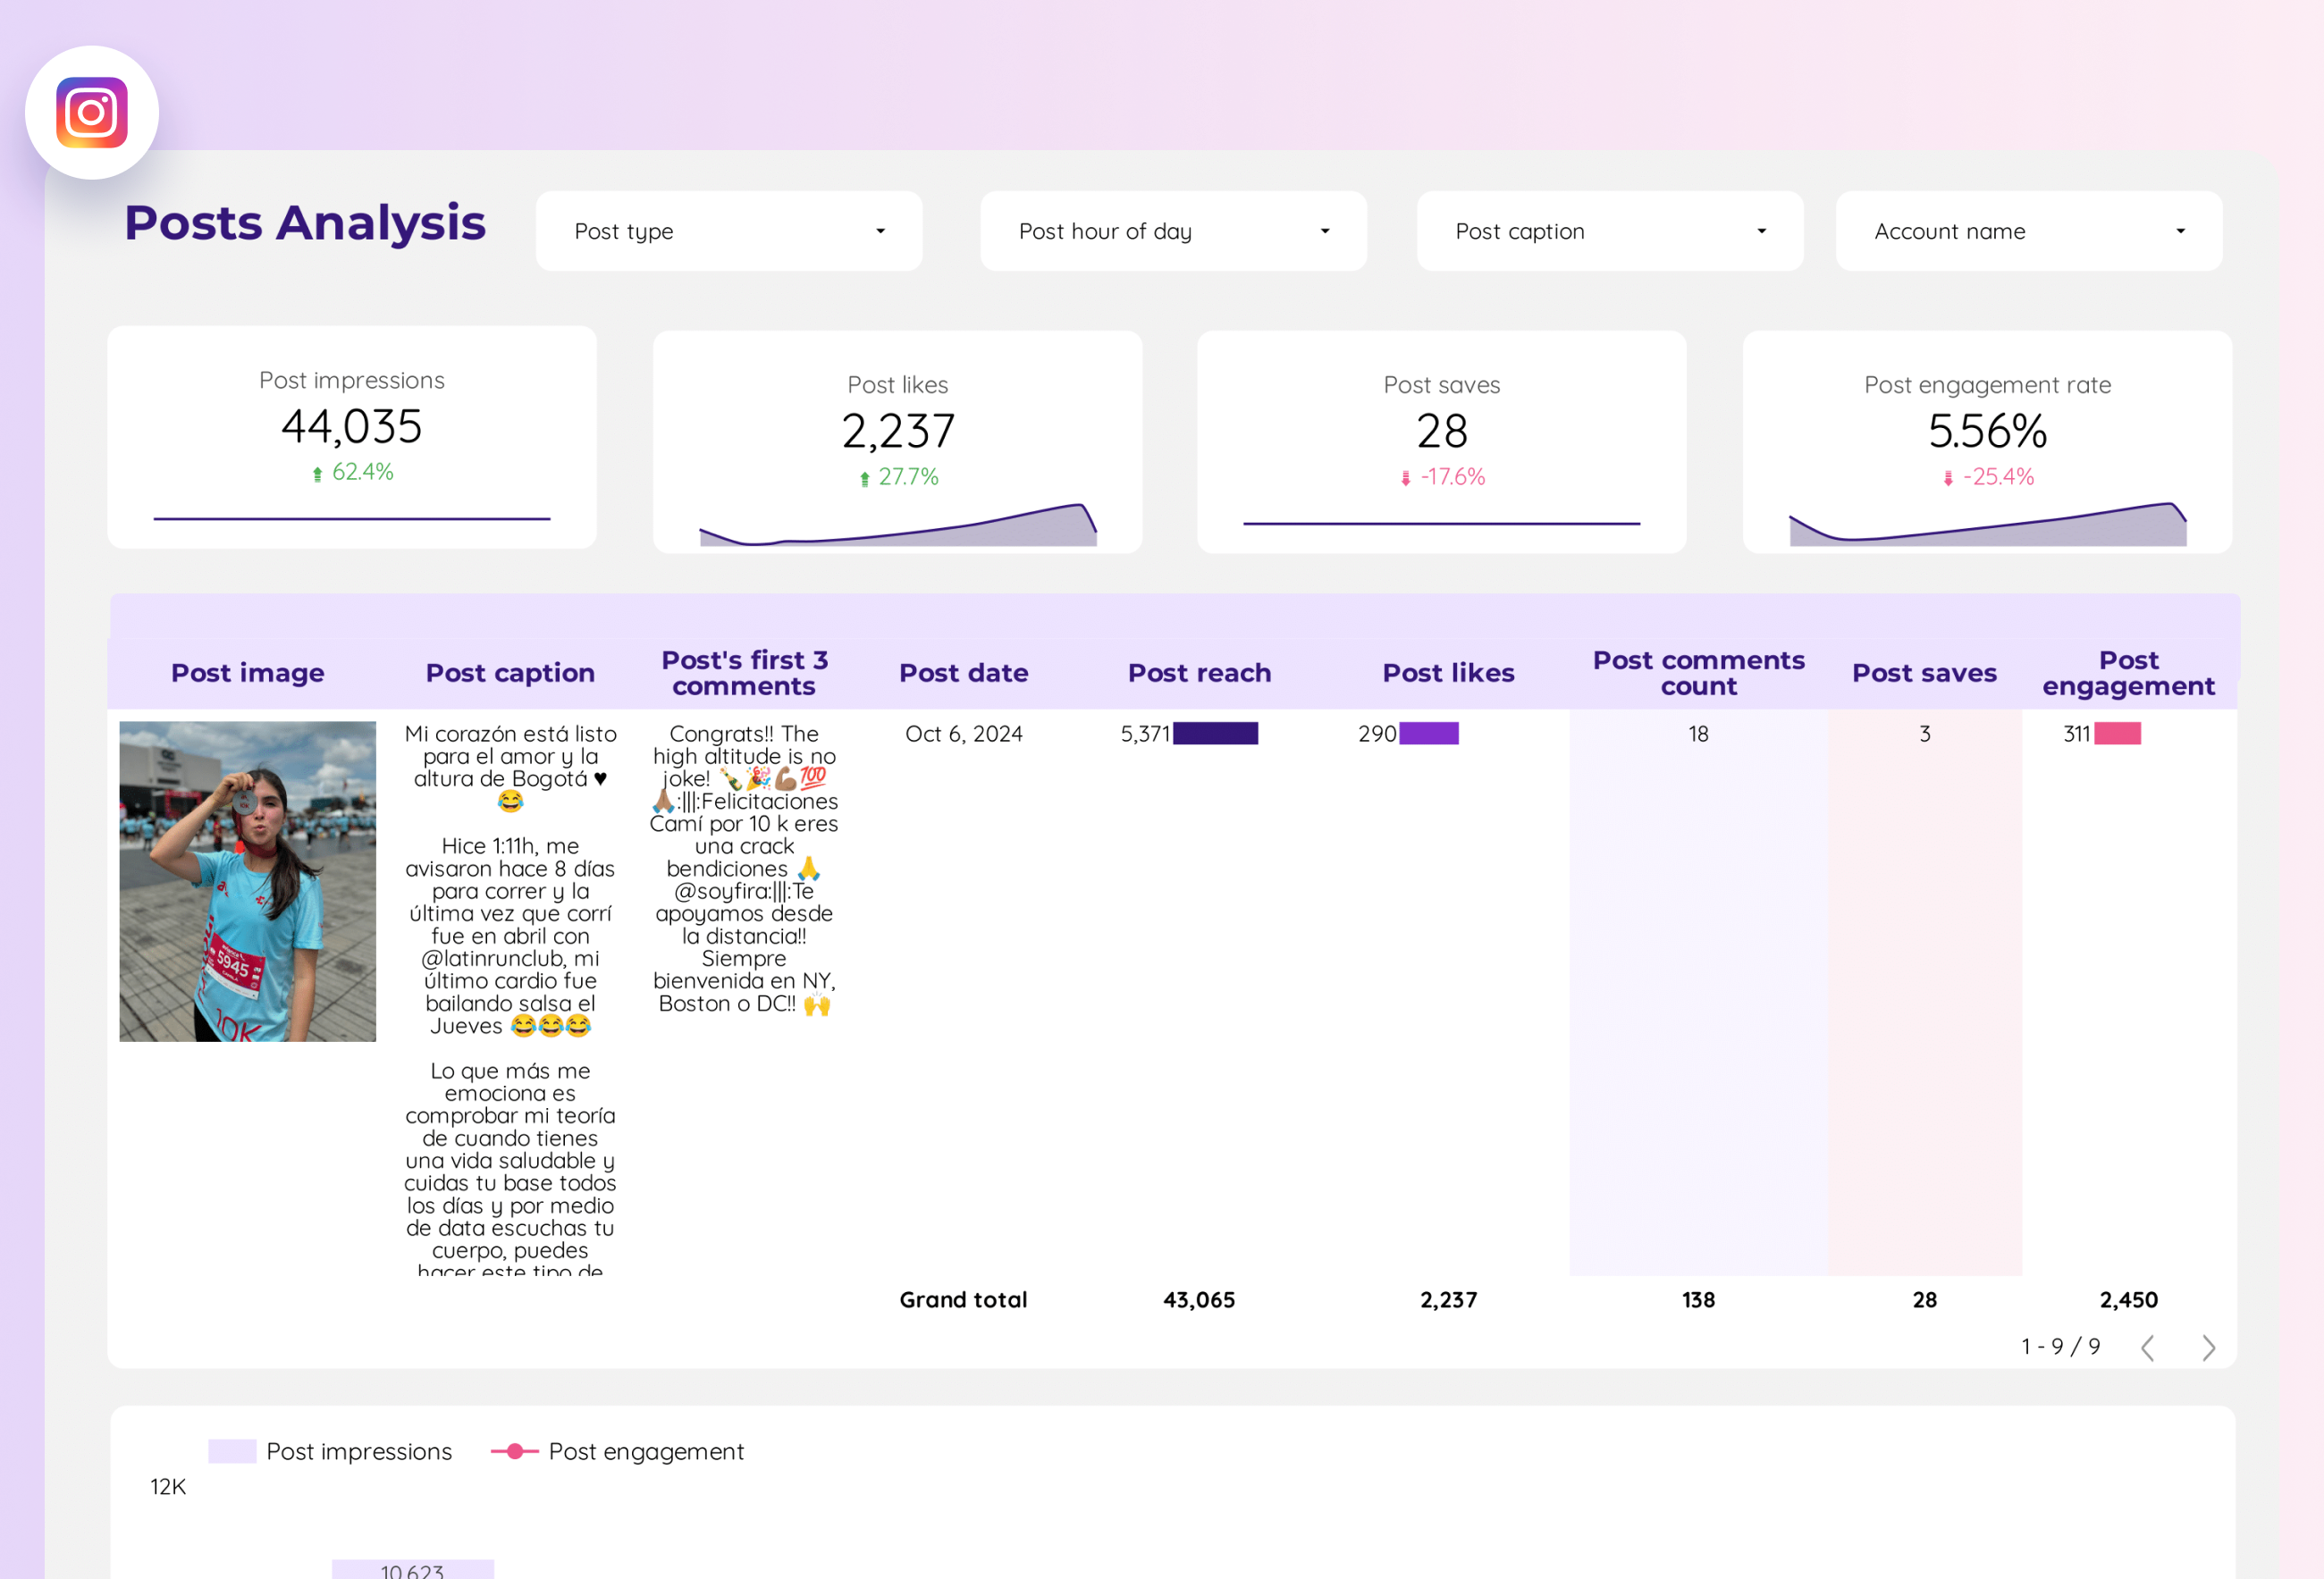
Instagram Insights Report template for Marketing teams and agencies
Analyze key metrics with the Instagram Insights report template. Measure CTR, conversion rate, ROI, likes, comments, shares, impressions, and reach. Segment by age, gender, location, and time. Ideal for social media marketers to consolidate performance data and refine strategies. Gain actionable insights to optimize engagement and ROI.
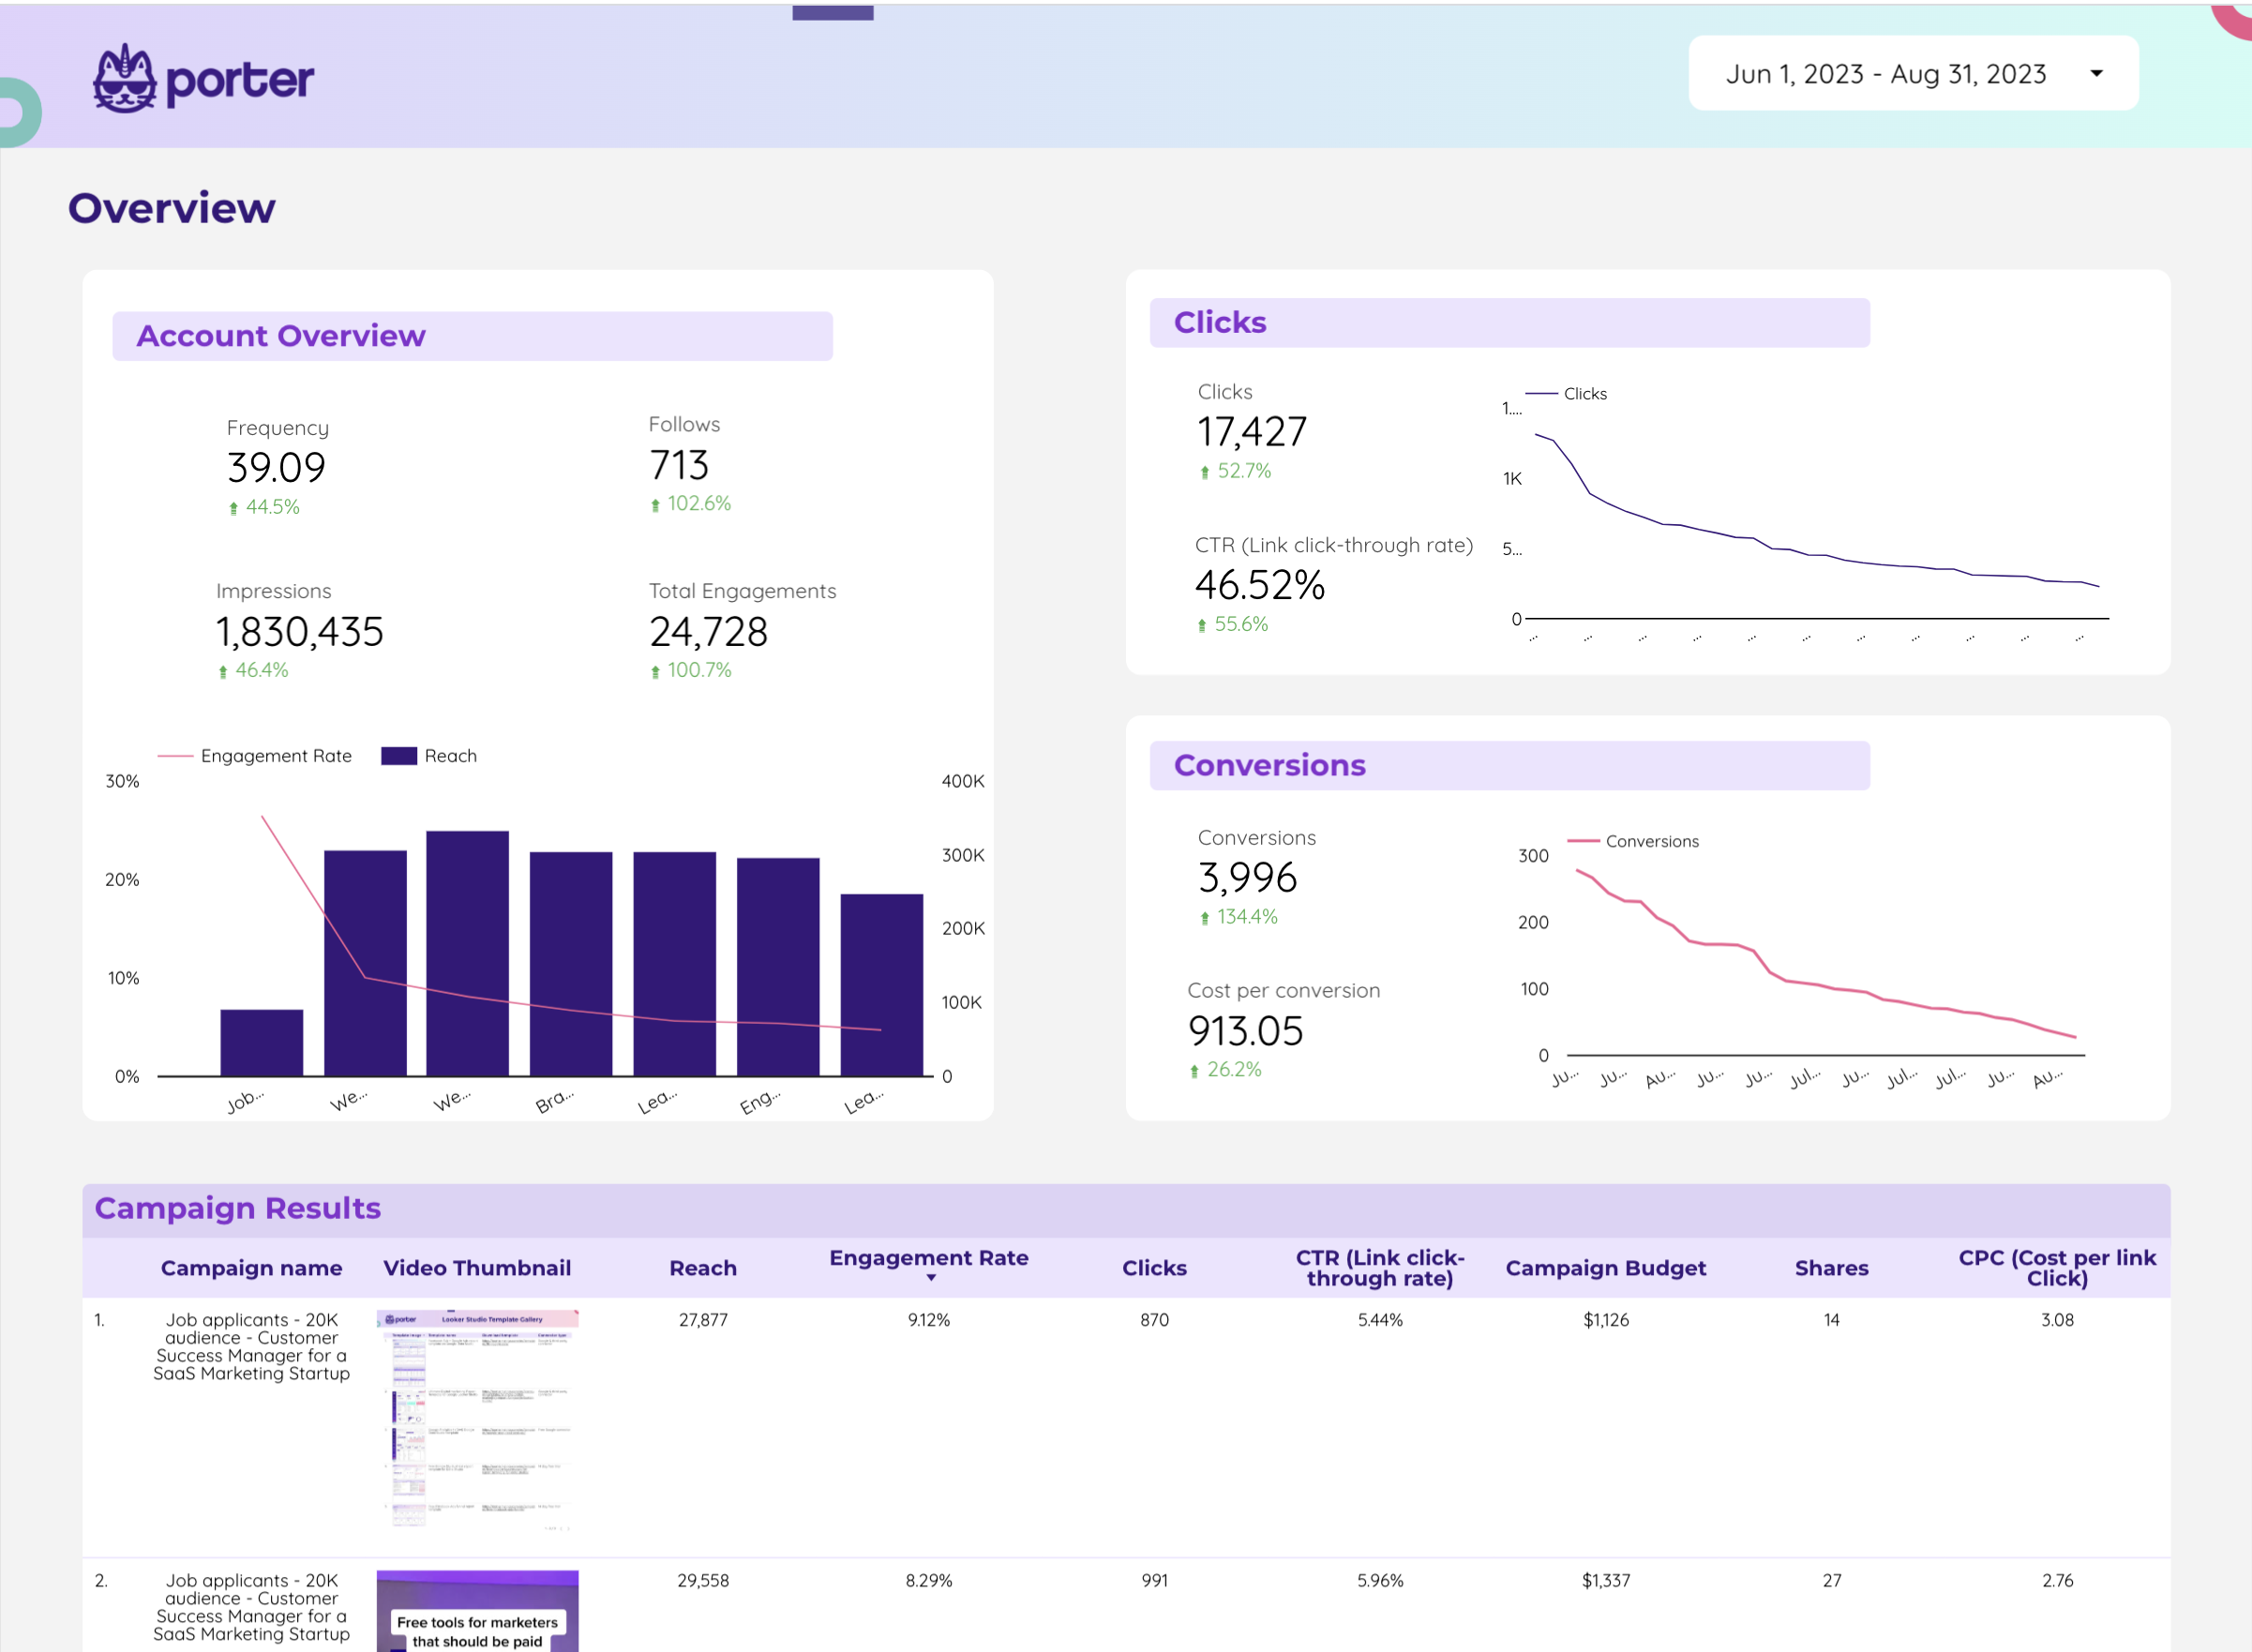
PPC monthly Report template for Marketing teams and agencies
Get the actual PPC monthly on Looker Studio template used by Porter to monitor PPC performance.